Abstract
Multi-pellet formulations are advantageous for the controlled release of drugs over single-unit dosage forms. To understand the diffusion controlled drug release mechanism, the pellet structure and drug release from a single pellet (not at dose level) were studied using synchrotron radiation X-ray computed microtomography (SR-μCT) and a sensitive LC/MS/MS method. The purpose of this article is to introduce a powerful, non-invasive and quantitative technique for studying individual pellet microstructures and to investigate the relationship between the microstructure and drug release from single pellets. The data from the single pellet dissolution measurements demonstrated that the release profile of capsules containing approximately 1,000 pellets per unit dose was the summation of the release profiles of the individual pellets. The release profiles of single tamsulosin hydrochloride (TSH) pellets formed three groups when a cluster analysis was performed, and the dissolution rate of the individual pellets correlated well with the combined effects of the drug loading, volume and surface area of the pellets (R2 = 0.9429). In addition, the void microstructures within the pellet were critical during drug release. Therefore, SR-μCT is a powerful tool for quantitatively elucidating the three-dimensional microstructure of the individual pellets; because the microstructure controls drug release, it is an important parameter in the quality control of multi-pellet formulations.
KEY WORDS: microstructure, release kinetics, single pellet, synchrotron radiation X-ray computed microtomography
INTRODUCTION
Multi-particulate solid dosage formulations contain numerous discrete particles (e.g. pellets and granules) that are combined into hard gelatine capsules or compressed into tablets, forming a single dose unit. Multi-unit dosing forms have gained considerable popularity over conventional single unit products for controlled release technology due to the following advantages: (1) rapid dispersion in the gastrointestinal tract to maximise drug absorption, reduce peak plasma fluctuations and minimise potential side effects without lowering drug bioavailability; (2) reduced susceptibility toward dose dumping than reservoir- or matrix-type single-unit dosage forms; (3) flexibility during the development of oral medicines because pellets containing different drug substances can be blended to formulate a single dose form (1). However, although novel technologies for the production of multiple particulate systems have been designed, thus far the mainstream technologies are still based on spray-drying, spheronization and film-coating technology. Limitation of process variables caused by multiple formulation steps can act as technical hurdles in manufacturing reproducibility. Although some in line analysis techniques, such as infrared spectrometry, have been employed to monitor the preparation process, techniques with higher resolution for structural architecture determination should be introduced (2).
Conventional dissolution testing is routinely performed using methods described in Pharmacopoeias; the dosing form is placed in a suitable buffer, and the results represent the amount of active pharmaceutical ingredient (API) that is released over time. The key components for optimising the formulation and manufacturing processes, as well as the release mechanism, are the dose level of drug and the target release profile of the drug over time. However, this approach toward establishing a release profile does not provide the contributions of a single pellet due to the extremely tedious experiments required and the analytical constraints of quantifying very low levels of a substance. However, this strategy is insufficient because the release kinetics for ensembles is a composite profile of the individual units (3–5). An ensemble of zero-order releasing units will exhibit first-order kinetics under certain conditions (6). The results from single pellet experiments can also be used to simulate the release behaviour on the dose level (7–10); this research will provide new insight into formulation and manufacturing process optimisations.
The rate and mechanism of drug release from solid dosage forms depends strongly on their shape and microstructure (11–15). Lorck et al. found that rough pellets had a higher release rate than smooth pellets after approximately 2 h of release where spherical pellets were classified as smooth, and all other shapes were denoted as rough (11). The internal micro-structure of pharmaceutical tablets can not only influence mechanical strength but also impact the rate at which APIs are released from some types of dosage forms (12). Our previous studies have shown that the interior porous channels and surface structure were simplified when the fractal dimension correlated well with the drug release kinetics of felodipine osmotic pump tablets (13). For microcrystalline cellulose (MCC)–carbopol pellets with a high proportion of carbopol, the size, shape, mechanical properties and release behaviour can be tuned by modulating the CaCl2/carbopol ratio and the drying conditions due to the influence of these variables on the pellet microstructure (14). A good correlation was also reported between the total porosity, mean pore diameter and drug release rate, while the porosity parameter was important when evaluating the in vitro performance of the multi-unit erosion matrix during the controlled release an insoluble drug (15).
Numerous techniques have provided insight into the microstructure of solid dosing forms, such as optical microscopy, scanning electron microscopy (SEM), transmission electron microscopy (TEM) and solid-state NMR (16). However, these techniques cannot provide any details regarding the internal 3D structure or quantitative characterisation. Tomography imaging techniques, such as X-ray computed microtomography (μCT), can provide a deeper understanding and important information regarding the structural characteristics and drug release mechanism of solid dosage forms. Over the last 15 years, μCT has been applied for the in vitro characterisation because it is a powerful, non-invasive investigative technique used to observe the 3D structure of various objects (17).
The sphericity, an important parameter to evaluate the quality of the pellets, is influenced by several formulation and processing factors, such as the content of MCC, the ratio between water and MCC, rotor speed, speronization time and water addition rate (18). As the result of the precipitation and formation of the coating materials on the surface of the pellets; thus, the sphericity plays a role as an indicator for the coating quality and the drug release behaviours. As an indirect parameter, the repose angle is commonly used to evaluate the sphericity of pellets in the pharmaceutical manufacture practice, while the image analysis techniques are employed for the academic research (19). However, the reported image analysis mainly focuses on the 2D morphology. In this study, the synchrotron radiation X-ray computed microtomography (SR-μCT) with high resolution is used to obtain the accurate 3D morphology of single pellets. Due to the availability of the synchrotron radiation light source SR-μCT permits the rapid acquisition of data with high intensity illumination and micro-scale spatial resolution through a high specification detector (20). This technique has been well documented while investigating the morphology and internal structures of granules and solid dosing forms (21–25).
This study involves the SR-μCT interrogation of pellets that contain drugs, and two groups of pellets were identified in tamsulosin hydrochloride sustained release capsules (TSH, Brand name, Harnal); this observation led to further investigations into the relationships between the microstructure parameters and single pellet drug release. Therefore, we report the release behaviour of a single TSH pellet after using a LC/MS/MS quantification analysis method, as well as a SR-μCT method to reveal the microstructure of TSH sustained release pellets. The primary objectives of this work are as follows: (i) visualise the surface morphology and internal 3D structure while investigating the drug release behaviour of the individual pellets; (ii) elucidate the release mechanism of individual pellets and probe relationships between the microstructure and release kinetics; (iii) correlate the release behaviour of single pellets and the pellet ensemble from a single-unit dose capsule.
EXPERIMENTAL
Materials
Tamsulosin hydrochloride sustained release capsules were purchased from Astellas Pharma China Inc. (Shenyang, China). In addition to the active ingredient of tamsulosin hydrochloride, the pellets mainly contained the following inactive excipients: methacrylic acid copolymer, microcrystalline cellulose, triacetin, polysorbate 80, sodium lauryl sulfate, calcium stearate (http://www.accessdata.fda.gov/drugsatfda_docs/label/2005/020579s016lbl.pdf). The mixture of all substance was granulated after the addition of the aqueous liquid material. The pellets can be classified as typical matrix cores pellets, according to the patent (26). PVP/VA (Plasdone® S630) was provided by Shanghai Chineway Pharmaceutical Tech Co., Ltd. (Shanghai, China) and sieved to a particle size below 106 μm. Three differently sized capsule shells were provided by Xinchang Hechang Co., Ltd. (Zhejiang, China).
Synchrotron X-ray Microtomography
To characterise the microstructure of the pellets, SR-μCT tomography was performed with the BL13W1 beam line at SSRF (Shanghai Synchrotron Radiation Facility).
Sample Preparation
When using μCT to characterise a material, the sample size is roughly proportional to the image resolution; in addition, the sample must be entirely contained within the field of view. Due to the maximum height, 10 mg of TSH pellets was used to fill a capsule with 10 mg of PVP/VA. PVP/VA is widely used as an excipient in solid dosing forms and was introduced as a diluent to enable the extraction of data for each pellet for individual characterisation from a sample including many pellets. Due to the stability, small size, good flow ability and X-ray absorption contrast of this diluent, the extraction of data for the individual pellets during image processing was facilitated. Before analysis, the filled capsule was manually rotated horizontally at 30 rotations per minute (rpm) for 30 s to ensure that the pellets and PVP/VA were well mixed. The height of the acquisition window used to cover the pellets in the capsule was adjusted, and the CT scan was carried out.
SR-μCT Scans
The samples were scanned with synchrotron radiation X-rays at 16.0 keV. After penetrating the sample, the projections were magnified using diffraction-limited microscope optics (×2 magnification) and digitised using a high-resolution 2,048 pixel × 2,048 pixel CCD camera (pco.2000, PCO AG, Kelheim, Germany). The pixel size was 3.7 μm, the exposure time was 2.0 s and the sample-to-detector distance was 12 cm. For each acquisition, 720 projections over 180° were collected. Light field images (i.e. X-ray illumination on the beam path without the sample) and dark field images (i.e. X-ray illumination off) were also collected during each acquisition to account for the electronic noise and variations in the brightness of the X-ray source.
3D Reconstruction
The CT scan was a 3D map of the X-ray phase contrast. Further analysis of the data was needed for a quantitative description of the microstructure. The total projected images were reconstructed using software developed by SSRF to perform a direct filtered back-projection algorithm. To enhance the quality of reconstructed slices, X-TRACT SSRF CWS x64 (Version 6.5, Commonwealth Scientific and Industrial Research Organisation, Australia, http://www.ts-imaging.net/Default.aspx) was used to extract the phase contrast. The 3D rendered data were analysed with the commercially available VG Studio Max (Version 2.1, Volume Graphics GmbH, Germany) and Image Pro Analyser 3D software (Version 7.0, Media Cybernetics, Inc., USA) to obtain the qualitative and quantitative data, respectively.
After the 3D reconstruction, the resolved images had a high quality phase contrast; nearly one third of pellets were hollow. Based on the 2D slices, all of the pellets in the scanned sample were individually extracted. Afterward, a 3D model of each pellet was selected from rendered objects, and the regions of interest (ROIs) were resliced to determine the surface morphology. The void in the pellet was extracted using grey value-based segmentation with a self-programmed algorithm; the extracted slices of the inner void and the pellet were merged when characterising the entire pellet; 3D models of both the pellet and the inner void were rendered to calculate the quantitative parameters. The modelling procedures are shown in Fig. 1.
Fig. 1.
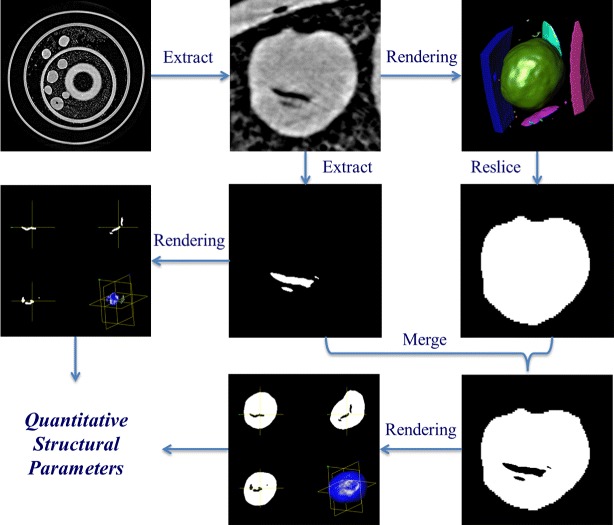
Structural characterisation procedures for the TSH sustained release pellet. The procedure includes four steps: (1) the segmented slice is extracted from the reconstructed slice; (2) the void extraction is performed to derive the slice of the void; (3) the 3D model is acquired by reconstructing a series of slices from the void; (4) the slice and without void are merged together
Identifiable Pellets Preparation
To investigate the release behaviour of the individual pellets with the microstructures discussed above, samples containing the identified pellets were prepared for a SR-μCT scan. Therefore, three differently sized capsules were filled with a specific number of TSH pellets (i.e. seven pellets for the largest size capsule and five pellets for the two smaller sizes); these capsules were closed to form a sample for CT scanning. Figure 2a is a 2D synchrotron X-ray tomographic image showing how the two components of the capsule shells were nested together. Every capsule was identified using a specific code. The pellets in each capsule were easily distinguished by size and shape. The images of the pellets were acquired using a CCD camera (×20 magnification) and analysed by software Image-Pro Plus (Version 7.0, Media Cybernetics, Inc., USA) to verify the differences for every pellet. PVP/VA was introduced and mixed with the pellets; five samples were examined.
Fig. 2.
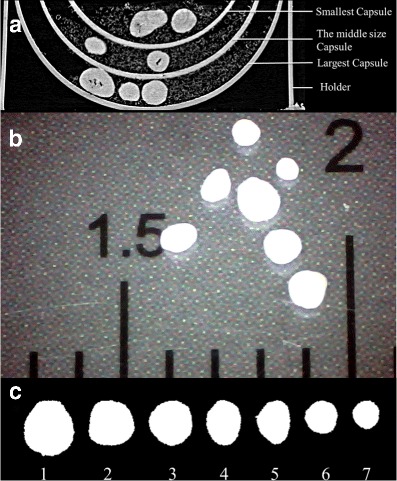
Preparation and identifying of the pellets. a Tomography of the prepared sample (TSH pellets (bright) and PVP/VA (grey)); b original image of the pellets from one typical capsule; c the sorted sequence with corresponding label
Identifying and Matching the Pellets with the Reconstructed 3D Model
The pellets that were manually separated from the PVP/VA were transferred to a black plastic board after the CT scan. Afterward, photos of each pellet were taken using the CCD camera (×20 magnification times); the digital images were analysed using Image Pro Analyser 3D. The pellets on the image were sequenced according to their size and shape (Fig. 2b, c) and each pellet was identified with an ID by comparing the true pellet to the sequenced pellet image. After the CT scan and 3D reconstruction, the reconstructed model and the pellet image were compared again. Consequently, every pellet was successfully matched with the corresponding 2D image and 3D model.
Dissolution Testing and Data Analysis
The dissolution testing included two parts—the original capsule at the unit dose level and single pellets. The dissolution testing with the original capsule was performed using an USP31-NF26 Apparatus II (paddle) at 100 rpm and 37°C in 500 mL of phosphate buffer (pH 6.8) (n = 6). Five millilitre samples were withdrawn at established time intervals (15, 30, 45, 60, 90, 120, 180, 240 and 300 min), and the amount of drug released was determined using LC/MS/MS analysis. After sampling, 5.0 mL of the fresh release media was added to each dissolution vessel. For the single pellets, the dissolution test was performed using a constant temperature oscillator at 100 rpm and 37°C in a 10.0 mL solution and 0.5 mL sample was withdrawn for quantification, as well as the other parameters tested for the single unit dose capsule. Ultrasonic processing was performed for 30 min before the concentration was determined to obtain the total amount of drug in each single pellet (M∞ in Eq. (2)).
The cumulative amount of drug released over time was calculated using Eq. (1):
 |
1 |
where Mt is the cumulative amount of the drug released at time t, C1 is the concentration of drug during the first sample collection, C2 is the concentration of the drug after the second sample was collected, Cn is the concentration of the drug at time t, V1 is the volume of sample withdrawn at different times and V2 is the volume of the dissolution medium.
The cumulative percentage of drug released over time was calculated using Eq. (2):
 |
2 |
where Rt is the cumulative percentage of the drug released at time t and M∞ is the total amount of drug.
LC/MS/MS Analysis
The chromatographic experiments were performed on an Agilent 1260 series HPLC system (Agilent Technologies Inc., China). The separation was carried out at 30°C on a Luna C18 column (150 mm × 4.6 mm, 5 μm, Phenomenex). The mobile phase consisted of methanol–acetonitrile (30:40, v/v) and ammonium formate (10 mmol/L) (58:42, v/v, pH 4.2–4.5) flowing at 0.4 mL/min. The total run time for each sample was 8.0 min.
The mass spectrometric data were collected with a G6460 tandem mass spectrometer (Agilent Technologies Inc., China) equipped with an atmospheric pressure chemical ionisation (APCI) module. Nitrogen was used as the nebuliser gas at 20 psi and the drying gas at 6 L/min and 350°C. The instrument was operated with a 3.5-kV capillary voltage. Multiple reactions monitoring (MRM) was employed during data acquisition. The optimised MRM fragmentation transitions for tamsulosin and the internal standard (IS, diphenhydramine) were m/z 409.0 → 228.1 with a fragment voltage of 135 V and a collision energy (CE) of 20 V and m/z 256.1 → 167.1 with a fragment voltage of 75 V and a CE of 6 V, respectively. The dwell time for each transition was 200 ms. Quadrupoles Q1 and Q3 were set to unit resolution.
The stock standard solution of TSH (0.2 mg/mL) was prepared by dissolving the drug in phosphate buffer (pH 6.8) before storage at 4°C. A standard calibration curve (peak area ratio of TSH/IS vs. known drug concentration) was built using standard solutions (1.00, 2.50, 5.00, 10.00, 25.00 and 50.00 ng/mL) prepared by diluting the stock standard solution with phosphate buffer. The IS (5.16 ng/mL) was prepared by dilution in acetonitrile. For the analyses, 40 μL of each sample was combined with 60 μL of IS solution (diphenhydramine, 5.16 ng/mL). After vortexing (2,500 rpm, 1 min), a 2-μL aliquot of each sample was injected into the HPLC system.
The peak area ratios of the calibration standards were proportional to the concentration of tamsulosin in each assay over the nominal concentration range (1.00–50.00 ng/mL). The calibration curves appeared linear and were well described by least-squares linear regression lines. Compared to the 1/x weighing factor, a weighting factor of 1/x2 achieved the homogeneity of variance and was used accordingly. The correlation coefficient was ≥0.9950. The validated linearity range justified the concentrations observed when analysing the real samples. The lower limit of quantification (LLOQ) of the method was 0.1 ng/mL at a signal-to-noise ratio (S/N) ≥32. The accuracy and precision for tamsulosin were 93.1–106.2 and 4.8%, respectively. The recovery for analyte and the internal standard were obtained by comparing the peak areas at the low, medium and high quality control (LQC, MQC and HQC) concentration levels. The recovery of the analyte at the LQC, MQC and HQC samples was calculated: 99.1 ± 7.0, 103.6 ± 5.3 and 96.8 ± 6.4%, respectively.
RESULTS AND DISCUSSION
Characterisation of the Pellets
Visualisation of Surface Morphology and Internal 3D Structure
Tomographic imaging techniques help improve our understanding of the quality, performance and release mechanisms of pharmaceutical dosage forms. The full 3D image is not recorded directly; instead, it is obtained by reconstructing 2D image cross sections and stacking those reconstructed slices as previously described. The high-resolution 3D images obtained from SR-μCT refer to a model that reproduces the morphology and microstructure of a pellet (Fig. 3a); the 3D rendering model displays fully detailed structural information about every pellet. A hollow pellet and a solid pellet are randomly selected to show the morphological and microstructural information (Fig. 3b). The differences in the shape, size, morphology and internal structure of each pellet were obvious, although it was difficult to distinguish the solid pellets from those with voids using only the apparent morphology. The internal void could not be detected without the CT technology.
Fig. 3.
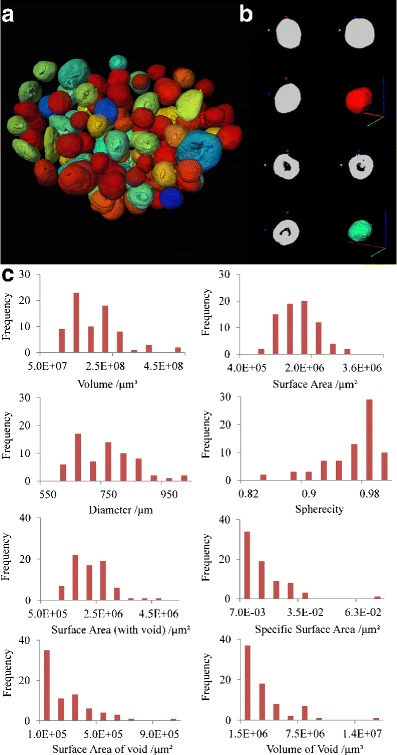
Characterisation of the pellets. a The reconstructed 3D model of pellets imaged using SR-μCT showed the sphericity with the blue to red regions demonstrating incrementally higher sphericity; b a typical solid pellet and one with a void; c the frequency distribution for different parameters of the pellets
3D Parameter Calculations
The traditional measurement methods for the specific surface area of powdered materials are the gas adsorption method (27,28) and the ethylene glycol monoethyl ether (29) method. SR-μCT provides three-dimensional topographic images on the sub-micrometre scale. Therefore, pellet properties, such as the diameter, the surface roughness and the internal void, can be extracted from these images, clearly visualised and used to calculate the volume and specific surface area for each pellet.
The ability to visualise the microstructures of the individual pellet from the results of the CT scans and 3D reconstructions is valuable when investigating the drug release mechanism. The 3D reconstruction and structural parameters calculated are not available from conventional methods and are efficient tools to quantify the microstructure parameters. When attempting to describe the pellets, approximately 40 steric quantitative parameters can be obtained from the reconstructed model. The most important ten parameters that are closely related to the release profile have been selected and are listed in Table I. The diameter is the diameter of a ball with an equivalent volume. The void fraction is the volume of the void divided by that of the pellet.
Table I.
The Names, Descriptions and Units of the 3D Parameters
| 3D parameters | Description | Units |
|---|---|---|
| Volume | Volume of the whole pellet | μm3 |
| Surface area | Surface area of whole pellet | μm2 |
| Diameter | Equivalent diameter of whole pellet | μm |
| Sphericity | A measure of how spherical an object is | Dimensionless |
| Volume of void | Volume of the void | μm3 |
| Surface area of void | Surface area of the void | μm2 |
| Void fraction | The volume of voids over the total volume | % |
| Specific surface area | The surface area per unit volume | μm−1 |
| Surface area without void | Surface area of the pellet without void | μm2 |
| Drug content in unit volume | The amount of drug in unit volume | ng/μm3 |
The frequency of the pellets is the number of times that the pellets occurred in the particle system. Based on the data above, the pellets were different in size and shape from one another within the approximately 1,000 pellets in each TSH sustained release capsule. The particle system was described using a frequency distribution (Fig. 3c). Figure 3c shows that the size (volume, surface area and diameter) distributions have a wide range and do not exhibit Gaussian distributions. In addition, most pellets have a value close to 1 for sphericity, while some pellets are still irregular. The specific surface area of most pellets is between 0.007 and 0.035 μm−1. Approximately 50% of the pellets are solid, and the other half have voids with variable volumes and surface area distributions.
In Fig. 4a, b, the blue domains represent the pellets with small surface areas, and red domains represent large surface areas. The smaller pellets (with respect to surface area and volume) were more spherical. A few pellets were flatter due to the pressure effects during the pellet formation and coating processes. The deviations in size decreased when the particles were more spherical. However, no close correlation was observed between the void and the other parameters. The void fraction distribution and the diameter showed a random tendency without a significant co-relationship (Fig. 4b).
Fig. 4.
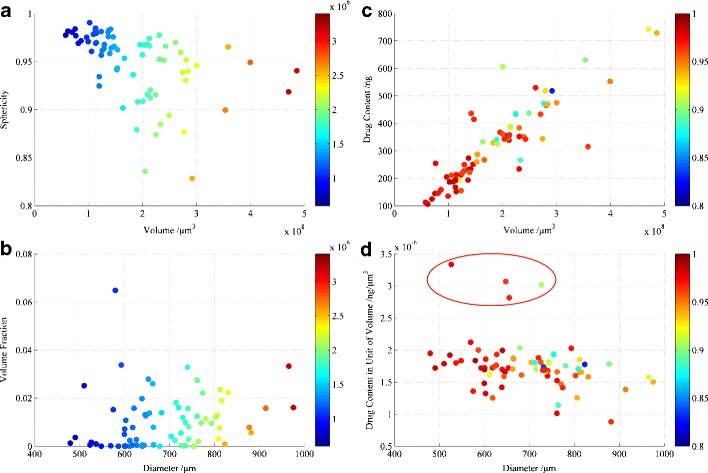
Correlation between the a pellet volume and sphericity, as well as the b diameter and void fraction. The colour legend (bar on the right) refers to the surface area (μm2) of the pellets. Correlation between the c volume and drug loading, as well as the d diameter and concentration of the drug in the matrix. The colour legend (bar on the right) indicates the sphericity (yellow to red illustrates an increase, while green to dark blue corresponds to a decrease)
In summary, based on the SR-μCT technique, detailed information regarding the surface morphology, internal 3D structure and quantitative pore characteristics of the pellets were clearly visualised from the 2D monochrome X-ray CT images and reconstructed 3D tomography images.
Single Pellet Release Kinetics
The total amount of drug in each single pellet was determined as mentioned above and additional data analyses were performed (Fig. 4c, d) to understand the drug release behaviour. The drug loading of the individual pellets was distributed across a wide range and correlated somewhat (R2 = 0.7790) to the pellet volume, as shown in Fig. 4c. In Fig. 4d, the points on the scatter plot spread further as the diameter increases, indicating that the drug loading on the small pellets with high sphericity shows a higher homogeneity. Furthermore, the drug concentration in the pellet matrix (content in unit of volume) of most pellets was approximately 1 to 2 ng/μm3. This figure is far lower than the saturated solubility of TSH; this feature is important for understanding the drug release mechanism. However, several outliers are apparent in the plot showing the differences in the drug concentration in the pellet matrices because the manufacturing process is unable to remain perfectly heterogeneous. The drug concentration decreased slightly as the pellet diameter increased.
A 3D map of the drug release profiles from 74 single pellets is shown in Fig. 5. The IDs of the pellets were rearranged as the drug loading increased to facilitate visualisation in the graphical displays. The blue domains correspond to lower amounts of drug release, and the red domains correspond to higher amount of drug release. The drug loading of individual pellets was distributed from less than 100 to 700 ng. The amount of drug released from each pellet at various test points changed as the colour changed in Fig. 5b. The regularity of drug loading and release behaviour as the colour changed gradually existed because the pellets were rearranged according to the drug loading. Figure 5e, f shows the threshold of drug release. The rate gradually decreased during the release process. The number of pellets with the total drug content released at specific points was (cumulative release percent ≥85%) was 1, 1, 10, 37, 22, 3 at 60, 90, 120, 180, 240 and 300 min, respectively. Therefore, after 240 min, almost all of pellets had completed their release. The release distribution at each point appears similar.
Fig. 5.
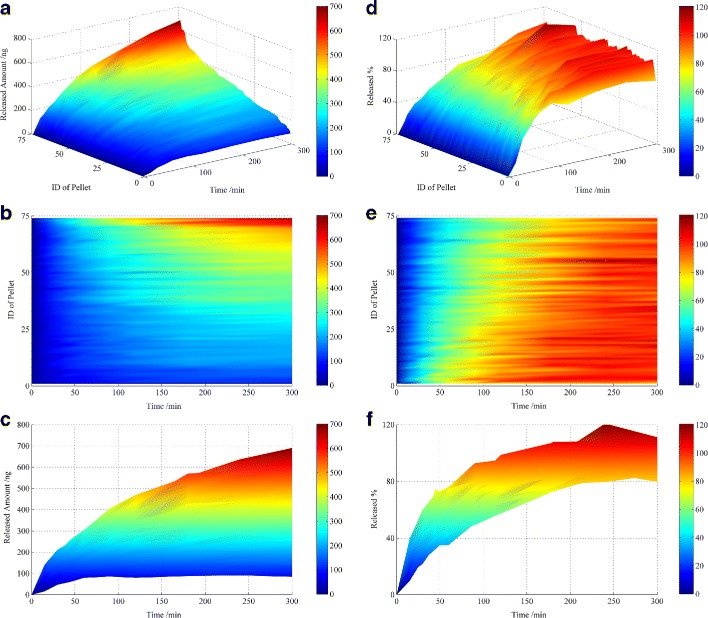
Single pellet release profile for released amount (a–c) and released percent (d–f); 3D surface plot (a, d), top view (b, e) and front view (c, f). The colour legend (bar on the right) refers to the amount of drug released (ng) in a–c and the cumulative release percentages (%) in d–f
Correlation Between Structural Parameters and Drug Release
The rate and mechanism of the drug released from the pellets depends on their microstructure. The correlation between these parameters and the drug release was investigated further.
Correlation and Release Mechanism Analysis
The nine subplots in Fig. 6 show the correlations between the surface area and the cumulative amount of drug released at each sampling point. The 74 data points in each subplot correspond to the 74 pellets. As shown in Fig. 6, the cumulative amount released correlated well with pellet surface area, with particularly strong linear correlations observed from 45 to 120 min.
Fig. 6.
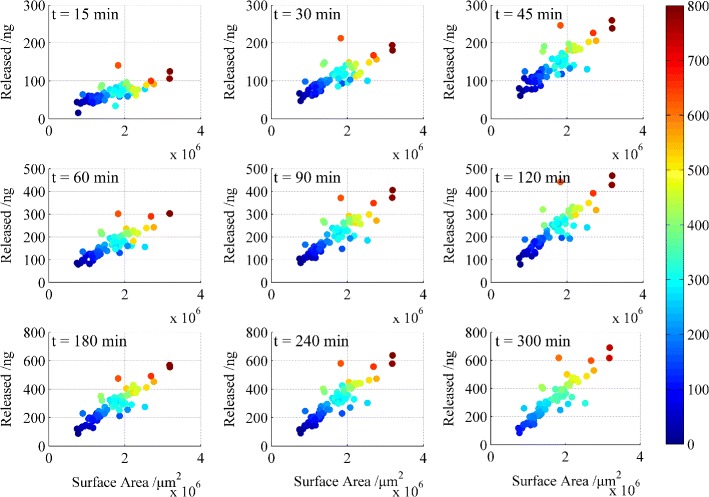
Correlation between the surface area and cumulative amount released at different times. The colour legend (bar on the right) refers to the drug loading of the pellets (ng)
The above analysis shows that the surface area of the pellet represents a key steric parameter that determines the drug release profile. The drug release kinetics may also be controlled by the diffusion of drug from the pellet. The pellets tested in this study contain primarily MCC as their core (26). MCC is insoluble in water but does swell. The Van der Waals interaction should be the main inter-particle bonding mechanism, and the sustained release of the drug is attributed to the insolubility of MCC in water (30). The drug release mechanism of the MCC-based pellets can be classified as from an inert matrix (31). MCC has a porous structure. From our observations, we noted that the drug-containing pellets maintained their original shape during the drug release tests; swelling or disintegration was not observed.
The drug release patterns of single pellets from MCC matrices can be expressed as the well-known relationship reported by T. Higuchi in 1963 and reduced to Eq. (3) (32).
 |
3 |
where Q is the amount of drug released per unit of surface area for the matrix (mg/cm2), A is the concentration of that component in the matrix (mg/cm3), D is the diffusion coefficient (cm2/min), τ is the tortuosity factor, Cs is the concentration of a saturated solution of the drug or solubility (mg/cm3), t is time (h) and K is the specific volume of each soluble component (cm3/mg).
The release rate is controlled by the drug concentration, the dissolution speed and how fast the dissolved drug diffuses throughout the matrix. The largest value of M∞/V is 3.5 μg/mm3; this value is considerably lower than the solubility of TSH. Therefore, if TSH dissolves fast during the first and middle periods of release, the drug concentration in the pellet is constant and equal to M∞/V. Because the matrix of the pellet formed by MCC remained throughout release, the surface area of the pellets barely changed, allowing τ and the surface area to remain constant. For specific cases in this research where the D, K, Cs and τ are constant, this equation can be reduced to form Eq. (4):
 |
4 |
where ω is the slope of the square root of the time relationships and Q can be rewritten as dM/S; A can be rewritten as M/V, allowing Eq. (4) to be rewritten as Eq. (5):
 |
5 |
where M is the drug loading of the pellet, and V and S are the volume and surface area of the pellet, respectively. According to Eq. (5), the cumulative amount of drug released is a linear function of the square root of time.
Therefore, the level of correlation between M × (S/V) and drug release kinetics was investigated in this study. The results are shown in Fig. 7a and confirm a high level of correlation.
Fig. 7.
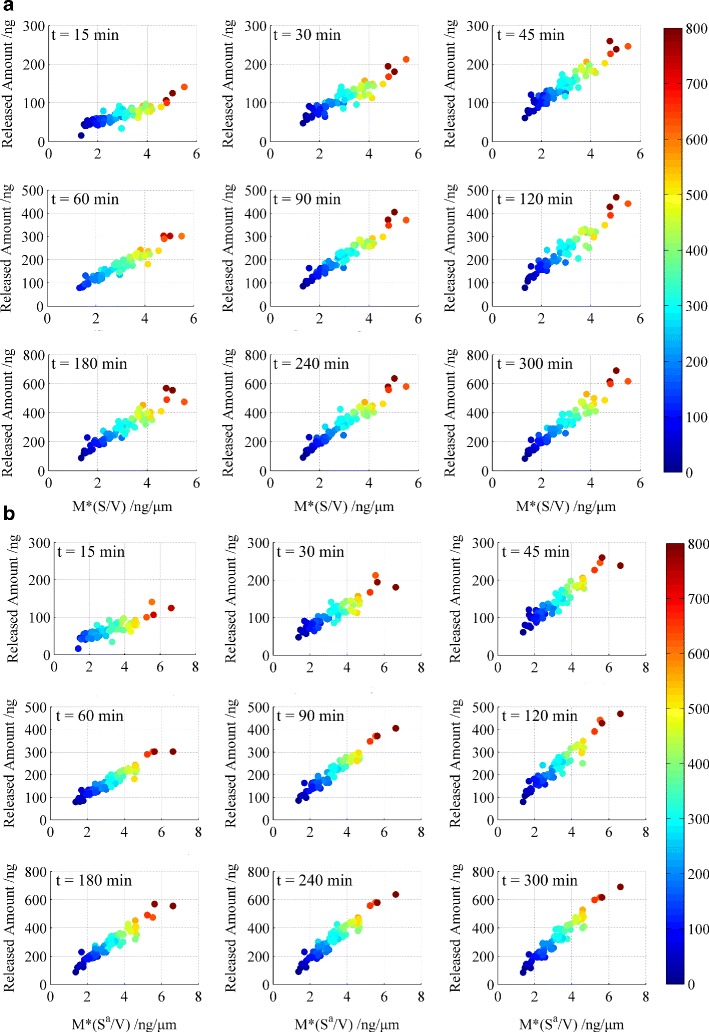
Correlation between the newly defined parameters (M × (S/V)) (a) and (M × (S a/V)) (b) cumulative release amount. The colour legend (bar on the right) refers to the drug loading of the pellets (ng)
At the very beginning of dissolution, only the outer surface is infiltrated with dissolution medium. And after the pellet was well hydrated, the voids are also filled with dissolution medium and the surface area of internal void will also affect the dissolution and speed up the diffusion process. Then surface area, an important steric parameter for the release profile, has been adjusted to Sa (Sa = surface area of pellet + surface area of void). The adjusted parameter (M × (Sa/V)) produced an improved correlation with higher R2 values, as shown in Table II and Fig. 7b, demonstrating that the voids play a profound role during drug release.
Table II.
Correlation Between the Newly Defined Parameters and the Cumulative Amount Released at Different Time Points
| Time (min) | M × (S/V) | M × (S a/V) | ||
|---|---|---|---|---|
| Equation | R 2 | Equation | R 2 | |
| 15 | y = 18.66x + 14.68 | 0.7620 | y = 15.57x + 19.02 | 0.7290 |
| 30 | y = 31.22x + 19.71 | 0.8414 | y = 26.69x + 24.97 | 0.8448 |
| 45 | y = 42.32x + 21.23 | 0.8944 | y = 36.26x + 28.12 | 0.9019 |
| 60 | y = 53.54x + 14.27 | 0.9172 | y = 45.80x + 23.24 | 0.9216 |
| 90 | y = 63.63x + 7.26 | 0.9306 | y = 59.73x + 18.39 | 0.9406 |
| 120 | y = 79.70x + 6.67 | 0.8964 | y = 68.87x + 17.85 | 0.9193 |
| 180 | y = 101.7x − 9.833 | 0.8912 | y = 88.11x + 3.783 | 0.9183 |
| 240 | y = 120.8x − 35.70 | 0.9184 | y = 103.9x − 17.33 | 0.9337 |
| 300 | y = 131.7x − 57.38 | 0.9204 | y = 113.7x − 38.71 | 0.9429 |
Cluster Analysis of Release Behaviour
During an attempt to categorise the differences in drug release behaviour, a cluster analysis of the pellet release data was calculated using the k-means method (33) to force a three-group solution. Compared to the release profile of the unit dose capsules, the pellets were identified as quick (n = 12), slow (n = 24) and similar (n = 38). The centre of cluster 1 shows similarities with the compositional release curve of all 74 tested pellets and the entire capsule at the dose level, as shown in Fig. 8a.
Fig. 8.
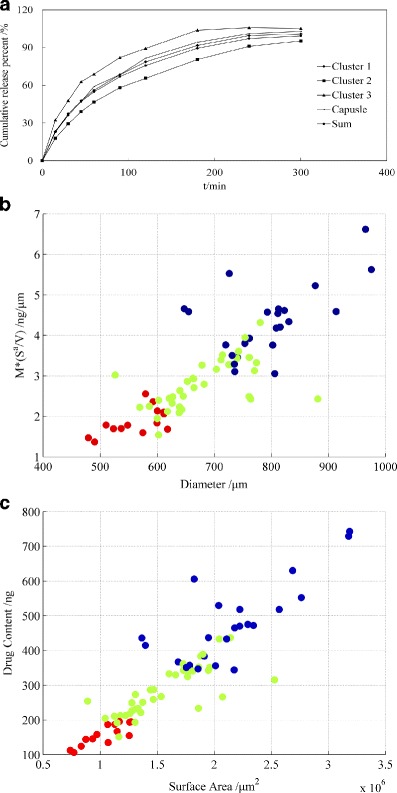
Cluster analysis of release behaviour. a Dissolution profile after clustering: the compositional release curve for all 74 individually tested pellets and the dissolution of the unit dose capsule; correlation between the diameter and M × (S a/V) (b), surface area and drug loading (c) (green, cluster 1; blue, cluster 2; red, cluster 3)
The key structural parameters discussed above for the three groups are also clearly distinguished. In Fig. 8b, three colours (green, blue and red) represent clusters 1, 2 and 3, respectively. The three colours of the individual data points on the scatter plot (Fig. 8b) varied, demonstrating that the cluster result links strongly with the key structural parameters, such as diameter, surface area and drug loading.
CONCLUSIONS
This research has provided important knowledge regarding the investigation of drug delivery systems, specifically the visualization and quantification of the apparent morphology and internal microstructure of the individual pharmaceutical pellets using SR-μCT imaging technology. Structure investigation could be performed when the manufacture technique has been set up before scale up to see whether some structural parameters affecting the dissolution. It is of significance to optimize the processing parameters and to predict the effect of the pellet design parameters, e.g. shape, size and composition of pellets, on the resulting manufacturing process and drug release rate, thus to develop pellets products with a quality by design. The proposed LC/MS/MS method yielded high quality single-pellet drug release data, even though the drug content of some pellets was as low as 100 ng. Experimental evidence has confirmed that the structure parameters that determine drug release are surface area, volume and internal porosity. Further investigations using the methodologies developed in this work can provide additional insight into the impact of other material and physicochemical properties on drug dissolution from solid dosing forms. Consequently, these analyses will provide knowledge and understanding of release mechanisms, thereby enabling the rational design, formulation and manufacture of solid dosing medicines with specific and controlled drug release profiles.
ACKNOWLEDGMENTS
We are grateful for the financial support from the Natural Science Foundation of China (81273453) and the support of the State Key Laboratory of Long-acting and Targeting Drug Delivery System.
Footnotes
Shuo Yang, Xianzhen Yin and Caifen Wang contributed equally to this work.
Contributor Information
Jiasheng Li, Phone: +86-755-86152980, Email: lijiasheng@wanhe-phar.com.
Peter York, Email: P.York@Bradford.ac.uk.
Jun He, Phone: +86-851-8298126, Email: hejun1016@163.com.
Jiwen Zhang, Phone: +86-21-50805901, Email: jwzhang@mail.shcnc.ac.cn.
REFERENCES
- 1.Ghebre-Sellassie I. Pharmaceutical pelletization technology. New York: M. Dekker; 1989. [Google Scholar]
- 2.Roy P, Shahiwala A. Multiparticulate formulation approach to pulsatile drug delivery: current perspectives. J Control Release. 2009;134(2):74–80. doi: 10.1016/j.jconrel.2008.11.011. [DOI] [PubMed] [Google Scholar]
- 3.Hoffman A, Donbrow M, Benita S. Direct measurements on individual microcapsule dissolution as a tool for determination of release mechanism. J Pharm Pharmacol. 1986;38(10):764–766. doi: 10.1111/j.2042-7158.1986.tb04487.x. [DOI] [PubMed] [Google Scholar]
- 4.Hoffman A, Donbrow M, Gross ST, Benita S, Bahat R. Fundamentals of release mechanism interpretation in multiparticulate systems—determination of substrate release from single microcapsules and relation between individual and ensemble release kinetics. Int J Pharm. 1986;29(2–3):195–211. doi: 10.1016/0378-5173(86)90117-1. [DOI] [Google Scholar]
- 5.Benita S, Babay D, Hoffman A, Donbrow M. Relation between individual and ensemble release kinetics of indomethacin from microspheres. Pharm Res. 1988;5(3):178–182. doi: 10.1023/A:1015917023949. [DOI] [PubMed] [Google Scholar]
- 6.Gross ST, Hoffman A, Donbrow M, Benita S. Fundamentals of release mechanism interpretation in multiparticulate systems—the prediction of the commonly observed release equations from statistical population-models for particle ensembles. Int J Pharm. 1986;29(2–3):213–222. doi: 10.1016/0378-5173(86)90118-3. [DOI] [Google Scholar]
- 7.Borgquist P, Zackrisson G, Nilsson B, Axelsson A. Simulation and parametric study of a film-coated controlled-release pharmaceutical. J Control Release. 2002;80(1–3):229–245. doi: 10.1016/S0168-3659(02)00033-0. [DOI] [PubMed] [Google Scholar]
- 8.Borgquist P, Nevsten P, Nilsson B, Wallenberg LR, Axelsson A. Simulation of the release from a multiparticulate system validated by single pellet and dose release experiments. J Control Release. 2004;97(3):453–465. doi: 10.1016/j.jconrel.2004.03.024. [DOI] [PubMed] [Google Scholar]
- 9.Sirotti C, Colombo I, Grassi M. Modelling of drug-release from poly-disperse microencapsulated spherical particles. J Microencapsul. 2002;19(5):603–614. doi: 10.1080/02652040210141075. [DOI] [PubMed] [Google Scholar]
- 10.Sirotti C, Coceani N, Colombo I, Lapasin R, Grassi M. Modeling of drug release from microemulsions: a peculiar case. J Membr Sci. 2002;204(1–2):401–412. doi: 10.1016/S0376-7388(02)00069-8. [DOI] [Google Scholar]
- 11.Lorck CA, Grunenberg PC, Junger H, Laicher A. Influence of process parameters on sustained-release theophylline pellets coated with aqueous polymer dispersions and organic solvent-based polymer solutions. Eur J Pharm Biopharm. 1997;43(2):149–157. doi: 10.1016/S0939-6411(96)00035-5. [DOI] [Google Scholar]
- 12.Gane PAC, Ridgway CJ, Barcelo E. Analysis of pore structure enables improved tablet delivery systems. Powder Technol. 2006;169(2):77–83. doi: 10.1016/j.powtec.2006.07.018. [DOI] [Google Scholar]
- 13.Yin X, Li H, Guo Z, Wu L, Chen F, Matas M, et al. Quantification of swelling and erosion in the controlled release of a poorly water-soluble drug using synchrotron X-ray computed microtomography. AAPS J. 2013;15(4):1025–1034. doi: 10.1208/s12248-013-9498-y. [DOI] [PMC free article] [PubMed] [Google Scholar]
- 14.Gomez-Carracedo A, Souto C, Martinez-Pacheco R, Concheiro A, Gomez-Amoza JL. Microstructural and drug release properties of oven-dried and of slowly or fast frozen freeze-dried MCC–carbopol pellets. Eur J Pharm Biopharm. 2007;67(1):236–245. doi: 10.1016/j.ejpb.2007.01.006. [DOI] [PubMed] [Google Scholar]
- 15.Mehta KA, Kislalioglu MS, Phuapradit W, Malick AW, Shah NH. Effect of formulation and process variables on porosity parameters and release rates from a multi unit erosion matrix of a poorly soluble drug. J Control Release. 2000;63(1–2):201–211. doi: 10.1016/S0168-3659(99)00193-5. [DOI] [PubMed] [Google Scholar]
- 16.Bugay DE. Characterization of the solid-state: spectroscopic techniques. Adv Drug Deliv Rev. 2001;48(1):43–65. doi: 10.1016/S0169-409X(01)00101-6. [DOI] [PubMed] [Google Scholar]
- 17.Zeitler JA, Gladden LF. In-vitro tomography and non-destructive imaging at depth of pharmaceutical solid dosage forms. Eur J Pharm Biopharm. 2009;71(1):2–22. doi: 10.1016/j.ejpb.2008.08.012. [DOI] [PubMed] [Google Scholar]
- 18.Vertommen J, Rombaut P, Kinget R. Shape and surface smoothness of pellets made in a rotary processor. Int J Pharm. 1997;146(1):21–29. doi: 10.1016/S0378-5173(96)04754-0. [DOI] [Google Scholar]
- 19.Almeida-Prieto S, Blanco-Mendez J, Otero-Espinar FJ. Microscopic image analysis techniques for the morphological characterization of pharmaceutical particles: influence of the software, and the factor algorithms used in the shape factor estimation. Eur J Pharm Biopharm. 2007;67(3):766–776. doi: 10.1016/j.ejpb.2007.04.001. [DOI] [PubMed] [Google Scholar]
- 20.Donath T. Quantitative X-ray microtomography with synchrotron radiation. GKSS-Forschungszentrum Geesthacht, Bibliothek. 2007;17:1–211.
- 21.Yin X, Li H, Liu R, Chen J, Ji J, Chen J, et al. Fractal structure determines controlled release kinetics of monolithic osmotic pump tablets. J Pharm Pharmacol. 2013;65(7):953–959. doi: 10.1111/jphp.12056. [DOI] [PubMed] [Google Scholar]
- 22.Pivette P, Faivre V, Mancini L, Gueutin C, Daste G, Ollivon M, et al. Controlled release of a highly hydrophilic API from lipid microspheres obtained by prilling: analysis of drug and water diffusion processes with X-ray-based methods. J Control Release. 2012;158(3):393–402. doi: 10.1016/j.jconrel.2011.11.027. [DOI] [PubMed] [Google Scholar]
- 23.Podczeck F, Newton M, James MB. The assessment of particle friction of a drug substance and a drug carrier substance. J Mater Sci. 1995;30(23):6083–6089. doi: 10.1007/BF01151531. [DOI] [Google Scholar]
- 24.Yang MS, Thompson M, Duncanhewitt WC. Interfacial properties and the response of the thickness-shear-mode acoustic-wave sensor in liquids. Langmuir ACS J Surf Colloids. 1993;9(3):802–811. doi: 10.1021/la00027a033. [DOI] [Google Scholar]
- 25.Chopra R, Podczeck F, Newton JM, Alderborn G. The influence of film coating on the surface roughness and specific surface area of pellets. Part Part Syst Char. 2002;19(4):277–283. doi: 10.1002/1521-4117(200208)19:4<277::AID-PPSC277>3.0.CO;2-X. [DOI] [Google Scholar]
- 26.Muneo F, Kouji T, Shigeru M. Controlled release pharmaceutical formulations. E.P. Patent 1993.
- 27.Brunauer S, Emmett PH, Teller E. Adsorption of gases in multimolecular layers. J Am Chem Soc. 1938;60:309–319. doi: 10.1021/ja01269a023. [DOI] [Google Scholar]
- 28.Emmett PH, Brunauer S, Love KS. The measurement of surface areas of soils and soil colloids by the use of low temperature van der Waals adsorption isotherms. Soil Sci. 1938;45(1):57–65. doi: 10.1097/00010694-193801000-00008. [DOI] [Google Scholar]
- 29.Cihacek LJ, Bremner JM. Simplified ethylene-glycol monoethyl ether procedure for assessment of soil surface-area. Soil Sci Soc Am J. 1979;43(4):821–822. doi: 10.2136/sssaj1979.03615995004300040045x. [DOI] [Google Scholar]
- 30.Kallai N, Luhn O, Dredan J, Kovacs K, Lengyel M, Antal I. Evaluation of drug release from coated pellets based on isomalt, sugar, and microcrystalline cellulose inert cores. AAPS z. 2010;11(1):383–391. doi: 10.1208/s12249-010-9396-x. [DOI] [PMC free article] [PubMed] [Google Scholar]
- 31.Oconnor RE, Schwartz JB. Drug release mechanism from a microcrystalline cellulose pellet system. Pharm Res. 1993;10(3):356–361. doi: 10.1023/A:1018928003668. [DOI] [PubMed] [Google Scholar]
- 32.Higuchi T. Mechanism of sustained-action medication. Theoretical analysis of rate of release of solid drugs dispersed in solid matrices. J Pharm Sci. 1963;52:1145–1149. doi: 10.1002/jps.2600521210. [DOI] [PubMed] [Google Scholar]
- 33.Wishart D. Classification in the information age: Clustan graphics 3 interactive graphics for cluster analysis. Berlin: Springer; 1999. [Google Scholar]


