

Abstract
The purpose of this study is to characterize the involvement of hepato-biliary transport and cytochrome-P450 (CYP)-mediated metabolism in the disposition of glyburide and predict its pharmacokinetic variability due to drug interactions and genetic variations. Comprehensive in vitro studies suggested that glyburide is a highly permeable drug with substrate affinity to multiple efflux pumps and to organic anion transporting polypeptide (OATP)1B1 and OATP2B1. Active hepatic uptake was found to be significantly higher than the passive uptake clearance (15.8 versus 5.3 μL/min/106-hepatocytes), using the sandwich-cultured hepatocyte model. In vitro, glyburide is metabolized (intrinsic clearance, 52.9 μL/min/mg-microsomal protein) by CYP3A4, CYP2C9, and CYP2C8 with fraction metabolism of 0.53, 0.36, and 0.11, respectively. Using these in vitro data, physiologically based pharmacokinetic models, assuming rapid-equilibrium between blood and liver compartments or permeability-limited hepatic disposition, were built to describe pharmacokinetics and evaluate drug interactions. Permeability-limited model successfully predicted glyburide interactions with rifampicin and other perpetrator drugs. Conversely, model assuming rapid-equilibrium mispredicted glyburide interactions, overall, suggesting hepatic uptake as the primary rate-determining process in the systemic clearance of glyburide. Further modeling and simulations indicated that the impairment of CYP2C9 function has a minimal effect on the systemic exposure, implying discrepancy in the contribution of CYP2C9 to glyburide clearance.
KEY WORDS: CYP2C9, drug–drug interaction, glyburide, OATP1B1, physiologically based pharmacokinetic model
INTRODUCTION
Glyburide [INN, glibenclamide] is a second-generation sulfonylurea drug widely used in the treatment of type II diabetes mellitus. It is primarily metabolized in the liver through cytochrome-P450 (CYP)-mediated oxidative pathways (1–3). The two major circulating metabolites, 4-trans-hydroxyglyburide (M1) and 3-cis-hydroxyglyburide (M2) were shown to have ∼50–75% of the hypoglycemic activity of the parent due to increased insulin secretion (4). CYP2C9 was thought to be primarily responsible for the biotransformation of glyburide in vivo, with CYP3A4 playing a minor role. Several clinical studies demonstrated an association between glyburide pharmacokinetics and genetic polymorphism of CYP2C9, where the carriers of CYP2C9*3 variants showed reduced clearance (5–8). On the contrary, in vitro enzymology studies suggested CYP3A4 to be the major metabolizing enzyme, with CYP2C9 playing a minimal role (9–11). Glyburide was also shown to be a substrate to hepatic uptake transporters, which may play a role in its disposition (12,13). Collectively, the evident disconnect between the in vivo and the in vitro findings suggest lack of understanding in the quantitative role of transporter and enzymatic processes in glyburide clearance.
Drug–drug interactions (DDIs) associated with membrane transporters and metabolizing enzymes can lead to severe adverse reactions and/or a reduced pharmacological effects. As a victim drug, glyburide is reported to cause weak to no drug interactions with CYPs inhibitors. For example, CYP3A4 and CYP2C9 inhibitors clarithromycin, erythromycin, fluvastatin, and verapamil showed glyburide exposure change by less than 1.5-fold in clinical studies (14–17). This indicates that either multiple isozymes are involved in its metabolism or metabolism is not the predominant rate-determining clearance process. Alternatively, glyburide clearance may be determined by transporter-mediated hepatic disposition, as was described for drugs like atorvastatin and repaglinide (18,19). The anti-tuberculosis agent, rifampicin, is a prototypical inducer of metabolizing enzymes and also show competitive inhibition of organic anion transporting polypeptides (OATPs) (20–22). Interestingly, rifampicin treatment caused a range of effects on the glyburide pharmacokinetics (13,23). Notably, there is a significant impact of glyburide “dosing-time” relative to rifampicin treatment on the magnitude of glyburide systemic exposure change. For example, a single intravenous dose of rifampicin increased glyburide oral exposure to 2.25-fold of the control (13). However, about 22% and 63% decrease in glyburide AUC was observed, when it was orally administered along with or 48 h after the last dose of chronic rifampicin treatment. In a separate study, glyburide AUC decreased 39% when administered 12.5 h following the last oral dose of 5-day rifampicin treatment (23). It is hypothesized that the effects of rifampicin on the glyburide disposition could be complex—involving induction of CYP3A4 and inhibition of hepatic uptake and/or metabolism—and multiple mechanisms need to be considered to quantitatively rationalize the observed interactions.
Recently, physiologically based pharmacokinetic (PBPK) modeling has demonstrated utility in predicting drug pharmacokinetics and evaluating the DDI potential (19,24,25). Semi-mechanistic or extended PBPK modeling of glyburide was reported recently to predict certain drug interactions or drug disposition in pregnancy (26,27). However, comprehensive quantitative assessment of transporter–enzyme interplay is missing. The aim of this study is to characterize the transporter- and enzyme-mediated disposition of glyburide. In addition, we developed a comprehensive mechanistic (whole-body PBPK) model of glyburide, utilizing the hepatic transport (sinusoidal active uptake, passive diffusion, and canalicular efflux) and metabolic intrinsic clearance estimates from the in vitro studies. The mechanistic model was used to simulate the plasma concentration–time profiles and further assess the transporter- and/or enzyme-mediated clinical DDIs and the impact of genetic variants on glyburide pharmacokinetics.
MATERIALS AND METHODS
Chemicals and Reagents
Glyburide, rifamycin SV, and rifampicin were purchased from Sigma-Aldrich (St. Louis, MO). InVitroGro-HT, CP, and HI hepatocyte media were purchased from Celsis IVT (Baltmore, MD). Human Embryonic Kidney (HEK) 293 cells stably transfected with human OATP1B1, OATP1B3, or OATP2B1 were generated at Pfizer Inc (Sandwich, UK). Caco-2 cells were obtained from American Type Culture Collection (Rockville, MD, USA). Dulbecco’s modified Eagle’s medium, fetal bovine serum, nonessential amino acids, GlutaMAX-1, penicillin, and streptomycin solution were obtained from Invitrogen.
In Vitro Metabolism
Recombinant CYPs Studies
Glyburide (1 μM) was incubated with seven human recombinant CYP isoforms (CYP1A2, CYP2B6, CYP2C8, CYP2C9, CYP2C19, CYP2D6, and CYP3A4). The incubation was performed at enzyme concentration of 150 pmol/mL. The reaction mixture contained NADPH (2 mM), MgCl2 (3 mM). Reactions were stopped at 0, 5, 10, 20, 30, 45, and 60 min by transferring 50 μL of mixture to a 96-well plate which containing 200 μL of acetonitrile with internal standard (PF-5218881, 1 μg/mL) in each well. Then sample plate was vortexed for about 1 min and centrifuged at 3,000×g for 10 min. An aliquot of 5 μL was injected for high-performance liquid chromatography-mass spectrometry (HPLC/MS) analysis.
Chemical Inhibition Studies
To identify CYP isoforms in human liver microsomes that metabolize glyburide, known selective inhibitors of these CYP enzymes were incubated, one at a time, with glyburide in reaction mixtures. Glyburide metabolism was determined by measuring depletion of the drug. The following are the inhibitors selective for each CYP isozyme and their concentrations used: CYP2C9, sulfaphenazole (10 μM); CYP3A4, ketoconazole (1 μM); CYP2C8, Montelukast (12 μM) (28). These inhibitors and glyburide were dissolved in DMSO, and the final concentration of DMSO in reaction mixtures was 0.1% (v/v). The reaction mixtures (a final volume of 0.5 mL) contained 100 mM sodium phosphate buffer (pH 7.4), human liver microsomes (1 mg of protein per ml), 3 mM MgCl2, and glyburide at a final concentration of 0.25, 0.5, and 1 μM. The reactions were carried out by incubation of the reaction mixtures at 37°C in a heating block. After pre-warming for 5 min, the reactions were initiated by adding a NADPH. Reactions were stopped at 0, 5, 10, 20, 30, 45, and 60 min by transferring 50 μL of mixture to a 96-well plate which containing 200 μL of acetonitrile with internal standard (declofenac, 0.2 μg/mL) in each well. Then sample plate was vortexed for about 1 min and centrifuged at 3,000×g for 10 min. An aliquot of 5 μL was injected for HPLC/MS analysis.
In Vitro Transporter and Permeability Studies
Transwell Caco-2 Permeability Assay
Caco-2 cells were seeded at a density of ∼3.0 × 10⁵ cells per well, and the plates were used for experimentation 21 days post-seeding. Transport studies were initiated by removing the cell culture medium from the apical and basolateral sides of the cell monolayers. Cell monolayers were washed once with Hank’s balanced salt solution (HBSS) (37°C), which was then replaced with fresh transport buffer and equilibrated for 15 min. For transport studies, 0.3 and 1 mL of HBSS (without or with glyburide and inhibitors) was added to the apical compartment and basolateral compartment, respectively (n = 3 monolayers per condition). Studies were carried out at 37°C with continuous agitation. After 60 min incubation, 200 μL samples were collected from the basolateral compartment. Transepithelial electrical resistance and permeability of nadolol (a low permeability marker) were measured to assess the cell monolayer integrity. Transepithelial transport was represented as permeability values (Papp, ×10−6 cm/s) calculated using Eq. 1.
 |
1 |
where S is the surface area of the cell monolayer (1 cm2), CD(0) the initial concentration of compound applied to the donor chamber, t the time, Mr the mass of compound in the receiver compartment, and dMr/dt the flux of the compound across the cell monolayer.
The intrinsic transport clearance due to P-gp-mediated efflux activity (CLint,P-gp) was derived from Eq. 2 (29).
 |
2 |
Where, PSapp,A-to-B is the apparent apical-to-basolateral permeability-surface area product (PS). PSapical,passive and PSbasolateral,passive represent PS of apical and basolateral membrane passive transport. Assuming PSapical,passive and PSbasolateral,passive are equal and are represented as PSpassive, Eq. 2 can be reduced to Eq. 3.
 |
3 |
PSapp,A-to-B,inh represent PS measured in the presence of P-gp inhibitors. PSpassive represents passive PS across each membrane, assuming influx and efflux passive permeability are similar across both apical and basolateral membrane and no other active transport is involved (29).
Efflux Transport Assay
MDCK-MDR1 and MDCK-BCRP cells were grown in minimum essential medium supplemented with 10% fetal bovine serum, 1% minimum non-essential amino acids solution, 1% GlutaMAX™, and 1% penicillin–streptomycin prior to seeding into Millipore 96-well cell culture insert plates. The MDCK-MDR1 and MDCK-BCRP cells were cultured on the 96-well inserts with 75 μl medium per well on the apical side and 36 ml feeding tray on the basolateral side, 4 days prior to conducting the study. The cell culture medium was removed, and the cells were rinsed with HBSS and pre-incubated for 10 min to allow the cells to adjust to the buffer. The donor solutions were added to the donor chambers (apical—100 μl or basolateral—300 μl), while HBSS was added to the receiver chambers. After 90-min incubations, aliquots (60 μl) were taken from the receiver chambers to determine the translocated amount. Samples were taken from the donor chambers before and after incubation to determine the initial concentration (C0) and recovery values (10 μl + 190 μl HBSS). An internal standard solution, 36 or 120 μl of 0.5 μg/ml internal standard (MW = 687.04) in 100% methanol, was added to the receiver and donor samples, respectively. The samples were analyzed by liquid chromatography-tandem mass spectrometry (LC-MS/MS).
OATPs Substrate Assay
HEK293, HEK-OATP1B1, HEK-OATP1B3, and HEK-OATP2B1 cells were seeded at a density of 48,000 cells per well on 96-well poly-d-lysine-coated plates and cultured for 48 h (30). For the uptake assay, the cells were washed three times with warm uptake buffer (HBSS with 20 mM HEPES, pH 7.4) and then incubated up to 5 min with 50 μL uptake buffer containing 1 μM glyburide on a heated plate shaker set to 37°C and 150 rpm. Cellular uptake was terminated by quickly washing the cells four times on ice with 200 μL ice-cold uptake buffer. The cells were then lysed with 100 μL of a proprietary internal standard (MW = 686) solution in methanol, and the lysate was injected onto an LC-MS/MS system. The total cellular protein content was determined by using a Pierce BCA Protein Assay kit according to the manufacturer’s specifications.
Sandwich-Cultured Human Hepatocyte Transport Studies
The sandwich-cultured human hepatocyte (SCHH) methodology was described previously (31). Briefly, cryopreserved human hepatocytes (Hu4241, Invitrogen, Grand Island, NY; BD310, BD Biosciences, Woburn, MA) were thawed and seeded into 24-well collagen-coated plates using InVitro-HT and InVitro-CP media. The plates were overlaid with 0.25 mg/ml matrigel on the second day, and the cultures were maintained in InVitroGro-HI media. On day 5, to determine the rates of uptake and passive diffusion, the cells were preincubated with or without 100 μM rifamycin SV, and to determine biliary clearance, the cells were preincubated with or without Ca++ HBSS buffer for 10 min. The reactions were initiated by addition of 0.2, 1, and 2 μM glyburide alone or with rifamycin SV, respectively. The reactions were terminated at 0.5, 1, 2, 5, 10, and 15 min by washing the cells three times with ice-cold HBSS. The cells were lysed with 100% methanol containing internal standard. The samples were analyzed by LC-MS/MS.
Bioanalytical Methods
LC-MS/MS analyses were performed on AB SCIEX Triple Quad mass spectrometer (AB SCIEX, Framingham, MA) equipped with TurboIonSpray interface. The HPLC systems consisted of Shimadzu Prominence LC-AD20 binary pumps with controller and degasser modules (Shimadzu Scientific Instruments, Columbia, MD). All instrumentations were controlled and synchronized by AB SCIEX Analyst software (version 1.4.2 or higher). The mobile phase consisted of solvent A (0.1% formic acid in water) and solvent B (0.1% formic acid in acetonitrile), and the flow rate was set at 0.5 mL/min.
Samples from metabolism studies were analyzed using an API 4000 LC/MS/MS, CTC Analytics PAL autosampler, and Phenomenex Synergi Polar-RP (4 μm, 2.0 × 30 mm) column (Phenomenex, Torrance, CA). Samples were eluted using the following gradient—5% solvent B for 1 min, increasing to 90% B for 1 min, held at 90% B for 1 min, reduction to 5% B over 0.2 min, and held at 5% B for 0.8 min (total run time 4 min). Multiple reaction monitoring in positive ion mode was employed for quantification—m/z 492 → 367 for glyburide and m/z 296 → 215 for diclofenac. Transporter studies utilized an API 6500 LC/MS/MS, Apricot/Sound Analytics ADDA autosampler, and Phenomenex Kinetex (2.6 μm, 3.0 × 50 mm) column. The following gradient was used to elute samples—5% solvent B for 0.2 min, increasing to 95% B for 0.5 min, held at 95% B for 0.3 min, reduction to 5% B over 0.02 min, and held at 5% solvent B for 0.88 min (total run time 2 min). The m/z mass transitions under negative ion mode conditions for glyburide and internal standard were 492.2 → 367.2 and 687.2 → 149.4, respectively.
PBPK Modeling and Simulations
Whole-body PBPK modeling and simulations of clinical pharmacokinetics and DDIs were performed using population-based ADME simulator, Simcyp (version 12.0, SimCYP Ltd, Sheffield, UK). Glyburide model was built using the physicochemical properties, in vitro preclinical data such as human plasma unbound fraction (fu), blood-to-plasma ratio (Rb), metabolic intrinsic clearance values, etc. (Table I). Glyburide PBPK model building process was similar to that described previously (19,36). Full-PBPK model using Rodgers et al. method (34) considering rapid equilibrium between blood and tissues was adopted to obtain the distribution of glyburide into all organs (rapid-equilibrium model) or all organs except liver (permeability-limited model). The volume of distribution (VDss) was overpredicted by the Rodgers et al. method (0.22 L/kg), and therefore, a partitioning scalar of 0.2 was assigned to adjust the VDss (0.08 L/kg) to that observed in humans following intravenous dosing (1,32). When permeability-limited hepatic disposition of glyburide was considered, sinusoidal active uptake intrinsic clearance and passive diffusion obtained from the current SCHH studies were incorporated. The permeability-limited model with these initial (transport and metabolism) input parameters resulted in underprediction of hepatic clearance. Therefore, an empirical scaling factor for the hepatic sinusoidal active uptake (SFactive = 1.9), estimated by ‘middle-out’ model fitting to the intravenous data, was applied, while keeping the rest of the input parameters same as that of the initial model (19,36,37). Advanced dissolution, absorption, and metabolism (ADAM) model was adopted to capture intestinal absorption and predict oral pharmacokinetics of glyburide. P-gp-mediated efflux activity in the intestine was incorporated by using the in vitro CLint,P-gp. Rifampicin model was directly adopted from Simcyp compound library (36,38). Rifampicin interaction parameters against CYP3A4, CYP2C8, and OATP1B1 were generated in-house or extracted from literature (36,38). Similarly, models for perpetrator drugs clarithromycin, erythromycin, and verapamil were adopted from Simcyp compound library. Along with mechanism-based inhibition of CYP3A4, competitive inhibition of OATP1B1 was assumed in DDI predictions with OATP1B1 Ki of 8.3, 11.4, and 51.6 μM for clarithromycin, erythromycin, and verapamil, respectively (39). Competitive inhibition of intestinal P-glycoprotein with Ki values of 4.1 and 2.0 μM was also included for clarithromycin and verapamil, respectively. To assess the impact of CYP2C9 genetic variation on glyburide pharmacokinetics, the CYP2C9 activity in *1/*2, *2/*2, *1/*3, *2/*3, and *3/*3 allele carriers was assumed to be 84, 67, 60, 43, and 19%, respectively, of wild-type (*1/*1) carriers (40,41).
Table I.
Summary of Input Parameters for Glyburide PBPK Model
| Parameters | Glyburide | Source |
|---|---|---|
| Physicochemical properties | ||
| Molecular weight (g/mol) | 494 | ACD |
| Log P | 3.076 | ACD |
| Compound type | Monoprotic acid | ACD |
| pK a | 5.11 | ACD |
| Fraction unbound (fu,p) | 0.021 | (32) |
| Blood/plasma ratio (Rb) | 0.58 | In-house data |
| Absorption | ||
| Absorption type | ADAM | |
| Fraction absorbed | >0.95 | (1,33) |
| Passive permeability (×10−6 cm/s) pH 7.4 | 18.9 | Caco-2 data |
| Absorption Scalar | 1.87 | In-house data |
| CLint,P-gp (μL/min/cm2) | 6.24 | Caco-2 data |
| P-gp relative activity factor for Caco-2 | 1.0 | Assumed |
| fugut | 1.0 | Assumed |
| Distribution | ||
| Distribution model | Full PBPK model | (34) |
| Intravenous observed Vss (L/kg) | 0.08 | (1,32) |
| Kp scalar | 0.2 | Estimateda |
| Elimination | ||
| CLint,met (μL/min/mg-microsomal protein) | 52.9 | HLM data |
| fm (CYP3A4/CYP2C8/CYP2C9) | 0.53/0.12/0.35 | HLM data |
| Fumic | 0.56 | In-house data |
| Renal elimination (%) | 0 | (1) |
| Hepatobiliary transport | ||
| Liver unbound fraction (intra-/extra-cellular) | 0.54/0.039 | Calculated(35) |
| PSpd (μL/min/10−6cells) | 5.3 | SCHH data |
| Jmax,T (pmol/min/10−6cells) | 31.6 | SCHH datab |
| Km (μM) | 2.0 | Transfect cells data |
| Scaling factor (active) | 1.9 | Estimatedc |
| CLint,efflux (μL/min/10−6cells) | 0 | SCHH data |
ACD, Calculated using Advanced Chemistry Development (ACD/Labs) Software V11.02. (SciFinder 2007.1)
CL int intrinsic transport clearance, PBPK physiologically based pharmacokinetic, ACD Advanced Chemistry Development, ADAM advanced dissolution, absorption, and metabolism model, CYP cytochrome-P450, HLM human liver microsome, PS permeability-surface area product, SCHH sandwich-cultured human hepatocyte methodology
aEstimated by matching the predicted value based on Rodgers and Rowland method to the in vivo observed Vss (1)
b J max,T is calculated from active uptake clearance obtained in SCHH (Fig. 3) and Km of OATP1B1 in the transfect cells studies (Fig. 2)
cEstimated by fitting to intravenous pharmacokinetics data (PBPK model). See “MATERIALS AND METHODS”
Each simulation was performed for 50 subjects (5 trials × 10 subjects). The virtual populations of healthy subjects had a body weight of 70 kg, with age ranging from 18 to 65 years, and included both sexes. Dose, dosing interval, and dosing duration of glyburide and perpetrator drugs were identical to that reported in individual clinical studies (1,5–8,13,15,23,42,43).
RESULTS
In Vitro Metabolism
To obtain the relative contribution of different CYP isozymes and the metabolic intrinsic clearance, we studied glyburide depletion in the recombinant CYPs and in pooled human liver microsome (HLM) preparations. Based on recombinant CYP studies, the contribution of CYP isozymes to glyburide depletion was in the order of CYP3A4 > CYP2C9 > CYP2C8, with CYP3A4 accounting for 71% of the total metabolic clearance (Table II). No significant substrate depletion was noted when incubated with other recombinant CYP isozymes. Metabolic intrinsic clearance determined using pooled HLM was found to be 52.9 ± 9.0 μL/min/mg protein. Montelukast, sulfaphenazole, and ketoconazole, which are probe inhibitors of CYP2C8, CYP2C9, and CYP3A, respectively, significantly inhibited substrate depletion in HLM incubations. The resulting percentage contribution are in the same rank-order of CYP3A4 > CYP2C9 > CYP2C8. Overall, in vitro studies suggest that CYP3A4 contributes to at least half of the total metabolic clearance of glyburide, while CYP2C9 and CYP2C8 play a relatively minor role.
Table II.
The Kinetics of Glyburide Metabolism by Recombinant CYP Isozymes and Human Liver Microsomes, and the Percentage Contribution of Individual CYP Isozymes to Its Metabolism
| Isozyme | T 1/2 (min) | CLint (μL/min/pmol-isozyme) | CLint (μL/min/mg-microsomal protein) | % contribution |
|---|---|---|---|---|
| Recombinant CYPs | ||||
| CYP1A2 | >180a | |||
| CYP2C8 | 92 | 0.08 | 4.0b | 6.7 |
| CYP2C9 | 37 | 0.19 | 12.3b | 20.2 |
| CYP2C19 | 20 | 0.35 | 1.2b | 1.9 |
| CYP2D6 | >180a | |||
| CYP3A4 | 2.6 | 2.67 | 43.4b | 71.2 |
| CYP2B6 | >180a | |||
| Chemical inhibition | ||||
| Human liver microsomes | 52.9 ± 9.0 | |||
| CYP2C8 | 11.9 | |||
| CYP2C9 | 35.0 | |||
| CYP3A | 53.1 | |||
CL int intrinsic transport clearance, CYP cytochrome-P450
aNo significant substrate depletion was observed
bScaled to microsomal CLint on the basis of CYP content in the human liver microsomes
In Vitro Intestinal Permeability
Glyburide showed pH-dependent absorptive permeability (Papp,A-to-B) across Caco-2 monolayer (Fig. 1a). Bi-directional permeability at pH 7.4 medium on both sides showed an efflux ratio of about 4, which was reduced to unity by P-gp inhibitors (Fig. 1b). Papp,A-to-B and passive permeability at pH 7.4 are 8.0 ± 0.8 × 10⁻⁶ cm/s and 19.0 ± 2.6 × 10⁻⁶ cm/s, respectively, yielding intrinsic P-gp transport clearance (CLint,P-gp) of 6.24 μL/min/cm2. Furthermore, significant asymmetric transcellular transport was noted across MDCK-MDR1 and MDCK-BCRP cell monolayers (Fig. 1c), suggesting glyburide substrate affinity towards intestinal efflux transporters, P-gp and BCRP.
Fig. 1.
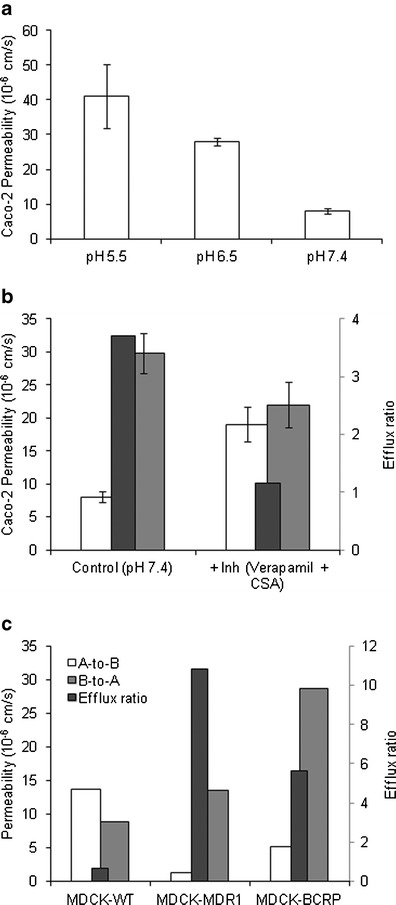
Intestinal permeability characteristics of glyburide. a pH-dependent absorptive permeability across Caco-2 cell monolayer. b Bi-directional transport of glyburide across Caco-2 without and with P-gp inhibitors. c Bi-directional transport across the P-gp and BCRP transfected cell monolayers. Permeability values represent mean ± SD (n = 3) or mean (n = 2)
In Vitro Hepatobiliary Transport
Glyburide is taken up by OATP1B1, with uptake by transfected (HEK-OATP1B1) cells reaching a maximum of 3.5-fold compared with uptake by HEK-Mock cells (Fig. 2). The uptake of glyburide by the cells transfected with OATP1B3 was found to be similar to that of HEK-Mock cells; however, significant uptake by OATP2B1 was noted but with a maximum fold ratio of only 1.5. Furthermore, OATP1B1 specific uptake was saturable with a Km value of 2.0 ± 0.6 μM and was inhibitable by rifampicin (Fig. 2b). We carried out similar studies for OATP2B1 specific uptake, but the profile was variable to determine Km due to the small window of active uptake (maximum uptake ratio noted was 1.5, Fig. 2a) (data not shown). SCHH model was used to assess the involvement of active uptake in the hepatic disposition of glyburide and determine the hepato-biliary transport kinetics (Fig. 3). Rifamycin SV significantly inhibited the uptake of glyburide into hepatocytes, with an estimated active component of 82 ± 8% of the total uptake. Studies in the presence and absence of rifamycin SV and calcium yielded intrinsic clearance values for sinusoidal active (PSactive) and passive (PSpd) uptake of 15.8 ± 3.4 and 5.3 ± 2.8 μL/min/106cells, respectively. No significant canalicular secretion was observed suggesting negligible biliary excretion for glyburide.
Fig. 2.
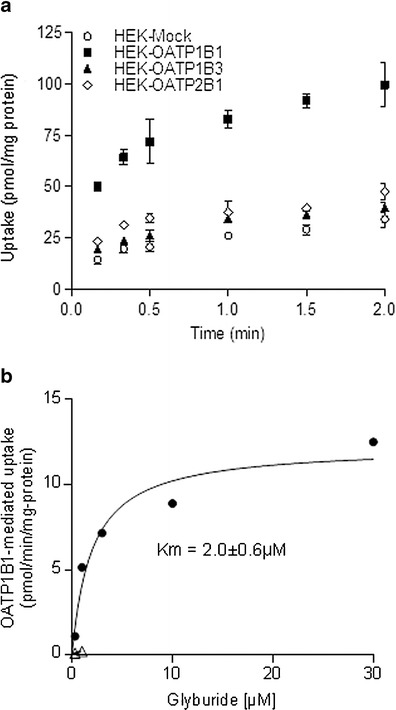
a Time-dependent uptake of glyburide by HEK-Mock cells or HEK cells stably transfected with human OATP1B1, OATP1B3, or OATP2B1. Statistically significant difference (p < 0.01, t test) was observed between uptake by mock-transfected and OATP1B1- and OATP2B1-transfected cells at all time points. b Concentration-dependent OATP1B1-specific uptake of glyburide in the absence (filled circles) and presence (open triangles) of rifampicin (100 μM). OATP1B1-specific uptake was obtained by subtracting uptake by HEK-Mock cells from uptake by HEK-OATP1B1 cells. All data represent mean ± SD (n = 3)
Fig. 3.
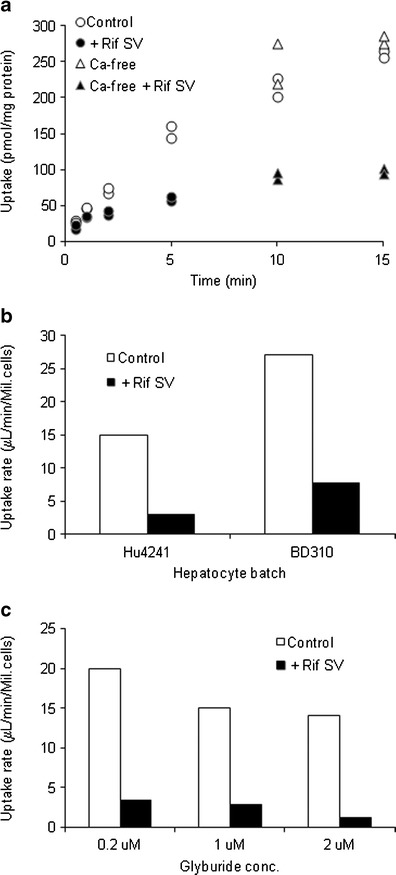
Hepatobiliary transport of glyburide in SCHH model. a Representative time-course of cellular accumulation measured at 37°C in the presence and absence of rifamycin SV (100 μM) or in the buffer with or without Ca2+/Mg2+. b Total (Control) and passive (+Rif SV) uptake clearance in different hepatocyte lots. c Concentration-dependent uptake of glyburide in (Hu4241) hepatocytes. Data are presented from single studies run in duplicate
PBPK Modeling and Simulations
Whole-body PBPK models, assuming either rapid-equilibrium between liver and blood compartments or permeability-limited hepatic disposition, were evaluated to describe glyburide pharmacokinetics and assess DDIs. While the rapid-equilibrium model adequately described glyburide plasma concentration–time profile after intravenous and oral dose (Fig. 4), it mispredicted the DDIs with rifampicin (Fig. 5) and other perpetrator drugs (Fig. 6). On the other hand, permeability-limited model predicted glyburide systemic clearance within twofold (underpredicted). Incorporation of an empirical scaling factor for active hepatic uptake (SFactive = 1.9), estimated by fitting to the intravenous plasma concentration–time profile accurately described its pharmacokinetics following both intravenous and oral administration (Fig. 4). However, unlike the rapid-equilibrium model, the magnitude of glyburide–rifampicin interactions with concomitant or staggered dosing are predicted within ±25% error by permeability-limited model (Fig. 5a). For all the DDI predictions, rifampicin was considered to induce CYP3A4 activity (EC50—0.228 μM; Emax—49.5), as well as reversibly inhibit OATP1B1 (Ki—0.93 μM), CYP3A4 (Ki—18.5 μM), and CYP2C8 (Ki—30.2 μM) (36,38). Similarly, permeability-limited model better described no or weak interactions with P-gp, CYP3A4, and OATP1B1 inhibitors, including clarithromycin, erythromycin, and verapamil (Fig. 6). The current in vitro data and the modeling and simulations collectively suggest that glyburide hepatic disposition is at least partially determined by hepatic uptake, and therefore, permeability-limited model was used for further evaluation.
Fig. 4.
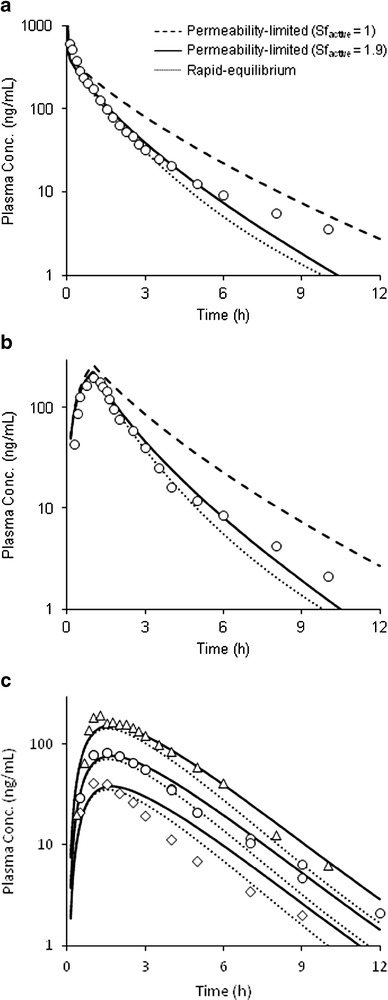
Glyburide plasma concentration-time profiles. Predicted pharmacokinetics by the rapid-equilibrium model and the permeability-limited model without and with scaling factor for active hepatic uptake, following a intravenous bolus 2.41 mg and b intravenous infusion 2 mg. c Simulated plasma concentration–time profiles following oral dosing of 0.875, 1.75, and 3.5 mg doses. Data points represent mean observed data taken from separate clinical studies (1,5,15,23,42,43)
Fig. 5.
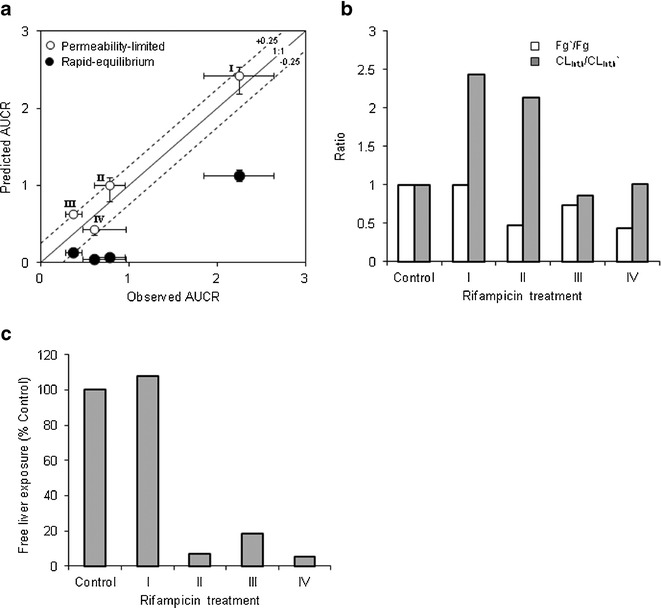
Glyburide-rifampicin interactions predicted by the PBPK model, assuming rapid-equilibrium or permeability-limited hepatic disposition. a Observed verses predicted AUCRs. Error bars represent 95% confidence interval or range. b Predicted change in fraction escaping gut metabolism and change in overall hepatic intrinsic clearance, assuming permeability-limited model. c Predicted change in glyburide unbound liver exposure following different rifampicin treatments, considering permeability-limited model. For model simulations, dosage regimen of glyburide and rifampicin is similar to the original reported study design. Key: I—Glyburide oral dose with single intravenous infusion of rifampicin; II—Glyburide oral dose with single intravenous infusion 24 h after 6-day oral rifampicin treatment; III—Glyburide oral dose 48 h after rifampicin treatment; IV—Glyburide oral dose 12.5 h after 5-day oral rifampicin treatment (13,23)
Fig. 6.
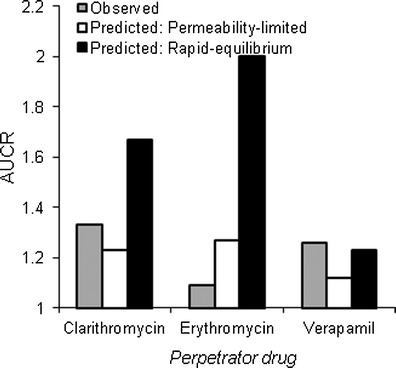
Glyburide interactions with perpetrator drugs predicted by PBPK model, assuming rapid-equilibrium or permeability-limited hepatic disposition. For model simulations, dosage regimen of glyburide and perpetrator drugs is similar to the original reported study design (15–17). In vitro interaction potential associated with mechanism-based inhibition of CYP3A4 and competitive inhibition of OATP1B1 were considered for all the three drugs
Figure 5b shows the predicted change in the fraction escaping gut-metabolism (Fg’/Fg) and hepatic intrinsic clearance (CLint,h/CLint,h’) of glyburide with the different rifampicin treatments. Following oral rifampicin treatment, fraction extracted in the gut increased from ∼9% of the dose to ∼33–61%, implying that the major site of glyburide elimination shifts from liver in the control group to gut in oral rifampicin treatment group. Furthermore, increased CYP3A4 activity in liver has a minimal effect on the hepatic clearance of glyburide, compared with the change predicted in the gut. For example, Fg was reduced by ∼57% while CLint,h showed no change, when glyburide was dosed 12.5 h after 5-day rifampicin treatment (Treatment IV, Fig. 5b).
Interestingly, single intravenous dose of rifampicin did not considerably alter the hepatic exposure of glyburide, despite the systemic exposure increased by 2.25-fold (Fig. 5c). However, chronic oral rifampicin treatments reduced the liver exposure to <20% of the initial value in all the cases, although the systemic exposure was marginally affected in one case (Treatment II, Fig. 5). Sensitivity analysis was performed to assess the influence of transport and metabolic intrinsic clearances on the systemic and hepatic exposure of glyburide after oral dosing (Fig. 7). Notably, CLint,active showed prominent effect on the systemic exposure but did not affect the hepatic exposure. In contrast, CLint,met only showed relatively lesser effect on the systemic exposure while significantly influencing the hepatic exposure. Intestinal efflux activity and hepatic sinusoidal passive transport showed minimum or no effect on both systemic and hepatic exposure.
Fig. 7.
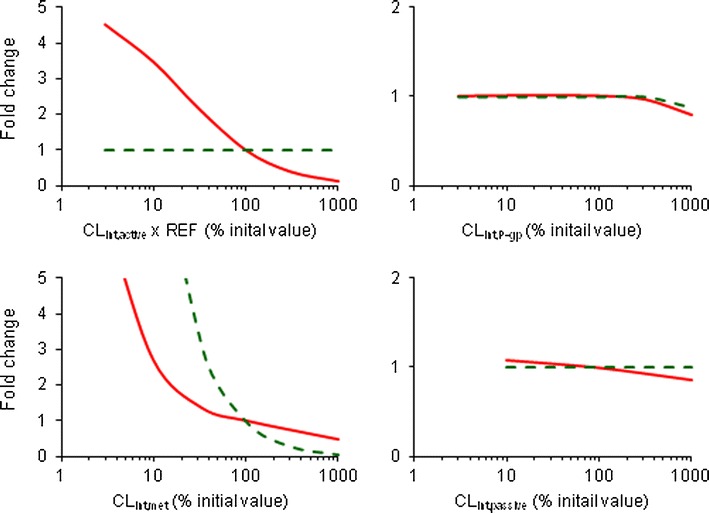
Effects of changes in transporter and metabolic activity on the systemic and hepatic exposures of glyburide. Permeability-limited model based prediction of the fold change from baseline in the plasma AUC (solid line) and hepatic AUC (dash line) of oral glyburide as a function of hepatic active uptake, intestinal efflux, hepatic metabolic clearance, and hepatic sinusoidal passive diffusion
Finally, the impact of CYP2C9 genetic variation was assessed using the permeability-limited model. With the in vitro fmCYP2C9 obtained from the current study (0.35), the maximum predicted change in plasma AUC in CYP2C9*3/*3 allele carriers compared with that in CYP2C9*1/*1 carriers was less than 20% (Fig. 8). Furthermore, sensitivity analysis of fmCYP2C9 showed only ∼75% increase in plasma AUC in variants carrying CYP2C9*3/*3, while assuming CYP2C9 is solely responsible for glyburide metabolism (fmCYP2C9 = 1.0).
Fig. 8.
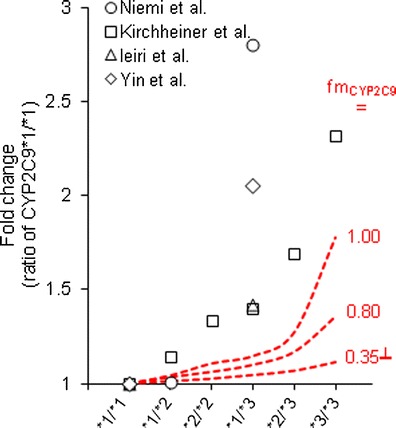
Impact of CYP2C9 genetic variants on the plasma AUC of glyburide, predicted using permeability-limited model. The CYP2C9 activity in *1/*2, *2/*2, *1/*3, *2/*3, and *3/*3 allele carriers was assumed to be 84, 67, 60, 43, and 19%, respectively, of wild-type (*1/*1) carriers (40,41). Data points represent clinical observed values extracted from separate reports (5–8). (┴) In vitro fmCYP2C9 obtained in the current study
DISCUSSION
In this study, we showed that hepatic uptake plays a key role in the systemic clearance of glyburide. A battery of in vitro studies indicated that glyburide (1) is a highly permeable drug and show substrate affinity to intestinal apical efflux transporters, (2) appear to be metabolized in the liver by multiple CYPs, with the contribution of isozymes in the order of CYP3A > CYP2C9 > CYP2C8 to its biotransformation, (3) is a substrate to hepatic sinusoidal uptake transporters, mainly OATP1B1, and (4) show significant active uptake into human hepatocytes. A mechanistic model, developed considering permeability-limited hepatic disposition and utilizing the obtained in vitro data, described the pharmacokinetics and quantitatively predicted drug interactions of glyburide.
In vitro hepatic uptake of glyburide is ∼4-fold higher than the passive diffusion, which in turn is smaller relative to the metabolic intrinsic clearance, suggesting that the overall hepatic clearance of glyburide is determined predominantly by hepatic uptake (18,19,44,45). Permeability-limited model using SCHH and microsomal stability data inputs underpredicted the systemic clearance by about 2-fold, and therefore, a scaling factor (SFactive = 1.9) was applied to recover the plasma concentration–time profiles. The apparent discrepancy in the in vitro–in vivo extrapolation of active uptake clearance could be due to differences in transporter abundance in the in vitro and in vivo systems. Based on the protein quantification by LC-MS/MS, Kimoto et al. showed higher expression of OATP1B1 in the human liver tissue in comparison to 5-day culture of SCHH—with an estimated relative expression factor (REF) of about 1.7 (37). While the REF is similar to SFactive derived for glyburide, and may provide mechanistic justification for in vitro data translation, our earlier studies showed significant underprediction of hepatic clearance for other OATPs substrate when scaling using REF alone (19,36,46). For instance, scaling factor for active uptake (SFactive) needed to recover hepatic clearance of pravastatin (∼31) (36) and repaglinide (∼17) (19) is much higher than could be explained by REF. The seemingly compound-specific SFactive were also noted when considering mechanism-based in vitro–in vivo extrapolation of data from SCHH (46) and suspended hepatocytes systems (47,48). At this point, we are unable to explain this disconnect noted for majority of the OATPs substrates, and it warrants further investigation of the potential reasons such as lower functional activity in the in vitro systems (49,50). Alternatively, the clearance scaled-up from human microsomal data alone matched up to the in vivo systemic clearance, and further the intravenous and oral pharmacokinetic profiles were reasonably described by the PBPK model assuming rapid-equilibrium between blood and liver compartments. Overall, both the assumptions (permeability-limited and rapid-equilibrium) described glyburide disposition within a reasonable error when utilizing plasma concentration–time profiles alone.
Clearly, the AUC ratios (AUCRs) are well predicted (within ±25% error) assuming permeability-limited model, while the rapid-equilibrium model mispredicted the glyburide interactions with rifampicin (Fig. 4b). Rifampicin is a prototypical inducer of CYP isoforms and also a potent competitive inhibitor of OATPs (20–22). A single intravenous dose of rifampicin reduced the hepatic uptake via inhibition of OATP1B1 resulting in >2-fold higher systemic AUC of glyburide. However, this, when combined with CYP induction caused by chronic oral rifampicin treatment, resulted in minimal exposure change. On the other hand, staggered dose of glyburide >12 h after rifampicin treatment isolated the effect of CYP induction on glyburide systemic exposure. Alternatively, over-prediction of the induction effect and lack of any inhibitory effect by the rapid-equilibrium model corroborates that hepatic uptake plays a key role in the clearance of glyburide. Other known pharmacokinetic interactions of glyburide were also well recovered by the permeability-limited model. Based on the model predictions, clarithromycin, erythromycin, and verapamil, which perpetuate moderate-to-high DDIs (AUCR > 2) with CYP3A4 clinical probes (51) and inhibit OATP1B1 in vitro, showed no or weak interactions (AUCR < 1.5) with glyburide as victim drug (Fig. 6).
Induction of the metabolic activity in the liver caused by chronic rifampicin treatment only has a minimal impact on the systemic clearance of glyburide (Fig. 5b). However, the AUCRs can be quantitatively explained primarily due to increased gut metabolism (Fg’/Fg) and/or reduced hepatic uptake (38). This mechanistic evaluation suggests that the variation in the hepatic metabolic activity caused by drug interactions and/or genetic polymorphism will have a smaller effect on systemic exposure for drugs with permeability-limited disposition compared with those achieve rapid-equilibrium. Therefore, identifying the role of uptake transporters in hepatic disposition is critical for quantitative DDI predictions. It is generally thought that transporters play a minimal role in the disposition for highly permeable drugs (52,53). However, it should be noted that active uptake could contribute significantly to the hepatic clearance irrespective of passive permeability. Our previous and the current assessment with pravastatin (low passive permeability) and repaglinide and glyburide (high passive permeability), clearly indicate that active uptake could be the rate-determining process in the hepatic clearance of both low and high permeability drugs (19,36).
Rifampicin is also known to induce intestinal apical efflux pumps, like P-gp, and MRP2 (54,55). We incorporated the efflux transporter kinetics (assuming P-gp as the predominant transporter) obtained from the transport studies across Caco-2 monolayer, using the ADAM model. Sensitivity analysis suggested minimal (<10%) change in glyburide systemic exposure even when the efflux activity was induced more than fivefold (Fig. 7b). Therefore, although glyburide showed high asymmetric transport in our in vitro studies, contribution of the induction of intestinal efflux activity to glyburide–rifampicin interactions is unlikely.
CYP isozyme-specific differences in the quantitative induction by rifampicin have been observed according to the in vitro measurements and clinical studies (21). Due to the lack of availability of appropriate induction parameters for CYP2C9, the current modeling and simulations assumed only CYP3A induction by rifampicin treatment. Furthermore, it was contemplated that additional considerations to CYP2C9 induction activity only has a minimal effect on the quantitative predictions, because (1) in vitro fraction metabolized by CYP2C9 is smaller than that by CYP3A, (2) the extent to which CYP3A activity is induced by rifampicin treatment is larger relative to the observed increase in the clearance of CYP2C9 substrates (56,57), (3) hepatic uptake is the rate-determining process in the hepatic elimination of glyburide and an increase in metabolic activity is less likely to effect the systemic clearance, and (4) finally, increase in the gut metabolism is the major driver for observed decrease in glyburide exposure (Fig. 5b), and CYP2C9 contribution to intestinal extraction is believed to be relatively low (58).
An apparent in vitro–in vivo disconnect in the percent contribution of CYP isozymes to the metabolism of glyburide was noted. Consistent with several recent reports (9–11), our in vitro HLM chemical inhibition studies suggested that the contribution of CYP3A to hepatic metabolism of glyburide is >50%, while CYP2C9 accounts to 35% and CYP2C8 playing a minor role (Table II). The predominant contribution of CYP3A4 was further supplemented by recombinant CYPs findings. The involvement of several enzymes in the metabolism of glyburide should minimize the effect of a probe drug that inhibits one isozyme. Clinical observations imply these findings, wherein neither CYP3A4 inhibitors nor CYP2C9 inhibitors such as clarithromycin and fluvastatin showed any major impact on glyburide pharmacokinetics (14,15). However, in vivo clearance of glyburide is evidently affected by CYP2C9 polymorphism, arguably suggesting that CYP2C9 is the primary metabolizing isozyme. Based on the in vitro fmCYP2C9, our mechanistic modeling showed that about 80% loss in CYP2C9 activity—typically observed in CYP2C9*3/*3 allele carriers (40,41)—may increase glyburide AUC by only <20%, which is substantially lower than that observed in the subjects carrying CYP2C9*3 allele (Fig. 8). Moreover, sensitivity analysis assuming fmCYP2C9 as high as unity did not recover the clinically reported changes in plasma AUC or clearance in CYP2C9*3 allele carriers. At this time, we cannot explain the distinct underprediction of the impact of CYP2C9 genetic variation on glyburide pharmacokinetics, although the permeability-limited model developed based on comprehensive in vitro transporter and metabolism inputs quantitatively predicted DDIs of glyburide.
Interestingly, significant functional effect of CYP2C9*3 was also observed for other OATP transporter substrates, including fluvastatin, irbesartan, glimepiride, and nateglinide (59–63). Similar in vitro–in vivo disconnect in the role of CYP2C9 to the metabolism was also noted for fluvastatin. In the in vitro studies, only the probe inhibitor of CYP3A (ketoconazole) markedly inhibited formation of fluvastatin major metabolite (M3) (64). In vivo, CYP3A inhibitor, itraconazole, has no significant effect on fluvastatin pharmacokinetics in healthy volunteers, and fluconazole, a moderate inhibitor of both CYP3A and CYP2C9, increased the mean AUC by only 84% (65,66). However, ∼3-fold reduction in oral clearance of fluvastatin was noted in CYP2C9*3 allele carriers (60). Similar to glyburide, hepatic uptake may play a key role in determining the systemic clearance of fluvastatin (46,67), and thus, its observed magnitude of clearance change in the carriers of CYP2C9*3 allele cannot be completely explained by genetic variation in CYP2C9.
Additionally, pharmacokinetic variability may be associated with reduced hepatic uptake activity. OATP1B1 is a polymorphic transporter and subjects carrying polymorphic variants of OATP1B1, such as OATP1B1*5 and OATP1B1*15 show increased systemic exposure of several OATP1B1 substrates as a consequence of reduced transport activity compared with the reference type (OATP1B1*1a) (68). Based on the current model predictions, a reduction in active uptake clearance by about 60% could result in ∼2-fold higher exposure of glyburide (Fig. 7). Ieiri et al. assessed the relationship between glyburide pharmacokinetics and OATP1B1 genetic polymorphism and found no statistical significance (with a mean AUC change of ∼22%) among OATP1B1*1a/*1a and OATP1B1*1a/*15 carriers (8). In the same study, CYP2C9*1/*3 carriers showed ∼26% higher AUC compared with reference carriers (CYP2C9*1/*1), with statistically significant phenotypic association. The lack of influence of OATP1B1 polymorphism on glyburide pharmacokinetics is probably a result of the small number of subjects and absence of homozygotes for OATP*15/*15 allele. Alternatively, we speculate that co-existence of low activity variants of CYP2C9 and OATP1B1 may confound the observed reduction in clearance of glyburide in CYP2C9*3 carriers. Other explanation to this disconnect is the possible larger role of CYP2C9 in the intestinal extraction than predicted by the mechanistic ADAM model. Further studies are warranted in this direction to understand the pharmacogenetic factors associated with pharmacokinetic variability and potentially the pharmacodynamic effects of glyburide.
CONCLUSIONS
In conclusion, a mechanistic model for quantitative prediction of glyburide DDIs was developed using comprehensive in vitro transport and metabolic kinetics data. Permeability-limited model successfully predicted DDIs of glyburide. Conversely, model assuming rapid-equilibrium mispredicted glyburide–rifampicin interactions, suggesting that hepatic uptake is a key determinant of glyburide systemic clearance. Finally, for OATP1B1 substrates like glyburide, where hepatic clearance is determined by the uptake as well as metabolism, mechanistic considerations assuming permeability-limited disposition are needed to quantitatively predict or evaluate pharmacokinetic variability due to drug interactions and other variables like genetic polymorphisms and disease state.
Acknowledgments
Conflict of Interest
All authors are full-time employees of Pfizer Inc., at the time of this study. The authors have no conflicts of interest that are directly relevant to this study.
References
- 1.Rydberg T, Jonsson A, Melander A. Comparison of the kinetics of glyburide and its active metabolites in humans. J Clin Pharm Ther. 1995;20(5):283–295. doi: 10.1111/j.1365-2710.1995.tb00664.x. [DOI] [PubMed] [Google Scholar]
- 2.Zharikova OL, Ravindran S, Nanovskaya TN, Hill RA, Hankins GD, Ahmed MS. Kinetics of glyburide metabolism by hepatic and placental microsomes of human and baboon. Biochem Pharmacol. 2007;73(12):2012–2019. doi: 10.1016/j.bcp.2007.03.005. [DOI] [PubMed] [Google Scholar]
- 3.Ravindran S, Zharikova OL, Hill RA, Nanovskaya TN, Hankins GD, Ahmed MS. Identification of glyburide metabolites formed by hepatic and placental microsomes of humans and baboons. Biochem Pharmacol. 2006;72(12):1730–1737. doi: 10.1016/j.bcp.2006.08.024. [DOI] [PubMed] [Google Scholar]
- 4.Rydberg T, Jonsson A, Roder M, Melander A. Hypoglycemic activity of glyburide (glibenclamide) metabolites in humans. Diabetes Care. 1994;17(9):1026–1030. doi: 10.2337/diacare.17.9.1026. [DOI] [PubMed] [Google Scholar]
- 5.Niemi M, Cascorbi I, Timm R, Kroemer HK, Neuvonen PJ, Kivisto KT. Glyburide and glimepiride pharmacokinetics in subjects with different CYP2C9 genotypes. Clin Pharmacol Ther. 2002;72(3):326–332. doi: 10.1067/mcp.2002.127495. [DOI] [PubMed] [Google Scholar]
- 6.Kirchheiner J, Brockmoller J, Meineke I, Bauer S, Rohde W, Meisel C, et al. Impact of CYP2C9 amino acid polymorphisms on glyburide kinetics and on the insulin and glucose response in healthy volunteers. Clin Pharmacol Ther. 2002;71(4):286–296. doi: 10.1067/mcp.2002.122476. [DOI] [PubMed] [Google Scholar]
- 7.Yin OQ, Tomlinson B, Chow MS. CYP2C9, but not CYP2C19, polymorphisms affect the pharmacokinetics and pharmacodynamics of glyburide in Chinese subjects. Clin Pharmacol Ther. 2005;78(4):370–377. doi: 10.1016/j.clpt.2005.06.006. [DOI] [PubMed] [Google Scholar]
- 8.Ieiri I, Fukae M, Maeda K, Ando Y, Kimura M, Hirota T, et al. Pharmacogenomic/pharmacokinetic assessment of a four-probe cocktail for CYPs and OATPs following oral microdosing. Int J Clin Pharmacol Ther. 2012;50(10):689–700. doi: 10.5414/CP201763. [DOI] [PubMed] [Google Scholar]
- 9.Zharikova OL, Fokina VM, Nanovskaya TN, Hill RA, Mattison DR, Hankins GD, et al. Identification of the major human hepatic and placental enzymes responsible for the biotransformation of glyburide. Biochem Pharmacol. 2009;78(12):1483–1490. doi: 10.1016/j.bcp.2009.08.003. [DOI] [PMC free article] [PubMed] [Google Scholar]
- 10.Zhou L, Naraharisetti SB, Liu L, Wang H, Lin YS, Isoherranen N, et al. Contributions of human cytochrome P450 enzymes to glyburide metabolism. Biopharm Drug Dispos. 2010;31(4):228–242. doi: 10.1002/bdd.706. [DOI] [PMC free article] [PubMed] [Google Scholar]
- 11.Naritomi Y, Terashita S, Kagayama A. Identification and relative contributions of human cytochrome P450 isoforms involved in the metabolism of glibenclamide and lansoprazole: evaluation of an approach based on the in vitro substrate disappearance rate. Xenobiotica Fate Foreign Compd Biol Syst. 2004;34(5):415–427. doi: 10.1080/00498250410001685728. [DOI] [PubMed] [Google Scholar]
- 12.Koenen A, Kock K, Keiser M, Siegmund W, Kroemer HK, Grube M. Steroid hormones specifically modify the activity of organic anion transporting polypeptides. Eur J Pharm Sci. 2012;47(4):774–780. doi: 10.1016/j.ejps.2012.08.017. [DOI] [PubMed] [Google Scholar]
- 13.Zheng HX, Huang Y, Frassetto LA, Benet LZ. Elucidating rifampin’s inducing and inhibiting effects on glyburide pharmacokinetics and blood glucose in healthy volunteers: unmasking the differential effects of enzyme induction and transporter inhibition for a drug and its primary metabolite. Clin Pharmacol Ther. 2009;85(1):78–85. doi: 10.1038/clpt.2008.186. [DOI] [PMC free article] [PubMed] [Google Scholar]
- 14.Appel S, Rufenacht T, Kalafsky G, Tetzloff W, Kallay Z, Hitzenberger G, et al. Lack of interaction between fluvastatin and oral hypoglycemic agents in healthy subjects and in patients with non-insulin-dependent diabetes mellitus. Am J Cardiol. 1995;76(2):29A–32A. doi: 10.1016/S0002-9149(05)80012-8. [DOI] [PubMed] [Google Scholar]
- 15.Lilja JJ, Niemi M, Fredrikson H, Neuvonen PJ. Effects of clarithromycin and grapefruit juice on the pharmacokinetics of glibenclamide. Br J Clin Pharmacol. 2007;63(6):732–740. doi: 10.1111/j.1365-2125.2006.02836.x. [DOI] [PMC free article] [PubMed] [Google Scholar]
- 16.Semple CG, Omile C, Buchanan KD, Beastall GH, Paterson KR. Effect of oral verapamil on glibenclamide stimulated insulin secretion. Br J Clin Pharmacol. 1986;22(2):187–190. doi: 10.1111/j.1365-2125.1986.tb05248.x. [DOI] [PMC free article] [PubMed] [Google Scholar]
- 17.Fleishaker JC, Phillips JP. Evaluation of a potential interaction between erythromycin and glyburide in diabetic volunteers. J Clin Pharmacol. 1991;31(3):259–262. doi: 10.1002/j.1552-4604.1991.tb04972.x. [DOI] [PubMed] [Google Scholar]
- 18.Maeda K, Ikeda Y, Fujita T, Yoshida K, Azuma Y, Haruyama Y, et al. Identification of the rate-determining process in the hepatic clearance of atorvastatin in a clinical cassette microdosing study. Clin Pharmacol Ther. 2011;90(4):575–581. doi: 10.1038/clpt.2011.142. [DOI] [PubMed] [Google Scholar]
- 19.Varma MV, Lai Y, Kimoto E, Goosen TC, El-Kattan AF, Kumar V. Mechanistic modeling to predict the transporter- and enzyme-mediated drug–drug interactions of repaglinide. Pharm Res. 2013;30(4):1188–1199. doi: 10.1007/s11095-012-0956-5. [DOI] [PubMed] [Google Scholar]
- 20.Lau YY, Huang Y, Frassetto L, Benet LZ. Effect of OATP1B transporter inhibition on the pharmacokinetics of atorvastatin in healthy volunteers. Clin Pharmacol Ther. 2007;81(2):194–204. doi: 10.1038/sj.clpt.6100038. [DOI] [PubMed] [Google Scholar]
- 21.Niemi M, Backman JT, Fromm MF, Neuvonen PJ, Kivisto KT. Pharmacokinetic interactions with rifampicin: clinical relevance. Clin Pharmacokinet. 2003;42(9):819–850. doi: 10.2165/00003088-200342090-00003. [DOI] [PubMed] [Google Scholar]
- 22.Vavricka SR, Van Montfoort J, Ha HR, Meier PJ, Fattinger K. Interactions of rifamycin SV and rifampicin with organic anion uptake systems of human liver. Hepatology. 2002;36(1):164–172. doi: 10.1053/jhep.2002.34133. [DOI] [PubMed] [Google Scholar]
- 23.Niemi M, Backman JT, Neuvonen M, Neuvonen PJ, Kivisto KT. Effects of rifampin on the pharmacokinetics and pharmacodynamics of glyburide and glipizide. Clin Pharmacol Ther. 2001;69(6):400–406. doi: 10.1067/mcp.2001.115822. [DOI] [PubMed] [Google Scholar]
- 24.Huang SM, Rowland M. The role of physiologically based pharmacokinetic modeling in regulatory review. Clin Pharmacol Ther. 2012;91(3):542–549. doi: 10.1038/clpt.2011.320. [DOI] [PubMed] [Google Scholar]
- 25.Zhang X, Quinney SK, Gorski JC, Jones DR, Hall SD. Semiphysiologically based pharmacokinetic models for the inhibition of midazolam clearance by diltiazem and its major metabolite. Drug Metab Dispos. 2009;37(8):1587–1597. doi: 10.1124/dmd.109.026658. [DOI] [PubMed] [Google Scholar]
- 26.Greupink R, Schreurs M, Benne MS, Huisman MT, Russel FG. Semi-mechanistic physiologically-based pharmacokinetic modeling of clinical glibenclamide pharmacokinetics and drug–drug-interactions. Eur J Pharm Sci. 2013;49(5):819–828. doi: 10.1016/j.ejps.2013.06.009. [DOI] [PubMed] [Google Scholar]
- 27.Ke AB, Nallani SC, Zhao P, Rostami-Hodjegan A, Unadkat JD. Expansion of a PBPK model to predict disposition in pregnant women of drugs cleared via multiple CYP enzymes, including CYP2B6, CYP2C9 and CYP2C19. Br J Clin Pharmacol. 2013. [DOI] [PMC free article] [PubMed]
- 28.Walsky RL, Obach RS. Validated assays for human cytochrome P450 activities. Drug Metab Dispos. 2004;32(6):647–660. doi: 10.1124/dmd.32.6.647. [DOI] [PubMed] [Google Scholar]
- 29.Adachi Y, Suzuki H, Sugiyama Y. Quantitative evaluation of the function of small intestinal P-glycoprotein: comparative studies between in situ and in vitro. Pharm Res. 2003;20(8):1163–1169. doi: 10.1023/A:1025088628787. [DOI] [PubMed] [Google Scholar]
- 30.Kalgutkar AS, Chen D, Varma MV, Feng B, Terra SG, Scialis RJ, et al. Elucidation of the biochemical basis for a clinical drug-drug interaction between atorvastatin and 5-(N-(4-((4-ethylbenzyl)thio)phenyl)sulfamoyl)-2-methyl benzoic acid (CP-778875), a subtype selective agonist of the peroxisome proliferator-activated receptor alpha. Xenobiotica Fate Foreign Compd Biol Syst. 2013;43(11):963–972. doi: 10.3109/00498254.2013.791004. [DOI] [PubMed] [Google Scholar]
- 31.Bi YA, Kazolias D, Duignan DB. Use of cryopreserved human hepatocytes in sandwich culture to measure hepatobiliary transport. Drug Metab Dispos. 2006;34(9):1658–1665. doi: 10.1124/dmd.105.009118. [DOI] [PubMed] [Google Scholar]
- 32.Obach RS, Lombardo F, Waters NJ. Trend analysis of a database of intravenous pharmacokinetic parameters in humans for 670 drug compounds. Drug Metab Dispos. 2008;36(7):1385–1405. doi: 10.1124/dmd.108.020479. [DOI] [PubMed] [Google Scholar]
- 33.Varma MV, Obach RS, Rotter C, Miller HR, Chang G, Steyn SJ, et al. Physicochemical space for optimum oral bioavailability: contribution of human intestinal absorption and first-pass elimination. J Med Chem. 2010;53(3):1098–1108. doi: 10.1021/jm901371v. [DOI] [PubMed] [Google Scholar]
- 34.Rodgers T, Rowland M. Physiologically based pharmacokinetic modelling 2: predicting the tissue distribution of acids, very weak bases, neutrals and zwitterions. J Pharm Sci. 2006;95(6):1238–1257. doi: 10.1002/jps.20502. [DOI] [PubMed] [Google Scholar]
- 35.Jamei M, Bajot F, Neuhoff S, Barter Z, Yang J, Rostami-Hodjegan A, et al. A mechanistic framework for in vitro–in vivo extrapolation of liver membrane transporters: prediction of drug–drug interaction between rosuvastatin and cyclosporine. Clin Pharmacokinet. 2014;53(1):73–87. doi: 10.1007/s40262-013-0097-y. [DOI] [PMC free article] [PubMed] [Google Scholar]
- 36.Varma MV, Lai Y, Feng B, Litchfield J, Goosen TC, Bergman A. Physiologically based modeling of pravastatin transporter-mediated hepatobiliary disposition and drug–drug interactions. Pharm Res. 2012;29(10):2860–2873. doi: 10.1007/s11095-012-0792-7. [DOI] [PubMed] [Google Scholar]
- 37.Kimoto E, Yoshida K, Balogh LM, Bi YA, Maeda K, El-Kattan A, et al. Characterization of organic anion transporting polypeptide (OATP) expression and its functional contribution to the uptake of substrates in human hepatocytes. Mol Pharm. 2012;9(12):3535–3542. doi: 10.1021/mp300379q. [DOI] [PubMed] [Google Scholar]
- 38.Varma MV, Lin J, Bi YA, Rotter CJ, Fahmi OA, Lam JL, et al. Quantitative prediction of repaglinide-rifampicin complex drug interactions using dynamic and static mechanistic models: delineating differential CYP3A4 induction and OATP1B1 inhibition potential of rifampicin. Drug Metab Dispos. 2013;41(5):966–974. doi: 10.1124/dmd.112.050583. [DOI] [PubMed] [Google Scholar]
- 39.Hirano M, Maeda K, Shitara Y, Sugiyama Y. Drug-drug interaction between pitavastatin and various drugs via OATP1B1. Drug Metab Dispos. 2006;34(7):1229–1236. doi: 10.1124/dmd.106.009290. [DOI] [PubMed] [Google Scholar]
- 40.Almond LM, Rowland-Yeo K, Howgate EM, Dickinson GL, Tucker GT, Rostami-Hodjegan A. Prediction of the oral clearance of tolbutamide in individuals with different CYP2C9 genotypes using in vitro enzyme kinetic data. Drug Metab Rev. 2006;38:S209–S210. doi: 10.1080/03602530600570065. [DOI] [Google Scholar]
- 41.Dickinson GL, Lennard MS, Tucker GT, Rostami-Hodjegan A. The use of mechanistic DM-PK-PD modelling to assess the power of pharmacogenetic studies -CYP2C9 and warfarin as an example. Br J Clin Pharmacol. 2007;64(1):14–26. doi: 10.1111/j.1365-2125.2007.02850.x. [DOI] [PMC free article] [PubMed] [Google Scholar]
- 42.Kleist P, Ehrlich A, Suzuki Y, Timmer W, Wetzelsberger N, Lucker PW, et al. Concomitant administration of the alpha-glucosidase inhibitor voglibose (AO-128) does not alter the pharmacokinetics of glibenclamide. Eur J Clin Pharmacol. 1997;53(2):149–152. doi: 10.1007/s002280050354. [DOI] [PubMed] [Google Scholar]
- 43.Neugebauer G, Betzien G, Hrstka V, Kaufmann B, von Mollendorff E, Abshagen U. Absolute bioavailability and bioequivalence of glibenclamide (Semi-Euglucon N) Int J Clin Pharmacol Ther Toxicol. 1985;23(9):453–460. [PubMed] [Google Scholar]
- 44.Liu L, Pang KS. The roles of transporters and enzymes in hepatic drug processing. Drug Metab Dispos. 2005;33(1):1–9. doi: 10.1124/dmd.104.001149. [DOI] [PubMed] [Google Scholar]
- 45.Shitara Y, Horie T, Sugiyama Y. Transporters as a determinant of drug clearance and tissue distribution. Eur J Pharm Sci. 2006;27(5):425–446. doi: 10.1016/j.ejps.2005.12.003. [DOI] [PubMed] [Google Scholar]
- 46.Jones HM, Barton HA, Lai Y, Bi YA, Kimoto E, Kempshall S, et al. Mechanistic pharmacokinetic modeling for the prediction of transporter-mediated disposition in humans from sandwich culture human hepatocyte data. Drug Metab Dispos. 2012;40(5):1007–1017. doi: 10.1124/dmd.111.042994. [DOI] [PubMed] [Google Scholar]
- 47.Menochet K, Kenworthy KE, Houston JB, Galetin A. Use of mechanistic modeling to assess interindividual variability and interspecies differences in active uptake in human and rat hepatocytes. Drug Metab Dispos. 2012;40(9):1744–1756. doi: 10.1124/dmd.112.046193. [DOI] [PMC free article] [PubMed] [Google Scholar]
- 48.Watanabe T, Kusuhara H, Maeda K, Shitara Y, Sugiyama Y. Physiologically based pharmacokinetic modeling to predict transporter-mediated clearance and distribution of pravastatin in humans. J Pharmacol Exp Ther. 2009;328(2):652–662. doi: 10.1124/jpet.108.146647. [DOI] [PubMed] [Google Scholar]
- 49.Barton HA, Lai Y, Goosen TC, Jones HM, El-Kattan AF, Gosset JR, et al. Model-based approaches to predict drug–drug interactions associated with hepatic uptake transporters: preclinical, clinical and beyond. Expert Opin Drug Metab Toxicol. 2013;9(4):459–472. doi: 10.1517/17425255.2013.759210. [DOI] [PubMed] [Google Scholar]
- 50.Zamek-Gliszczynski MJ, Lee CA, Poirier A, Bentz J, Chu X, Ellens H, et al. ITC recommendations for transporter kinetic parameter estimation and translational modeling of transport-mediated PK and DDIs in humans. Clin Pharmacol Ther. 2013;94(1):64–79. doi: 10.1038/clpt.2013.45. [DOI] [PMC free article] [PubMed] [Google Scholar]
- 51.USFDA. Drug interaction studies—study design, data analysis, implications for dosing, and labeling recommendations. Center for Drug Evaluation and Research (CDER). 2012.
- 52.Camenisch G, Umehara K. Predicting human hepatic clearance from in vitro drug metabolism and transport data: a scientific and pharmaceutical perspective for assessing drug–drug interactions. Biopharm Drug Dispos. 2012;33(4):179–194. doi: 10.1002/bdd.1784. [DOI] [PubMed] [Google Scholar]
- 53.Shugarts S, Benet LZ. The role of transporters in the pharmacokinetics of orally administered drugs. Pharm Res. 2009;26(9):2039–2054. doi: 10.1007/s11095-009-9924-0. [DOI] [PMC free article] [PubMed] [Google Scholar]
- 54.Geick A, Eichelbaum M, Burk O. Nuclear receptor response elements mediate induction of intestinal MDR1 by rifampin. J Biol Chem. 2001;276(18):14581–14587. doi: 10.1074/jbc.M010173200. [DOI] [PubMed] [Google Scholar]
- 55.Fromm MF, Kauffmann HM, Fritz P, Burk O, Kroemer HK, Warzok RW, et al. The effect of rifampin treatment on intestinal expression of human MRP transporters. Am J Pathol. 2000;157(5):1575–1580. doi: 10.1016/S0002-9440(10)64794-3. [DOI] [PMC free article] [PubMed] [Google Scholar]
- 56.Jayasagar G, Krishna Kumar M, Chandrasekhar K, Madhusudan RY. Influence of rifampicin pretreatment on the pharmacokinetics of celecoxib in healthy male volunteers. Drug Metabol Drug Interact. 2003;19(4):287–295. doi: 10.1515/DMDI.2003.19.4.287. [DOI] [PubMed] [Google Scholar]
- 57.Ohno Y, Hisaka A, Ueno M, Suzuki H. General framework for the prediction of oral drug interactions caused by CYP3A4 induction from in vivo information. Clin Pharmacokinet. 2008;47(10):669–680. doi: 10.2165/00003088-200847100-00004. [DOI] [PubMed] [Google Scholar]
- 58.Paine MF, Hart HL, Ludington SS, Haining RL, Rettie AE, Zeldin DC. The human intestinal cytochrome P450 “pie”. Drug Metab Dispos. 2006;34(5):880–886. doi: 10.1124/dmd.105.008672. [DOI] [PMC free article] [PubMed] [Google Scholar]
- 59.Wang R, Chen K, Wen SY, Li J, Wang SQ. Pharmacokinetics of glimepiride and cytochrome P450 2C9 genetic polymorphisms. Clin Pharmacol Ther. 2005;78(1):90–92. doi: 10.1016/j.clpt.2005.03.008. [DOI] [PubMed] [Google Scholar]
- 60.Kirchheiner J, Kudlicz D, Meisel C, Bauer S, Meineke I, Roots I, et al. Influence of CYP2C9 polymorphisms on the pharmacokinetics and cholesterol-lowering activity of (−)-3S,5R-fluvastatin and (+)-3R,5S-fluvastatin in healthy volunteers. Clin Pharmacol Ther. 2003;74(2):186–194. doi: 10.1016/S0009-9236(03)00121-8. [DOI] [PubMed] [Google Scholar]
- 61.Choi CI, Kim MJ, Chung EK, Lee HI, Jang CG, Bae JW, et al. CYP2C9 3 and 13 alleles significantly affect the pharmacokinetics of irbesartan in healthy Korean subjects. Eur J Clin Pharmacol. 2012;68(2):149–154. doi: 10.1007/s00228-011-1098-0. [DOI] [PubMed] [Google Scholar]
- 62.Cheng Y, Wang G, Zhang W, Fan L, Chen Y, Zhou HH. Effect of CYP2C9 and SLCO1B1 polymorphisms on the pharmacokinetics and pharmacodynamics of nateglinide in healthy Chinese male volunteers. Eur J Clin Pharmacol. 2013;69(3):407–413. doi: 10.1007/s00228-012-1364-9. [DOI] [PubMed] [Google Scholar]
- 63.Yoshida K, Maeda K, Sugiyama Y. Transporter-mediated drug–drug interactions involving OATP substrates: predictions based on in vitro inhibition studies. Clin Pharmacol Ther. 2012;91(6):1053–1064. doi: 10.1038/clpt.2011.351. [DOI] [PubMed] [Google Scholar]
- 64.Toda T, Eliasson E, Ask B, Inotsume N, Rane A. Roles of different CYP enzymes in the formation of specific fluvastatin metabolites by human liver microsomes. Basic Clin Pharmacol Toxicol. 2009;105(5):327–332. doi: 10.1111/j.1742-7843.2009.00453.x. [DOI] [PubMed] [Google Scholar]
- 65.Kantola T, Backman JT, Niemi M, Kivisto KT, Neuvonen PJ. Effect of fluconazole on plasma fluvastatin and pravastatin concentrations. Eur J Clin Pharmacol. 2000;56(3):225–229. doi: 10.1007/s002280000127. [DOI] [PubMed] [Google Scholar]
- 66.Kivisto KT, Kantola T, Neuvonen PJ. Different effects of itraconazole on the pharmacokinetics of fluvastatin and lovastatin. Br J Clin Pharmacol. 1998;46(1):49–53. doi: 10.1046/j.1365-2125.1998.00034.x. [DOI] [PMC free article] [PubMed] [Google Scholar]
- 67.Watanabe T, Kusuhara H, Maeda K, Kanamaru H, Saito Y, Hu Z, et al. Investigation of the rate-determining process in the hepatic elimination of HMG-CoA reductase inhibitors in rats and humans. Drug Metab Dispos. 2010;38(2):215–222. doi: 10.1124/dmd.109.030254. [DOI] [PubMed] [Google Scholar]
- 68.Niemi M, Pasanen MK, Neuvonen PJ. Organic anion transporting polypeptide 1B1: a genetically polymorphic transporter of major importance for hepatic drug uptake. Pharmacol Rev. 2011;63(1):157–181. doi: 10.1124/pr.110.002857. [DOI] [PubMed] [Google Scholar]