

Abstract
Cardiac transverse (T)-tubules provide a specialized structure for synchronization and stabilization of sarcoplasmic reticulum Ca2+ release in healthy cardiomyocytes. The application of laser scanning confocal microscopy and the use of fluorescent lipophilic membrane dyes have boosted the discoveries that T-tubule remodeling is a significant factor contributing to cardiac contractile dysfunction. However, the analysis and quantification of the remodeling of T-tubules have been a challenge and remain inconsistent among different research laboratories. Fast Fourier transformation (FFT) is the major analysis method applied to calculate the spatial frequency spectrum, which is used to represent the regularity of T-tubule systems. However, this approach is flawed because the density of T-tubules as well as non-T-tubule signals in the images influence the spectrum power generated by FFT. Preprocessing of images and topological architecture extracting is necessary to remove non-T-tubule noise from the analysis. In addition, manual analysis of images is time consuming and prone to errors and investigator bias. Therefore, we developed AutoTT, an automated analysis program that incorporates image processing, morphological feature extraction, and FFT analysis of spectrum power. The underlying algorithm is implemented in MATLAB (The MathWorks, Natick, MA). The program outputs the densities of transversely oriented T-tubules and longitudinally oriented T-tubules, power spectrum of the overall T-tubule systems, and averaged spacing of T-tubules. We also combined the density and regularity of T-tubules to give an index of T-tubule integrity (TTint), which provides a global evaluation of T-tubule alterations. In summary, AutoTT provides a reliable, easy to use, and fast approach for analyzing myocyte T-tubules. This program can also be applied to measure the density and integrity of other cellular structures.
Introduction
Studies of transverse tubules (T-tubules) in health and diseases have recently become an area of considerable interest in the cardiovascular field. T-tubules are orderly invaginations along the longitudinal axis of the plasma membrane in ventricular cardiomyocytes (1–5). Disruption of T-tubules in cardiomyocytes results in blunted and desynchronized Ca2+ events (6–8), contributing to the development and progression of heart failure. The application of laser scanning confocal microscopy and the use of fluorescent lipophilic membrane dyes have enabled high quality imaging of T-tubule systems, thus advancing studies of the relationship between T-tubule architectural remodeling and heart failure (7,9–17). Often T-tubule remodeling is grossly apparent by visual observations, yet more sophisticated analysis is required to quantify and compare changes in T-tubule ultrastructure. To date, however, there is no commonly shared analytical tool available to the field for analysis and quantitation of T-tubules and other cellular structures with regular patterns.
Currently, two major approaches have been used to quantify T-tubule remodeling. One approach measures the area (density) of T-tubules in cardiomyocytes as readout for T-tubule integrity (10–12,18–21). The caveat of this approach is that, in some cases, diseased cardiomyocytes lose the organization (or regularity) of T-tubules. Moreover, T-tubule area measurements are based on a threshold of pixel intensity, which is sensitive to image quality and distribution of pixel intensity and could thereby generate bias and influence the results. Another approach estimates the regularity of T-tubule systems by calculating the power of the frequency spectrum of spatially repeated tubular architectures (e.g., TTpower (15)). The most popular method currently used to achieve that calculation is fast Fourier transformation (FFT) of grayscale images (7,13,15,18–20,22–29). Spectrum power-based analysis takes into account signals of every pixel in the original image such that brighter pixels contribute more than darker ones, and non-T-tubule peripheral membrane also contributes to the spectrum power distribution. In addition to sensitivity to the quality and brightness of the image, the spectrum power is also impacted by the size of cells imaged.
Herein, we demonstrate an approach to analyze T-tubules with the following features: 1), eliminate the subjective bias generated by manual analysis and save time by automating the program; 2), image preprocessing to remove noise (i.e., peripheral membrane signals and non-T-tubule signals); 3), minimize the influence of brightness by converting grayscale images to binary (black and white); 4), analyze the topological architecture (sketches), rather than the raw image, to make the analysis results comparable between images; 5), normalize the measurements to improve comparisons between different experiments.
In this work, we describe the development of AutoTT, an automated analysis program, which achieves all the goals presented previously. We tested the functionality of the program by applying it to analyze the density and regularity of the T-tubule system in experimental images of ventricular myocytes. Our data provide clear evidence that AutoTT provides a reliable, easy to use, and rapid method to analyze T-tubules as well as other structures with regular patterns.
Materials and Methods
Isolation and culture of murine ventricular cardiomyocytes
Animal experiments were performed in accordance with the Guide for the Care and Use of Laboratory Animals (National Institutes of Health Publication No. 85-23, revised 1996) and were approved by the Institutional Animal Care and Use Committee at the University of Iowa. Adult primary mouse ventricular cardiomyocytes were enzymatically isolated as previously described (30). Briefly, mice were anesthetized by intraperitoneal injection with pentobarbital (120 mg/kg). Hearts were rapidly removed and perfused on a Langendorff system. Cardiomyocytes were isolated following collagenase II perfusion. The isolated cells were placed in Tyrode solution containing (in mM): 137 NaCl, 4.0 KCl, 1.2 NaH2PO4, 10 glucose, and 10 HEPES, at pH 7.4, adjusted with NaOH. Culture of adult cardiomyocytes was performed as previously described (30).
Confocal imaging of cardiomyocyte plasma membrane system and sarcomeres
Live cardiomyocytes were incubated with Di-8-ANNEPES for 30 min to stain the cell membrane. Antibodies against sarcomeric α-actinin (Sigma-Aldrich, St. Louis, MO) and RyR2 (Thermo Scientific, Waltham, MA) were used for labeling sarcomeres and junctional sarcoplasmic reticulum. Images were acquired with a Zeiss LSM 510 confocal microscope (Carl Zeiss MicroImaging GmbH, Jena, Germany). The dimension of the scanning area was set at 1024 pixels × 300 pixels with a spatial resolution of 0.144 μm/pixel.
Installation and usage of AutoTT
AutoTT was coded in MATLAB (Mathworks, Natick, MA), and was compiled to be a stand-alone Graphical Interactive application named AutoTTGUI.exe. MATLAB Compiler Runtime (MCR) R2013a (Windows version, 32-bit) is prerequired to run the AutoTT application. AutoTT is installed by copying AutoTTGUI.exe anywhere on a PC with a Windows operating system. AutoTT is freely available upon request. To run AutoTT, double click the icon. An annotated step-by-step explanation of this software is presented in Fig. S1 in the Supporting Material. Note that only 8-bit or 16-bit grayscale images can be processed by this program. If data are in RGB format, they must first be converted into grayscale.
Results and Discussion
Generation and validation of T-tubule analysis algorithm
Image preprocessing
An automated T-tubule analysis algorithm, termed AutoTT, was coded in MATLAB. The purpose of AutoTT is to effectively remove irrelevant signals while preserving the topological features of the tubular system to more accurately and reproducibly evaluate the T-tubule architecture in myocytes. Fig. 1 outlines the workflow for image preprocessing and quantitative analysis of the ultrastructure in isolated cardiomyocytes. For proper analysis, the longitudinal axis of cardiomyocyte in the image should be approximately parallel to the length (i.e., x axis) of the image, and the object of interest should be oriented in the center of the image and be the largest enclosed objects in the image. The program provides an optional function of thresholding images to remove obvious background noise before further image processing. Users can customize the thresholding level, though a high thresholding level is not recommended for preservation of architectural details. The input image (Fig. 1 A) was subjected to morphological opening (erosion followed by a dilation, using the same structuring element for both operations, see Fig. S2 for more information) to estimate the background of the image. A square whose size could be customized by users was used as the structuring element for morphological opening. After background subtraction, the contrast was increased by adjusting the range of the grayscale, and two-dimensional (2-D) adaptive filtering was applied to remove noise (smoothing). A representative preprocessed image is shown in Fig. 1 B.
Figure 1.
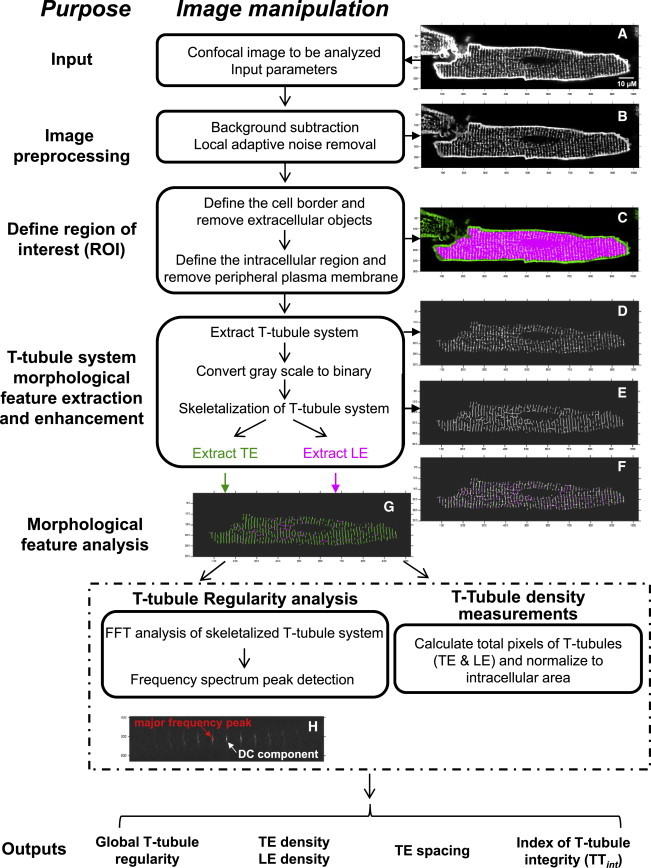
Flow diagram of the algorithm for AutoTT. (A) Example input image. (B–G): Representative processed images. (B) Image after background subtraction. (C) Merged image of B (green) and ROI (red), showing that the algorithm accurately defines the ROI. (D) Image obtained after extraction of the T-tubule system. (E) Image obtained after conversion of (D) from grayscale to a binary (black and white) image and skeletalization, which converts T-tubule elements of varying pixel widths to a single line. (F) Merged image of D and E, which shows that the skeletalized image accurately reflects the structure of T-tubule elements. (G) Image depicting extracted TE (green) and LE (red) from skeletalized image in E. (H) Representative magnitude image generated by the power spectrum analysis (2D-FFT) of a skeletalized image. Arrows indicate the major frequency peak, which is noted as a red ×, and the DC component, which is a measure of the accumulated input. See Table 1 for the definitions of nomenclatures and abbreviations used in the text and figures. To see this figure in color, go online.
Identification of the region of interest (ROI)
Next, the ROI was automatically detected. Because the ROI was the intracellular region (including the invaginations of T-tubules), peripheral cell membrane and extracellular objects were removed. The pixel intensity threshold (PIT), which was established before running the program, was applied to define the enclosed objects whose border pixels are brighter than PIT. This operation creates a binary mask image with same dimensions of the preprocessed image. All other pixels were erased to eliminate extracellular signals in the mask image. The resulting image contains only the largest enclosed object of interest. Next, the peripheral membrane was removed by erasing pixels brighter than PIT from the mask image. Because this also removed T-tubule regions that were brighter than PIT, morphological closing (dilation followed by an erosion, using the same structure element for both operations, see Fig. S2 for more information) was applied to recover those T-tubule regions. The resulting image contained only the ROI (Fig. S3 B). The removed regions are shown in Fig. S3 C. Fig. 1 C is a merged image of the ROI (red) and the preprocessed image (green), showing that the defined ROI accurately represents the intracellular region. If necessary, the PIT can be manually adjusted to fine-tune ROI detection.
Conversion to binary image and skeletalization
Next, the mask image was applied to the preprocessed image to extract the grayscale ROI. The next step was to perform morphological feature extraction and enhancement. The signal of the overall (or global) T-tubule system in the ROI was enhanced by subtracting background, which was established by morphological opening with an X-shaped structure element to preserve both the transverse elements (TE) and longitudinal elements (LE) of the global T-tubule system (Fig. 1 D). To preserve the morphology rather than the brightness of T-tubules, the background-subtracted ROI was then converted to a binary image using thresholding and edge detection. The global tubular architecture was then skeletalized to extract the morphological patterns rather than the diameter of T-tubules (Fig. 1 E). This key step in the algorithm allows unbiased comparison of images that vary in brightness and quality. Merging images in Fig. 1 D (ROI with background subtraction) and Fig. 1 E (binary skeletalized image) validates that skeletalization does not perturb the architecture of tubular elements (Fig. 1 F). To separate TE and LE from the global T-tubule system, morphological opening with a horizontal line-shaped structuring element was applied (Fig. 1 G, Fig. S3, F and G. See Table 1 for a definition of nomenclatures and abbreviations used in the text, and Fig. S2 for more information about algorithms used here).
Table 1.
Definition of nomenclatures and abbreviations used in the text
| Nomenclature and abbreviation | Definition |
|---|---|
| DC component | 0th order of the transformed series in FFT. It represents the summation of signals from all input pixels. |
| FFT | Fast Fourier transformation |
| (Global) T-tubules | The entire tubule system, including both TE and LE. |
| Global T-tubule regularity | The magnitude of the major frequency normalized to that of the DC component, calculated from skeletalized global T-tubule system of a cell. TTpower, previously defined as an index for T-tubule regularity in Wei et al. (15), is a measure of the magnitude of the major frequency without normalization. |
| PIT | Pixel intensity threshold, a value used for thresholding the input image based on the intensity of pixels, to detect ROI. |
| ROI | Region of interest, the intracellular region enclosed by the peripheral membrane. |
| TE density | The total number of pixels of skeletalized TE divided by the total Number of pixels of intracellular area (ROI). |
| LE density | The total number of pixels of skeletalized LE divided by the total number of pixels of intracellular area (ROI). |
| TE spacing | The average horizontal spatial interval between TE, derived from the spatial frequency. |
| TTint | Index of T-tubule integrity, which takes into account both regularity and density. For analysis of global T-tubules, TTint = global T-tubule density × global T-tubule regularity; for analysis of TE only, TTint = TE density × TE regularity. |
Quantitative analysis of the T-tubule system
The resulting images were subjected to morphological feature analysis including a variety of quantitative measurements. To analyze the regularity of the overall/global T-tubule system, 2-D FFT was applied to the skeletalized global T-tubule image (Fig. 1 E, including both TE and LE) and calculated the power spectrum in the spatial frequency domain. A 2-D peak detection program was used to automatically detect the magnitude of the direct current (DC) component (noted with a white arrow in Fig. 1 H) and the major (1st harmonic) frequency (marked with red × in Fig. 1 H) of the FFT. The DC component was defined as the transformed series at frequency 0, which represents the summation of signals of all pixels in the image. The major frequency was defined as the second highest peak. The program automatically calculates a parameter for peak detection. Users may check and optimize the peak detection parameters (Fig. S1) to make sure the automatic peak detection is correct at this step. Regularity is defined as the magnitude of the major frequency normalized to that of the DC component, which eliminates variability in magnitude associated with different cell sizes. Analysis of TE spacing and regularity was performed by subjecting the separated TE skeletal image (Fig. S3 F) to the same program module. The TE spacing was derived from the major frequency. This requires users to input the physical size represented by each pixel in their images. The densities of TE and LE were also determined using AutoTT by dividing the total pixels of TE or LE by the intracellular area of ROI. The global T-tubule density equals the summation of TE and LE densities.
To test the fidelity of AutoTT algorithm, we performed quantitative analysis of cardiomyocytes with different architectural abnormalities (Fig. 2). In Fig. 2 A, the myocyte has disordered TE and increased LE length though the global T-tubule density is relatively normal. In Fig. 2 B, the myocyte has a significant loss of TE and LE, but the regularity is not as severely disrupted as in the left image. Fig. 2 C is a ventricular myocyte with a normal T-tubule system. AutoTT outputs clearly reflect these obvious differences. For example, myocyte A has a higher global T-tubule density but lower regularity as compared with B.
Figure 2.

Analysis of three example images using AutoTT. (A–C) The original (top), skeletalized (middle), and magnitude (bottom) images of three different cardiomyocytes are shown. Shown at the bottom is a table of output values corresponding to the three cells. Global T-tubule regularity is defined as the magnitude of the major frequency peak (red arrow) divided by the DC component (white arrow), which measures the overall regularity of the global T-tubule system. TE density is the total number of TE pixels divided by the area of the ROI as determined in the skeletalized image. LE density is the total number of LE pixels divided by the area of the ROI as determined in the skeletalized image. TE spacing is determined by converting the major spatial frequency into distance, or period. Index of T-tubule integrity (TTint) takes into account the T-tubule regularity and density. To see this figure in color, go online.
Index of T-tubule integrity (TTint), an integrated measure of T-tubule density and regularity
In some cells with significant loss of the T-tubule system, the remaining T-tubules may have a high calculated regularity, if the remaining T-tubules are arrayed in an orderly pattern. To take consideration of both the density and regularity of the T-tubule system, we created an index of T-tubule integrity (TTint) where
This index represents the percentage of pixels arranged at the major frequency among the total intracellular pixels. Consistent with the significant remodeling, the TTint of myocyte A and B (Fig. 2) are both markedly lower than that of myocyte C. The presented TTint is for the global T-tubule system, for which global T-tubule density and global T-tubule regularity are applied, i.e., both TE and LE are included in the analysis. However, the program also enables users to calculate TTint for TE only using the same module. In this case, the TE density and TE regularity are used for calculation.
Superiority of AutoTT compared to other global thresholding and direct FFT analysis
The major advantage of our T-tubule analysis program is that only the morphological features rather than the brightness are taken into account. Accordingly, imaging quality and cell size should not influence the results of the analysis. To confirm this, we artificially increased the overall brightness of an image by 50%, and then subjected the original and brightness-enhanced images to image processing, skeletalization, and analysis with AutoTT (Fig. 3 A). The values obtained were very similar regardless of the image brightness. For comparison, we used the conventional, global thresholding method to estimate the density of T-tubules using a threshold = 80. As compared to the T-tubule density for the original image, the T-tubule density was overestimated by 78% in the brightness-enhanced image (Fig. 3 B). Similarly, applying different thresholds to a same image calculated very different T-tubule densities (Fig. S4). We also found that directly applying FFT to unprocessed images generated a significantly larger magnitude value at the major frequency for the brightness-enhanced image as compared to the original image (Fig. 3 C). These data provide clear evidence that the original image brightness may affect the readouts with both global thresholding and direct calculation of FFT magnitude, whereas AutoTT analysis yields comparable results regardless of image quality.
Figure 3.
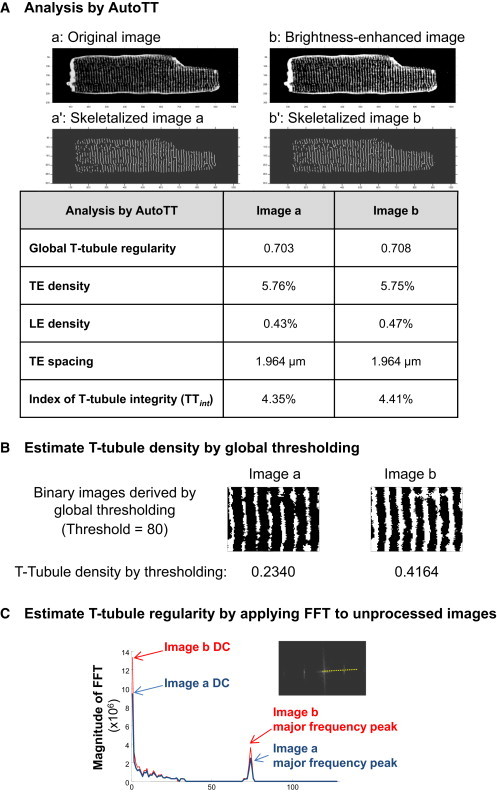
Results obtained with AutoTT are not limited by image quality as compared to global thresholding or FFT of unprocessed images. (A) Comparison of AutoTT analysis of original (image a) and brightness-enhanced images (image b). Image b is derived from image a with the brightness artificially enhanced. (B) Images a and b in (A) were converted from grayscale images to binary images and the T-tubule density determined using global thresholding. A rectangular region of each image is shown. (C) FFT was directly applied to the original image a and brightness-enhanced image b. The inset shows the sampling line (yellow dashed line) used for profiling the FFT magnitude. To see this figure in color, go online.
Evaluation of architectural defects in T-tubules in cultured cardiomyocytes
We next applied AutoTT to quantify alterations in T-tubules. Primary adult rodent cardiomyocytes undergo spontaneous loss of T-tubule integrity with prolonged culture (8,21,31,32). We applied AutoTT to T-tubule images of ventricular cardiomyocytes cultured for different times. Global T-tubule regularity and TTint decreased with increasing time in culture (Fig. 4). TE density also decreased with prolonged culture, consistent with previous reports (8,21,31–33). We also found with AutoTT that LE density was increased after extended culture of cardiomyocytes.
Figure 4.
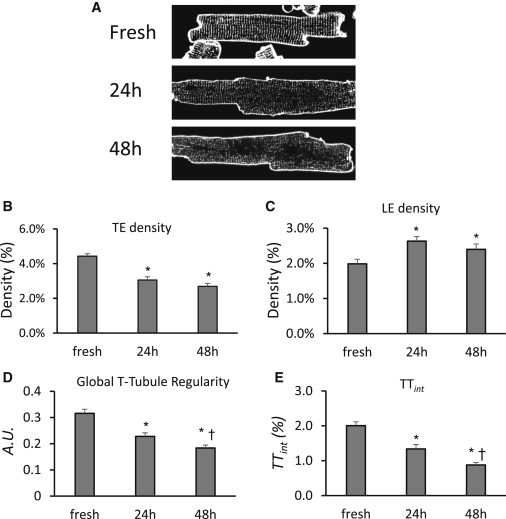
AutoTT analysis of T-tubule remodeling of adult murine ventricular cardiomyocytes in culture. (A) Examples of confocal images of freshly isolated myocytes and myocytes cultured for 24 or 48 h. Images were subjected to AutoTT analysis for TE (B) and LE (C) density, regularity (D), and integrity of Global T-tubules (TTint, E). ∗p < 0.05 vs. freshly isolated myocytes; †p < 0.01 vs. 24 h in culture. n = 36, 38, and 38 cells for fresh, 24 h in culture and 48 h in culture, respectively.
Application of AutoTT to quantitate sarcomere patterns
Sarcomere regularity and spacing are key indicators of cardiomyocyte mechanical function. We therefore examined the use of AutoTT to analyze sarcomere patterns in isolated cardiomyocytes (Fig. 5). Immunostaining with α-actinin (Fig. 5 A) or ryanodine receptor (RyR2, Fig. 5 B) shows the striated patterns of sarcomere and junctional sarcoplasmic reticulum, respectively. Adapting AutoTT to analyze these images reliably captured the sarcomere patterns. Moreover, AutoTT could be used to evaluate the regularity and spacing of sarcomeres (Fig. 5, insets) and other intracellular structures. These data highlight other possible applications for this algorithm besides analysis of T-tubule architecture.
Figure 5.

AutoTT analysis of sarcomere patterns in adult murine ventricular cardiomyocytes. Immunofluorescence images of mouse cardiomyocytes stained with antibodies against either α-actinin (A, upper left image) or RyR2 (B, upper right image) were analyzed by AutoTT. The middle images show the skeletalized sarcomere architecture. The lower plots show the analysis for sarcomere spacing and regularity. Insets show the magnitude images derived from 2D-FFT and the sampling line (yellow dashed line) used for plotting the power spectrum. To see this figure in color, go online.
In conclusion, we present here a freely available automated program, AutoTT, for analyzing regularity and integrity of T-tubules (including transverse and longitudinal elements) and sarcomere system in cardiomyocytes. Because the underlying analysis algorithm takes architectural features rather than pixel brightness into account, results obtained with AutoTT can be compared with each other regardless of the brightness of individual images. This approach results in a reproducible and unbiased estimation of the myocyte T-tubule system.
Acknowledgments
This work was supported by National Heart, Lung and Blood Institute R01 HL090905 (L.S.S.), and American Heart Association Midwest Postdoctoral Fellowship 13POST14630077 (A.G.).
Supporting Material
References
- 1.Brette F., Orchard C. T-tubule function in mammalian cardiac myocytes. Circ. Res. 2003;92:1182–1192. doi: 10.1161/01.RES.0000074908.17214.FD. [DOI] [PubMed] [Google Scholar]
- 2.Guo A., Zhang C., Song L.S. Emerging mechanisms of T-tubule remodelling in heart failure. Cardiovasc. Res. 2013;98:204–215. doi: 10.1093/cvr/cvt020. [DOI] [PMC free article] [PubMed] [Google Scholar]
- 3.McNutt N.S. Ultrastructure of the myocardial sarcolemma. Circ. Res. 1975;37:1–13. doi: 10.1161/01.res.37.1.1. [DOI] [PubMed] [Google Scholar]
- 4.Song L.S., Guatimosim S., Lederer W.J. Calcium biology of the transverse tubules in heart. Ann. N. Y. Acad. Sci. 2005;1047:99–111. doi: 10.1196/annals.1341.009. [DOI] [PMC free article] [PubMed] [Google Scholar]
- 5.Sun X.H., Protasi F., Franzini-Armstrong C. Molecular architecture of membranes involved in excitation-contraction coupling of cardiac muscle. J. Cell Biol. 1995;129:659–671. doi: 10.1083/jcb.129.3.659. [DOI] [PMC free article] [PubMed] [Google Scholar]
- 6.Smyrnias I., Mair W., Bootman M.D. Comparison of the T-tubule system in adult rat ventricular and atrial myocytes, and its role in excitation-contraction coupling and inotropic stimulation. Cell Calcium. 2010;47:210–223. doi: 10.1016/j.ceca.2009.10.001. [DOI] [PubMed] [Google Scholar]
- 7.Song L.S., Sobie E.A., Cheng H. Orphaned ryanodine receptors in the failing heart. Proc. Natl. Acad. Sci. USA. 2006;103:4305–4310. doi: 10.1073/pnas.0509324103. [DOI] [PMC free article] [PubMed] [Google Scholar]
- 8.Louch W.E., Bito V., Sipido K.R. Reduced synchrony of Ca2+ release with loss of T-tubules-a comparison to Ca2+ release in human failing cardiomyocytes. Cardiovasc. Res. 2004;62:63–73. doi: 10.1016/j.cardiores.2003.12.031. [DOI] [PubMed] [Google Scholar]
- 9.Dibb K.M., Clarke J.D., Trafford A.W. Characterization of an extensive transverse tubular network in sheep atrial myocytes and its depletion in heart failure. Circ. Heart Fail. 2009;2:482–489. doi: 10.1161/CIRCHEARTFAILURE.109.852228. [DOI] [PubMed] [Google Scholar]
- 10.He J., Conklin M.W., Kamp T.J. Reduction in density of transverse tubules and L-type Ca(2+) channels in canine tachycardia-induced heart failure. Cardiovasc. Res. 2001;49:298–307. doi: 10.1016/s0008-6363(00)00256-x. [DOI] [PubMed] [Google Scholar]
- 11.Heinzel F.R., Bito V., Sipido K. Remodeling of T-tubules and reduced synchrony of Ca2+ release in myocytes from chronically ischemic myocardium. Circ. Res. 2008;102:338–346. doi: 10.1161/CIRCRESAHA.107.160085. [DOI] [PubMed] [Google Scholar]
- 12.Lyon A.R., MacLeod K.T., Gorelik J. Loss of T-tubules and other changes to surface topography in ventricular myocytes from failing human and rat heart. Proc. Natl. Acad. Sci. USA. 2009;106:6854–6859. doi: 10.1073/pnas.0809777106. [DOI] [PMC free article] [PubMed] [Google Scholar]
- 13.Swift F., Franzini-Armstrong C., Louch W.E. Extreme sarcoplasmic reticulum volume loss and compensatory T-tubule remodeling after Serca2 knockout. Proc. Natl. Acad. Sci. USA. 2012;109:3997–4001. doi: 10.1073/pnas.1120172109. [DOI] [PMC free article] [PubMed] [Google Scholar]
- 14.Wagner E., Lauterbach M.A., Lehnart S.E. Stimulated emission depletion live-cell super-resolution imaging shows proliferative remodeling of T-tubule membrane structures after myocardial infarction. Circ. Res. 2012;111:402–414. doi: 10.1161/CIRCRESAHA.112.274530. [DOI] [PMC free article] [PubMed] [Google Scholar]
- 15.Wei S., Guo A., Song L.S. T-tubule remodeling during transition from hypertrophy to heart failure. Circ. Res. 2010;107:520–531. doi: 10.1161/CIRCRESAHA.109.212324. [DOI] [PMC free article] [PubMed] [Google Scholar]
- 16.Chen B., Li Y., Song L.S. beta-Adrenergic receptor antagonists ameliorate myocyte T-tubule remodeling following myocardial infarction. FASEB.J. 2012;26:2531–2537. doi: 10.1096/fj.11-199505. [DOI] [PMC free article] [PubMed] [Google Scholar]
- 17.Xie Y.P., Chen B., Song L.S. Sildenafil prevents and reverses transverse-tubule remodeling and Ca(2+) handling dysfunction in right ventricle failure induced by pulmonary artery hypertension. Hypertension. 2012;59:355–362. doi: 10.1161/HYPERTENSIONAHA.111.180968. [DOI] [PMC free article] [PubMed] [Google Scholar]
- 18.Chung K.Y., Kang M., Walker J.W. Contractile regulation by overexpressed ETA requires intact T tubules in adult rat ventricular myocytes. Am. J. Physiol. Heart Circ. Physiol. 2008;294:H2391–H2399. doi: 10.1152/ajpheart.00011.2008. [DOI] [PubMed] [Google Scholar]
- 19.Ibrahim M., Siedlecka U., Terracciano C.M. A critical role for Telethonin in regulating t-tubule structure and function in the mammalian heart. Hum. Mol. Genet. 2013;22:372–383. doi: 10.1093/hmg/dds434. [DOI] [PMC free article] [PubMed] [Google Scholar]
- 20.Kemi O.J., Hoydal M.A., Wisloff U. The effect of exercise training on transverse tubules in normal, remodeled, and reverse remodeled hearts. J. Cell. Physiol. 2011;226:2235–2243. doi: 10.1002/jcp.22559. [DOI] [PMC free article] [PubMed] [Google Scholar]
- 21.Pavlović D., McLatchie L.M., Shattock M.J. The rate of loss of T-tubules in cultured adult ventricular myocytes is species dependent. Exp. Physiol. 2010;95:518–527. doi: 10.1113/expphysiol.2009.052126. [DOI] [PubMed] [Google Scholar]
- 22.Wu C.Y., Jia Z., Lin R.Z. PI3Ks maintain the structural integrity of T-tubules in cardiac myocytes. PLoS ONE. 2011;6:e24404. doi: 10.1371/journal.pone.0024404. [DOI] [PMC free article] [PubMed] [Google Scholar]
- 23.Aistrup G.L., Gupta D.K., Wasserstrom J.A. Inhibition of the late sodium current slows t-tubule disruption during the progression of hypertensive heart disease in the rat. Am. J. Physiol. Heart Circ. Physiol. 2013;305:H1068–H1079. doi: 10.1152/ajpheart.00401.2013. [DOI] [PMC free article] [PubMed] [Google Scholar]
- 24.Shah S.J., Aistrup G.L., Wasserstrom J.A. Ultrastructural and cellular basis for the development of abnormal myocardial mechanics during the transition from hypertension to heart failure. Am. J. Physiol. Heart Circ. Physiol. 2014;306:H88–H100. doi: 10.1152/ajpheart.00642.2013. [DOI] [PMC free article] [PubMed] [Google Scholar]
- 25.Hong T.T., Smyth J.W., Shaw R.M. BIN1 localizes the L-type calcium channel to cardiac T-tubules. PLoS Biol. 2010;8:e1000312. doi: 10.1371/journal.pbio.1000312. [DOI] [PMC free article] [PubMed] [Google Scholar]
- 26.Sacconi L., Ferrantini C., Pavone F.S. Action potential propagation in transverse-axial tubular system is impaired in heart failure. Proc. Natl. Acad. Sci. USA. 2012;109:5815–5819. doi: 10.1073/pnas.1120188109. [DOI] [PMC free article] [PubMed] [Google Scholar]
- 27.Chen B., Guo A., Song L.S. Critical roles of junctophilin-2 in T-tubule and excitation-contraction coupling maturation during postnatal development. Cardiovasc. Res. 2013;100:54–62. doi: 10.1093/cvr/cvt180. [DOI] [PMC free article] [PubMed] [Google Scholar]
- 28.Reynolds J.O., Chiang D.Y., Wehrens X.H. Junctophilin-2 is necessary for T-tubule maturation during mouse heart development. Cardiovasc. Res. 2013;100:44–53. doi: 10.1093/cvr/cvt133. [DOI] [PMC free article] [PubMed] [Google Scholar]
- 29.van Oort R.J., Garbino A., Wehrens X.H. Disrupted junctional membrane complexes and hyperactive ryanodine receptors after acute junctophilin knockdown in mice. Circulation. 2011;123:979–988. doi: 10.1161/CIRCULATIONAHA.110.006437. [DOI] [PMC free article] [PubMed] [Google Scholar]
- 30.Guo A., Cala S.E., Song L.S. Calsequestrin accumulation in rough endoplasmic reticulum promotes perinuclear Ca2+ release. J. Biol. Chem. 2012;287:16670–16680. doi: 10.1074/jbc.M112.340927. [DOI] [PMC free article] [PubMed] [Google Scholar]
- 31.Banyasz T., Lozinskiy I., Balke C.W. Transformation of adult rat cardiac myocytes in primary culture. Exp. Physiol. 2008;93:370–382. doi: 10.1113/expphysiol.2007.040659. [DOI] [PubMed] [Google Scholar]
- 32.Mitcheson J.S., Hancox J.C., Levi A.J. Action potentials, ion channel currents and transverse tubule density in adult rabbit ventricular myocytes maintained for 6 days in cell culture. Pflugers Arch. 1996;431:814–827. doi: 10.1007/s004240050073. [DOI] [PubMed] [Google Scholar]
- 33.Zhang C., Chen B., Song L.S. Microtubule-mediated defects in junctophilin-2 trafficking contribute to myocyte transverse-tubule remodeling and Ca2+ handling dysfunction in heart failure. Circulation. 2014;129:1742–1750. doi: 10.1161/CIRCULATIONAHA.113.008452. [DOI] [PMC free article] [PubMed] [Google Scholar]
Associated Data
This section collects any data citations, data availability statements, or supplementary materials included in this article.