

Abstract
Molecular chaperones prevent aggregation and misfolding of proteins but scarcity of structural data has impeded an understanding of the recognition and anti-aggregation mechanisms. Here we report the solution structure, dynamics and energetics of three Trigger Factor (TF) chaperone molecules in complex with alkaline phosphatase (PhoA) captured in the unfolded state. Our data show that TF uses multiple sites to bind to several regions of the PhoA substrate protein primarily through hydrophobic contacts. NMR relaxation experiments show that TF interacts with PhoA in a highly dynamic fashion but as the number and length of the PhoA regions engaged by TF increases, a more stable complex gradually emerges. Multivalent binding keeps the substrate protein in an extended, unfolded conformation. The results show how molecular chaperones recognize unfolded polypeptides and how by acting as unfoldases and holdases prevent the aggregation and premature (mis)folding of unfolded proteins.
Molecular chaperones maintain a functional proteome in the cell by preventing the aggregation of unfolded proteins, assisting with their folding or disassembling aggregates (1–6). Nascent polypeptide chains emerging from the exit channel of the ribosome expose long hydrophobic regions that are particularly prone to misfolding and aggregation (7–9). The bacterial Trigger Factor (TF) (10) binds next to the exit channel of the ribosome (11–15) and directly interacts with the emerging nascent polypeptide (16–19). With an estimated cellular concentration of ~50 μM (20), TF is one of the most abundant proteins in bacteria. TF prevents the aggregation and premature folding of nascent polypeptides, and unfolded proteins in vivo and in vitro, likely by interacting with exposed hydrophobic regions thereby shielding them from the solvent (18, 21–23). Long polypeptides (>20 kDa), which are the preferred clients for TF in vivo (24, 25), require multiple TF molecules for their protection. TF remains bound to the unfolded polypeptide even after having departed the ribosome (18, 21, 22, 26). TF reduces the speed of folding, thereby increasing the yield of biologically active proteins (21, 27–29). Interestingly, TF was shown to have both a weak holdase and an unfoldase activity (30). Deletion of the TF gene results in the aggregation of many proteins (25) and the stimulation of heat-shock response (31–33). Following its interaction with TF, the unfolded polypeptide folds by dissociating, interacting with foldase chaperones such as Hsp70 and GroEL, or enter the post-translational secretory pathway to interact with the Sec machinery (2, 3, 5, 34–36).
Despite the importance of chaperone binding to unfolded proteins, the structural basis of this interaction remains poorly understood. The scarcity of structural data on complexes between chaperones and unfolded proteins is primarily due to technical challenges associated with the size and dynamic nature of these complexes (37–42). We have exploited recent advances in NMR and isotope labeling approaches (43–48) to characterize the dynamic binding of unfolded PhoA to TF and to determine the solution structure of the PhoA captured in an extended, unfolded state by three TF molecules.
NMR of TF Chaperone and Unfolded PhoA
E. coli TF consists of 432 amino acids, comprising the ribosome-binding domain (RBD; residues 1-112), the peptidyl prolyl isomerase domain (PPD, residues 150-246), and a discontinuous C-terminal domain, positioned structurally between RBD and PPD (12), which, on the basis of the current and previous findings (49, 50), we refer to as the substrate-binding domain (SBD, residues 113-149 and 247-432) (Fig. 1A and fig. S1A,B). Unliganded TF in solution forms a dimer (27) of ~100 kDa (fig. S1C) (Kd of dimerization is ~18 μM (51)). The quality of the 1H-15N correlated NMR spectra (figs. S2A and S3) and the 1H-13C correlated NMR spectra of methyl-bearing (Ala, Ile, Met, Leu, Thr and Val) and aromatic (Phe, Trp and Tyr) residues of TF is high (figs. S2B and S4). By exploiting the modular structural architecture of TF (52, 53) we have obtained near complete assignment of TF (see materials and methods).
Fig. 1. Substrate-binding sites in TF.

(A) The TF residues identified by NMR to interact with unfolded protein substrates are colored blue on the crystal structure of free E. coli TF (PDB ID 1W26). The four main binding sites are labeled A, B, C, and D (in red). The dashed lines indicate the domain boundaries. The two structural protrusions in SBD are labeled arm 1 and arm 2. An additional binding site, located in arm 1, is used by TF to interact with some of the substrates (see Fig. 7A and fig. S11). (B) Expanded view of the four substrate-binding sites in TF identified by the NMR titration experiments. The hydrophobic residues that make up the substrate-binding sites are shown as sticks. (C) The hydrophobic residues in TF are colored green whereas all other residues are colored white. (D) TF sequence conservation is color mapped on the TF structure. The residues that make up the substrate-binding sites are the best conserved along with the ribosome-binding loop (RB loop) (see fig. S12).
E. coli alkaline phosphatase (PhoA) is a ~50-kDa (471 amino acid residues) periplasmic enzyme that requires oxidizing conditions for folding, as do several other periplasmic proteins (54). PhoA was shown biochemically to be in an unfolded and thus degradation-prone state in the reducing environment of the cytosol (54–56) and to interact extensively with TF (57, 58). The NMR spectra of PhoA as well as relaxation experiments confirmed that PhoA is unfolded under reducing conditions (figs. S5B,C and S6). Assessment of the presence of secondary structure by NMR (59) revealed pervasive random coil and extended-like conformations, although several of the regions that form stable secondary structure in the folded PhoA retained a fraction of their fold in unfolded PhoA (Fig. 2A,B).
Fig. 2. TF-binding sites and secondary structure in unfolded PhoA.

(A) Secondary structure propensity (SSP) values (59) of unfolded PhoA plotted as a function of the amino acid sequence. A SSP score at a given residue of 1 or −1 reflects a fully formed α-helical or β-structure (extended), respectively, whereas a score of, for example, 0.5 indicates that 50% of the conformers in the native state ensemble of the protein are helical at that position. The data show that several of the secondary structure elements in the folded PhoA retain some transient structure in the unfolded PhoA. The TF-binding sites (a–g) are indicated. (B) SSP values of unfolded PhoA that correspond to secondary structure elements present in folded PhoA are mapped on the structure of folded E. coli PhoA. The signal sequence region (residues 1-22) was modeled into the crystal structure of the mature form (PDB ID 1Y6V). Only one subunit of the dimeric PhoA is shown. (C) Plot of the hydrophobicity of PhoA as a function of its primary sequence. A hydrophobicity score (Roseman algorithm, window=9) higher than zero denotes increased hydrophobicity. The seven PhoA regions (labeled a through g) identified by NMR to interact with TF are highlighted in grey. (D) Mapping of the TF-binding sites (a to g) on the folded PhoA structure.
The NMR spectra of unfolded proteins typically show very narrow chemical shift dispersion (60). To simplify NMR characterization of unfolded PhoA, which is a large protein by NMR standards, we generated a number of PhoA fragments of varying length that spanned its entire sequence (see materials and methods). Superposition of the NMR spectra of any of the PhoA fragments with the NMR spectra of the full-length PhoA demonstrated excellent resonance correspondence (fig. S5D). This is expected since each of these fragments is unfolded, as is the full-length PhoA, and thus the conformational properties of the isolated fragments recapitulate those of the full-length PhoA. Near complete assignment has been obtained for full-length PhoA.
Interaction between TF and PhoA
To determine the residues of unfolded PhoA that are recognized and bound by TF, we monitored by NMR the binding of isotopically labeled PhoA by unlabeled TF (fig. S7). In addition to full-length PhoA, several PhoA fragments were used to enhance spectral resolution (fig. S7A). Differential line broadening analysis (61) showed that only a relatively small number of residues (~130 out of the 471) in PhoA are recognized and bound by TF (Fig. 2C). There are in total 7 distinct TF-binding regions in PhoA (labeled using lower case italics letters; a through g), with lengths ranging from ~8 to ~40 residues (Fig. 2C and fig. S8A). Analysis of the primary sequence of the TF-binding sites showed that they are enriched in hydrophobic and especially aromatic residues (figs. S8B,C and S9), in agreement with previous studies (18, 62). Notably, there seems to be a correlation between the hydrophobicity of the PhoA sequence and the binding preference by TF (Fig. 2C).
To identify the sites that TF uses to interact with PhoA, we monitored by NMR the binding of full-length PhoA as well as select PhoA fragments comprising TF-binding sites to labeled TF (figs. S2C,D and S10). The combined data demonstrated that TF uses four distinct sites to interact with PhoA (labeled using upper case letters; A through D). Three of these sites (A, B, and C) are located in the SBD (Fig. 1A), in agreement with previous data indicating this domain as being the central chaperone module (49, 50). The fourth binding site (labeled D) is located in the PPD and overlaps with its catalytic site (Fig. 1B). All sites are composed primarily of hydrophobic residues (Fig. 1B,C). NMR titration of additional protein substrates (such as the maltose binding protein (MBP) and the outer membrane protein A (OmpA)) to TF demonstrated that the same sites are used by TF to interact with these substrates (fig. S11). The substrate-binding sites are the best conserved regions in TF, along with the region in RBD that binds to the ribosome (Fig. 1D and fig. S12). Residues located in the identified substrate-binding sites were previously reported to crosslink to the emerging nascent chain when TF is bound to the ribosome (49, 50). Although the RBD surface is very hydrophobic, our data show that this domain does not interact with the protein substrates (Fig. 1A and fig. S11). In contrast, RBD was seen to cross-link to nascent chains in ribosome-bound TF (49, 50). This discrepancy may be due to the physical proximity of RBD to the exit channel of the ribosome or RBD may undergo conformational change upon interacting with the ribosome that enables its interaction with the nascent polypeptide (13, 18).
The crystal structure of free TF (12) shows that the identified substrate-binding sites (A–D) consist almost exclusively of nonpolar residues (Fig. 1C). Sites A, B, and C are enriched with methyl-bearing residues and site D is enriched with aromatic residues (Fig. 1B). Thus, the use of hydrophobic sites to interact with unfolded client proteins is shared among several molecular chaperones, such as GroEL, Skp, Hsp40 and Hsp90 (63, 64). Sites A and B are located inside the cradle-like structure formed by RBD and SBD, with A located at the base of the cradle and B located at the tip of arm 2 (Fig. 1A). Site C forms a rather elongated ridge near the β-sheet that connects SBD and PPD. Sites A, B, C, and D expose ~530 Å2, ~680 Å2, ~460 Å2, and ~650 Å2, respectively, of hydrophobic surface, thus providing combined up to ~2,300 Å2 of solvent-exposed nonpolar surface available for binding of protein substrates. The four TF sites extend over a distance of more than 90 Å.
Mode of Binding between TF and PhoA
We characterized by NMR and ITC the binding and energetics of each of the PhoA sites, individually and in combination to TF. Both chemical shift and intermolecular TF-PhoA NOE measurements were used to monitor the interaction at the residue level. Starting from the N terminus, the first PhoA region to interact with TF is site a (Fig. 2C and 3A). Chemical shift perturbation as well as intermolecular TF-PhoA NOEs (fig. S13) clearly indicated that PhoA site a can interact with all four of the binding sites in TF with a moderate affinity (Kd ~25 μM; Fig. 3B). Similarly, PhoA site b can interact with any of the four binding sites in TF but with lower affinity (Kd ~200 μM; Fig. 3C). In contrast, PhoA subsite c1 (the N-terminal region of site c; Fig. 3A) binds exclusively to the SBD, and preferably to TF sites A and B (on the basis of chemical shift perturbation subsite c1 appears to bind to TF site C but no intermolecular NOEs were detected indicating a rather transient interaction; Fig. 3D). Interestingly, PhoA subsite c2 (the middle region of site c; Fig. 3A) interacts exclusively with TF site A (Fig. 3E). The binding to TF of a PhoA fragment consisting of subsites c1 and c2 is determined by the combined binding preferences of the subsites (Fig. 3F). The PhoA c1-c2 fragment binds to TF with higher affinity than the subsites c1 and c2 individually because of avidity (Fig. 3D–F). Notably, the complete PhoA site c (consisting of subsites c1, c2 and c3) binds to TF in a specific orientation and arrangement: PhoA subsite c1 binds to TF site B, subsite c2 binds to TF site A, and subsite c3 binds to TF site C, as demonstrated by the measurement of a unique set of characteristic intermolecular NOEs between the TF sites and the PhoA subsites (Fig. 3G). PhoA site c binds only to TF sites A, B, and C in the SBD, and with higher affinity (Kd ~10 μM) than PhoA sites a or b. Thus, PhoA sites a and b can only interact with TF site D in the context of the PhoAa-c fragment (the superscript denotes the TF-binding sites that the PhoA fragment contains). Because PhoA site a binds with much higher affinity to TF than PhoA site b (Fig. 3B,C), in the TF–PhoAa-c complex PhoA site a binds to TF site D whereas PhoA site b does not interact at all with TF (Fig. 3H). The affinity of the PhoAa-c for TF (Kd ~2 μM; fig. S14) is higher than any of the other PhoA sites.
Fig. 3. Dynamic binding and energetics of PhoA by TF.

(A) TF-binding sites in PhoA colored as in Fig. 2A. Three TF molecules are required for the simultaneous engagement of the entire PhoA. The Kd for each complex is shown. PhoA residues of sites a, b, and c whose intermolecular NOEs to TF residues are depicted on panels B to G are indicated. (B to G). The interaction of the independent PhoA site a (B), site b (C), subsite c1 (D), subsite c2 (E), subsites c1-c2 (F) and subsites c1-c2-c3 (site c) (G) with TF has been characterized by NMR and ITC. The four PhoA-binding sites in TF (A to D) are labeled in pink. In the rectangles labeled “HSQC peaks” representative peaks from 1H-15N correlated spectra of labeled TF (TFSBD-PPD) free (grey) and in complex (magenta) with the indicated PhoA site are shown. In the rectangles labeled “Inter-NOEs TF-PhoA” representative inter-molecular NOEs between the TF and PhoA residues are shown. The full NOESY strips are shown in fig. S13. The symbol X indicates the absence of such NOEs. The Kd values were determined by ITC and NMR. Solid arrows indicate experimentally observed binding of the PhoA site to the designated TF site. Broken arrows indicate transient interaction observed by chemical shift perturbation but for which no intermolecular NOEs were detected. The orange cross-peak (marked with an asterisk) for TF site A in panel F corresponds to the chemical shift observed for the binding of the individual subsite c2 to TF site A shown in panel E. Similarly, the orange and dark orange cross-peaks marked with asterisks in panel G for TF site B correspond to the chemical shifts for the binding of the individual subsite c1 (panel D) and the fragment c1-c2 (panel F), respectively. All these resonances fall on the same line connecting the free and PhoA site c-bound TF peaks (93), further supporting the observed synergistic binding between the PhoA sites as the length of PhoA increases, as well as the selectivity of certain PhoA sites for specific TF sites. (H) The progressive increase in PhoA length results in increased affinity for PhoA interaction with TF and when PhoA is sufficiently long to engage all four of the TF sites simultaneously, as is the case with PhoAa-c, a unique binding mode between PhoA and TF is observed as shown in this panel. The binding of PhoA to TF can be described by a rugged free energy landscape, with the conformational arrangement of the TF–PhoAa-c complex depicted in this panel corresponding to the lowest-energy, ground-state structure. The binding interactions shown in panels B to G correspond to higher energy states. The results for the interaction of PhoA sites d to g with TF are shown in fig. S17. (I,J) Representative relaxation dispersion profiles of three TF residues in complex with PhoA site a (I) and PhoAa-c (J). R2eff is the effective transverse relaxation rate, and νCPMG is the refocusing frequency of the CPMG train pulse. (K) Exchange rate constants (kex) determined experimentally for the complex between TF and PhoAa-c. The residence time of PhoAa-c bound to TF is ~20 ms at 25 °C.
The results clearly show that although some PhoA sites (e.g., sites a and b) bind promiscuously to all TF sites, other PhoA sites (e.g., subsite c1) are more selective and some sites (e.g., subsite c2) appear to interact exclusively with specific sites in TF. Therefore, the binding mode of a multi-site PhoA fragment to TF will be determined by the combined preferences of the sites (Fig. 3H). Taken together, the data demonstrate that the interaction of TF and PhoA is dynamic and is best described by a rugged free energy landscape: the various binding interactions shown in panels B to G of Fig. 3 do not maximize the binding interface and correspond to the higher energy wells, while the maximum-contact arrangement shown in Fig. 3H corresponds to the ground-state, lowest-energy conformation of the complex in which a unique arrangement of the chaperone and the substrate is observed experimentally (Fig. 3H).
The NMR data showed that one TF molecule can accommodate a PhoA fragment encompassing TF-binding sites a to c (PhoAa-c) (Fig. 3 and figs. S14, S15). Under stoichiometric conditions, the use of a longer PhoA fragment that included site d (PhoAa-d) resulted in this site not being bound by TF (fig. S16A). Site d was bound only when excess TF was added (fig. S16A). Using the experimental approach described in Fig. 3 for the N-terminal region of PhoA, we found that a second TF molecule is required to fully engage PhoA sites d and e (fragment PhoAd-e) and a third TF molecule to fully interact with PhoA sites f and g (fragment PhoAf-g) (Fig. 3A and fig. S17). PhoA sites d and f bound exclusively to TF PPD (fig. S17B,E), whereas sites e and g bound exclusively to TF SBD in the binding arrangement shown in Fig. 4A and fig. S17C,F. Similarly to the TF–PhoAa-c complex, a unique arrangement was observed for the TF–PhoAd-e complex, as demonstrated by the measurement of a unique set of characteristic intermolecular NOEs between TF and PhoA (fig. S17D). In contrast, two binding arrangements were observed for the TF–PhoAf-g complex as shown in fig. S17G, but with one of them being the preferred one (populated by more than 70% of the time) (Fig. 4A).
Fig. 4. Structural basis for the formation of the TF–PhoA complexes.

(A) Schematic for the interaction of PhoA with TF based on the current structural data. The TF-binding sites in PhoA are colored as in Fig. 2 and 3A. (B to D) Lowest-energy structure of the three TF molecules in complex with the corresponding PhoA regions. TF is shown as a solvent-exposed surface and PhoA as a pink ribbon. The PhoA residues that directly interact with TF are drawn in a ball-and-stick representation, colored as in panel A. The pink arrows denote the direction of the PhoA chain, from the N to the C terminus. Close-up views of the structures are shown on the left for PPD (site D) and on the right for SBD (sites A, B, and C) bound to the corresponding PhoA sites. In the expanded views, the TF backbone is shown as a white cartoon whereas the PhoA backbone as a pink cartoon. The side chains of TF are colored blue, whereas the side chains of PhoA are colored using the color code for each site. The black broken lines denote hydrogen bonds (present in at least 70% of the conformers of the ensemble).
NMR titration experiments showed that three TF molecules are required to bind to all of the seven TF-binding sites in full-length PhoA (Fig. 4A). The stoichiometry of the TF–PhoA complexes was further corroborated by ITC experiments (fig. S14). Thermodynamic characterization showed that TF formed complexes with the three PhoA fragments (PhoAa-c, PhoAd-e, and PhoAf-g) with Kd values of ~2 μM, ~4 μM, and ~14 μM, respectively (Fig. 3A and fig. S14). The binding arrangement shown for the three TF molecules bound to PhoA sites a through g depicted collectively in Fig. 4A represent the lowest-energy conformational states for the three complexes. The binding avidity among the proximal PhoA sites and subsites, enhanced by the proximity of the A, B, and C sites in TF, further accounts for the higher stability of the observed ground-state conformations. This observation is confirmed by additional NMR titration experiments (fig. S16B).
Dynamic Engagement of PhoA by TF
Rapid binding and release of unfolded proteins by molecular chaperones is likely important for a productive assisted-folding process (5). To determine the kinetics of PhoA binding to TF we used NMR relaxation dispersion (65, 66). This powerful technique allows characterization of the dynamic interaction of protein complexes at the residue level. In the case of the interaction between TF and PhoA, the kinetics are as follows:
where kon and koff are the association and dissociation rate constants, and [PhoA] is the concentration of unbound PhoA. The exchange rate constant, kex, of complex formation is given by: kex=kon[PhoA]+koff. We have used 15N relaxation dispersion experiments (67, 68) to determine the kex, and thus kon, koff, and the residence time τ (=1/koff) (69, 70), of PhoA binding to TF (Fig. 3I). The data show that individual PhoA sites, such as a and d, interact rapidly with TF and they stay bound to TF only for a very limited time (τ~1 ms). As expected, the binding of larger PhoA fragments such as PhoAa-c or PhoAd-e, which bind to TF with much higher affinity (Fig. 3A), results in increased complex lifetimes. However, even in theses cases, the kinetics remain fast with the residence time being only ~20 ms at 25 °C (Fig. 3K). The data are consistent with previous findings reporting similar rapid kinetics for the binding of TF to protein substrates (71). Thus, even when TF fully engages its unfolded protein substrate by using all of its available binding sites, the complex is still quite dynamic with both fast association (kon ~2 × 10⁷ M−1 s−1) and dissociation (koff ~50 s−1) rates, as determined by relaxation dispersion.
Structural Basis for the Formation of the TF–PhoA Complex
The three TF molecules in complex with PhoA (Fig. 4A) are linked by long (~80–90 amino acids), flexible regions of PhoA that are not bound by TF. Thus, the three PhoA-bound TF molecules tumble and behave as independent entities, corroborated by NMR data of the full-length PhoA in complex with three TF molecules (fig. S7A, S15). We thus determined the high-resolution structure of each of the three complexes (TF–PhoAa-c, TF–PhoAd-e, and TF–PhoAf-g; Fig. 4A) separately. In each case, the structure determined by NMR corresponded to the ground-state, lowest energy structure. A large number of inter-molecular NOEs were collected due to the large interacting surface between TF and PhoA and the high sensitivity provided by the methyl-bearing and aromatic residues of the NMR spectra. The structure and NMR statistics are listed in Table S1. Resonance dispersion of PhoA increases markedly in its complexes with TF (fig. S10A,B), owing to the intimate contacts between the two proteins, thus enabling complete resonance assignment and structure characterization of PhoA.
PhoA binding to TF results in TF monomerization, as demonstrated by multiangle light scattering (MALS) and NMR experiments (figs. S1C–E, S18). The data further showed that the putative dimeric interface in TF is dynamic and suggested that substrate-binding regions are partially buried at the dimeric interface (figs. S18A, S19), in agreement with biochemical data (49). Thus, full engagement of the unfolded substrate by TF requires monomerization of the chaperone.
Structure determination of the TF–PhoAa-c complex shows that PhoAa-c binds simultaneously to all four substrate-binding sites, A–D, in TF (Fig. 4A,B), confirming the initial binding experiments (Fig. 3H). Specifically, PhoA site a, which is ~10-residue long, binds to TF site D located in PPD, whereas the much longer PhoA site c (~40-residue long), binds to all three TF sites located in SBD (A, B, and C) (Fig. 4A,B). Other than the regions encompassing the binding sites a and c, all other regions in PhoAa-c remain flexible in the complex (fig. S15).
PhoA site a uses exclusively nonpolar residues consisting primarily of a cluster of Leu residues to interact through intimate van der Waals contacts with a hydrophobic cluster in TF site D consisting primarily of aromatic residues (Fig. 4B, left). Formation of this subcomplex buries a total of ~1,340 Å2 of nonpolar surface and ~410 Å2 of polar surface. Following T16 in PhoA site a, the next to contact TF is F94, the first residue of PhoA site c. PhoA site c spans ~40 residues (F94-W131) and binds to all three TF sites in SBD (Fig. 4A,B). PhoA site c traverses the entire SBD and binds to TF sites B, A, and C using its subsites c1, c2, and c3, respectively (Fig. 4A and 4B, right). Thus, each one of the binding sites in TF engages about 6–10 PhoA residues. Complex formation between TF SBD and PhoA site c buries a total of ~3,820 Å2 of surface. The majority of the surface (~2,580 Å2) consists of nonpolar residues whereas ~1,240 Å2 consists of polar residues.
PhoA site c (via subsite c1) is anchored at the tip of arm 2 of SBD by docking two of its hydrophobic residues, F94 and I97, deep into a hydrophobic pocket formed by TF residues of site B (Fig. 4B, right). Then, using both nonpolar and polar contacts, PhoA twists around the SBD arm 2 to interact with TF site A (via subsite c2) through contacts involving several aromatic residues. Whereas TF sites A and B are located next to each other, TF site C is located on the other end of SBD (Fig. 1A). PhoA reaches site C by stretching a ~10-residue-long region (G116-A125) that appears to interact only transiently with TF. The interaction between PhoA site c (via subsite c3) and TF site C is again mediated primarily by nonpolar contacts, with the most prominent being the docking of PhoA W131 into a hydrophobic pocket formed by several residues of TF site C (Fig. 4B). Although the vast majority of the contacts between TF SBD and PhoA site c are mediated by hydrophobic residues, several key hydrogen bonds are also present throughout the complex (Fig. 4B and fig. S20). The structure of TF–PhoAa-c complex shows that a total of ~40–50 residues of an unfolded client protein can directly interact with the four sites of TF.
A second TF molecule binds to the middle region of PhoA, consisting of sites d and e (Fig. 4A and fig. S17D). The Kd of the TF–PhoAd-e complex is ~4 μM (Fig. 3A and fig. S14), similar to that of the TF–PhoAa-c complex. Structure determination of the TF–PhoAd-e complex showed that TF recognizes and interacts with the PhoAd-e region in a similar way as with the PhoAa-c region. PPD (site D) binds PhoA site d (residues K231-W242) through predominantly nonpolar contacts (Fig. 4C). When compared to PPD-PhoAa (Fig. 4B), two distinct features of the PPD-PhoAd subcomplex are, first, that PhoA site d extends over a larger surface thereby engaging additional PPD residues (e.g. T165 and V186) and, second, that recognition of PhoA site d is enhanced by three favorable hydrogen bonds (Fig. 4C). Formation of the PPD-PhoAd complex buries a total surface of ~1,350 Å2, with ~880 Å2 being nonpolar and ~470 Å2 polar.
PhoA site e (residues Leu277-Ile301), like PhoA site c, engages all three TF sites of SBD (Fig. 4A) but the overall architecture is distinct in the two complexes. Whereas PhoA site c traverses SBD by interacting first with TF site B, followed by A and C, PhoA site e interacts first with TF site C (via subsite e1), followed by TF site B (via subsite e2) and TF site A (via subsite e3) (Fig. 4A and 4C, right). Recognition of PhoA site e by TF SBD is mediated predominantly by nonpolar contacts, but several key hydrogen bonds are also present (Fig. 4C and fig. S21). Complex formation between TF SBD and PhoA site e buries a total surface of ~3,460 Å2, with ~2,410 Å2 consisting of nonpolar residues and ~1,050 Å2 consisting of polar residues.
The third TF molecule binds to the C-terminal region of PhoA, consisting of sites f and g (Fig. 4A and fig. S17G). The Kd of the TF–PhoAf-g complex is ~14 μM (Fig. 3A and fig. S14), the weakest among the three complexes. Structure determination of the TF–PhoAf-g complex (the structure of the major conformation out of the possible two was determined; fig. S17G) confirmed that PPD interacts with PhoA region f and SBD with PhoA region g (Fig. 4A,D and fig. S22). PhoA region f (residues N383-V388) consisting of only 7 residues is the shortest region within PhoA that is recognized and bound by TF (Fig. 2C and fig. S8A). Despite its short length, the nonpolar surfaces between PhoA site f and PPD are well juxtaposed, further enhanced by a hydrogen bond, thereby providing sufficient affinity for the formation of a stable complex (Fig. 4D), which buries a total surface of ~1,230 Å2 (~940 Å2 of nonpolar and ~290 Å2 of polar surface).
PhoA region g (residues Arg440-Leu468) is recognized by TF SBD. Interestingly, in contrast to PhoA sites c and e, which both interact with all three TF sites in SBD (Fig. 4B,C), PhoA site g interacts primarily with TF sites A and B (Fig. 4A,D and fig. S17G). PhoA residues Arg440-Tyr444 (subsite g1) interact with TF site B and PhoA residues L460-L468 (subsite g2) bind to TF site A (Fig. 4D and fig. S17G). Other than PhoA H447, which forms a bifurcated hydrogen bond with two TF residues (D312 and S309) located in arm 1 of SBD, none of the other residues of the PhoA region (G445-D459) connecting the g1 and g2 subsites region appear to interact with TF (Fig. 4D). Complex formation between SBD and PhoA site g buries ~2,670 Å2 of surface (~1,840 Å2 nonpolar and ~830 Å2 polar), substantially less than the SBD complexes with PhoA sites c and e, which likely explains the lower affinity of the TF–PhoAf-g complex (fig. S14).
Amino-acid substitutions at the substrate-binding sites in TF resulted in significant decrease in the affinity for PhoA and a remarkable decrease of its anti-aggregation activity (Fig. 5 and fig. S23).
Fig. 5. Effect of mutations in substrate-binding sites on TF activity.
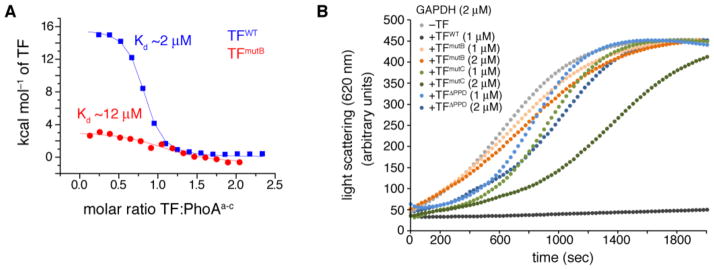
(A) Binding affinity determined by ITC for PhoAa-c to TFWT and TFmutB. TFmutB is a mutant in which four hydrophobic amino acids of the TF site B were substituted (fig. S23). The mutations result in 6-fold decrease in the affinity. (B) Aggregation of chemically denatured GADPH monitored by light scattering at 620 nm, in the absence or presence of TFWT and its variants. In contrast to TFWT, TFmutB has very poor anti-aggregation activity. The anti-aggregation activity is also compromised in TFmutC, a mutant in which a single hydrophobic amino acid of the TF site C was substituted (fig. S23), as well as in a TF construct wherein PPD has been deleted (TFΔPPD).
Recognition of Unfolded PhoA by TF
An important question that remains largely unaddressed is how molecular chaperones recognize unfolded proteins. A common feature shared among molecular chaperones appears to be their interaction with exposed hydrophobic segments of the substrate proteins (5). The structural data of TF in complex with PhoA show that TF has a preference for stretches of residues with increased hydrophobicity (Fig. 2C), especially for aromatic residues (Trp, Phe and Tyr) as well as for large hydrophobic amino acids such as Ile and Leu (fig. S8C). His and Thr residues are also favored (fig. S8C), presumably because they can form both nonpolar and polar contacts. Interestingly, although there seems to be a good correlation between the sequence hydrophobicity of the substrate protein and its binding preference by TF (Fig. 2C), there are long stretches of hydrophobic residues in PhoA (e.g., residues 155-185) that are not recognized by TF. This may be due to the complete absence of aromatic residues in this region. The strong preference of TF for aromatic residues may also explain the stronger association of TF with outer membrane proteins (25), which are typically enriched in aromatic residues.
The structural data of the three TF molecules in complex with different regions of PhoA (Fig. 4), provides insight into how the same binding sites within a molecular chaperone can recognize and interact with a large number of substrates with unrelated primary sequences. Superposition of the three structures of TF SBD shows that the binding mode is distinct in the three complexes (Fig. 6 and fig. S24A). The structural data suggest that the two arms of TF are rather dynamic giving rise to a variable width of the binding crevice in SBD (fig. S24B), in agreement with NMR dynamic analysis (53). In addition, there is notable conformational rearrangement of the side chains in the SBD substrate-binding sites among the three TF complexes with PhoA (Fig. 6E and fig. S24C,D). Structural analysis of the complexes of TF SBD with PhoA sites c, e, and g indicated some common binding and recognition patterns (Fig. 6A–C). For example, TF site B recognizes bulky hydrophobic residues in PhoA that appear to bind to two hydrophobic pockets in TF site B (Fig. 6B). Similarly, there seems to be a pattern, albeit weaker, of bulky and small hydrophobic PhoA residues binding in TF sites A and C (Fig. 6A,C). A great degree of plasticity is also present in the PPD. For example, PhoA site f forms a hairpin-like structure when bound to PPD, whereas PhoA site d binds in an extended conformation (fig. S24E,F). In order to accommodate the different PhoA sequences, the residues that make up the PPD binding site appear to undergo significant conformational rearrangement upon complex formation (Fig. 6F).
Fig. 6. Substrate recognition conformational plasticity by TF.

(A to D) Interaction and recognition patterns of the PhoA sites in the complexes with the three TF molecules. A close-up view of each one of the four substrate-binding sites in TF (labeled TF site A, B, C, and D) is shown with the backbone in white ribbon and the interacting residues in blue sticks. The position of hydrophobic residues from PhoA sites interacting with TF is projected on the TF structure and denoted as large (for aromatic or Ile/Leu residues) or small (for Ala/Val residues) circles. For clarity, only one TF molecule is shown. The substrate-binding sites A, B, and C in TF are decorated with polar residues (highlighted with grey circles) that form hydrogen bonds with PhoA. Only PhoA residues involved in nonpolar contacts are shown. The color code of the PhoA residues (in circles) is as follows: site a (blue), site c (green), site d (yellow), site e (orange), site f (magenta), site g (red). (E,F) Superposition of the TF substrate-binding sites (site B in E, site D in F) in indicated PhoA-bound complexes. PhoA is not shown for clarity. The TF side chains undergo significant rearrangement to interact with the different PhoA regions.
Structural Basis for the Anti-Aggregation and Unfoldase Activity of TF
To understand how TF prevents the aggregation of unfolded proteins, we used an aggregation-prone MBP variant as a substrate (Fig. 7A). Such MBP variants have been extensively used as model systems for studying the effect of chaperones on protein aggregation (72–74). The G32D/I33P double substitution in MBP destabilizes the protein by ~4 kcal mol−1 compared to wild type MBP (MBPWT) (75). MBPG32D/I33P (MBPmut) is produced in inclusion bodies in the cell (75) and has a high tendency to aggregate in solution (76). NMR spectra show that purified MBPmut is folded (Fig. 7B, right and fig. S25A), in agreement with biochemical (75) and crystallographic (77) data. However, MBPmut suffers heavy aggregation and precipitation at higher temperatures (above 30 °C). Notably, in the presence of TF, MBPmut remains soluble and folded even at temperatures as high as 50 °C (fig. S25B).
Fig. 7. Anti-aggregation and unfoldase activity of TF.
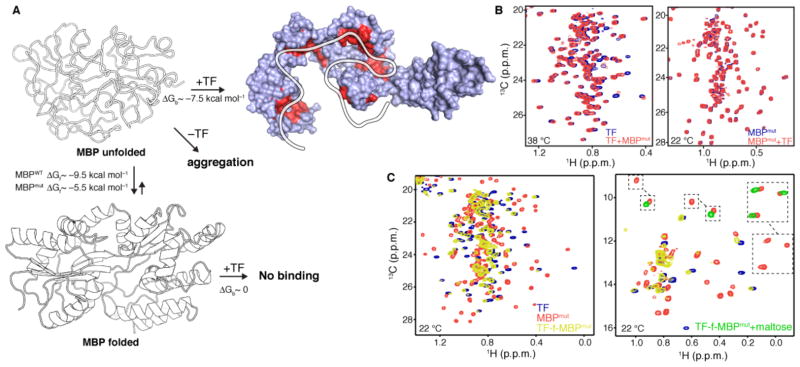
(A) Schematic of MBP unfolding and binding reactions between TF and MBPmut. ΔGf is the free energy of folding and ΔGb is the free energy of binding. The sites that TF uses to interact with the unfolded state of MBPmut, as determined by NMR, are colored red. (B) 1H-13C correlated methyl NMR spectra of the interaction between TF and MBPmut. The spectrum shown on the left was recorded at 38 °C using labeled TF and unlabeled MBPmut, whereas the spectrum shown on the right was recorded at 22 °C using the reverse labeling scheme. No interaction is observed at 22 °C, where the unfolded population of MBPmut is negligible, while binding was observed at 38 °C where the unfolded population of MBPmut is appreciable. For clarity, only the region of the Leu and Val methyl resonances is shown. The full-range spectra are shown in fig. S25. (C) 1H-13C correlated methyl NMR spectra of the fusion construct between TF and MBPmut (TF-f-MBPmut, yellow). The spectra of free TF (blue) and free MBPmut (orange) are also shown for comparison. The spectrum on the left depicts the region of the Leu and Val methyl resonances whereas the one on the right depicts the region of the Ile methyl resonances. The disappearance of the peaks belonging to MBPmut residues residing in folded regions and the appearance of peaks in the random-coil region indicates that MBPmut is unfolded when fused to TF. Addition of maltose (green resonances on the Ile spectrum) stabilizes MBPmut and prevents its unfolding by TF.
How does TF prevent aggregation of MBPmut? NMR titration experiments performed at 22 °C (Fig. 7B, right and fig. S25A,C) show that TF does not interact with the folded state of MBPmut. However, titration of MBPmut to labeled TF at temperatures where MBPmut is prone to aggregation (e.g. 38 °C) resulted in substantial chemical shift perturbation indicating complex formation (Fig. 7B, left and fig. S25D,E). Thus, unfolded MBPmut is recognized and engaged by TF. In support of this conclusion, titration of MBPWT to TF showed no sign of complex formation even at 38 °C (fig. S25F). Because of the large difference in their free energy of folding (ΔΔGF~4 kcal mol−1, Fig. 7A), the unfolded state will be significantly more populated in MBPmut than in MBPWT at elevated temperatures. NMR analysis (fig. S25D,E) showed that TF uses all of the possible substrate binding sites to interact with the unfolded state of MBPmut (Fig. 7A and fig. S11C). Taken together, the results show that multivalent binding between TF and the unfolded state of MBPmut shields and protects the unfolded state from the solvent and results in the prevention of its aggregation (Fig. 7A).
Although TF binds to the unfolded state of MBPmut, the NMR spectra show that TF cannot unfold the protein even at temperatures as high as 50 °C (fig. S25B). Since TF lacks ATPase activity, it could in principle unfold protein substrates only if the free energy of binding (ΔGb) of the substrate’s unfolded state for TF is much larger than the substrate’s intrinsic energy for folding (Fig. 7A). The intrinsic affinity of TF for unfolded substrates is relatively low (ΔGb~−7.5 kcal mol−1; fig. S14), and thus it is expected to unfold only marginally stable proteins. However, the interaction of ribosome-bound TF with the nascent polypeptide is very strong due to their colocalization (78). When MBPmut was fused to TF it was completely unfolded as demonstrated by the disappearance of resonances corresponding to residues located in folded regions and the appearance of resonances in the so-called random-coil region (Fig. 7C). NMR analysis showed that TF makes use of all of its substrate-binding sites to interact and unfold MBPmut (Fig. 7A). Of particular note, maltose binding to MBPmut confers stability (79) and prevents its unfolding by TF (Fig. 7C, right). These results are in excellent agreement with elegant biochemical data indicating that TF has a negligible unfoldase activity when free in solution but a strong unfoldase activity when bound to the ribosome (30).
Discussion
The TF molecular chaperone engages its unfolded substrate (PhoA) in a highly dynamic manner, giving rise to a rugged free energy landscape (Fig. 3H). It is expected that the features of the binding energy landscape will vary among the various molecular chaperones and even among different substrates binding to the same chaperone. In the case of PhoA binding to TF, we observed a gradual increase in binding affinity as the length of the engaged PhoA increased until all four of the binding sites in TF were fully occupied (Fig. 3 and fig. S17). Because of the topology of the TF-binding sites in PhoA, the selectivity of some of the PhoA sites for specific TF sites (Fig. 3 and fig. S17), as well as the observed synergistic binding among PhoA sites close to each other (Fig. 3 and fig. S16), the lowest-energy complexes between TF and the three PhoA regions were experimentally observed to exist in one predominant conformation (Fig. 4A and fig. S17D,G). Notably, the observed binding avidity of the PhoA sites and subsites is relatively weak (Fig. 3 and fid. S17). This is probably because the linker tethering the (sub)sites remains dynamic even in the complex with TF thus allowing for somewhat independent binding of the PhoA sites. The observed weak synergistic binding may be crucial in enabling a dynamic binding and release of the unfolded protein substrate from the chaperone (Fig. 3K).
The excellent quality of the NMR spectra enabled the high-resolution structure determination for each one of the three TF molecules in complex with different regions of PhoA (Fig. 4). Analysis of the structures suggest that plasticity of the substrate-binding sites in TF, combined with the presence of numerous small hydrophobic pockets on the binding surface and the decoration of these sites by polar residues that can form hydrogen bonds (Fig. 6), are important for the promiscuous recognition of multiple substrate sequences by TF. TF presents a multivalent binding surface to its protein substrate, which binds to TF using several distinct regions. This mechanism of binding presents several advantages as it enables chaperones to function as holdases and unfoldases by exerting forces to retain proteins in the unfolded state, and at the same time protect them from aggregation by shielding their exposed hydrophobic regions. Impairment of the substrate-binding sites in TF results in significant reduction in TF’s anti-aggregation activity (Fig. 5). Given the existence of multiple binding sites in other molecular chaperones (such as the GroEL) this may present a general mechanism for the action of molecular chaperones (80–82).
TF appears to have a weak holdase and unfoldase activity in the cytosol but a very strong activity when colocalized with the protein substrate. Thus, in the cytosol TF is apparently capable of rescuing folded proteins by transiently interacting with the aggregation-prone unfolded population of the substrate, without destabilizing the protein substrate (as seen with MBPmut; Fig. 7A,B and fig. S25B). In contrast, when TF is bound to the ribosome, its strong holdase and unfoldase activity (Fig. 7C) will mean that TF can retain the nascent polypeptide in an unfolded state and even actively unfold transiently formed structures. Although PhoA has some fraction of secondary structure present in its unfolded state (Fig. 2A,B), these regions are devoid of any secondary structure when they are bound to TF (Fig. 4). Taken together, the data demonstrate that binding of substrate proteins to TF may result not only in global unfolding of the substrate protein but also melting of secondary structural elements.
The present structural data explain the observation that multiple TF molecules are required to bind to long nascent chains (18, 19, 25) because a single TF molecule can only accommodate a stretch of ~40–50 binding residues of the substrate protein. Moreover, the weak affinity of the first ~70 residues of PhoA for TF, as well as the fact that the predicted TF-binding sites in a number of proteins known to bind strongly to TF (25) are located past the first ~70 residues (fig. S26), is in agreement with ribosome profiling data (25) that nascent chains with more than ~70 residues protruded from the ribosome exit channel are required for a stable complex with TF. Another interesting aspect of TF is its ability to bind and protect small folded proteins as a dimer (27) (fig. S27). The ability of TF to act as a holdase and an unfoldase with unfolded proteins and to encapsulate folded proteins in its dimeric state highlights the versatility of this particular molecular chaperone and the multiple roles it may play in protein folding (83).
Materials and Methods
Expression and Preparation of Proteins
The E. coli TF was cloned into the pCold vector (Takara Bio, Otsu, Japan). The following TF constructs were prepared: the ribosome-binding domain (RBD, residues 1-117) and the substrate-binding domain (SBD, residues 113-432Δ150-246) were cloned into pET16b vector (Novagen, Madison, WI) and fused to His6-MBP, including a tobacco etch virus (TEV) protease cleavage site. The peptidyl prolyl isomerase domain (PPD, residues 148-249), SBD-PPD (residues 113-246), and RBD-SBD (1-432Δ150-243) were cloned into pCold vector (Takara Bio, Otsu, Japan). TF mutants were constructed by site-directed mutagenesis using PfuTurbo High Fidelity DNA polymerase (Agilent, Santa Clara, CA). All constructs were transformed into BL21(DE3) cells. The following E. coli PhoA constructs were prepared (residue numbers of the boundaries are in superscript): PhoA1-471 (full length), PhoA1-62, PhoA1-82, PhoA1-122, PhoA1-140, PhoA1-150, PhoA1-250, PhoA23-78, PhoA76-150, PhoA119-243, PhoA234-349, PhoA228-471, PhoA349-471, PhoA220-310, PhoA365-471, PhoA228-245, PhoA272-327, PhoA381-438, and PhoA425-471. All PhoA fragments were cloned into a pET16b vector and fused to His6-MBP, including a TEV protease cleavage site. E. coli MBP, MBP29-132 and MBPG32D/I33P (75) were cloned into pET 16b vector (Novagen). The TF-MBPI32D/G33P fusion protein was cloned into pCold vector (Takara Bio) to be fused to TF or TFSBD-PPD separated by a 25-residue linker. The transmembrane region of OmpA (OmpAt; residues 1-192) fused with N-terminal His-tag was cloned into pET16b vector (Novagen). For the unlabeled samples, cells were grown in Luria–Bertani (LB) media at 37 °C in the presence of 100 μg ml−1 ampicillin. Protein expression was induced by the addition of 0.1–0.8 mM of isopropyl-β-D-1-thiogalactopyranoside (IPTG) at OD600 ~0.5, followed by 12–16 h incubation at 18 °C. Expression of MBPG32D/I33P was induced by the addition of 0.01 mM IPTG at OD600 ~0.5, followed by 48 h incubation at 16 °C. Cells were harvested at OD600 ~1.5 and resuspended in the lysis buffer containing 50 mM Tris-HCl (pH 8.0), 50–500 mM NaCl, 5 mM imidazole, and 1 mM β-mercaptoethanol (βME) (and 8 M urea in the case of PhoA fragments followed by 20-fold rapid dilution in lysis buffer). For OmpA, the cell pellet was resuspended in the buffer containing 50 mM Tris-HCl (pH 8.0), 500 mM NaCl, 5 mM imidazole and 6 M guanidine hydrochloride and incubated for 1 hr at room temperature. Cells were disrupted by a high pressure homogenizer or sonicator and centrifuged at 50,000 × g. Proteins were purified using Ni Sepharose 6 Fast Flow resin (GE Healthcare, Piscataway, NJ), followed by tag removal by the TEV protease at 4 °C (incubation for 16 h) and gel-filtration using Superdex 75 16/60 or 200 16/60 columns (GE Healthcare). OmpA was eluted with a solution containing 50mM Tris-HCl (pH 8.0), 500 mM NaCl, 400 mM imidazole and 6 M guanidine hydrochloride. The eluted protein was concentrated and diluted by 20-fold rapid dilution in the presence of TF or TFPPD-SBD in 20 mM potassium phosphate (pH 7.0) 100 mM KCl, 4 mM βME, 0.5 mM EDTA, 0.05% NaN3. Protein concentration was determined spectrophotometrically at 280 nm using corresponding extinction coefficient.
MALS Experiments
Multi-angle light scattering was measured using DAWN HELEOS-II (Wyatt Technology Corporation, Santa Barbara, CA) downstream of a Shimadzu liquid chromatography system (Shimadzu, Kyoto, Japan) connected to a Superdex 200 10/300 GL (GE Healthcare) gel-filtration column. The typical running buffer was 20 mM KPi (pH 7.0) 100 mM KCl, 4 mM βME, and 0.5 mM EDTA. 200 μL of the sample with a concentration of 100–400 μM was injected. The data were analyzed with ASTRA version 6.0.5 (Wyatt Technology Corporation).
GAPDH Aggregation Assay
Aggregation of denatured GAPDH from rabbit muscle (Sigma; G-2267) was measured are described previously (84). 125 μM GAPDH was denatured by 3 M guanidine-HCl in 20 mM KPi (pH 7.0) 100 mM KCl, 4 mM βME, 0.5 mM EDTA, and 0.05% NaN3 for 12 h at 4 °C. The denatured enzyme was diluted 50-fold into a buffer that does not contain guanidine-HlC and aggregation was monitored by 90° light scattering at 620 nm on a spectrofluorometer (FluoroMax-4, Horiba, Edison, NJ) in the presence or absence of TF. The experiment was carried out at 20 °C.
Substrate-Binding Site Mutations in TF
In order to assess the effect of reducing the hydrophobicity of the substrate-binding sites of TF on its binding and anti-aggregation activity, we sought to mutate the most prominent residues in each one of the binding sites located in SBD (that is, sites A, B, and C). The following mutants were prepared: L306A, G348E, G352E, I355A, (site A); M374A, Y378A, V384A, F387A (site B); M140E, L144A, F256A L266A, M274A, M428A (site C) as single or combined mutants. Although all of the mutants were expressed and purified in a soluble form, NMR characterization indicated that mutations other than the ones shown in fig. S23 are not well tolerated, with the mutated TF proteins showing signs of misfolding and aggregation.
ITC Experiments
Calorimetric titrations were carried out on an iTC200 microcalorimeter (GE Healthcare) at temperatures ranging from 8 to 25 °C. All protein samples were extensively dialyzed against the ITC buffer containing 20 mM potassium phosphate (pH 7.0), 100 mM KCl and 1 mM Tris(2-carboxyethyl)phosphine (TCEP). All solutions were filtered using membrane filters (pore size 0.45 μm) and thoroughly degassed for 20 min before the titrations. For the experiments performed on iTC200, the 200 μL sample cell was filled with ~40–100 μM protein (TF or PhoA) and the 40 μl injection syringe with 0.5–1 mM solution of protein (PhoA or TF). The titrations were carried out with a preliminary 0.2 μl injection, followed by 15 injections of 2.5 μl each with time intervals of 3 min. The solution was stirred at 1000 rpm. For the experiments performed on VP-ITC, the 1200 μl sample cell was filled with ~40–100 μM protein (TF or PhoA) and the 250 μl injection syringe was filled with 0.5–1 mM of protein (PhoA or TF). The titrations were carried out with 30 injections of 10 μl each with time intervals of 5 min. The solution was stirred at 270 rpm. Data for the preliminary injection, which are affected by diffusion of the solution from and into the injection syringe during the initial equilibration period, were discarded. Binding isotherms were generated by plotting heats of reaction normalized by the modes of injectant versus the ratio of total injectant to total protein per injection. The data were fitted with Origin 7.0 (OriginLab Corporation, Northampton, MA).
NMR Spectroscopy
NMR samples are prepared in 20 mM KPi pH 7.0, 100 mM KCl, 4 mM βME, 0.5 mM EDTA, 0.05% NaN3, and 7% 2H2O. Protein concentration was 0.1–0.8 mM. NMR experiments were recorded on Agilent UNITY Inova 800 and 600 MHz NMR spectrometers and Bruker Avance III 600 and 700 MHz NMR spectrometers equipped with cryogenic probes. The experiments were run at 10 °C for isolated PhoA samples, and at temperatures ranging from 18 °C to 50 °C for the other samples. NMR spectra for the assignment and structure determination of the TF–PhoA complexes were recorded at 25 °C. Spectra were processed using the NMRPipe program (85) and data analysis was performed with Olivia (fermi.pharm.hokudai.ac.jp/olivia) and SPARKY software.
Binding affinities between TF and PhoA fragments were estimated using 1H-15N HSQC titration experiments, where unlabeled PhoA was titrated into labeled TF. Titration curves were obtained by plotting chemical shift perturbations (Δδppm) against the molar ratio of PhoA and TF. Non-linear least square fitting calculations were performed in GraphPad Prism (GraphPad Software, USA), using the following equation
where [L] and [P] are the concentrations of the peptide ligand (PhoA) and protein (TF), respectively, and Kd is the dissociation constant.
Protein Isotope Labeling for NMR Studies
Isotopically labeled samples for NMR studies were prepared by growing the cells in minimal (M9) media. Cells were typically harvested at OD600 ~1.0. U-[2H,13C,15N]-labeled samples were prepared for the backbone assignment by supplementing the growing medium with 1 g L−1 of 15NH4Cl and 2 g L−1 of 2H7,13C6-glucose in 99.9%-2H2O (CIL and Isotec). The methyl-protonated samples (86) were prepared as described (44, 47). 50 mg L−1 of alpha-ketobutyric acid and 85 mg L−1 of alpha-ketoisovaleric acid were added to the culture 1 h prior to addition of IPTG. Met[13CH3] and Ala-[13CH3] labeled samples were produced by supplementing the medium with 100 mg L−1 of [13CH3]-methionine and 100 mg L−1 [2H2,13CH3]-alanine. For Thr labeling, a Thr-auxotrophic cell strain was used and the medium was supplemented with 25 mg L−1 of [2H2,13CH3]-threonine prepared as described (87). For Phe, Tyr, and Trp labeling, U-[1H,13C]-labeled amino acids were used. All precursors and amino acids were added to the culture 1 h before addition of IPTG, except Ala, which was added 30 min before induction (47).
NMR Assignment of TF
Resonances of the full-length dimeric TF (~100 kDa) were assigned by following a domain-parsing approach enabled by the modular architecture of TF. RBD (52), SBD (53) and PPD are folded when isolated (fig. S3B). Overlay of the NMR spectra for each one of the domains with the spectra of the full length TF indicated very good resonance correspondence for SBD and PPD (figs. S2, S3 and S4), but more significant chemical shift differences for RBD (fig. S19). About 70–80% of the assignment performed on the isolated domains could be transferred to the full length TF. Near complete assignment of TF was achieved by recording NOESY in full-length TF to resolve ambiguities. In addition, TFSBD-PPD was prepared and fully characterized by NMR as this fragment is monomeric and contains all of the substrate binding sites. Backbone and side chain resonances for the domains were assigned using standard triple resonance NMR pulse sequences. Methyl side chain and amide resonances for TF and large fragments was confirmed by recording the following NMR experiments (the standard version was used for isolated RBD and PPD and the TROSY version, where applicable, for TFSBD-PPD and TF): 3D-(1H)-13C HMQC-NOESY-1H-13C HMQC, 13C-edited NOESY-HSQC, 13C-edited HSQC-NOESY, 15N-edited NOESY-HSQC, 3D-(1H)-13C-HSQC-NOESY-1H-15N HSQC, and 3D-(1H)-15N HSQC-NOESY-1H-13C HSQC.
NMR Assignment of PhoA
Resonance assignment of full length PhoA was accomplished by first assigning short PhoA fragments followed by assignment transfer. The backbone and side chain resonances of the following PhoA fragments were fully assigned using standard triple resonance experiments: PhoA1-122, PhoA119-243, PhoA234-349, and PhoA349-471 (the superscript denotes the amino-acid residue boundaries of the fragment). Overlay of the spectra of these fragments with the spectra of full length PhoA indicated excellent resonance correspondence (fig. S5D). This is expected since all of the fragments as well as the full-length PhoA are unfolded. Resonance assignment obtained for the various fragments was transferred to the full-length PhoA and ambiguities were resolved by the use of 3D NMR spectra. Resonance assignment of PhoA in complex with TF was achieved by tracing the PhoA NMR signals as increasing amounts of unlabeled TF was titrated. Complex formation was on the fast time scale regime allowing the monitoring of the chemical shift changes in a straightforward manner. Ambiguities were resolved by recording 3D NMR spectra. It should be noted that although resonance dispersion in unliganded PhoA is poor, complex formation with TF alleviates this problem (for the PhoA residues in the TF-binding regions) with the spectra being of high resolution (figs. S2C,D and S10).
Structure Determination
In the first step, we used a U-12C,15N-labeled sample that contained specifically protonated methyl groups of Ala, Val, Leu, Met, Thr and Ile (δ1) and protonated aromatic residues Phe, Tyr, and Trp in an otherwise deuterated background (fig. S4). The high sensitivity and resolution of the methyl region, combined with the high abundance of these 8 amino acids in TF (~50% of TF residues), provided a large number of intra- and inter-molecular TF-PhoA NOEs sufficient to yield an initial well-defined structure. The initial structure was used to guide the subsequent collection of a much larger number of NOEs, using 1H,13C-labeled samples that resulted in further refinement to precise and accurate coordinates. In the second step, additional NMR restraints were collected for complexes between isolated SBD and PPD, as well as the entire chaperone module TFSBD-PPD, in complex with the corresponding PhoA regions (fig. S10). NMR analysis demonstrated that the structures of the individual SBD and PPD in complex with PhoA are essentially identical to the structure of the full-length TF in complex with PhoA.
The initial structures of TF in complex with PhoA were calculated with CYANA 3.0 (88), using NOE peak lists from 3D-(1H)-13C-HMQC-NOESY-1H-13C HMQC, 3D-(1H)-15N-HSQC-NOESY-1H-13C-HSQC, 13C-edited NOESY-HSQC, and 15N-edited NOESY-HSQC. The 13Cα, 13Cβ, 13C′, Hα, 15N, and NH chemical shifts served as input for the TALOS+ program (89) to extract dihedral angles (φ and ψ). Assigned NOE restraints were then used in the second round of calculations using Xplor-NIH (90) consisting of two steps. In the first step, the orientation and coordinates of PhoA polypeptide was randomized and then annealed to TF using intermolecular NOEs. TF was kept rigid but PhoA was set as flexible. The best 200 structures were selected and further refined in the second step, where both TF and PhoA were set flexible. Because RBD does not interact with PhoA, or any other tested unfolded substrate, the coordinates from the E. coli TF structure (PDB ID 1W26) were used to model RBD in the current structures. RBD was held rigid during the entire structure calculation protocol. The structure of the main chaperone module, TFSBD-PPD, was determined using the NMR restraints in each one of the three complexes with PhoAa-c, PhoAd-e, and PhoAf-g. The structures were calculated and refined using all of the restraints, including intra- and inter-molecular NOEs, dihedral restraints derived from TALOS+, and hydrogen bond restraints for amides located in helices as determined via NOEs and chemical shift information. Hydrogen bonds between TF and PhoA were assigned when satisfactory geometry was present in at least 70% of the conformers. The 20 lowest-energy structures were finally refined in explicit water with CNS (91).
NMR Relaxation Experiments
Three relaxation parameters were measured for backbone amides of full-length PhoA, as well as for PhoA1-232 and PhoA228-471 for enhanced resolution: the {1H}-15N NOE, the longitudinal relaxation rate R1 and the transverse relaxation rate R2. 15N R1 values were measured from 2D spectra recorded with relaxation delays 20, 40, 80, 160, 320, 640, 1200, 2500, and 5000 ms; 15N R2 values were measured from 2D spectra recorded with relaxation delays 31.7, 47.5, 63.4, 79.2, 95.0, 110.9, 126.7, 158.4, 237.6, 316.8, and 475.2 ms. Data sets were acquired as 100 × 1,024 complex points in the t1 × t2 time-domain dimensions. Data points were fitted as a function of the length of the parametric relaxation delay to two-parameter decay curves of the form I(t)=I0 e−Rt, where I is the peak intensity. To measure the exchange rate and the kinetics (kex=kon[PhoA]+koff) of complex formation between TF and PhoA we used NMR relaxation dispersion experiments (65, 66). An 15N-Carr-Purcell-Meiboom-Gill (CPMG) pulse sequence (67, 68) was used. Two-dimensional data sets were acquired as 100 × 1,024 complex points in the t1 × t2 time-domain dimensions with a constant relaxation delay of 40 ms. Experiments were recorded at spectrometer frequencies of 600 MHz and 700 MHz. NMR titration experiments showed that formation of all of the TF–PhoA complexes is fast on the NMR chemical shift time scale. kex was measured by using the Carver-Richards equation (92) as applied for fast exchange processes between two sites. Exchange rates were first extracted independently for each residue with appreciable exchange contribution (Rex >5 Hz) for each one of the four binding sites in TF. The similarity of exchange rates extracted from fits of dispersion profiles on a per-residue basis for the four binding sites in TF indeed supports a two-site model of exchange (binding) even for the binding of the larger PhoA sites such as c and e. kon and koff rates were measured by fitting the relaxation dispersion data obtained for a set of experiments recorded using different PhoA concentration. Data were analyzed using the programs CPMGFit (palmer.hs.columbia.edu/software/cpmgfit.html) and CPMG_fit provided by L. Kay (University of Toronto). TFSBD-PPD concentration for the relaxation dispersion experiments was ~0.2–0.4 mM in the presence of substoichiometric (~5–15%) amount of the corresponding PhoA fragment. It should be noted that the exchange process detected and measured is the binding and release of PhoA from TF as opposed to conformational heterogeneity of PhoA while bound to TF. This is supported by the PhoA concentration-dependent kex values we measured.
Supplementary Material
Acknowledgments
C.G.K. thanks L.E. Kay and B. Bukau for fruitful discussions and comments. We thank M.T.-Pai and A. Bhattacharya for contributions during the early phase of the project, S. Patel for the use of a spectrofluorometer, and S. Kim and Y. Xia (University of Minnesota) for their help with setting up NMR experiments. This work is supported by NIH grant GM073854 (C.G.K.), Nonaco (Aristeia-Excellence; #1473), KUL-Spa, RiMembR, and StrepSynth (A.E.). T.S. is the recipient of postdoctoral fellowships from the Japanese Society for the Promotion of Science and the American Heart Association (14POST18600039). We thank Bruker Biospin for the use of a 700 MHz instrument. Coordinates and structural restraints have been deposited with the Protein Data Bank under accession codes 2MLY, 2MLX, and 2MLZ, for TF–PhoAa-c, TF–PhoAd-e, and TF–PhoAf-g, respectively.
References and Notes
- 1.Bukau B, Weissman J, Horwich A. Molecular chaperones and protein quality control. Cell. 2006;125:443–451. doi: 10.1016/j.cell.2006.04.014. [DOI] [PubMed] [Google Scholar]
- 2.Kramer G, Boehringer D, Ban N, Bukau B. The ribosome as a platform for co-translational processing, folding and targeting of newly synthesized proteins. Nat Struct Mol Biol. 2009;16:589–597. doi: 10.1038/nsmb.1614. [DOI] [PubMed] [Google Scholar]
- 3.Ulrich Hartl F, Hayer-Hartl M. Converging concepts of protein folding in vitro and in vivo. Nat Struct Mol Biol. 2009;16:574–581. doi: 10.1038/nsmb.1591. [DOI] [PubMed] [Google Scholar]
- 4.Horwich AL. Protein folding in the cell: an inside story. Nat Med. 2011;17:1211–1216. doi: 10.1038/nm.2468. [DOI] [PubMed] [Google Scholar]
- 5.Hartl FU, Bracher A, Hayer-Hartl M. Molecular chaperones in protein folding and proteostasis. Nature. 2011;475:324–332. doi: 10.1038/nature10317. [DOI] [PubMed] [Google Scholar]
- 6.Saibil H. Chaperone machines for protein folding, unfolding and disaggregation. Nat Rev Cancer. 2013;13:630–642. doi: 10.1038/nrm3658. [DOI] [PMC free article] [PubMed] [Google Scholar]
- 7.Hartl F, Hayer-Hartl M. Molecular chaperones in the cytosol: from nascent chain to folded protein. Science. 2002;295:1852–1858. doi: 10.1126/science.1068408. [DOI] [PubMed] [Google Scholar]
- 8.Young J, Agashe V, Siegers K, Hartl F. Pathways of chaperone-mediated protein folding in the cytosol. Nat Rev Mol Cell Biol. 2004;5:781–791. doi: 10.1038/nrm1492. [DOI] [PubMed] [Google Scholar]
- 9.Preissler S, Deuerling E. Ribosome-associated chaperones as key players in proteostasis. Trends Biochem Sci. 2012;37:274–283. doi: 10.1016/j.tibs.2012.03.002. [DOI] [PubMed] [Google Scholar]
- 10.Hoffmann A, Bukau B, Kramer G. Structure and function of the molecular chaperone Trigger Factor. Biochim Biophys Acta. 2010;1803:650–661. doi: 10.1016/j.bbamcr.2010.01.017. [DOI] [PubMed] [Google Scholar]
- 11.Kramer G, et al. L23 protein functions as a chaperone docking site on the ribosome. Nature. 2002;419:171–174. doi: 10.1038/nature01047. [DOI] [PubMed] [Google Scholar]
- 12.Ferbitz L, et al. Trigger factor in complex with the ribosome forms a molecular cradle for nascent proteins. Nature. 2004;431:590–596. doi: 10.1038/nature02899. [DOI] [PubMed] [Google Scholar]
- 13.Baram D, et al. Structure of trigger factor binding domain in biologically homologous complex with eubacterial ribosome reveals its chaperone action. Proc Natl Acad Sci USA. 2005;102:12017–12022. doi: 10.1073/pnas.0505581102. [DOI] [PMC free article] [PubMed] [Google Scholar]
- 14.Schlünzen F, et al. The binding mode of the trigger factor on the ribosome: implications for protein folding and SRP interaction. Structure/Folding and Design. 2005;13:1685–1694. doi: 10.1016/j.str.2005.08.007. [DOI] [PubMed] [Google Scholar]
- 15.Merz F, et al. Molecular mechanism and structure of Trigger Factor bound to the translating ribosome. EMBO J. 2008;27:1622–1632. doi: 10.1038/emboj.2008.89. [DOI] [PMC free article] [PubMed] [Google Scholar]
- 16.Bukau B, Deuerling E, Pfund C, Craig EA. Getting newly synthesized proteins into shape. Cell. 2000;101:119–122. doi: 10.1016/S0092-8674(00)80806-5. [DOI] [PubMed] [Google Scholar]
- 17.Maier R, Eckert B, Scholz C, Lilie H, Schmid FX. Interaction of trigger factor with the ribosome. J Mol Biol. 2003;326:585–592. doi: 10.1016/s0022-2836(02)01427-4. [DOI] [PubMed] [Google Scholar]
- 18.Kaiser CM, et al. Real-time observation of trigger factor function on translating ribosomes. Nature. 2006;444:455–460. doi: 10.1038/nature05225. [DOI] [PubMed] [Google Scholar]
- 19.Rutkowska A, et al. Dynamics of trigger factor interaction with translating ribosomes. J Biol Chem. 2008;283:4124–4132. doi: 10.1074/jbc.M708294200. [DOI] [PubMed] [Google Scholar]
- 20.Lill R, Crooke E, Guthrie B, Wickner W. The “trigger factor cycle” includes ribosomes, presecretory proteins, and the plasma membrane. Cell. 1988;54:1013–1018. doi: 10.1016/0092-8674(88)90116-x. [DOI] [PubMed] [Google Scholar]
- 21.Agashe VR, et al. Function of trigger factor and DnaK in multidomain protein folding: increase in yield at the expense of folding speed. Cell. 2004;117:199–209. doi: 10.1016/s0092-8674(04)00299-5. [DOI] [PubMed] [Google Scholar]
- 22.Hoffmann A, et al. Trigger factor forms a protective shield for nascent polypeptides at the ribosome. J Biol Chem. 2006;281:6539–6545. doi: 10.1074/jbc.M512345200. [DOI] [PubMed] [Google Scholar]
- 23.Tomic S, Johnson AE, Hartl FU, Etchells SA. Exploring the capacity of trigger factor to function as a shield for ribosome bound polypeptide chains. FEBS Lett. 2006;580:72–76. doi: 10.1016/j.febslet.2005.11.050. [DOI] [PubMed] [Google Scholar]
- 24.Deuerling E, et al. Trigger Factor and DnaK possess overlapping substrate pools and binding specificities. Mol Microbiol. 2003;47:1317–1328. doi: 10.1046/j.1365-2958.2003.03370.x. [DOI] [PubMed] [Google Scholar]
- 25.Oh E, et al. Selective ribosome profiling reveals the cotranslational chaperone action of trigger factor in vivo. Cell. 2011;147:1295–1308. doi: 10.1016/j.cell.2011.10.044. [DOI] [PMC free article] [PubMed] [Google Scholar]
- 26.Lakshmipathy SK, Gupta R, Pinkert S, Etchells SA, Hartl FU. Versatility of trigger factor interactions with ribosome-nascent chain complexes. J Biol Chem. 2010;285:27911–27923. doi: 10.1074/jbc.M110.134163. [DOI] [PMC free article] [PubMed] [Google Scholar]
- 27.Martinez-Hackert E, Hendrickson WA. Promiscuous substrate recognition in folding and assembly activities of the trigger factor chaperone. Cell. 2009;138:923–934. doi: 10.1016/j.cell.2009.07.044. [DOI] [PMC free article] [PubMed] [Google Scholar]
- 28.O’Brien EP, Christodoulou J, Vendruscolo M, Dobson CM. Trigger Factor Slows Co-translational Folding through Kinetic Trapping while Sterically Protecting the Nascent Chain from Aberrant Cytosolic Interactions. J Am Chem Soc. 2012;134:10920–10932. doi: 10.1021/ja302305u. [DOI] [PubMed] [Google Scholar]
- 29.Mashaghi A, et al. Reshaping of the conformational search of a protein by the chaperone trigger factor. Nature. 2013;500:98–101. doi: 10.1038/nature12293. [DOI] [PubMed] [Google Scholar]
- 30.Hoffmann A, et al. Concerted action of the ribosome and the associated chaperone trigger factor confines nascent polypeptide folding. Mol Cell. 2012;48:63–74. doi: 10.1016/j.molcel.2012.07.018. [DOI] [PubMed] [Google Scholar]
- 31.Genevaux P, et al. In vivo analysis of the overlapping functions of DnaK and trigger factor. EMBO Rep. 2004;5:195–200. doi: 10.1038/sj.embor.7400067. [DOI] [PMC free article] [PubMed] [Google Scholar]
- 32.Deuerling E, Schulze-Specking A, Tomoyasu T, Mogk A, Bukau B. Trigger factor and DnaK cooperate in folding of newly synthesized proteins. Nature. 1999;400:693–696. doi: 10.1038/23301. [DOI] [PubMed] [Google Scholar]
- 33.Teter SA, et al. Polypeptide flux through bacterial Hsp70: DnaK cooperates with trigger factor in chaperoning nascent chains. Cell. 1999;97:755–765. doi: 10.1016/s0092-8674(00)80787-4. [DOI] [PubMed] [Google Scholar]
- 34.Calloni G, et al. DnaK Functions as a Central Hub in the E. coli Chaperone Network. Cell Rep. 2012;1:251–264. doi: 10.1016/j.celrep.2011.12.007. [DOI] [PubMed] [Google Scholar]
- 35.Bechtluft P, et al. Direct observation of chaperone-induced changes in a protein folding pathway. Science. 2007;318:1458–1461. doi: 10.1126/science.1144972. [DOI] [PubMed] [Google Scholar]
- 36.Ullers RS, Ang D, Schwager F, Georgopoulos C, Genevaux P. Trigger Factor can antagonize both SecB and DnaK/DnaJ chaperone functions in Escherichia coli. Proc Natl Acad Sci USA. 2007;104:3101–3106. doi: 10.1073/pnas.0608232104. [DOI] [PMC free article] [PubMed] [Google Scholar]
- 37.Rudiger S, Freund SMV, Veprintsev DB, Fersht AR. CRINEPT-TROSY NMR reveals p53 core domain bound in an unfolded form to the chaperone Hsp90. Proc Natl Acad Sci USA. 2002;99:11085–11090. doi: 10.1073/pnas.132393699. [DOI] [PMC free article] [PubMed] [Google Scholar]
- 38.Horst R, et al. Direct NMR observation of a substrate protein bound to the chaperonin GroEL. Proc Natl Acad Sci USA. 2005;102:12748–12753. doi: 10.1073/pnas.0505642102. [DOI] [PMC free article] [PubMed] [Google Scholar]
- 39.Walton TA, Sandoval CM, Fowler CA, Pardi A, Sousa MC. The cavity-chaperone Skp protects its substrate from aggregation but allows independent folding of substrate domains. Proc Natl Acad Sci USA. 2009;106:1772–1777. doi: 10.1073/pnas.0809275106. [DOI] [PMC free article] [PubMed] [Google Scholar]
- 40.Park SJ, Borin BN, Martinez-Yamout MA, Dyson HJ. The client protein p53 adopts a molten globule-like state in the presence of Hsp90. Nat Struct Mol Biol. 2011;18:537–541. doi: 10.1038/nsmb.2045. [DOI] [PMC free article] [PubMed] [Google Scholar]
- 41.Zhuravleva A, Clérico EM, Gierasch LM. An Interdomain Energetic Tug-of-War Creates the Allosterically Active State in Hsp70 Molecular Chaperones. Cell. 2012;151:1296–1307. doi: 10.1016/j.cell.2012.11.002. [DOI] [PMC free article] [PubMed] [Google Scholar]
- 42.Burmann BM, Wang C, Hiller S. Conformation and dynamics of the periplasmic membrane-protein-chaperone complexes OmpX-Skp and tOmpA-Skp. Nat Struct Mol Biol. 2013;20:1265–1272. doi: 10.1038/nsmb.2677. [DOI] [PubMed] [Google Scholar]
- 43.Sprangers R, Kay LE. Quantitative dynamics and binding studies of the 20S proteasome by NMR. Nature. 2007;445:618–622. doi: 10.1038/nature05512. [DOI] [PubMed] [Google Scholar]
- 44.Gelis I, et al. Structural basis for signal-sequence recognition by the translocase motor SecA as determined by NMR. Cell. 2007;131:756–769. doi: 10.1016/j.cell.2007.09.039. [DOI] [PMC free article] [PubMed] [Google Scholar]
- 45.Religa TL, Sprangers R, Kay LE. Dynamic regulation of archaeal proteasome gate opening as studied by TROSY NMR. Science. 2010;328:98–102. doi: 10.1126/science.1184991. [DOI] [PubMed] [Google Scholar]
- 46.Rosenzweig R, Moradi S, Zarrine-Afsar A, Glover JR, Kay LE. Unraveling the mechanism of protein disaggregation through a ClpB-DnaK interaction. Science. 2013;339:1080–1083. doi: 10.1126/science.1233066. [DOI] [PubMed] [Google Scholar]
- 47.Popovych N, Tzeng SR, Tonelli M, Ebright RH, Kalodimos CG. Structural basis for cAMP-mediated allosteric control of the catabolite activator protein. Proc Natl Acad Sci USA. 2009;106:6927–6932. doi: 10.1073/pnas.0900595106. [DOI] [PMC free article] [PubMed] [Google Scholar]
- 48.Chen L, et al. Structural Instability Tuning as a Regulatory Mechanism in Protein-Protein Interactions. Mol Cell. 2011;44:734–744. doi: 10.1016/j.molcel.2011.09.022. [DOI] [PMC free article] [PubMed] [Google Scholar]
- 49.Lakshmipathy SK, et al. Identification of nascent chain interaction sites on trigger factor. J Biol Chem. 2007;282:12186–12193. doi: 10.1074/jbc.M609871200. [DOI] [PubMed] [Google Scholar]
- 50.Merz F, et al. The C-terminal domain of Escherichia coli trigger factor represents the central module of its chaperone activity. J Biol Chem. 2006;281:31963–31971. doi: 10.1074/jbc.M605164200. [DOI] [PubMed] [Google Scholar]
- 51.Patzelt H, et al. Three-state equilibrium of Escherichia coli trigger factor. Biol Chem. 2002;383:1611–1619. doi: 10.1515/BC.2002.182. [DOI] [PubMed] [Google Scholar]
- 52.Hsu STD, Dobson CM. 1H, 15N and 13C assignments of the dimeric ribosome binding domain of trigger factor from Escherichia coli. Biomol NMR Assign. 2009;3:17–20. doi: 10.1007/s12104-008-9130-8. [DOI] [PubMed] [Google Scholar]
- 53.Yao Y, Bhabha G, Kroon G, Landes M, Dyson HJ. Structure discrimination for the C-terminal domain of Escherichia coli trigger factor in solution. J Biomol NMR. 2008;40:23–30. doi: 10.1007/s10858-007-9207-1. [DOI] [PubMed] [Google Scholar]
- 54.Bardwell JC, McGovern K, Beckwith J. Identification of a protein required for disulfide bond formation in vivo. Cell. 1991;67:581–589. doi: 10.1016/0092-8674(91)90532-4. [DOI] [PubMed] [Google Scholar]
- 55.Akiyama Y, Ito K. Export of Escherichia coli alkaline phosphatase attached to an integral membrane protein, SecY. J Biol Chem. 1989;264:437–442. [PubMed] [Google Scholar]
- 56.Kamitani S, Akiyama Y, Ito K. Identification and characterization of an Escherichia coli gene required for the formation of correctly folded alkaline phosphatase, a periplasmic enzyme. EMBO J. 1992;11:57–62. doi: 10.1002/j.1460-2075.1992.tb05027.x. [DOI] [PMC free article] [PubMed] [Google Scholar]
- 57.Valent Q, et al. Early events in preprotein recognition in E. coli: interaction of SRP and trigger factor with nascent polypeptides. EMBO J. 1995;14:5494–5505. doi: 10.1002/j.1460-2075.1995.tb00236.x. [DOI] [PMC free article] [PubMed] [Google Scholar]
- 58.Lee HC, Bernstein HD. Trigger factor retards protein export in Escherichia coli. J Biol Chem. 2002;277:43527–43535. doi: 10.1074/jbc.M205950200. [DOI] [PubMed] [Google Scholar]
- 59.Marsh JA, Singh VK, Jia Z, Forman-Kay JD. Sensitivity of secondary structure propensities to sequence differences between alpha- and gamma-synuclein: implications for fibrillation. Protein Sci. 2006;15:2795–2804. doi: 10.1110/ps.062465306. [DOI] [PMC free article] [PubMed] [Google Scholar]
- 60.Dyson HJ, Wright PE. Elucidation of the protein folding landscape by NMR. Meth Enzymol. 2005;394:299–321. doi: 10.1016/S0076-6879(05)94011-1. [DOI] [PubMed] [Google Scholar]
- 61.Takeuchi K, Wagner G. NMR studies of protein interactions. Curr Opin Struct Biol. 2006;16:109–117. doi: 10.1016/j.sbi.2006.01.006. [DOI] [PubMed] [Google Scholar]
- 62.Patzelt H, et al. Binding specificity of Escherichia coli trigger factor. Proc Natl Acad Sci USA. 2001;98:14244–14249. doi: 10.1073/pnas.261432298. [DOI] [PMC free article] [PubMed] [Google Scholar]
- 63.Fenton WA, Kashi Y, Furtak K, Horwich AL. Residues in chaperonin GroEL required for polypeptide binding and release. Nature. 1994;371:614–619. doi: 10.1038/371614a0. [DOI] [PubMed] [Google Scholar]
- 64.Stirling PC, Bakhoum SF, Feigl AB, Leroux MR. Convergent evolution of clamp-like binding sites in diverse chaperones. Nat Struct Mol Biol. 2006;13:865–870. doi: 10.1038/nsmb1153. [DOI] [PubMed] [Google Scholar]
- 65.Mittermaier A, Kay LE. New tools provide new insights in NMR studies of protein dynamics. Science. 2006;312:224–228. doi: 10.1126/science.1124964. [DOI] [PubMed] [Google Scholar]
- 66.Palmer A. NMR characterization of the dynamics of biomacromolecules. Chem Rev. 2004;104:3623–3640. doi: 10.1021/cr030413t. [DOI] [PubMed] [Google Scholar]
- 67.Loria JP, Rance M, Palmer AG. A TROSY CPMG sequence for characterizing chemical exchange in large proteins. J Biomol NMR. 1999;15:151–155. doi: 10.1023/a:1008355631073. [DOI] [PubMed] [Google Scholar]
- 68.Mulder FA, Mittermaier A, Hon B, Dahlquist FW, Kay LE. Studying excited states of proteins by NMR spectroscopy. Nat Struct Biol. 2001;8:932–935. doi: 10.1038/nsb1101-932. [DOI] [PubMed] [Google Scholar]
- 69.Vallurupalli P, Hansen DF, Stollar E, Meirovitch E, Kay LE. Measurement of bond vector orientations in invisible excited states of proteins. Proc Natl Acad Sci USA. 2007;104:18473–18477. doi: 10.1073/pnas.0708296104. [DOI] [PMC free article] [PubMed] [Google Scholar]
- 70.Sugase K, Lansing JC, Dyson HJ, Wright PE. Tailoring relaxation dispersion experiments for fast-associating protein complexes. J Am Chem Soc. 2007;129:13406–13407. doi: 10.1021/ja0762238. [DOI] [PMC free article] [PubMed] [Google Scholar]
- 71.Maier R, Scholz C, Schmid F. Dynamic association of trigger factor with protein substrates. J Mol Biol. 2001;314:1181–1190. doi: 10.1006/jmbi.2000.5192. [DOI] [PubMed] [Google Scholar]
- 72.Tomkiewicz D, Nouwen N, Driessen AJM. Kinetics and energetics of the translocation of maltose binding protein folding mutants. J Mol Biol. 2008;377:83–90. doi: 10.1016/j.jmb.2008.01.014. [DOI] [PubMed] [Google Scholar]
- 73.Tyagi NK, Fenton WA, Horwich AL. GroEL/GroES cycling: ATP binds to an open ring before substrate protein favoring protein binding and production of the native state. Proc Natl Acad Sci USA. 2009;106:20264–20269. doi: 10.1073/pnas.0911556106. [DOI] [PMC free article] [PubMed] [Google Scholar]
- 74.Chakraborty K, et al. Chaperonin-catalyzed rescue of kinetically trapped states in protein folding. Cell. 2010;142:112–122. doi: 10.1016/j.cell.2010.05.027. [DOI] [PubMed] [Google Scholar]
- 75.Betton JM, Hofnung M. Folding of a mutant maltose-binding protein of Escherichia coli which forms inclusion bodies. J Biol Chem. 1996;271:8046–8052. doi: 10.1074/jbc.271.14.8046. [DOI] [PubMed] [Google Scholar]
- 76.Raffy S, Sassoon N, Hofnung M, Betton JM. Tertiary structure-dependence of misfolding substitutions in loops of the maltose-binding protein. Protein Sci. 1998;7:2136–2142. doi: 10.1002/pro.5560071010. [DOI] [PMC free article] [PubMed] [Google Scholar]
- 77.Saul FA, et al. Crystal structure of a defective folding protein. Protein Sci. 2003;12:577–585. doi: 10.1110/ps.0235103. [DOI] [PMC free article] [PubMed] [Google Scholar]
- 78.Kuriyan J, Eisenberg D. The origin of protein interactions and allostery in colocalization. Nature. 2007;450:983–990. doi: 10.1038/nature06524. [DOI] [PubMed] [Google Scholar]
- 79.Novokhatny V, Ingham K. Thermodynamics of maltose binding protein unfolding. Protein Sci. 1997;6:141–146. doi: 10.1002/pro.5560060116. [DOI] [PMC free article] [PubMed] [Google Scholar]
- 80.Sharma S, et al. Monitoring protein conformation along the pathway of chaperonin-assisted folding. Cell. 2008;133:142–153. doi: 10.1016/j.cell.2008.01.048. [DOI] [PubMed] [Google Scholar]
- 81.Farr GW, et al. Multivalent binding of nonnative substrate proteins by the chaperonin GroEL. Cell. 2000;100:561–573. doi: 10.1016/s0092-8674(00)80692-3. [DOI] [PubMed] [Google Scholar]
- 82.Shtilerman M, Lorimer GH, Englander SW. Chaperonin function: folding by forced unfolding. Science. 1999;284:822–825. doi: 10.1126/science.284.5415.822. [DOI] [PMC free article] [PubMed] [Google Scholar]
- 83.Hoffmann A, Bukau B. Trigger factor finds new jobs and contacts. Nat Struct Mol Biol. 2009;16:1006–1008. doi: 10.1038/nsmb1009-1006. [DOI] [PubMed] [Google Scholar]
- 84.Kramer G, et al. Functional dissection of Escherichia coli trigger factor: Unraveling the function of individual domains. J Bacteriol. 2004;186:3777–3784. doi: 10.1128/JB.186.12.3777-3784.2004. [DOI] [PMC free article] [PubMed] [Google Scholar]
- 85.Delaglio F, et al. NMRPipe: a multidimensional spectral processing system based on UNIX pipes. J Biomol NMR. 1995;6:277–293. doi: 10.1007/BF00197809. [DOI] [PubMed] [Google Scholar]
- 86.Sprangers R, Velyvis A, Kay L. Solution NMR of supramolecular complexes: providing new insights into function. Nat Methods. 2007;4:697–703. doi: 10.1038/nmeth1080. [DOI] [PubMed] [Google Scholar]
- 87.Velyvis A, Ruschak AM, Kay LE. An Economical Method for Production of (2)H,(13)CH(3)-Threonine for Solution NMR Studies of Large Protein Complexes: Application to the 670 kDa Proteasome. PLoS One. 2012;7:e43725. doi: 10.1371/journal.pone.0043725. [DOI] [PMC free article] [PubMed] [Google Scholar]
- 88.Güntert P. Automated NMR structure calculation with CYANA. Methods Mol Biol. 2004;278:353–378. doi: 10.1385/1-59259-809-9:353. [DOI] [PubMed] [Google Scholar]
- 89.Shen Y, Delaglio F, Cornilescu G, Bax A. TALOS+: a hybrid method for predicting protein backbone torsion angles from NMR chemical shifts. J Biomol NMR. 2009;44:213–223. doi: 10.1007/s10858-009-9333-z. [DOI] [PMC free article] [PubMed] [Google Scholar]
- 90.Schwieters C, Kuszewski J, Marius Clore G. Using Xplor–NIH for NMR molecular structure determination. Prog Nucl Magn Res Spect. 2006;48:47–62. [Google Scholar]
- 91.Brunger AT. Version 1.2 of the Crystallography and NMR system. Nat Protoc. 2007;2:2728–2733. doi: 10.1038/nprot.2007.406. [DOI] [PubMed] [Google Scholar]
- 92.Carver JP, Richards RE. A general two site solution for the chemical exchange produced dependence of T2 upon the Carr-Purcell pulse separation. J Magn Reson. 1972;6:89–105. [Google Scholar]
- 93.Tzeng SR, Kalodimos CG. Protein activity regulation by conformational entropy. Nature. 2012;488:236–240. doi: 10.1038/nature11271. [DOI] [PubMed] [Google Scholar]
Associated Data
This section collects any data citations, data availability statements, or supplementary materials included in this article.