

Abstract
Vascular endothelial growth factor (VEGF) and dexamethasone (DX) release from hydrogel coatings were examined as a means to modify tissue inflammation and induce angiogenesis. Antibiofouling hydrogels for implantable glucose sensor coatings were prepared from 2-hydro-xyethyl methacrylate, N-vinyl pyrrolidinone, and polyethylene glycol. Microdialysis sampling was used to test the effect of the hydrogel coating on glucose recovery. VEGF-releasing hydrogel-coated fibers increased vascularity and inflammation in the surrounding tissue after 2 weeks of implantation compared to hydrogel-coated fibers. DX-releasing hydrogel-coated fibers reduced inflammation compared to hydrogel-coated fibers and had reduced capsule vascularity compared to VEGF-releasing hydrogel-coated fibers. Hydrogels that released both VEGF and DX simultaneously also showed reduced inflammation at 2 weeks implantation; however, no enhanced vessel formation was observed indicating that the DX diminished the VEGF effect. At 6 weeks, there were no detectable differences between drug-releasing hydrogel-coated fibers and control fibers. From this study, hydrogel drug release affected initial events of the foreign body response with DX inhibiting VEGF, but once the drug depot was exhausted these effects disappeared.
Keywords: VEGF, dexamethasone, hydrogel, microdialysis, biosensor
INTRODUCTION
An important area of biomaterials research is examining methods to improve biocompatibility of implanted sensors (e.g. glucose) by altering the course of wound healing around implanted sensors.1,2 A number of intrinsic material characteristics have been shown to affect the level of inflammation, fibrous encapsulation and vascularity: implant chemistry, morphology, resistance to degradation, and release of leachates.3 The formation of a foreign body capsule (FBC) around smooth surfaced, nondegradable, non-leaching materials, which comprises the majority of implantable sensors, appears to be almost inevitable.4
One strategy for improving sensor biocompatibility is developing an antifouling hydrogel coating that incorporates release of anti-inflammatory and angiogenic drugs either separately or in tandem.5 Inflammation surrounding implanted sensors can influence sensor function due to the degradation of sensor materials from secreted reactive oxygen intermediates,2 decreased availability of glucose due to highly metabolizing inflammatory cells,6,7 and collagen deposition, predominately type I, during the reparative phase of wound healing.8,9 Angiogenesis, the sprouting of blood vessels, can be induced in a site-specific manner to improve vessel density surrounding implants.10 Improved analyte diffusivity through the FBC has been shown to be positively correlated with increased capsule vascularity.11
A previous study reported in vitro characterization of hydrogel coatings incorporating vascular endothelial growth factor (VEGF) and dexamethasone (DX) release.12 Two important concerns pertaining to in vivo application of this strategy for glucose sensors were (1) hydrogel permeability to glucose and (2) the impact of VEGF and DX release from hydrogels on the inflammation and vascularity of the surrounding tissues.
The current article reports an in vivo study to assess VEGF- and DX-releasing sensor coatings for promoting angiogenesis and reducing fibrous encapsulation. The first part of the study examined the in vivo glucose permeability characterization of hydrogel coating using polyethersulfone (PES) microdialysis fibers. After quantifying the permeability of the hydrogel to glucose in vivo around microdialysis probes, the second part of the study examined the impact of drug-loaded, hydrogel-coated PES fibers on the tissue surrounding the implants. PES fibers were coated with hydrogels that were loaded with no drug, VEGF, DX, or VEGF and DX simultaneously. Fibers were implanted in the dorsal subcutaneous tissue of rats for 2 and 6 weeks. The tissues surrounding the fibers were examined for changes in capsule vascularity and inflammation. To our knowledge, this is the first in vivo study of the dual release of anti-inflammatory and angiogenic drugs.
MATERIALS AND METHODS
Hydrogel preparation
As detailed elsewhere,12 the hydrogel monomer solution was prepared by combining 6.0 g of 2-hydroxyethyl methacrylate (Polysciences, Warrington, PA), 2.4 g of 1-vinyl-2-pyrrolidinone (Sigma, St. Louis, MO), 2.4 g of poly(ethylene glycol) 400 monomethacrylate (Polysciences), and 3.57 g of deionized (DI) water. The polymer was crosslinked with 350 mg of poly(ethylene glycol) 400 dimethacrylate (Polysciences). The reaction was initiated with 225 mg ammonium persulfate (APS, Sigma). After degassing the solution for 2 min to dissolve APS, hydrogel prepolymer solution (2.6 mL) was diluted with DI water (7.4 mL). Finally, the reaction accelerated with the addition of 5 μL of tetra-methylethylenediamine (TMEDA).
Microdialysis probe hydrogel coating
CMA/20 microdialysis probes (CMA/Microdialysis, North Chelmsford, MA) were used for microdialysis testing. The microdialysis probes were constructed with 100 kDa molecular weight cutoff PES membranes having dimensions of 10 mm length and 0.5 mm diameter. Teflon tubing (polytetrafluoroethylene, American wire gauge 20 standard wall tubing with inner diameter of 0.8–0.9 mm, M.M. Newman Corp., Marblehead, MA) was placed around the 0.5 mm diameter microdialysis probe tips to provide a cylindrical mold for polymerization. Teflon tubing and microdialysis probes were sterilized using ethylene oxide prior to hydrogel coating. Using a syringe, the hydrogel prepolymer solution was passed through a 0.2-μm filter and quickly dispensed into the Teflon tubing. Then, the Teflon tubing was sealed at one end using ethylene oxide sterilized Hematoseal (Fisher Scientific, Pittsburg, PA). The hydrogels were polymerized for 2 h in a sterile laminar flow hood. After polymerization, Teflon tubing was removed from the hydrogel-coated microdialysis probes. All the microdialysis probes were stored in sterile phosphate buffered saline (PBS) at 4°C overnight to ensure hydration of the hydrogel coatings and membranes prior to in vitro testing.
PES fiber hydrogel coating
PES, 0.5 mm diameter, fibers were removed from a Mid-iKros filtration module (Spectrum Laboratories, Rancho Dominguez, CA), cut into 10 mm lengths, and sterilized with ethylene oxide. Hydrogel coating of fibers was performed under sterile conditions in a laminar flow hood. VEGF and DX were incorporated into the prepolymer solution as described previously.12 VEGF hydrogel coatings were prepared at a concentration of 200 μg/mL VEGF; DX hydrogel coatings were prepared at a concentration of 5 mg/mL DX. Hydrogels prepared at these drug concentrations contained ~900 ng of VEGF and 20 μg of DX. VEGF + DX hydrogel coatings were prepared with a combination of 200 μg/mL VEGF and 5 mg/mL DX. The hydrogel prepolymer solutions were sterilized by syringe filtration through a 0.2-μm filter. The reaction accelerated with the addition of 5 μL of TMEDA. TMEDA accelerator was also filtered through a 0.2-μm filter prior to addition. PES fibers were coated with hydrogels by placing Teflon tubing about the fibers and injecting hydrogel prepolymer solution into the tubing using a syringe. The hydrogel coatings were cast in Teflon tubing which was sealed at both ends using Hematoseal. Prior to implantation, the hydrogels were removed from Teflon tubing and placed in 0.5 mL of Dulbecco’s PBS for a minimum of 1 h.
Specimen implantations
Approval for these studies was granted by the Duke University Animal Care Committee prior to their initiation. During these studies, National Institutes of Health guidelines for the care and use of laboratory animals (NIH Publication No. 85-23 Rev. 1985) were observed. Male Sprague–Dawley rats (250–350 g) were anesthetized with sodium pentobarbital (50 mg/kg, intraperitoneal; Abbott Laboratories, North Chicago, IL) for microdialysis probe implantation and isoflurane (2.5% in oxygen; Baxter Healthcare Corp., Deerfield, IL) for PES fiber implantation.
The microdialysis probes and PES fibers were implanted subcutaneously in the rats ~5–7 cm below the scapular region. The microdialysis probe inlet and outlet tubings were tunneled beneath the skin using a trocar. A small incision was made between the shoulder blades for the inlet and outlet tubings to exit the skin. A small portion of the inlet and outlet tubings, ~2.5 cm, were left exposed for microdialysis sampling. During periods when measurements were not taken, the inlet and outlet tubings were joined with a connector (CMA/Microdialysis) filled with PBS. All rats were allowed rat chow and water ad libitum.
In vitro microdialysis glucose sampling
In vitro calibration was performed by using a step increase in glucose concentration outside the microdialysis probes. One hydrogel coated and one bare microdialysis probe was tested simultaneously at room temperature. The microdialysis probes were placed first in PBS solution and perfused with PBS at a flow rate of 2 μL/min using 1-mL gastight syringes and syringe pump (Queen Bee™ with Worker Bee™, BAS, West Lafayette, IN). Dialysate samples were collected at 2, 4, 6, 8, 10, 15, 20, and 30 min. After 30 min, the probes were placed in a well-stirred 5.6 mM glucose solution in PBS, and samples were collected at the same time intervals. The probes were cycled between PBS and the glucose solution for a total of five times. Dialysate samples were immediately capped and stored at −20°C until analysis. All dialysate samples and aliquots of glucose solution were analyzed with a CMA 600 microdialysis analyzer (CMA/Microdialysis). Steady-state percent glucose recovery was determined by averaging the recoveries from all times after 4 min. Extraction fraction (Ed) of glucose was determined by
| (1) |
where Cd, Ci, and Ce are the average glucose concentrations in the outlet dialysate, inlet dialysate, and medium external to the microdialysis probe, respectively. The effectiveness of microdialysis sampling was reported as percent recovery, determined by
| (2) |
In vivo microdialysis glucose sampling
Rats were anaesthetized during all microdialysis collections. Microdialysis samples were collected on the day of implantation as well as 2, 5, and 8 days postimplantation. Microdialysis was performed by perfusing the probes with sterile Ringer’s solution (Abbott Laboratories, Abbott Park, IL) at a flow rate of 2 μL/min. The probes were allowed to flush for 20 min prior to collecting samples. Samples were collected every 10 min for 1 hr. Tail vein blood was collected every 20 min. Glucose concentration from tail blood was analyzed using Ascensia Elite XL (Bayer Corporation, Mishawaka, IN). Glucose concentration from microdialysis samples were analyzed using the CMA 600 microdialysis analyzer. Percent glucose recoveries were determined from sample concentrations and blood glucose concentrations.
Calculation of microdialysis percent recovery
Figure 1(A) illustrates the microdialysis probe tip where glucose uptake occurs and the outflow where dialysate samples are collected. The schematic of microdialysis probe tip in Figure 1(B) shows the dimensions employed in the calculation of transport resistances using the Bungay, Morrison, and Dedrick (BMD) model.13 Transport resistances are described in terms of microdialysis probe geometry, glucose diffusion coefficient in water and the membrane, and the availability of analytes exterior to the probe. This model employs steady state mass balances to relate the extraction fraction to the perfusate flow rate (Qd) and a series of mass transport resistances.
Figure 1.
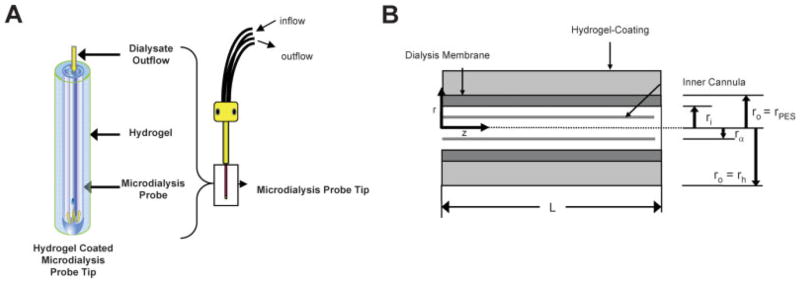
A: Illustration of microdialysis probe. Glucose uptake occurs at the microdialysis probe tip. Dialysate flows slowly through an annular region between the inner cannula and the microdialysis membrane. Dialysate samples are collected from the outlet tubing and analyzed for analyte concentrations. B: Schematic illustration of microdialysis probe tip geometry. Microdialysis sampling occurred by analytes diffusing across the semipermeable membrane into the dialysate. The dialysate flowed through an annulus with inner radius of rα and an outer radius of ri adjacent to the microdialysis membrane and exits the probe through the inner cannula. The semipermeable microdialysis membrane was of thickness ro − ri and has length of L. [Color figure can be viewed in the online issue, which is available at www.interscience.wiley.com.]
| (3) |
where Rd, Rm, and Re are mass transport resistances of the dialysate, membrane, and external medium, respectively. The calculation of Rm was modified to separate the contributions of mass transport resistances from the hydrogel (Rh) and PES membrane (RPES).
| (4) |
A similar modification to Re was used to determine the relative contributions of biofouling and tissue resistance.14 In the BMD model, the transport resistances due to the dialysate and membrane were given by
| (5) |
| (6) |
where ra is the radius of the inner cannula, ri is the inner membrane radius, ro is the outer membrane radius, L is the length of the microdialysis membrane, Dd is the diffusion coefficient of the analyte in the dialysate (6.73 × 10⁻⁶ cm2/s for glucose15), Dm is the effective diffusion coefficient of the analyte in the membrane, and ϕm is the accessible volume fraction of the membrane. All in vitro microdialysis experiments were performed in a well-stirred glucose solution, where Re = 0.
Calculation of transport resistances
Mean steady state Ed from microdialysis probes calibrated in vitro were used to experimentally determine values of Rm with and without hydrogel coating. When Ed was measured from bare microdialysis probes, Eqs. (3) and (5) were used to calculate Rm = RPES; when Ed was measured from hydrogel microdialysis probes, Eqs. (3) and (5) were used to calculate Rm = RPES + Rh.
Estimation of biofouling resistance
An estimation of the transport resistance due to biofouling was calculated from the mean steady state Ed determined in vitro and immediately after implantation for hydrogel-coated and bare probes. To determine exterior transport resistance in vivo, Rm and Rd were subtracted from the total transport resistance calculated from the mean steady state Ed on day 0. Assuming that biofouling was eliminated for hydrogel-coated microdialysis probes, the resistance of biofouling was calculated by subtracting the Re of bare probes from Re of hydrogel-coated probes.
Specimen harvesting and histological preparation
The rats with implanted microdialysis probes and PES fibers were sacrificed by peritoneal or intracardiac administration of Euthasol (Virbac Animal Health, Fort Worth, TX), respectively. The tissue surrounding the microdialysis probe membranes and PES fibers were surgically excised, fixed in 10% formalin, mounted in paraffin, and cut into 7-μm sections for histological staining. Tissues surrounding microdialysis probes were stained with Gomori’s trichrome. Tissues surrounding PES fibers were stained with hematoxylin and eosin (H&E) and antifactor VIII-related antigen using immunohistochemistry.
Immunohistochemical staining protocol
Immunohistochemical staining of tissue sections were performed as described in detail by Rizzieri et al.16 Briefly, slides prepared with paraffin imbedded sections were deparaffinized in xylene and were cleared through in 95% ethanol. Endogenous peroxidase activity was blocked using 0.6% hydrogel peroxide in methanol. The antigenic sites were unmasked using 25% pepsin (Sigma, St. Louis, MO) in automation buffer (Biomedia) at 37°C. The slides were incubated in background buster (Innovex Biosciences, Richmond, CA) at room temperature. Following blocking, the primary antibody and rabbit antihuman von Willebrand factor (vWF) (factor VIII-related antigen, Dako Corp., Carpinteria, CA) were applied to the slides in 1% bovine serum albumin (BSA) in PBS at room temperature. Afterwards, the slides were incubated in biotinylated goat antirabbit antibody (Vector Labs, Burlingame, CA) in 1% BSA in PBS at room temperature. ABC-Elite Kit (Vector Labs) and 3,3′ diaminobenzidine (DAB) working solution (Innovex Biosciences) were applied at room temperature to the slides. The slides were counterstained in Harris hematoxylin (Fisher Scientific, Pittsburgh, PA).
Assessing inflammation surrounding implants
H&E stained slides of tissue sections were graded by three separate observers for inflammation intensity. The observers were blinded to the identity of the implants. The slides of implant cross-sections were randomized prior to grading. The grading was performed according to the following using criteria from: 0 = no inflammation, 1 = trace inflammation, 2 = mild inflammation (scattered leukocytes), 3 = moderate inflammation (diffuse leukocytic infiltration), 4 = severe inflammation (dense leukocyte infiltration). The median score and interquartile range was determined for each implant type. In the interpretation of the results, a tissue with a higher inflammation score was considered to be more inflamed than tissue with a lower score.
Quantifying vessel density surrounding implants
Factor VIII-related antigen stained slides of implant cross-sections were analyzed by assessing vessel density surrounding the implant. Three representative images per implant were taken at 40× magnification using a camera (Axiocam MRc, Carl Zeiss MicroImaging, Thornwood, NY) mounted on a microscope (Axioskop Plus, Carl Zeiss). The images were captured using MRGrab software (Carl Zeiss). The images were randomized prior to assessing vessel density. The criteria for counting vessels in tissue surrounding the implants was that the vessels must be within 40 μm of the implant surface and the vessels had to have a lumen sufficient for passage of red blood cells. Individual endothelial cells that were stained by factor VIII-related antigen were not included in vessel counts. Area measurements were made by placing a square grid on top of the images using Adobe Photoshop CS2 (Adobe Systems, San Jose, CA). The area of tissue examined for vessel density was quantified by counting the number of 400 μm2 boxes within 40 μm of the implant surface. The total area and vessel number was determined for each implant by summing the areas and vessel counts from the three representative images. Mean area and vessel number were calculated for each implant type, such as bare, hydrogel-coated, and drug-releasing hydrogel-coated fibers.
Statistical analysis
The microdialysis glucose recovery data were presented as mean ± standard error of the mean. For tests of multiple comparisons, two-way analysis of variance (ANOVA) with Bonferroni post-tests was used to determine statistical significance. Vessel density data are shown as means with standard errors of the mean as error bars. Statistical significance was determined by performing a single factor ANOVA with Tukey–Kramer post-tests for multiple comparisons. Since inflammation scores are not normally distributed, inflammation scoring data are shown by box-and-whisker plot displaying the medians, 25% quartiles, 75% quartiles, and ranges of the data. Nonparametric tests were used to analyze inflammation score data. Statistical significance was determined by performing Kruskal–Wallis test with Dunn’s post tests for multiple comparisons. The threshold for significance was p < 0.05. Statistical analyses were performed using GraphPad Prism software package (GraphPad Software, San Diego, CA).
RESULTS
Microdialysis glucose sampling
Microdialysis probes had in vitro steady state glucose recoveries of (66.1 ± 1.0)% and (48.6 ± 1.3)% for bare and hydrogel-coated probes, respectively (n = 3). The glucose concentrations of the dialysate from all microdialysis probes were within 31–45% of the blood glucose values throughout the study. On the day of implantation, glucose percent recoveries were (45 ± 3)% and (39 ± 4)% for bare (n = 5) and hydrogel-coated (n = 8) microdialysis probes, respectively. On day 8, glucose percent recoveries were (36 ± 2)% and (31 ± 4)% for bare and hydrogel-coated microdialysis probes, respectively. During the course of the in vivo testing, both the bare and hydrogel-coated microdialysis probes both had ~20% reductions in sampling efficiency; there were no significant differences in glucose recovery at any time point from microdialysis probes with or without a hydrogel-coating. Table I shows the transport resistances calculated from mean in vitro and in vivo glucose recoveries. The resistance due to biofouling was estimated by subtracting the exterior resistance of hydrogel-coated microdialysis probes immediately after implantation from exterior resistance of bare microdialysis probes. The resistance due to biofouling was found to be approximately equal to 130 min/cm3 (i.e. ΔRe = 380 − 250 min/cm3 on day 0). In other words, biofouling comprised roughly one-third of the 380 min/cm3 external glucose mass transfer resistance, calculated from bare PES probe glucose recoveries on the day of implantation. By day 8, however, the external glucose mass transfer resistances of bare and hydrogel coated probes both increased to values of 640 and 550 min/cm3, respectively. Assuming that the hydrogel continues to resist biofouling on day 8, the contribution due to biofouling (i.e. ΔRe = 640 − 550 = 90 min/cm3) has reduced by one-third by day 8, and the nonbiofouling contributions to the external glucose mass transfer resistances on day 8 (i.e. 550 min/cm3) exceeded biofouling effects on day 0 by fourfold and on day 8 by sixfold. The results strongly suggest that resistance to biofouling is necessary but an insufficient in vivo strategy for improving glucose sensing.
TABLE I.
Estimation of the Biofouling Resistance from Calculation of Transport Resistances
| Bare Probes
|
Hydrogel-Coated Probes
|
|||||
|---|---|---|---|---|---|---|
| Rd + RPES + Re (min/cm3) | RPES (min/cm3) | Re (min/cm3) | Rd + RPES + Rh + Re (min/cm3) | RPES + Rh (min/cm3) | Re (min/cm3) | |
| In vitro calibration | 460 | 440 | N/A | 750 | 730 | N/A |
| Day 0 | 840 | 440 | 380 | 1000 | 730 | 250 |
| Day 2 | 890 | 440 | 430 | 1100 | 730 | 350 |
| Day 5 | 1100 | 440 | 640 | 1200 | 730 | 450 |
| Day 8 | 1100 | 440 | 640 | 1300 | 730 | 550 |
Total, membrane, and exterior transport resistances were tabulated from in vitro and in vivo mean glucose recoveries from bare and hydrogel-coated microdialysis probes. The dialysate resistance, Rd, was calculated to be 20 min/cm3. The difference between exterior resistances in vivo from bare and hydrogel-coated probes immediately after implantation was estimated to be 130 min/cm3, which is the transport resistance due to biofouling.
Histological examination of implanted microdialysis probes
Figure 2 shows the Gomori’s trichrome stained images of bare and hydrogel-coated microdialysis probes after 8 days of implantation. Bare microdialysis probes were surrounded by inflammatory cells that migrated into the interstices of the membrane. Hydrogel coating is visible within the pores of the probes as well as surrounding the surface of the micro-dialysis probes. The presence of hydrogel prevented the migration of inflammatory cells into the pores of the microdialysis membrane.
Figure 2.
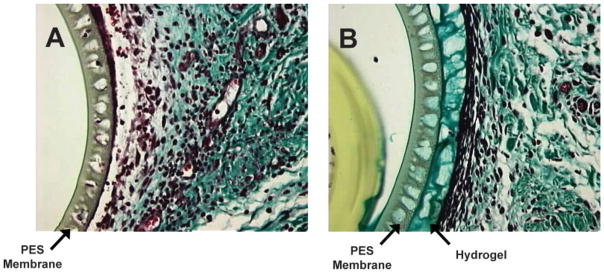
The hydrogel-coated and bare PES probes were implanted for 8 days in rat subcutaneous tissue. After explantation, the tissue was sectioned and stained with Gomori’s Trichrome. (A): Explanted bare PES probe, (B) Explanted hydrogel-coated PES probe. The microdialysis probe membrane is 40 μm in thickness. The hydrogel coating stained green and is visible within the pores of the microdialysis probes. [Color figure can be viewed in the online issue, which is available at www.interscience.wiley.com.]
Histological examination of tissues surrounding PES fibers
Figure 3 shows H&E staining for representative implants after 2 and 6 week implantation in rat subcutaneous tissue. Inflammatory cell infiltrate was found surrounding the implants from the acute inflammatory phase at 2 weeks. At 6 weeks, few inflammatory cells were found surrounding implants. Capillaries are also found in the tissue surrounding implants.
Figure 3.

H&E stained images (60×) of implants in rat subcutaneous tissue after 2 and 6 week implantation periods from PES fibers (A and F), hydrogel-coated PES fibers (B and G), VEGF-releasing hydrogel-coated PES fibers (C and H), DX-releasing hydrogel-coated PES fibers (D and I) and VEGF-DX-releasing hydrogel-coated fibers (E and J). Panels (A–E) display tissue sections explanted at 2 weeks. Panels (F–J) display tissue sections explanted at 6 weeks. Asterisk (*) indicates position of implant in image. Scale bars are equal to 50 μm. [Color figure can be viewed in the online issue, which is available at www.interscience.wiley.com.]
Vessel density analysis
Figure 4 displays representative factor VIII-related antigen stained slides from explanted hydrogel-coated and bare PES fibers. Blood vessels within 40 μm of the implant surface were counted for each implant type. The areas within 40 μm of the implant surface were 34600 ± 500 and 36800 ± 600 μm2 for the 2-week (n = 49) and 6-week (n = 22) implantations, respectively. Drug-free hydrogel-coated fibers were controls to drug releasing hydrogels. Therefore, hydrogel-coated fibers were validated against PES fibers to ensure no statistically significant impact of the hydrogel coating alone. There were no significant differences between the mean areas examined for each implant type. Figures 5 and 6 display the mean number of blood vessels found within 40 μm of the implant surface according to implant type. Vessel density surrounding hydrogel-coated and PES fibers were not significantly different, providing validation for comparing the effect of drug treatment. At two weeks, the mean number of vessels found within 40 μm of VEGF-releasing implants was significantly greater than the mean number of vessels surrounding all implant types, except VEGF + DX-releasing hydrogel coated fibers (p < 0.05). VEGF-releasing hydrogel-coated fibers were found to induce a fourfold increase in tissue vascularity compared to hydrogel-coated fiber controls. At 6 weeks, conclusions could not be drawn regarding the impact of drug treatment because vessel density surrounding hydrogel-coated and PES fibers were different.
Figure 4.

Factor VIII-related antigen stained tissue sections from 2 to 6 week implantation studies in rat subcutaneous tissue from PES fibers (A and F), hydrogel-coated PES fibers (B and G), VEGF-releasing hydrogel-coated PES fibers (C and H), DX-releasing hydrogel-coated PES fibers (D and I) and VEGF-DX-releasing hydrogel-coated fibers (E and J). Panels (A–E) display tissue sections explanted at 2 weeks. Panels (F–J) display tissue sections explanted at 6 weeks. Asterisk (*) indicates position of implant in image. Scale bars are equal to 50 μm. [Color figure can be viewed in the online issue, which is available at www.interscience.wiley.com.]
Figure 5.

Number of blood vessels within 40 μm of implant surface after 2 weeks implantation in rat subcutaneous tissue. The implanted materials were bare PES fibers (PES, n = 9), hydrogel-coated PES fibers (GEL, n = 10), VEGF-releasing hydrogel-coated PES fibers (VEGF GEL, n = 10), DX-releasing hydrogel-coated PES fibers (DX GEL, n = 10), and VEGF + DX-releasing hydrogel-coated PES fibers (VEGF + DX GEL, n = 10). VEGF-releasing hydrogels were shown to have a significantly increased blood vessel count compared to VEGF-DX-releasing hydro-gel-coated, hydrogel-coated, and bare fibers (p < 0.05).
Figure 6.

Number of blood vessels within 40 μm of implant surface after 6 weeks implantation in rat subcutaneous tissue. The implanted materials were bare PES fibers (PES, n = 3), hydrogel-coated PES fibers (GEL, n = 4), VEGF-releasing hydrogel-coated PES fibers (VEGF GEL, n = 6), DX-releasing hydrogel-coated PES fibers (DX GEL, n = 5), and VEGF + DX-releasing hydrogel-coated PES fibers (VEGF + DX GEL, n = 4). Data were found to be inconclusive for statistical analysis.
Inflammation surrounding implanted fibers
Figures 7 and 8 are box-and-whisker plots of inflammation scores of implanted bare and hydrogel-coated fibers. There were no significant differences between bare fibers and hydrogel-coated fibers, validating hydrogel-coated fibers as controls for drug treatment. After 2 weeks implantation, the tissue surrounding VEGF-releasing hydrogel-coated fibers was found to be significantly more inflamed than hydrogel-coated and DX-releasing hydrogel-coated fibers (p < 0.05). The data collected at 6 weeks were found to be statistically inconclusive due to small sample size.
Figure 7.

Inflammation score of tissues surrounding implants after 2 weeks implantation in rat subcutaneous tissue. The implanted materials were bare PES fibers (PES, n = 9), hydrogel-coated PES fibers (GEL, n = 9), VEGF-releasing hydrogel-coated PES fibers (VEGF GEL, n = 6), DX-releasing hydrogel-coated PES fibers (DX GEL, n = 8), and VEGF + DX-releasing hydrogel-coated PES fibers (VEGF + DX GEL, n = 9). The tissues surrounding VEGF-releasing hydrogel-coated fibers were significantly inflamed compared to tissue surrounding hydrogel-coated and DX-releasing hydrogel-coated fibers (p < 0.05).
Figure 8.

Inflammation score of tissues surrounding implants after 2 weeks implantation in rat subcutaneous tissue. The implanted materials were bare PES fibers (PES, n = 4), hydrogel-coated PES fibers (GEL, n = 5), VEGF-releasing hydrogel-coated PES fibers (VEGF GEL, n = 4), DX-releasing hydrogel-coated PES fibers (DX GEL, n = 4), and VEGF + DX-releasing hydrogel-coated PES fibers (VEGF + DX GEL, n = 3). Median score for VEGF-DX-releasing hydrogel-coated fibers was found to be zero. Data collected were found to be statistically inconclusive due to small sample size.
DISCUSSION
The first part of this study evaluated the in vivo glucose permeability of hydrogel coatings, previously characterized for antifouling properties and drug release.12,17 The results demonstrated that the antifouling coatings, while glucose permeable, were not sufficient for preventing a decline in glucose recoveries during an 8-day study. Percent glucose recovery was calculated by assuming that the interstitial glucose concentration is equal to that of blood glucose concentrations, which is a common assumption in interstitial fluid glucose sensing devices.18–20 This assumption remains valid for rapid exchange between the vasculature and the interstitial fluid. Declining percent recoveries can be attributed to alteration in the tissue surrounding the microdialysis probes, since previous studies of hydrogel-coated and bare microdialysis probes in whole blood in vitro did not show a decline in glucose recovery.17 Using the membrane transport resistances calculated from in vitro calibration, the total transport resistances immediately after implantation were calculated to be ~840 and 1000 min/cm3 for bare and hydrogel-coated probes, respectively. The impact of biofouling was estimated as 130 min/cm3, assuming that the difference between tissue resistances of bare and hydrogel-coated microdialysis probes was due to prevention of protein and cell adhesion by the hydrogel. This estimate of bio-fouling transport resistance was greater than that found by Wisniewski et al. for explanted PES micro-dialysis probes.14 It is postulated that this loss in sensitivity is due to the progression of the foreign body response (foreign body reaction) that typically culminates in an avascular and fibrotic capsule surrounding the implant.2
In the second part of the study, the hydrogel coatings, modified to incorporate drugs, were examined for their ability to affect biofouling, inflammation, and capsule vascularity that contributes to the in vivo failure of implanted glucose sensors. Due to instability and rapid clearance of therapeutic proteins and steroids after bolus delivery, local delivery of tissue response modifiers by polymeric implant coatings provide a compelling approach for altering capsular development towards increased vascularity and reduced fibrosis. Small quantities of growth factors (picograms to nanograms) and steroids (nano-molar to micromolar) are required to stimulate a response.21–24 The half lives of protein drugs are on the order of minutes when delivered intravenously25; therefore sustained delivery systems provide a method for maintaining an effective therapeutic concentration at a local site.
VEGF, a potent angiogenic factor, was released from hydrogel coatings on PES fibers. VEGF release has been used to improve the vascularity of implanted scaffolds for tissue engineering and glucose sensors.26–31 The sustained release of DX and VEGF from hydrogel preparations were previously characterized for one month in vitro.12 Hydrogels were shown to have an approximate daily release of 90 ng/day DX and 100 pg/day VEGF after an initial burst release.12 The number of blood vessels within 40 μm of the implant surface has been used previously as a criteria for assessing tissue vascularity surrounding a sensor.31 VEGF-releasing hydrogels were found to be effective in vascularizing the tissue surrounding the implant at 2 weeks, as shown by the data in Figure 5. The 6 weeks data was statistically inconclusive due to variability of the data. Further experimentation will be necessary to determine the effect of VEGF hydrogel release over longer periods than 2 weeks. Neovascularization induced by VEGF is prone to regression over time when VEGF concentrations are below a critical threshold.32–34 Vessel regression was also observed from implanted VEGF-releasing hydrogel disks after 50 days of implantation.29 In contrast, after 40 days implantation, the capsules surrounding model sensors equipped with an infusion pump delivering 0.45 μg VEGF per day were significantly more vascularized compared to controls.31
Factor VIII related antigen, vWF antibody staining was used to detect blood vessels in tissue sections. vWF staining has been proven to reliably detect vascular endothelial cells and has been used to determine vessel density.35,16 Staining with CD31 or CD34 also detects vascular endothelial cells, but CD31 also plays a role in the adhesion cascade between endothelial cells and inflammatory cells.36,37 Thus, CD31 also stains for monocytes, macrophages, and neutrophils,38,39 and may produce ambiguous results. CD34-staining of human skin showed that adipocytes and interstitial cells around vessels stained positively.39 As no vascular marker distinguishes between pre-existing vessels and those produced recently by angiogenesis,40 staining with CD31 or CD34 may have been equally useful for staining sections in this study. However, since endothelial cells of different tissues can have heterogeneous expression of CD31, CD34, and vWF,39,40 immunohistochemical staining must be verified before it can be conclusively stated that CD31 and CD34 would be equally useful for staining of tissue sections in this study. Nonetheless, vWF was found to be a suitable stain in this study for detecting blood vessels.
The tissue surrounding VEGF-releasing hydrogels was found to be more inflamed than the tissue surrounding hydrogel-coated control implants, as shown in Figure 7. VEGF-releasing hydrogel-coated fibers were surrounded by a dense population of inflammatory cells due to the acute inflammation phase of wound healing. In addition to being a potent angiogenic factor, VEGF is also a potent chemoattractant for inflammatory cells (an interaction often not mentioned in the biomaterials literature) particularly the 165 amino acid isoform of VEGF.41–45 Inflammation induced by VEGF has been found to be necessary for pathological neovascularization of ischemic retina.44 VEGF has also been shown to stimulate angiogenesis in inflamed tissue through macrophage recruitment.42 Neovascularization and increased inflammation observed at 2 weeks surrounding the VEGF-releasing hydrogels may have been VEGF-mediated by macrophage recruitment. Increased inflammatory cell recruitment can lead to reduced glucose availability to glucose sensors.2,6 Inflammation and fibrosis was noted after 8–9 days implantation when VEGF gene delivery was used to induce neovascularization surrounding glucose sensors in ex ova chick chorioallantoic membranes.28 There was no significant fibrosis or inflammation after 40 days implantation associated with model sensors equipped with VEGF infusion pumps.31
Administration of DX, a synthetic glucocorticoid, has been shown to reduce collagen deposition, edema formation, and immune cell recruitment to wound sites.25 Site-specific sustained release of DX reduces the required dosage to stimulate a local effect compared to consecutive systemic intravenous dosing regimens.46 Local delivery of DX has found to cause reduced neointimal hyperplasia when employed in balloon angioplasty and steroid eluting stents.47–50 DX releasing pacemaker leads have also been produced commercially by Medtronic.51 Systemic administration of DX can lead to side effects, including excessive thirst and urination, adrenal gland atrophy, and blood vessel injury.52 DX release from microspheres was shown to reduce inflammation associated with implanted materials.53 At 2 weeks, dual release of VEGF and DX reduced the vascularization associated with VEGF release alone. DX has been shown to reduce the expression of VEGF receptors,54 which can reduce the potency of VEGF administration on inducing angiogenesis. However, VEGF-induced vascularization has been induced by DX administration using VEGF gene delivery with a DX controlled promoter.55 The immune cell infiltration around DX-releasing hydrogel-coated fibers was not significantly different from hydrogel-coated fiber controls at 2 weeks.
Biocompatible hydrogel coatings for glucose sensors will require further modification to permanently alter the foreign body reaction. Addressing biofouling alone using hydrogel coatings was not sufficient to attenuate the foreign body reaction; despite such coatings, glucose recoveries declined over time. Incorporating drug release into antifouling coatings is a promising approach to altering the foreign body response towards a less fibrotic and more vascularized encapsulation tissue. While VEGF release led to an increase in vascularity, tissues surrounding these implants were highly inflamed. Sustained release of higher doses of VEGF may be sufficient to improve long-term capsule vascularity. However, it is unknown whether or not the inflammation due to VEGF treatment persists as chronic inflammation with continuous VEGF administration. Since inflammatory cells have increased glucose consumption compared to native tissue,6 glucose sensors surrounded by persistent inflammation may not be the best solution to long-term sensitivity losses. DX release from sensor coatings appears to be a more plausible solution because most sensors have only been FDA-approved for short-term applications.56 These sensors required a settling in period of 2 h before plasma glucose and sensor current remained stable for the following 5 h,57 though this settling in period does not extend beyond the resolution of acute inflammation or address long-term loss in vivo sensitivity. Acute inflammation associated with implantation can be attenuated with anti-inflammatory treatment. VEGF and DX coadministration led to a response similar to DX treatment alone. It is possible that optimization of the concentrations of VEGF and DX could prevent counteractive effects.
CONCLUSIONS
Development of biocompatible coatings for implantable glucose sensors must address key aspects of the foreign body reaction, such as biofouling, inflammation, and capsule vascularity. DX-release from hydrogel coatings attenuated inflammation induced by implants; however, control implants in this study also did not stimulate an intense inflammatory response. VEGF-releasing hydrogel coatings were found to stimulate both vascularization and inflammation. Dual release of VEGF and DX led to reduced capsule vascularity compared to VEGF release alone after 2 weeks of implantation, indicating that DX release diminished this response. VEGF administration with glucose sensors may be useful by increasing vascularity; however, increased number of VEGF-recruited inflammatory cells may lead to increased glucose consumption. Improved capsule vascularity may improve the longevity of the glucose sensors in vivo; however, future investigations should determine how to best achieve long-term vascularity without inducing inflammation.
Acknowledgments
Contract grant sponsor: NIH; contract grant number: DK54932
Contract grant sponsor: UNCF/Merck Dissertation Fellowship
The authors thank Drs. Alan Proia, Kevin Olbrich, and Theodore Slotkin for helpful discussion.
References
- 1.Moussy F, Reichert WM. Biomaterials community examines biosensor biocompatibility. Diabetes Technol Ther. 2000;2:473–477. doi: 10.1089/15209150050194341. [DOI] [PubMed] [Google Scholar]
- 2.Wilson GS, Gifford R. Biosensors for real-time in vivo measurements. Biosens Bioelectron. 2005;20:2388–2403. doi: 10.1016/j.bios.2004.12.003. [DOI] [PubMed] [Google Scholar]
- 3.Brauker JH, Carr-Brendel VE, Martinson LA, Crudele J, Johnston WD, Johnson RC. Neovascularization of synthetic membranes directed by membrane microarchitecture. J Biomed Mater Res. 1995;29:1517–1524. doi: 10.1002/jbm.820291208. [DOI] [PubMed] [Google Scholar]
- 4.Ratner BD, Bryant SJ. Biomaterials: Where we have been and where we are going. Annu Rev Biomed Eng. 2004;6:41–75. doi: 10.1146/annurev.bioeng.6.040803.140027. [DOI] [PubMed] [Google Scholar]
- 5.Wisniewski N, Moussy F, Reichert WM. Characterization of implantable biosensor membrane biofouling. Fresenius J Anal Chem. 2000;366:611–621. doi: 10.1007/s002160051556. [DOI] [PubMed] [Google Scholar]
- 6.Forster J, Morris AS, Shearer JD, Mastrofranscesco B, Inman KC, Lawler RG, Bowen W, Caldwell MD. Glucose uptake and flux through phosphofructokinase in wounded rat skeletal muscle. Am J Phys. 1989;256:E788–E797. doi: 10.1152/ajpendo.1989.256.6.E788. [DOI] [PubMed] [Google Scholar]
- 7.Gilligan BJ, Shults MC, Rhodes RK, Jacobs PG, Brauker JH, Pintar TJ, Updike SJ. Feasibility of continuous long-term glucose monitoring from a subcutaneous glucose sensor in humans. Diabetes Technol Ther. 2004;6:378–386. doi: 10.1089/152091504774198089. [DOI] [PubMed] [Google Scholar]
- 8.Anderson JM. Biological responses to materials. Annu Rev Mater Res. 2001;31:81–110. [Google Scholar]
- 9.Woodward SC. How fibroblasts and giant-cells encapsulate implants—Considerations in design of glucose sensors. Diabetes Care. 1982;5:278–281. doi: 10.2337/diacare.5.3.278. [DOI] [PubMed] [Google Scholar]
- 10.Patel ZS, Mikos AG. Angiogenesis with biomaterial-based drug-and cell-delivery systems. J Biomater Sci Polym Ed. 2004;15:701–726. doi: 10.1163/156856204774196117. [DOI] [PubMed] [Google Scholar]
- 11.Sharkawy AA, Klitzman B, Truskey GA, Reichert WM. Engineering the tissue which encapsulates subcutaneous implants. II. Diffusion properties. J Biomed Mater Res. 1997;37:401–412. doi: 10.1002/(sici)1097-4636(19971205)37:3<401::aid-jbm11>3.0.co;2-e. [DOI] [PubMed] [Google Scholar]
- 12.Norton LW, Tegnell E, Toporek SS, Reichert WM. In vitro characterization of vascular endothelial growth factor and dexamethasone releasing hydrogels for implantable probe coatings. Biomaterials. 2005;26:3285–3297. doi: 10.1016/j.biomaterials.2004.07.069. [DOI] [PubMed] [Google Scholar]
- 13.Bungay PM, Morrison PF, Dedrick RL. Steady-state theory for quantitative microdialysis of solutes and water in vivo and in vitro. Life Sci. 1990;46:105–119. doi: 10.1016/0024-3205(90)90043-q. [DOI] [PubMed] [Google Scholar]
- 14.Wisniewski N, Klitzman B, Miller B, Reichert WM. Decreased analyte transport through implanted membranes: Differentiation of biofouling from tissue effects. J Biomed Mater Res. 2001;57:513–521. doi: 10.1002/1097-4636(20011215)57:4<513::aid-jbm1197>3.0.co;2-e. [DOI] [PubMed] [Google Scholar]
- 15.Weast RC, editor. CRC Handbook of Chemistry and Physics. Boca Raton, FL: CRC Press; 1984. [Google Scholar]
- 16.Rizzieri DA, Wadleigh M, Wikstrand CJ, Mann KP, Sen F, Peterson BL, Niedzwiecki D, Proia AD, Bigner DD. Tenascin and microvessel stromal changes in patients with non-Hodgkin’s lymphoma are isolated to the sites of disease and vary in correlation to disease activity. Leuk Lymphoma. 2005;46:1455–1462. doi: 10.1080/10428190500158060. [DOI] [PubMed] [Google Scholar]
- 17.Shin BC, Wisniewski N, Reichert WM. Water-soluble treatments to enhance glucose permeability of protein-resistant polymer overlayers. J Biomater Sci Polym Ed. 2001;12:467–477. doi: 10.1163/156856201300194216. [DOI] [PubMed] [Google Scholar]
- 18.Bolinder J, Ungerstedt U, Arner P. Long-term continuous glucose monitoring with microdialysis in ambulatory insulin-dependent diabetic patients. Lancet. 1993;342:1080–1085. doi: 10.1016/0140-6736(93)92063-y. [DOI] [PubMed] [Google Scholar]
- 19.Fischer U, Ertle R, Abel P, Rebrin K, Brunstein E, Vondorsche HH, Freyse EJ. Assessment of subcutaneous glucose-concentration—Validation of the Wick technique as a reference for implanted electrochemical sensors in normal and diabetic dogs. Diabetologia. 1987;30:940–945. doi: 10.1007/BF00295878. [DOI] [PubMed] [Google Scholar]
- 20.Jansson PA, Fowelin J, Smith U, Lonnroth P. Characterization by microdialysis of intercellular glucose level in subcutaneous tissue in humans. Am J Phys. 1988;255:E218–E220. doi: 10.1152/ajpendo.1988.255.2.E218. [DOI] [PubMed] [Google Scholar]
- 21.Chen RR, Mooney DJ. Polymeric growth factor delivery strategies for tissue engineering. Pharm Res. 2003;20:1103–1112. doi: 10.1023/a:1025034925152. [DOI] [PubMed] [Google Scholar]
- 22.Perretti M, Ahluwalia A. The microcirculation and inflammation: Site of action for glucocorticoids. Microcirculation. 2000;7:147–161. [PubMed] [Google Scholar]
- 23.Shirakata Y, Tokumaru S, Yamasaki K, Sayama K, Hashimoto K. So-called biological dressing effects of cultured epidermal sheets are mediated by the production of EGF family, TGF-β and VEGF. J Dermatol Sci. 2003;32:209–215. doi: 10.1016/s0923-1811(03)00103-8. [DOI] [PubMed] [Google Scholar]
- 24.Tanihara M, Suzuki Y, Yamamoto E, Noguchi A, Mizushima Y. Sustained release of basic fibroblast growth factor and angiogenesis in a novel covalently crosslinked gel of heparin and alginate. J Biomed Mater Res. 2001;56:216–221. doi: 10.1002/1097-4636(200108)56:2<216::aid-jbm1086>3.0.co;2-n. [DOI] [PubMed] [Google Scholar]
- 25.Baldwin SP, Saltzman WM. Materials for protein delivery in tissue engineering. Adv Drug Deliv Rev. 1998;33:71–86. doi: 10.1016/s0169-409x(98)00021-0. [DOI] [PubMed] [Google Scholar]
- 26.Kedem A, Perets A, Gamlieli-Bonshtein I, Dvir-Ginzberg M, Mizrahi S, Cohen S. Vascular endothelial growth factor-releasing scaffolds enhance vascularization and engraftment of hepatocytes transplanted on liver lobes. Tissue Eng. 2005;11:715–722. doi: 10.1089/ten.2005.11.715. [DOI] [PubMed] [Google Scholar]
- 27.Klueh U, Dorsky DI, Kreutzer DL. Use of vascular endothelial cell growth factor gene transfer to enhance implantable sensor function in vivo. J Biomed Mater Res A. 2003;67:1072–1086. doi: 10.1002/jbm.a.20041. [DOI] [PubMed] [Google Scholar]
- 28.Klueh U, Dorsky DI, Kreutzer DL. Enhancement of implantable glucose sensor function in vivo using gene transfer-induced neovascularization. Biomaterials. 2005;26:1155–1163. doi: 10.1016/j.biomaterials.2004.04.017. [DOI] [PubMed] [Google Scholar]
- 29.Ravin AG, Olbrich KC, Levin LS, Usala AL, Klitzman B. Long- and short-term effects of biological hydrogels on capsule microvascular density around implants in rats. J Biomed Mater Res. 2001;58:313–318. doi: 10.1002/1097-4636(2001)58:3<313::aid-jbm1023>3.0.co;2-o. [DOI] [PubMed] [Google Scholar]
- 30.Richardson TP, Peters MC, Ennett AB, Mooney DJ. Polymeric system for dual growth factor delivery. Nat Biotechnol. 2001;19:1029–1034. doi: 10.1038/nbt1101-1029. [DOI] [PubMed] [Google Scholar]
- 31.Ward WK, Quinn MJ, Wood MD, Tiekotter KL, Pidikiti S, Gallagher JA. Vascularizing the tissue surrounding a model biosensor: How localized is the effect of a subcutaneous infusion of vascular endothelial growth factor (VEGF)? Biosens Bioelectron. 2003;19:155–163. doi: 10.1016/s0956-5663(03)00180-5. [DOI] [PubMed] [Google Scholar]
- 32.Ausprunk DH, Falterman K, Folkman J. Sequence of events in regression of corneal capillaries. Lab Invest. 1978;38:284–294. [PubMed] [Google Scholar]
- 33.Benjamin LE, Golijanin D, Itin A, Pode D, Keshet E. Selective ablation of immature blood vessels in established human tumors follows vascular endothelial growth factor withdrawal. J Clin Invest. 1999;103:159–165. doi: 10.1172/JCI5028. [DOI] [PMC free article] [PubMed] [Google Scholar]
- 34.Meeson AP, Argilla M, Ko K, Witte L, Lang RA. VEGF deprivation-induced apoptosis is a component of programmed capillary regression. Development. 1999;126:1407–1415. doi: 10.1242/dev.126.7.1407. [DOI] [PubMed] [Google Scholar]
- 35.Kitajima Y, Endo T, Nagasawa K, Manase K, Honnma H, Baba T, Hayashi T, Chiba H, Sawada N, Saito T. Hyperstimulation and a gonadotropin-releasing hormone agonist modulate ovarian vascular permeability by altering expression of the tight junction protein claudin-5. Endocrinology. 2006;147:694–699. doi: 10.1210/en.2005-0700. [DOI] [PubMed] [Google Scholar]
- 36.Muller WA, Randolph GJ. Migration of leukocytes across endothelium and beyond: Molecules involved in the transmigration and fate of monocytes. J Leukoc Biol. 1999;66:698–704. doi: 10.1002/jlb.66.5.698. [DOI] [PubMed] [Google Scholar]
- 37.Newman PJ. The biology of PECAM-1. J Clin Invest. 1997;100:S25–S29. [PubMed] [Google Scholar]
- 38.Jackson DE. The unfolding tale of PECAM-1. FEBS Lett. 2003;540:7–14. doi: 10.1016/s0014-5793(03)00224-2. [DOI] [PubMed] [Google Scholar]
- 39.Pusztaszeri MP, Seelentag W, Bosman FT. Immunohistochemical expression of endothelial markers CD31, CD34, von Willebrand factor, and Fli-1 in normal human tissues. J Histochem Cytochem. 2006;54:385–395. doi: 10.1369/jhc.4A6514.2005. [DOI] [PubMed] [Google Scholar]
- 40.Schor AM, Pendleton N, Pazouki S, Smither RL, Morris J, Lessan K, Heerkens E, Chandrachud LM, Carmichael G, Adi M, Chisholm DM, Stevenson H. Assessment of vascularity in histological sections: Effects of methodology and value as an index of angiogenesis in breast tumours. Histochem J. 1998;30:849–856. doi: 10.1023/a:1003437619956. [DOI] [PubMed] [Google Scholar]
- 41.Barleon B, Sozzani S, Zhou D, Weich HA, Mantovani A, Marme D. Migration of human monocytes in response to vascular endothelial growth factor (VEGF) is mediated via the VEGF receptor flt-1. Blood. 1996;87:3336–3343. [PubMed] [Google Scholar]
- 42.Cursiefen C, Chen L, Borges LP, Jackson D, Cao J, Radziejewski C, D’Amore PA, Dana MR, Wiegand SJ, Streilein JW. VEGF-A stimulates lymphangiogenesis and hemangiogenesis in inflammatory neovascularization via macrophage recruitment. J Clin Invest. 2004;113:1040–1050. doi: 10.1172/JCI20465. [DOI] [PMC free article] [PubMed] [Google Scholar]
- 43.Gruber BL, Marchese MJ, Kew R. Angiogenic factors stimulate mast-cell migration. Blood. 1995;86:2488–2493. [PubMed] [Google Scholar]
- 44.Ishida S, Usui T, Yamashiro K, Kaji Y, Amano S, Ogura Y, Hida T, Oguchi Y, Ambati J, Miller JW, Gragoudas ES, Ng YS, D’Amore PA, Shima DT, Adamis AP. VEGF164-mediated inflammation is required for pathological, but not physiological, ischemia-induced retinal neovascularization. J Exp Med. 2003;198:483–489. doi: 10.1084/jem.20022027. [DOI] [PMC free article] [PubMed] [Google Scholar]
- 45.Usui T, Ishida S, Yamashiro K, Kaji Y, Poulaki V, Moore J, Moore T, Amano S, Horikawa Y, Dartt D, Golding M, Shima DT, Adamis AP. VEGF164(165) as the pathological isoform: Differential leukocyte and endothelial responses through VEGFR1 and VEGFR2. Invest Ophthalmol Vis Sci. 2004;45:368–374. doi: 10.1167/iovs.03-0106. [DOI] [PubMed] [Google Scholar]
- 46.Putney SD. Encapsulation of proteins for improved delivery. Curr Opin Chem Biol. 1998;2:548–552. doi: 10.1016/s1367-5931(98)80133-6. [DOI] [PubMed] [Google Scholar]
- 47.Indolfi C, Mongiardo A, Curcio A, Torella D. Molecular mechanisms of in-stent restenosis and approach to therapy with eluting stents. Trends Cardiovasc Med. 2003;13:142–148. doi: 10.1016/s1050-1738(03)00038-0. [DOI] [PubMed] [Google Scholar]
- 48.Lincoff AM, Furst JG, Ellis SG, Tuch RJ, Topol EJ. Sustained local delivery of dexamethasone by a novel intravascular eluting stent to prevent restenosis in the porcine coronary injury model. J Am Coll Cardiol. 1997;29:808–816. doi: 10.1016/s0735-1097(96)00584-0. [DOI] [PubMed] [Google Scholar]
- 49.Strecker EP, Gabelmann A, Boos I, Lucas C, Xu Z, Haberstroh J, Freudenberg N, Stricker H, Langer M, Betz E. Effect on intimal hyperplasia of dexamethasone released from coated metal stents compared with non-coated stents in canine femoral arteries. Cardiovasc Intervent Radiol. 1998;21:487–496. doi: 10.1007/s002709900309. [DOI] [PubMed] [Google Scholar]
- 50.Villa AE, Guzman LA, Chen W, Golomb G, Levy RJ, Topol EJ. Local delivery of dexamethasone for prevention of neointimal proliferation in a rat model of balloon angioplasty. J Clin Invest. 1994;93:1243–1249. doi: 10.1172/JCI117078. [DOI] [PMC free article] [PubMed] [Google Scholar]
- 51.Schwaab B, Frohlig G, Berg M, Schwerdt H, Schieffer H. Five-year follow-up of a bipolar steroid-eluting ventricular pacing lead. Pacing Clin Electrophysiol. 1999;22:1226–1228. doi: 10.1111/j.1540-8159.1999.tb00604.x. [DOI] [PubMed] [Google Scholar]
- 52.Gaytan F, Morales C, Bellido C, Sanchez-Criado JE. Selective apoptosis of luteal endothelial cells in dexamethasone-treated rats leads to ischemic necrosis of luteal tissue. Biol Reprod. 2002;66:232–240. doi: 10.1095/biolreprod66.1.232. [DOI] [PubMed] [Google Scholar]
- 53.Hickey T, Kreutzer D, Burgess DJ, Moussy F. In vivo evaluation of a dexamethasone/PLGA microsphere system designed to suppress the inflammatory tissue response to implantable medical devices. J Biomed Mater Res. 2002;61:180–187. doi: 10.1002/jbm.10016. [DOI] [PubMed] [Google Scholar]
- 54.Mallet C, Feraud O, Ouengue-Mbele G, Gaillard I, Sappay N, Vittet D, Vilgrain I. Differential expression of VEGF receptors in adrenal atrophy induced by dexamethasone: A protective role of ACTH. Am J Physiol Endocrinol Metab. 2003;284:E156–E167. doi: 10.1152/ajpendo.00450.2001. [DOI] [PubMed] [Google Scholar]
- 55.Halaby IA, Lyden SP, Davies MG, Roztocil E, Salamone LJ, Brooks AI, Green RM, Federoff HJ, Bowers WJ. Glucocorticoid-regulated VEGF expression in ischemic skeletal muscle. Mol Ther. 2002;5:300–306. doi: 10.1006/mthe.2002.0539. [DOI] [PubMed] [Google Scholar]
- 56.Garg SK, Hoff HK, Chase HP. The role of continuous glucose sensors in diabetes care. Endocrinol Metab Clin North Am. 2004;33:163–173. doi: 10.1016/j.ecl.2004.01.001. [DOI] [PubMed] [Google Scholar]
- 57.Rebrin K, Steil GM, Van Antwerp WP, Mastrototaro JJ. Subcutaneous glucose predicts plasma glucose independent of insulin: Implications for continuous monitoring. Am J Physiol Endocrinol Metab. 1999;277:E561–E571. doi: 10.1152/ajpendo.1999.277.3.E561. [DOI] [PubMed] [Google Scholar]