Abstract
Having good information about fluorescence lifetime standards is essential for anyone performing lifetime experiments. Using lifetime standards in fluorescence spectroscopy is often regarded as a straightforward process, however, many earlier reports are limited in terms of lifetime concentration dependency, solvents and other technical aspects. We have investigated the suitability of the fluorescent dyes rhodamine B, coumarin 6, and lucifer yellow as lifetime standards, especially to be used with two-photon excitation measurements in the time-domain. We measured absorption and emission spectra for the fluorophores to determine which wavelengths we should use for the excitation and an appropriate detector range. We also measured lifetimes for different concentrations, ranging from 10−2– 10−6 M, in both water, ethanol and methanol solutions. We observed that rhodamine B lifetimes depend strongly on concentration. Coumarin 6 provided the most stable lifetimes, with a negligible dependency on concentration and solvent. Lucifer yellow lifetimes were also found to depend little with concentration. Finally, we found that a mix of two fluorophores (rhodamine B/coumarin 6, rhodamine B/lucifer yellow, and coumarin 6/lucifer yellow) all yielded very similar lifetimes from a double-exponential decay as the separate lifetimes measured from a single-exponential decay. All lifetime measurements were made using two-photon excitation and obtaining lifetime data in the time-domain using time-correlated single-photon counting.
Keywords: Fluorescence, Lifetime, Two-photon, Time-domain
Introduction
Fluorescence lifetime measurements are excellent tools for investigating several aspects of excited state dynamics and molecular interactions. Samples with a known fluorescence lifetime are very useful for anyone performing fluorescence lifetime experiments, whether it is for calibration purposes, testing for systematic errors, or simply to verify that the experiment setup yields correct lifetimes. A very useful description of practicalities in using lifetime standards is available in the literature[6]. In addition to have information on fluorescence lifetimes, it is also useful to know which fluorophores are suitable for a given setup and which concentrations and solvents give the most stable and reliable results. We have selected three fluorophores to test for their suitability as lifetime standards for a two-photon excitation setup. We obtained lifetime data in the time-domain by using time-correlated single photon counting (TCSPC). For two-photon excitation, we used a laser producing femtosecond pulses as the excitation source, tuneable in the range 690-1040 nm. The photomultiplier tube (PMT) detector has a detection range of 400-800 nm. Thus the fluorophores were selected so that their absorption and emission bands would be within these wavelength ranges. This means that for two-photon excitation it was required that the fluorophores absorbed in the range 345-520 nm. The fluorophores were also selected on other criteria: They should exhibit a single-exponential decay, be easily commercially available and relatively harmless to work with. Also, the lifetimes should be in the order of or shorter than 10 ns to avoid possible shortening of lifetimes from oxygen quenching. Finding fluorophores satisfying all these criteria proved difficult, and this is the reason we have focused only on three fluorophores in the present study. The main goal of this paper is to provide useful information on fluorescence standards for fluorescence lifetime experiments in general, especially for two-photon excitation and lifetimes acquired in the time-domain. This includes how the lifetimes vary with concentration, which fluorophores gives more stable measurement results, absorption and emission data and the possibility of mixing of two fluorophores to achieve double-exponential decay curves. In biological samples, two (or more) lifetime components are often present, and therefore it is important to verify that lifetimes of a mixed substance will produce double-exponential decays resulting in the same lifetimes as the separate fluorophores yield from single-exponential decay. We have recently performed in vivo fluorescence lifetime measurements on microalgae with the same setup described in this paper[16], and we experienced that information on lifetime standards performed for two-photon experiments would be beneficial.
The earliest records of lifetime standards date back to the 1960s and 1970s[3, 4], however lifetimes in this time period were usually measured by pulse sampling oscilloscope techniques, which are less accurate by todays standards. Since the introduction of lasers with a high repetition rate in the late 1970s[15, 23] a number of contributions have been made in determining lifetime standards[17, 18, 26], although many proposed lifetime standards were too long to benefit for picosecond instruments, and some were later found unsuitable because they exhibited double-exponential decays. Also, no systematic approach to determine the reliability of these lifetimes was done until 2007[5], when comparisons of 13 different fluorophores were systematically examined by 9 separate laboratories in a very thorough and comprehensive work. However, fluorescence was not induced by two-photon excitation in any of their measurements.
Rhodamine B lifetimes in water[5, 7, 10, 24] and methanol[5, 11, 24] have been well documented in recent years, mostly for concentrations in the 10−6 M range or even more diluted. Coumarin 6 on the other hand is not well documented. We found only one paper[25] and two technical notes[13, 21] reporting coumarin 6 lifetimes, all in ethanol. Lucifer yellow lifetimes are reported by several groups[1, 8, 9, 12], all in water except one[8], who measured on both water and methanol. Lucifer yellow is available in several derivatives (lucifer yellow ethylenediamine (LYen), lucifer yellow biocytin potassium salt (LYbtn) and lucifer yellow CH dilithium salt, amongst others). It is unfortunately not clear how these lucifer yellow variants differ in fluorescence lifetimes, and some earlier papers do not specify the type used in their experiments. We could not find any previous records of lifetime measurements on mixed combinations of rhodamine B, coumarin 6 and lucifer yellow.
Materials and Methods
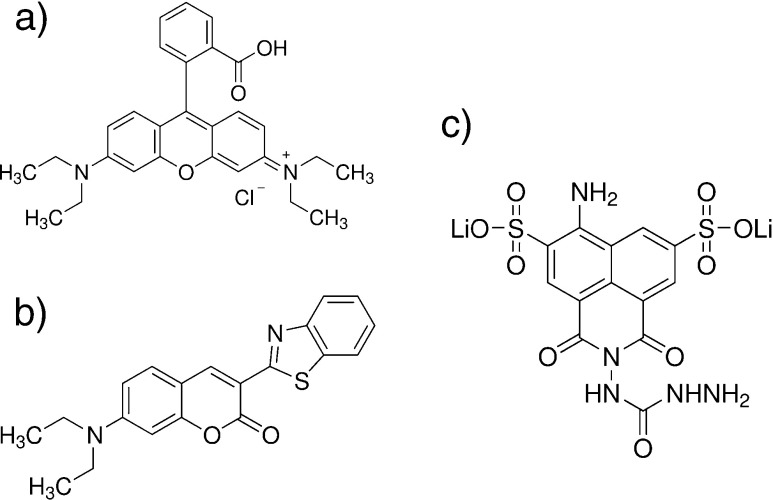
All three fluorophores were commercially available and purchased from Sigma Aldrich. Rhodamine B for fluorescence (Sigma Aldrich 83689 SIGMA), coumarin 6 ≥ 99% (546283 ALDRICH) and lucifer yellow CH dilithium salt (L0259 SIGMA). The structural formulas for the three fluorophores are shown in Fig. 1. Distilled water, ethanol and methanol of spectrophotometric grade were used as solvents. All three fluorophores were used as received. We started by making 10−2 M concentrations of all fluorophores, and then made 10−3 M, 10−4 M, 10−5 M and 10−6 M concentrations by diluting the original 10−2 M concentration with the appropriate amount of solvent. Two separate batches of the samples were produced from scratch. For all fluorophore/solvent combinations, 10−9 M concentrations were also made, but none of these yielded strong enough fluorescence signals for satisfactory measurements to be made. For testing the relation between lifetimes and high concentrations for Rhodamine B, the original 10−2 M sample was diluted to 7.5⋅10−3 M, 5⋅10−3 M and 2.5⋅10−3 M, respectively. Samples were prepared by placing a small drop onto a microscope slide, then covered by a 0.17 mm thick glass. All measurements described were performed in room temperature (20°C).
Fig. 1.
The structural formulas of rhodamine B (a), coumarin 6 (b) and lucifer yellow CH dilithium salt (c)
Instrumentation
Two-photon excitation was provided by a Ti:sapphire laser (Coherent Chameleon Ultra), generating femtosecond pulses (pulse width 140 fs) operating at an 80 MHz repetition rate (12.5 ns between pulses). The laser is tuneable from 690-1040 nm, with an average output power of 4 W at 800 nm. An electro-optical modulator (EOM) controlled the intensity of the laser beam, which in turn was guided by mirrors into a confocal inverted microscope (Leica TCS SP5) and focused by a water immersion 63 × objective with a numerical aperture 1.2 and a working distance of 0.22 mm. The sample was scanned at a line frequency of 400 Hz and fluorescence was detected by a built-in photomultiplier tube (PMT) detector with a detection range of 400-800 nm. Line, frame, and pixel clock signals were generated and synchronised by another PMT detector (Hamamatsu R3310-02) and linked via a time-correlated single-photon counting (TCSPC) imaging module (SPC-830, Becker-Hickl, Berlin, Germany) to generate fluorescence lifetime raw data. Fluorescence absorption spectra were measured using a Shimazu UV-1800 Spectrophotometer, and data was gathered by the software UVProbe v.2.31. Fluorescence emission spectra were measured using the lambda scan feature in the Leica LAS software.
Absorption and Emission Measurements
For fluorescence absorption measurements, each sample was diluted to a 5⋅10−5 M concentration. A baseline for the spectrophotometer was determined initially by running a scan without samples. Then the fluorescent sample and a blank liquid sample (we used distilled water, but any liquid with very low absorption can be used) in two cuvettes were placed in the spectrophotometer to perform the scans. Scans were performed in 1 nm steps from 200-700 nm. The emission spectra were measured using the lambda scan feature in the microscope software Leica LAS. The lambda scan basically performs a series of fluorescence intensity measurements step-wise through a pre-determined detector range. For rhodamine B, we excited the sample with 1020 nm and the detector range was set to 500-650 nm. For coumarin 6, excitation wavelength was 900 nm and detector range was 440-590 nm. Lucifer yellow was excited at 850 nm and detector range was 460-640 nm. For all emission measurements the detector bandwidth was set to 50 nm, to get a strong fluorescence signal, and the scan was performed in 50 steps to achieve a smooth spectral curve.
Lifetime Measurements
The scan resolution was set to 128 ×128 to achieve an adequate time resolution with 256 time channels. Excitation wavelengths were determined from the measured absorption spectra of the fluorophores, while a fluorescence intensity scan was made to determine a suitable detector range for each of the fluorophores. Fine-tuning of the distance between objective and sample was necessary to find focus, and then the TCSPC software was started to collect lifetimes. Each sample was scanned for 45 seconds, and three measurements from different places in the sample were made. Then a new sample was selected and three new measurements were made in the same way. This procedure was made for both batches of samples, so that a total of 12 data sets from each fluorophore/solvent combination was used in calculating the lifetimes. The lifetimes over the pixels were averaged from all 12 data sets. For a mix of two dyes we encountered two apparent problems. Firstly, the fluorophores have different quantum yields, and secondly, their absorption and emission maxima are not the same. The solution to the first problem was to measure the fluorescence intensity of each of the two dyes being mixed at exactly the same settings, thus measuring the relative brightness of the fluorophores indirectly. This was measured using the TCSPC module, which gives the detected fluorescence photon count per second in real time. After comparing the relative brightness of the fluorohpores to be mixed, the difference was levelled by adding the appropriate amount of the weakest fluorescing fluorophore to the mix. The second problem was handled by using an excitation wavelength midway between the excitation wavelengths of the separate dyes: For a mix between coumarin 6 (originally excited at 900 nm) and lucifer yellow (excited at 850 nm), an excitation wavelength of 875 nm was used. For a rhodamine B (excited at 1020 nm) and coumarin mix we excited at 960 nm, while for a rhodamine B and lucifer yellow mix we excited at 935 nm. The detector ranges for these three mixes were set broad enough to cover the emission peaks of both dyes: 470-640 nm (coumarin 6/lucifer yellow), 470-620 nm (rhodamine B/coumarin 6) and 540-640 nm (rhodamine B/lucifer yellow).
Data Analysis
After the lifetime data was collected by the TCSPC module, the software SPCImage (Becker-Hickl, Berlin, Germany) was used to calculate the decay matrix. The software automatically fits a decay curve to the collected photons to calculate a lifetime for each image pixel. A χ2 value indicates how well the curve fits the data (a value of 1 is ideal). After the decay matrix was calculated, we exported both lifetime values and intensity (photon count) per pixel. An extra precaution is necessary when dealing with fluorophores having lifetimes approaching the time between pulses generated by the laser. In our case, the laser operated at a repetition rate of 80 MHz, which is equivalent to 12.5 ns between each pulse. A built-in feature of the SPCImage software, called incomplete multiexponentials, can be activated before calculating the decay matrix to compensate for lifetimes close to the time between laser pulses. Only lucifer yellow had long enough lifetimes for this procedure to be invoked amongst the fluorophores in our experiments. Figures 2 and 3 shows lifetime images and decay curves for 10−3 M concentrations of coumarin 6 in ethanol and lucifer yellow in ethanol respectively. These were selected to illustrate how the decay curve and curve fit looks for two fluorophores with distinctly different lifetimes. The exported data from both absorption, emission and lifetime measurements were then exported and treated in MatLab ®; to make plots, calculate mean lifetimes and standard deviations. Mean lifetimes were calculated as averages over the pixels from all 12 data sets.
Fig. 2.
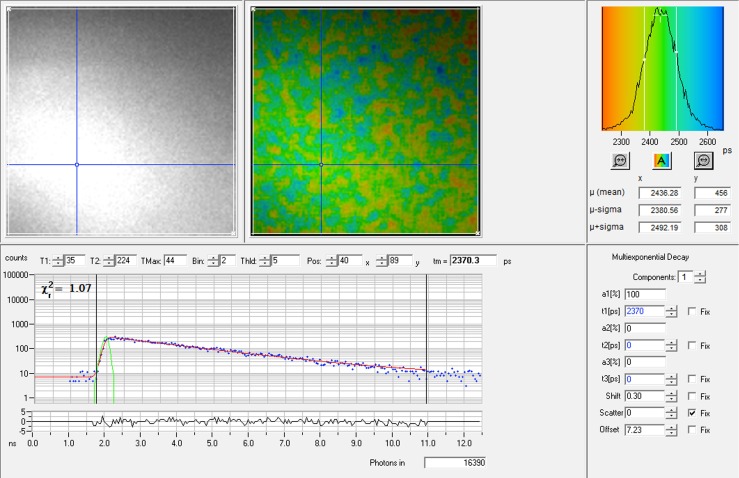
The upper part of the Figure shows (from left) the intensity image, the color-coded lifetime image and the lifetime histogram of a 10−3 M coumarin 6 concentration in ethanol. The mean lifetime of this particular measurement was 2436 ps. The lower part of the Figure shows the fluorescence decay curve from a single pixel in the lifetime image as indicated by the blue crosshair. The green curve at the start of the decay curve is the instrument response function. The χ 2-value was close to 1, meaning that the curve was a good fit for a single lifetime component, as was selected in the right lower part of the Figure. The lifetime calculated from this particular decay curve was 2370 ps, and 16390 photons were counted for this pixel in total
Fig. 3.
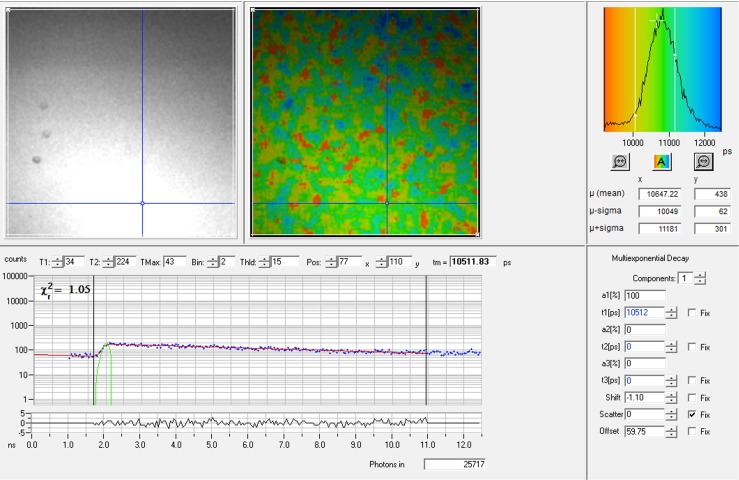
The upper part of the Figure shows (from left) the intensity image, the color-coded lifetime image and the lifetime histogram of a 10−3 M lucifer yellow concentration in ethanol. The mean lifetime of this particular measurement was 10647 ps. The lower part of the Figure shows the fluorescence decay curve from a single pixel in the lifetime image as indicated by the blue crosshair. The green curve at the start of the decay curve is the instrument response function. The χ 2-value was close to 1, meaning that the curve was a good fit for a single lifetime component, as was selected in the right lower part of the Figure. Since the lifetime of lucifer yellow is close to the time between the laser pulses (12.5 ns), it was necessary to select the feature incomplete multiexponentials in the software program to compensate. The lifetime calculated from this particular decay curve was 10512 ps, and 25717 photons were counted for this pixel in total
Results and Discussion
Absorption and Emission
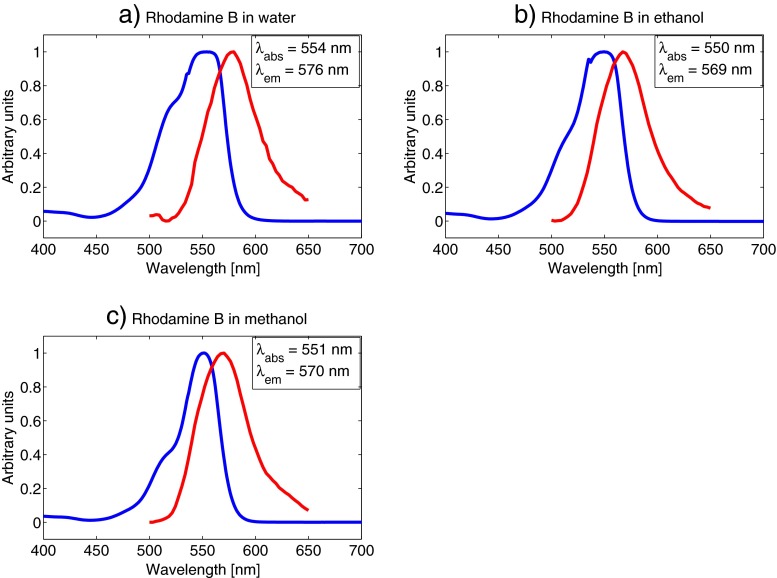
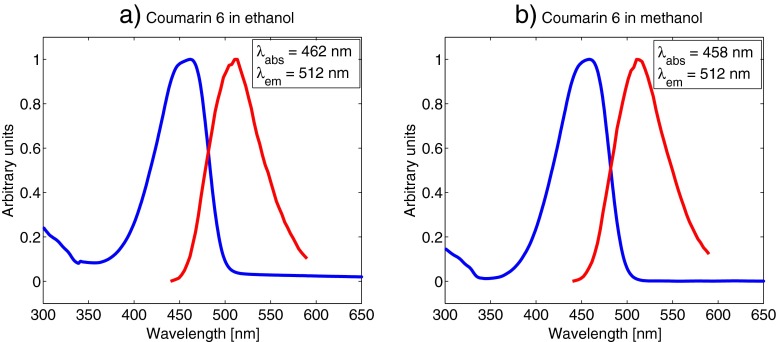
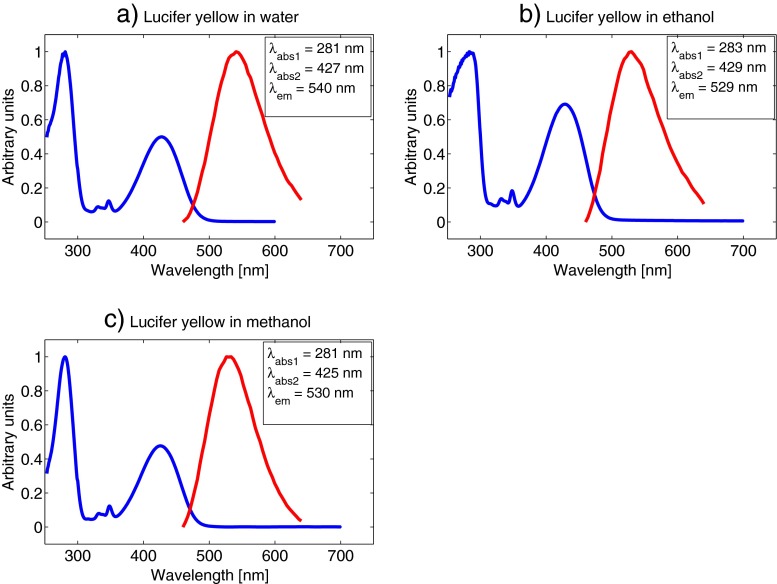
The main objective for measuring the absorption and emission spectra of the fluorophores was to be confident in our choices for excitation wavelengths and detector ranges. We selected a concentration of 5⋅10−5 M for all our absorption and emission measurements. This concentration was high enough to get a good fluorescence signal strength in all the samples, and low enough to avoid possible aggregating of molecules, or other molecular effects that might affect the absorption and emission characteristics. It should be noted that the emission spectra were not corrected regarding detector sensitivity variation at different wavelengths, which might cause a slight shift of the emission peaks. However, this was not crucial to our experiments as we selected a broad detector range in all measurements, as described below. Figure 4 shows the absorption and emission spectra of rhodamine B. It is clear that both absorption and emission vary very little with the solvent, with absorption maximum at around 550 nm and emission maximum at around 570 nm for all three measurements. The laser in our experiment is tuneable from 690-1040 nm, however, sometimes the sync-signal from the laser to the TCSPC-computer is difficult to stabilise for the longest wavelengths. Also, the power output of the laser decreases with increasing wavelengths above 800 nm. We therefore decided to use a 1020 nm two-photon excitation wavelength and a detector range from 540-620 nm in the following rhodamine B lifetime measurements. The detector range was set quite broad to include as much as possible of the fluorescence from the sample. This was not problematic, as there were no other fluorescent substances present in the sample. In lifetime measurements of live cells, for instance, the detector range should be set narrower to avoid unwanted fluorescence from other sources. Figure 5 shows that the difference in absorption and emission wavelengths are negligible for coumarin 6 in ethanol compared to methanol solutions. Both have an absorption maximum at around 460 nm and an emission maximum at 512 nm. Based on these values we decided to use a 900 nm two-photon excitation wavelength and a detector range from 470-540 nm for all our coumarin 6 lifetime measurements. Figure 6 shows the absorption and emission spectra for lucifer yellow in water, ethanol and methanol. The absorption and emission wavelengths vary only slightly with the solvent. The emission maximum in the water solution is at 540 nm compared to 529 nm and 530 nm for ethanol and methanol, respectively. Two significant absorption peaks appear in each of the spectra in Fig. 6. Lucifer yellow absorbs most strongly in the UV-region, at around 280 nm. However, this wavelength is not within reach of our laser, so we aimed for the second peak, at around 430 nm. The emission maxima were 540 nm for water and around 530 nm for ethanol and methanol. We used an excitation wavelength of 850 nm and a detector range from 460-640 nm.
Fig. 4.
Absorption and emission spectrum of 5⋅10−5 M rhodamine B concentrations in water (a), ethanol (b) and methanol (c). Curves are normalised. The blue line represents absorption and the red line represents emission
Fig. 5.
Absorption and emission spectrum of 5⋅10−5 M coumarin 6 concentrations in ethanol (a) and methanol (b). Curves are normalised. The blue line represents absorption and the red line represents emission
Fig. 6.
Absorption and emission spectrum of 5⋅10−5 M lucifer yellow concentrations in water (a), ethanol (b) and methanol (c). Curves are normalised. The blue line represents absorption and the red line represents emission
Fluorescence Lifetimes
Rhodamine B, coumarin 6 and lucifer yellow fluorescence lifetimes were measured for solutions in water, ethanol and methanol initially for 10−2 M, 10−3 M, 10−4 M and 10−5 M concentrations. To examine a possible relationship between changes in lifetimes and high concentrations, new measurements were made for rhodamine B, at 7.5⋅10−3 M, 5⋅10−3 M and 2.5⋅10−3 M concentrations, respectively. All lifetimes are given in nanoseconds (ns) with an uncertainty of ± one standard deviation.
Lifetimes for rhodamine B have been measured earlier to various extents (both various excitation wavelengths and concentrations). Rhodamine B in water has been measured at several concentrations, most of these were performed by single-photon excitation ten or more years ago, and vary between 1.3–1.7 ns for concentrations in the 10−5– 10−6 M range[7, 10, 14, 20, 24]. Using two-photon excitation, a lifetime of 1.55 ns in a 2⋅10−6 M concentration with an excitation wavelength of 860 nm has recently been reported[19]. Taking our results in consideration, there are no apparent indications that single-photon and two-photon excitations result in different fluorescence lifetimes. Table 1 shows the results of our measurement of rhodamine B fluorescence lifetimes in water, ethanol and methanol. We only measured single-exponential decays for the 10−3 and 10−4 M concentrations, with obtained lifetimes at 1.49 and 1.72 ns, respectively, which is in good agreement with earlier findings. It should be noted that measurements in the water solution were often unstable. The lifetimes varied even for different areas within the same sample, and as shown in Table 1, several measurements also yielded double-exponential decay curves. This is, however, in accordance with earlier findings[5], where three out of six groups in an inter-calibration study found biexponential decays for rhodamine B in water. It has also previously been shown that the lifetime of rhodamine B in water decreased with increasing concentration, from 1.44 ns at a 10−4 M concentration to 0.65 ns at a 10−2 M concentration[24]. Table 2 shows the water solution lifetimes for 10−2 M, 10−5 M and 10−6 M concentrations that resulted in double exponential decays. No apparent coherency was observed in our measurements resulting in double-exponential decays, and it is difficult to determine what the cause may be, especially since concentrations in between ( 10−3 M – 10−4 M) did not produce measurements with double exponential decays. It has been reported that rhodamine B in water readily forms aggregates even at low concentrations[2], and that this may result in double-exponential fits to the decay curve.
Table 1.
Rhodamine B fluorescence lifetimes [ns]
Table 2.
Double exponential rhodamine B fluorescence lifetimes in water [ns]
| 10−2 M | 10−5 M | 10−6 M | |
|---|---|---|---|
| Lifetime 1 ( τ 1) | 0.23 ± 0.03 | 0.42 ± 0.06 | 1.22 ± 0.08 |
| Lifetime 2 ( τ 2) | 0.61 ± 0.03 | 1.42 ± 0.08 | 1.42 ± 0.05 |
| Lifetime 3 ( τ 3) | – | – | 1.75 ± 0.07 |
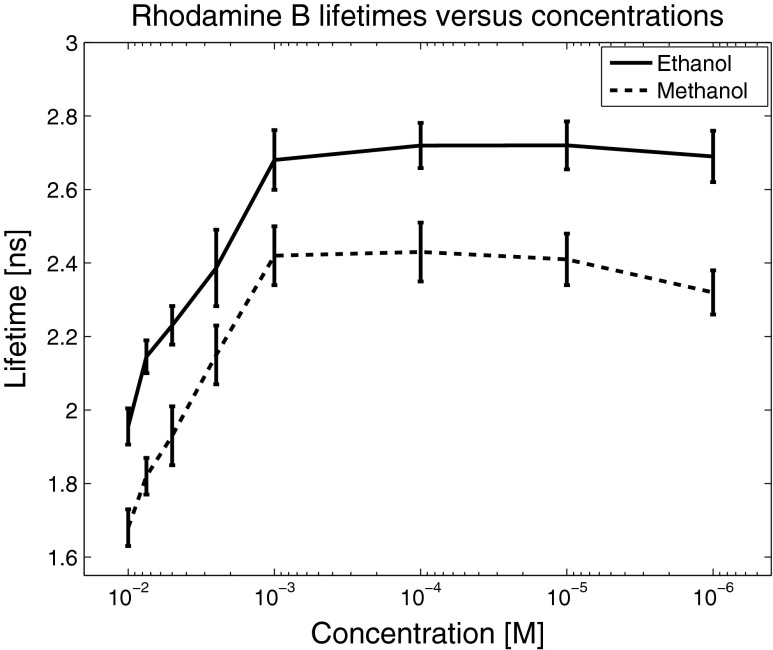
No double-exponential decays were found in our measurements of rhodamine B in ethanol or methanol. However, as Table 2 shows, higher concentrations than 10−3 M resulted in lower fluorescence lifetimes. To investigate further, we performed three new measurements at concentrations between 10−2 M and 10−3 M. The results, shown in Table 3, clearly indicate that lifetimes shorten when concentrations increase, but only for concentrations higher than 10−3 M. For lower concentrations, the lifetimes are the same in all our measurements, measured to be 2.7 ns for ethanol and 2.4 ns for methanol. It is obvious that some kind of quenching mechanisms are responsible for the shortening of lifetimes for concentrations higher than 10−3 M. The abrupt decrease in fluorescence lifetime for high concentrations has been observed earlier, for rhodamine 6G dissolved in methanol[22], with the lifetime in that case starting to decrease at 10−2 M. The observed dependence of fluorescence lifetime on concentration is believed to be mainly a result of a more efficient transfer of excitation energy (exciton) in several steps between quenching centres consisting of a ground-state and an excited monomer in close proximity of each other, until the exciton reaches a reaction centre where fast radiationless decay occurs[22].
Table 3.
Rhodamine B fluorescence lifetimes in high concentrations [ns]
| 10−2 M | 7.5⋅10−3 M | 5⋅10−3 M | 2.5⋅10−3 M | 10−3 M | |
|---|---|---|---|---|---|
| Ethanol | 1.95 ± 0.05 | 2.14 ± 0.05 | 2.23 ± 0.05 | 2.38 ± 0.1 | 2.68 ± 0.08 |
| Methanol | 1.68 ± 0.05 | 1.82 ± 0.05 | 1.93 ± 0.08 | 2.15 ± 0.08 | 2.42 ± 0.08 |
Figure 7 shows the concentration dependency of rhodamine B lifetimes in ethanol and methanol. We found only one earlier record of lifetimes in ethanol[20], measured to be 2.93 ns in a 2⋅10−6 M concentration, slightly longer than our measurement for about the same concentration ( 1⋅10−6 M), at 2.69 ns. Rhodamine B lifetimes in methanol have previously been measured by several groups. One group reports lifetimes between 2.24-2.35 ns at very low concentrations ( 3.5⋅10−9 M– 3.5⋅10−12 M)[11], and another group obtained lifetimes between 2.6-3.8 ns, increasing with higher concentration[24]. The latter group measured in the same concentration range as us ( 10−2- 10−5 M), however, we observed shorter lifetimes as the concentration increased. An inter-calibration study with measurements from several laboratories reports a lifetime of 2.5 ns, but did not include concentration details[5]. Furthermore, a lifetime of 2 ns for a 2⋅10−6 M concentration have been reported[22], also determining that the lifetimes were independent of emission wavelength. We measured the lifetime to be 2.4 ns ( ≤10−3 M), which is in good agreement with most of the earlier results. There are differences, however, since many previous results are published without giving details on concentration, as well as using older techniques or measuring in the frequency-domain, which could result in different lifetimes.
Fig. 7.
Rhodamine fluorescence lifetimes in ethanol and methanol as a function of concentration. Beginning at a 10−3 M concentration, it is clear that the fluorescence lifetime depends strongly on concentration, and decreases linearly with increasing concentration until a saturation level is reached at around 10−2 M. For concentrations more dilute than 10−3 M, the lifetime is independent of concentration. The dependence seems more or less identical for ethanol and methanol solutions, only separated by a relatively constant gap in the lifetime
We observed that coumarin 6 does not dissolve in water, so only ethanol and methanol measurements are included in our results. Table 4 shows our lifetime measurements for ethanol and methanol. In both solutions the lifetimes were about the same regardless of concentration: 2.4 ns in ethanol and 2.3 ns in methanol. We also observed that coumarin 6 does not completely dissolve in a 10−2 M concentration, for neither ethanol or methanol. This may explain why the lifetimes did not decrease, as could be expected based on our findings for rhodamine B. We have only found two entries in the literature with coumarin 6 fluorescence lifetime measurements, both for ethanol solutions. One is a technical note from the German corporation PicoQuant[13], reporting lifetimes varying little with concentration, from 2.5 ns at 10−2 M to 2.6 ns at 10−12 M concentrations. The other lists a fluorescence lifetime for Coumarin 6 in ethanol to be 2.58 ns in a 5⋅10−4 M concentration[25]. Both are in good agreement with our results.
Table 4.
Coumarin 6 fluorescence lifetimes [ns]
| 10−2 M | 10−3 M | 10−4 M | 10−5 M | 10−6 M | |
|---|---|---|---|---|---|
| Ethanol | 2.42 ± 0.06 | 2.41 ± 0.07 | 2.39 ± 0.08 | 2.43 ± 0.06 | 2.43 ± 0.06 |
| Methanol | 2.28 ± 0.05 | 2.30 ± 0.05 | 2.29 ± 0.06 | 2.31 ± 0.05 | 2.32 ± 0.04 |
As shown in Table 5, we measured fluorescence lifetimes for lucifer yellow to be around 5.2 ns in water, around 9.7 ns in ethanol and around 9.5 ns in methanol. We did not find any significant change in lifetimes for the different concentration levels for any of our lucifer yellow measurements, although the lifetime in methanol seems to decrease somewhat for lower concentrations. It has previously been reported lifetimes of 5.7 ns for a 10−6 M concentration of lucifer yellow dipotassium salt in a water solution[8]. Others have reported lifetimes in water at 4.9 ns for a 5⋅10−5 M concentration of an unspecified lucifer yellow variant[9], 5 ns for lucifer yellow CH lithium salt, 2⋅10−4 M[12], and 4.95 ns for an unspecified variant in a 5⋅10−5 M concentration[1]. All of these are in good agreement with our findings, apart from the former (5.7 ns) which is slightly longer. We have found only one earlier measurement of lucifer yellow lifetimes in methanol at 8.8 ns for lucifer yellow dipotassium salt[8], again in good agreement with our results. Any small discrepancies observed between our and earlier results could, however, result from not necessarily using the exact same variants of lucifer yellow.
Table 5.
Lucifer yellow fluorescence lifetimes [ns]
| 10−2 M | 10−3 M | 10−4 M | 10−5 M | 10−6 M | |
|---|---|---|---|---|---|
| Water | .94 ± 0.27 | 5.29 ± 0.26 | 5.29 ± 0.25 | 5.26 ± 0.29 | 5.19 ± 0.31 |
| Ethanol | 10.05 ± 1.18 | 10.33 ± 1.13 | 9.69 ± 1.29 | 9.94 ± 1.17 | 8.59 ± 1.33 |
| Methanol | 9.18 ± 0.86 | 9.49 ± 0.99 | 9.49 ± 0.94 | 9.68 ± 0.87 | 9.63 ± 0.91 |
For all the measurements on mixed fluorophore solutions, a 10−5 M concentration was used. For the mix of lucifer yellow and rhodamine B, ethanol was used as a solvent, while methanol was used for mixing rhodamine B and coumarin 6, and for mixing coumarin 6 and lucifer yellow, respectively. The lifetime from single-exponential decay for lucifer yellow in methanol at the same concentration was 9.68 ± 0.87 ns, and for the double-exponential decay, the lifetime in the lucifer yellow/rhodamine B mix was measured to be 9.51 ± 2.62 ns. Correspondingly, the single-exponential decay lifetime for rhodamine B in methanol was 2.41 ± 0.07 ns, and in the mix it was 2.43 ± 0.46 ns, both in very good agreement, although the uncertainty is higher for the mix lifetimes. The lifetime from single-exponential decay of rhodamine B in ethanol was 2.72 ± 0.06 ns, and the double-exponential decay lifetime of rhodamine B in the rhodamine B/coumarin 6 mix was measured to be 2.71 ± 0.1 ns. The single-exponential lifetime of coumarin 6 in ethanol was measured to be 2.43 ± 0.06 ns. In the rhodamine B/coumarin 6 mix, the coumarin 6 double-exponential lifetime was measured to be 2.44 ± 0.1 ns, and in the coumarin 6/lucifer yellow mix it was 2.39 ± 0.54 ns. The single-exponential lifetime of lucifer yellow in ethanol was measured to be 9.94 ± 1.17 ns, while its double-exponential lifetimes in the coumarin 6/lucifer yellow mix was 8.87 ± 2.74 ns. Overall it was observed a very good agreement between the single-exponential decay lifetimes measured on the separate fluorophores, and the lifetimes they yielded from double-exponential decays in a mix of two fluorophores.
Conclusions
Selecting lifetime standards is not as straightforward as it may seem at first glance. It is important to take into consideration that some fluorophores are strongly dependent on concentration and may also yield double exponential decays. We have found Coumarin 6 to be the most suitable amongst the three dyes we examined for lifetime measurements, in both ethanol and methanol solutions, because it produces stable measurements in a wide concentration range. Our lucifer yellow measurements also agreed well with earlier findings, and could also well be recommended as a lifetime standard. However, it is imperative that one compensates appropriately when lifetimes are approaching the time between laser pulses. Rhodamine B is the most interesting substance, with its strong quenching in high concentrations and the formation of aggregates resulting in several decay components in an aqueous solution, but for these reasons it is not the most suitable choice as a lifetime standard. The lifetime’s concentration dependency for rhodamine B and the quenching mechanisms responsible would be interesting to investigate further, to better understand these processes. The results from the double-exponential decays of the mixed fluorophores were in good agreement with the lifetimes from single-exponential decays.
References
- 1.Agronskaia AV, Tertoolen L, Gerritsen HC. High frame rate fluorescence lifetime imaging. J Phys D: Appl Phys. 2003;36(14):1655. doi: 10.1088/0022-3727/36/14/301. [DOI] [Google Scholar]
- 2.Arbeloa F, Ojeda P, Arbeloa I. Flourescence self-quenching of the molecular forms of rhodamine b in aqueous and ethanolic solutions. J Lumin. 1989;44(12):105–112. doi: 10.1016/0022-2313(89)90027-6. [DOI] [Google Scholar]
- 3.Berlman I. Handbook of fluorescence spectra of aromatic molecules. London: Academic Press; 1965. [Google Scholar]
- 4.Birks J. Photophysics of aromatic molecules. New York: Wiley-Interscience; 1970. [Google Scholar]
- 5.Boens N, Qin W, Basaric N, Hofkens J, Ameloot M, Pouget J, Lefvre JP, Valeur B, Gratton E, vandeVen M, Silva ND, Engelborghs Y, Willaert K, Sillen A, Rumbles G, Phillips D, Visser AJWG, van Hoek A, Lakowicz JR, Malak H, Gryczynski I, Szabo AG, Krajcarski DT, Tamai N, Miura A. Fluorescence lifetime standards for time and frequency domain fluorescence spectroscopy. Anal Chem. 2007;79(5):2137–2149. doi: 10.1021/ac062160k. [DOI] [PMC free article] [PubMed] [Google Scholar]
- 6.Boens N, Ameloot M, Valeur B. Practical time-resolved fluorescence spectroscopy: avoiding artifacts and using lifetime standards. In: Resch-Genger U, editor. Standardization and quality assurance in fluorescence measurements I, Springer Series on Fluorescence, vol 5. New York: Springer Berlin Heidelberg; 2008. pp. 215–232. [Google Scholar]
- 7.Cerussi AE, Maier JS, Fantini S, Franceschini MA, Mantulin WW, Gratton E. Experimental verification of a theory for the time-resolved fluorescence spectroscopy of thick tissues. Appl Opt. 1997;36(1):116–124. doi: 10.1364/AO.36.000116. [DOI] [PubMed] [Google Scholar]
- 8.Furstenberg A, Vauthey E. Excited-state dynamics of the fluorescent probe lucifer yellow in liquid solutions and in heterogeneous media. Photochem Photobiol Sci. 2005;4:260–267. doi: 10.1039/b418188c. [DOI] [PubMed] [Google Scholar]
- 9.de Grauw C, Gerritsen H. Multiple time-gate module for fluorescence lifetime imaging. Appl Spectrosc. 2001;55(6):670–678. doi: 10.1366/0003702011952587. [DOI] [Google Scholar]
- 10.Hanley QS, Arndt-Jovin DJ, Jovin TM. Spectrally resolved fluorescence lifetime imaging microscopy. Appl Spectrosc. 2002;56(2):155–166. doi: 10.1366/0003702021954610. [DOI] [PubMed] [Google Scholar]
- 11.Ishikawa M, Watanabe M, Hayakawa T, Koishi M. Simultaneous measurement of the fluorescence spectrum and lifetime of rhodamine b in solution with a fluorometer based on streak-camera technologies. Anal Chem. 1995;67(3):511–518. doi: 10.1021/ac00099a005. [DOI] [Google Scholar]
- 12.Jiang L, Zeng Y, Zhou H, Qu JY, Yao S. Visualizing millisecond chaotic mixing dynamics in microdroplets: a direct comparison of experiment and simulation. Biomicrofluidics. 2012;6(1):012810. doi: 10.1063/1.3673254. [DOI] [PMC free article] [PubMed] [Google Scholar]
- 13.Kapusta P (2002) Sensitivity of the fluotime-series lifetime spectrometers. http://www.picoquant.com/technotes/appnote_ft_sensitivity.pdf
- 14.Kemnitz K, Tamai N, Yamazaki I, Nakashima N. Fluorescence decays and spectral properties of rhodamine b in submono-, mono-, and multilayer systems. J Phys Chem. 1986;90(21):5094–5101. doi: 10.1021/j100412a043. [DOI] [Google Scholar]
- 15.Koester V, Dowben R. Subnanosecond fluorescence lifetimes by time-correlated single photon counting using synchronously pumped dye laser excitation. Biophys J. 1978;24(1):245–247. doi: 10.1016/S0006-3495(78)85364-8. [DOI] [PMC free article] [PubMed] [Google Scholar]
- 16.Kristoffersen AS, Svensen O, Ssebiyonga N. Erga SR, Stamnes JJ, Frette O. Chlorophyll a and nadph fluorescence lifetimes in the microalgae haematococcus pluvialis (chlorophyceae) under normal and astaxanthin-accumulating conditions. Appl Spectrosc. 2012;66(10):1216–1225. doi: 10.1366/12-06634. [DOI] [PubMed] [Google Scholar]
- 17.Lakowicz J, Gryczynski I, Laczko G, Gloyna D. Picosescond fluorescence lifetime standards for frequency- and time-domain fluorescence. J Fluoresc. 1991;1(2):87–93. doi: 10.1007/BF00865204. [DOI] [PubMed] [Google Scholar]
- 18.Lampert RA, Chewter LA, Phillips D, O’Connor DV, Roberts AJ, Meech SR. Standards for nanosecond fluorescence decay time measurements. Anal Chem. 1983;55(1):68–73. doi: 10.1021/ac00252a020. [DOI] [Google Scholar]
- 19.Leung RWK, Yeh SCA, Fang Q. Effects of incomplete decay in fluorescence lifetime estimation. Biomed Opt Express. 2011;2(9):2517–2531. doi: 10.1364/BOE.2.002517. [DOI] [PMC free article] [PubMed] [Google Scholar]
- 20.Magde D, Rojas GE, Seybold PG. Solvent dependence of the fluorescence lifetimes of xanthene dyes. Photobiol A Chem. 1999;70(5):737–744. doi: 10.1111/j.1751-1097.1999.tb08277.x. [DOI] [Google Scholar]
- 21.Ni Y, Terpetschnig E Time-domain lifetime measurements on chronosbh.b http://www.iss.com/resources/pdf/appnotes/K2CH_TDLifetimeMeasChBH.pdf
- 22.Penzkofer A, Lu Y. Fluorescence quenching of rhodamine 6g in methanol at high concentration. Chem Phys. 1986;103(23):399–405. doi: 10.1016/0301-0104(86)80041-6. [DOI] [Google Scholar]
- 23.Spears KG, Cramer LE, Hoffland LD. Subnanosecond time-correlated photon counting with tunable lasers. Rev Sci Instrum. 1978 doi: 10.1063/1.1135382. [DOI] [PubMed] [Google Scholar]
- 24.Srinivas NKMN, Rao SV, Rao DN. Saturable and reverse saturable absorption of rhodamine b in methanol and water. J Opt Soc Am B. 2003;20(12):2470–2479. doi: 10.1364/JOSAB.20.002470. [DOI] [Google Scholar]
- 25.Sun Y, Day RN. Investigating protein-protein interactions in living cells using fluorescence lifetime imaging microscopy. Nat Protocol. 2011;6(9):1324–1340. doi: 10.1038/nprot.2011.364. [DOI] [PMC free article] [PubMed] [Google Scholar]
- 26.Thompson RB, Gratton E. Phase fluorometric method for determination of standard lifetimes. Anal Chem. 1988;60(7):670–674. doi: 10.1021/ac00158a014. [DOI] [PubMed] [Google Scholar]


