

Abstract
Background
Abiotic stresses which include drought and heat are amongst the main limiting factors for plant growth and crop productivity. In the field, these stress types are rarely presented individually and plants are often subjected to a combination of stress types. Sorghum bicolor is a cereal crop which is grown in arid and semi-arid regions and is particularly well adapted to the hot and dry conditions in which it originates and is now grown as a crop. In order to better understand the mechanisms underlying combined stress tolerance in this important crop, we have used microarrays to investigate the transcriptional response of Sorghum subjected to heat and drought stresses imposed both individually and in combination.
Results
Microarrays consisting of 28585 gene probes identified gene expression changes equating to ~4% and 18% of genes on the chip following drought and heat stresses respectively. In response to combined stress ~20% of probes were differentially expressed. Whilst many of these transcript changes were in common with those changed in response to heat or drought alone, the levels of 2043 specific transcripts (representing 7% of all gene probes) were found to only be changed following the combined stress treatment. Ontological analysis of these ‘unique’ transcripts identified a potential role for specific transcription factors including MYB78 and ATAF1, chaperones including unique heat shock proteins (HSPs) and metabolic pathways including polyamine biosynthesis in the Sorghum combined stress response.
Conclusions
These results show evidence for both cross-talk and specificity in the Sorghum response to combined heat and drought stress. It is clear that some aspects of the combined stress response are unique compared to those of individual stresses. A functional characterization of the genes and pathways identified here could lead to new targets for the enhancement of plant stress tolerance, which will be particularly important in the face of climate change and the increasing prevalence of these abiotic stress types.
Electronic supplementary material
The online version of this article (doi:10.1186/1471-2164-15-456) contains supplementary material, which is available to authorized users.
Keywords: Combined stress, Drought, Heat, Microarray, Sorghum, Transcriptomics
Background
Adverse environmental conditions result in substantial losses to agricultural food production worldwide. In particular, abiotic stresses, which include drought, heat and salinity, are amongst the biggest constraints on crop productivity [1, 2]. These types of abiotic stress are, however, rarely presented individually and crops are often subjected to simultaneous adverse conditions, particularly in arid and semi-arid regions of the world [3]. Such combined stress has been shown in Sorghum, wheat and other grass crops to have an even greater detrimental impact on plant productivity than when each stress is imposed individually [4–6]. Land area affected by combined stress is likely to increase given the anticipated climate changes [7]. The co-incidence of heat and drought stress is therefore likely to become an increasingly common scenario in the future.
As a result of their sessile nature, when faced with adverse conditions, plants alter their biochemical and molecular machinery in order to adapt to the change in their environment. Following the perception of the stress, a signal is relayed to the nucleus via complex cellular signalling networks involving second messengers such as reactive oxygen intermediates (ROIs) and calcium, calcium-associated proteins and kinase cascades such as mitogen-activated protein (MAP) kinase cascades [8–11]. This leads to the activation of transcriptional pathways which in turn may lead to changes in the flow of metabolites, induction of stress tolerance genes and physiological changes associated with protection from cellular damage [8–11]. Examples of stress tolerance genes include molecular chaperones such as Late Embryogenesis Abundant (LEA) proteins and Heat Shock Proteins (HSPs) which act to protect proteins and membranes [1]. The changes in response to stress at the transcriptomic level must be modulated both rapidly and with specificity to the particular stress encountered and are of key importance for a plant response which is tailored to its environment.
An analysis of changes at the transcript level can be used to identify new signaling proteins and metabolic processes which are important for providing stress tolerance to plants. The transcriptional response to heat or drought stresses imposed on their own has been extensively studied in a number of plant species [12–15]. These studies have identified particular processes required for stress tolerance. Interestingly, it has been found that a combination of drought and heat stress in Arabidopsis and tobacco results in a unique transcriptional response which cannot simply be extrapolated from the effect of each stress imposed individually [16–18]. Plants therefore have novel responses when presented with combined stress.
Sorghum (Sorghum bicolor L. Moench.) is a grain crop which is grown in the arid and semi-arid regions of South Africa, Australia, India and America. It is grown primarily as a food source and is the dietary staple for more than 500 million people [19]. Given that Sorghum thrives under conditions of low water availability and high temperatures it is an excellent model for the study of transcriptomic changes induced to enable tolerance to drought and heat stress. A wealth of research has been performed on Sorghum physiology in order to select for agriculturally beneficial traits, however, until recently molecular characterization has been relatively limited. This has been facilitated in recent years by the sequencing of the Sorghum genome [20]. The transcriptomic response of Sorghum to osmotic stress, induced by PEG, has been reported [21, 22] however there are no published reports using bona fide drought-treated samples. No transcriptomic analyses of heat responses or combined heat and drought responses in Sorghum have yet been reported.
Given the previously observed unique transcriptional response to combined stress in Arabidopsis and tobacco, we have investigated changes in gene expression which occur following a similar treatment in Sorghum. The aim of this was to identify important processes/responses required for combined stress tolerance in this important crop particularly adapted to hot and arid environments, as it might offer insight not gained from other species. We have used custom-designed microarrays containing 28585 gene probes based on the latest genome annotations at the time of printing. We have identified sets of genes which are differentially expressed in response to each treatment type, as well as demonstrating that there is specificity of gene expression; specific genes being up- and down-regulated only in response to combined (but not individual) stress. Analysis of these genes suggests that specific processes e.g. polyamine synthesis might be involved in tolerance to combined heat and drought stress in Sorghum. This study will be useful for not only improving our understanding of basic stress tolerance mechanisms but also in the development of new stress tolerant Sorghum cultivars.
Results
Transcriptomic analysis of Sorghum subjected to drought, heat and combined drought and heat stress
To investigate the changes in gene expression which occur in Sorghum subjected to heat and drought stresses either on their own, or in combination, we carried out transcriptomic analyses using DNA microarrays (Agilent Technologies Ltd) containing 28585 unique gene probes. Drought stress was administered to seedlings by withdrawing water from 14 days after sowing (DAS) whilst the remaining (control) plants were well-watered. Heat shock was carried out by subjecting the seedlings to 50°C for 3 hours, compared to a control treatment of 28°C. The heat shock was conducted at the point at which Fv/Fm, which gives an indication of photosynthetic efficiency [23, 24], first started to significantly drop in the drought stressed plants, with respect to the well-watered controls. This was at around 3 days following water withdrawal (Additional file 1: Figure S1). In this way we were able to ensure that the drought stressed plants were experiencing bona fide stress when the combined treatment was executed.
Gene expression responses to drought
As shown in Figure 1 966 Sorghum transcripts were up-regulated and 224 were down-regulated by greater than 2-fold following drought stress only when compared to the untreated plants, equating to approximately 4% of the genes on the chip. Amongst the most highly elevated transcripts are those encoding Late Embryogenesis Abundant (LEA) proteins. Other highly elevated genes include P5CS2, which is involved in the metabolism of the compatible solute proline [25] and HKT1, a sodium ion transmembrane transporter involved in maintaining cellular Na+ homeostasis [26] (Additional file 1: Table S1). Of the top 100 up and down regulated transcripts however, 15 encode proteins of unknown function (Table 1). In order to further explore the biological processes and molecular functions which are enriched within this (drought-regulated) gene set relative to the background genome, gene ontology (GO) analysis was carried out (Figure 2). In total, 92 GO categories exhibited significant enrichment in the drought up-regulated genes based upon a corrected p-value cut-off of 0.05 (Additional file 1: Table S2). As would be expected, the analysis shows an enrichment of genes involved in response to stress and in particular response to water deprivation. Genes associated with response to ABA are also enriched within the data set which is not surprising given the central role of ABA in the drought stress response [27]. Other examples of enriched GO categories include regulation of photosynthesis, fluid transport and amino acid metabolism (Figure 2a). Promoter motif analysis was carried out to identify promoter motifs which are enriched within the drought data set. As can be seen in Figure 3, the most highly represented promoter motif in the 966 drought up-regulated genes was similar to the abscisic acid response element (ABRE): (C/T)ACGTGTC.
Figure 1.
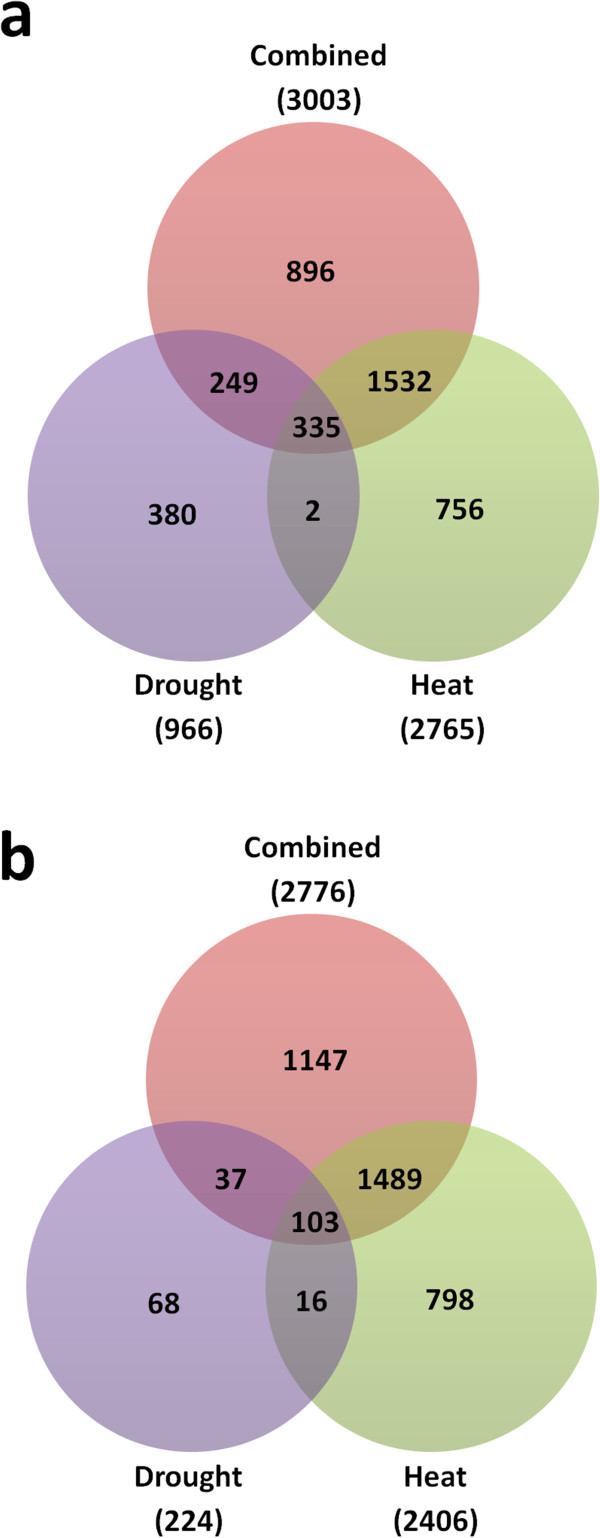
Venn diagrams showing the number of transcripts up-regulated (a) or down-regulated (b) by either heat, drought or combined heat and drought treatments in Sorghum leaf tissue (compared to control non-stressed plants). Only transcripts with a change of >2 fold in all 3 replicates were included.
Table 1.
Top 100 genes differentially expressed in response to drought (based on average absolute fold change) compared to control unstressed plants
| SbID | Annotation | Average fold change (Abs) | Regulation |
|---|---|---|---|
| Sb01g046000.1 | Unknown protein | 2900.8 | Up |
| Sb03g029830.1 | Unknown protein | 1243.2 | Up |
| Sb10g028640.2 | Unknown protein | 1074.9 | Up |
| Sb07g021850.1 | Uknown protein | 1066.6 | Up |
| Sb01g046490.1 | LEA protein | 924.5 | Up |
| Sb09g027110.2 | unknown protein | 865.4 | Up |
| Sb07g000520.1 | CYP71A25 | 829.8 | Up |
| Sb09g027110.1 | LEA protein | 776.7 | Up |
| Sb03g001130.1 | AAA-type ATPase family protein | 669.0 | Up |
| Sb07g023010.1 | AMY1 (ALPHA-AMYLASE-LIKE) | 586.6 | Up |
| Sb03g011090.1 | ATECP63 (EMBRYONIC CELL PROTEIN 63) | 570.9 | Up |
| Sb06g004280.1 | Transketolase | 564.8 | Up |
| Sb02g013190.1 | Unknown protein | 539.5 | Up |
| Sb02g043300.1 | HB-3; transcription factor | 520.6 | Up |
| Sb03g034280.1 | ATNADP-ME1 (NADP-malic enzyme 1) | 467.0 | Up |
| Sb01g012640.1 | PAP85; nutrient reservoir | 447.1 | Up |
| Sb07g003040.1 | Tyrosine decarboxylase | 444.5 | Up |
| Sb03g032380.2 | Unknown protein | 407.1 | Up |
| Sb03g043410.1 | Unknown protein | 385.5 | Up |
| Sb09g021016.1 | AP2 domain-containing transcription factor, putative | 383.3 | Up |
| Sb01g009730.1 | Unknown protein | 367.4 | Up |
| Sb08g023230.1 | Unknown protein | 367.4 | Up |
| Sb07g003010.1 | Tyrosine decarboxylase | 349.8 | Up |
| Sb04g031810.1 | Unknown protein | 348.0 | Up |
| Sb01g037560.1 | Mitochondrial import inner membrane translocase subunit Tim17/Tim22/Tim23 family protein | 308.4 | Up |
| Sb04g009130.1 | LEA domain-containing protein | 306.7 | Up |
| Sb01g038670.1 | Hydrophobic protein, putative | 280.8 | Up |
| Sb01g037560.2 | Unknown protein | 278.9 | Up |
| Sb03g036980.1 | DC1 domain-containing protein | 272.5 | Up |
| Sb04g023920.1 | UGT85A2 (UDP-glucosyl transferase 85A2) | 267.0 | Up |
| Sb09g018420.1 | RAB18 (RESPONSIVE TO ABA 18) | 264.6 | Up |
| Sb01g050670.1 | OLEO1 (OLEOSIN 1) | 251.3 | Up |
| Sb08g005220.1 | Unknown protein | 223.5 | Up |
| Sb10g003700.1 | XERO1 (DEHYDRIN XERO 1) | 217.0 | Up |
| Sb05g003200.1 | Unknown protein | 209.3 | Up |
| Sb04g033380.1 | HB-7 (HOMEOBOX 7) | 192.7 | Up |
| Sb02g006320.1 | SIP2 (seed imbibition 2) | 190.0 | Up |
| Sb04g021000.1 | SAG29 (SENESCENCE-ASSOCIATED PROTEIN 29) | 187.4 | Up |
| Sb03g028870.1 | KING1 (SNF1-RELATED PROTEIN KINASE REGULATORY SUBUNIT GAMMA 1) | 185.3 | Up |
| Sb03g029890.1 | PP2CA (PROTEIN PHOSPHATASE 2CA) | 184.4 | Up |
| Sb07g026340.1 | F-box family protein | 179.9 | Up |
| Sb02g034590.1 | Aconitate hydratase | 177.5 | Up |
| Sb03g030050.1 | GBF3 (G-BOX BINDING FACTOR 3) | 172.8 | Up |
| Sb06g027900.1 | HKT1 (HIGH-AFFINITY K + TRANSPORTER 1) | 155.9 | Up |
| Sb10g028640.1 | WIN2 (HOPW1-1-INTERACTING 2) | 155.3 | Up |
| Sb05g016880.1 | unknown protein | 147.6 | Up |
| Sb06g001720.1 | HAB1 (HOMOLOGY TO ABI1) | 144.1 | Up |
| Sb07g015410.1 | LEA protein | 134.3 | Up |
| Sb06g034080.1 | phosphatidylinositol-4-phosphate 5-kinase family protein | 131.4 | Up |
| Sb07g021840.1 | unknown protein | 130.5 | Up |
| Sb03g032230.1 | S-adenosyl-L-methionine:carboxyl methyltransferase family protein | 129.4 | Up |
| Sb05g005480.1 | CYP71B2 (CYTOCHROME P450 71B2) | 129.0 | Up |
| Sb04g032890.1 | Unknown protein | 128.1 | Up |
| Sb04g008300.1 | HSFC1 | 127.0 | Up |
| Sb06g033420.1 | Unknown protein | 118.5 | Up |
| Sb04g037900.1 | DNA-binding family protein | 114.9 | Up |
| Sb03g007420.1 | Unknown protein | 113.3 | Up |
| Sb04g017790.1 | LEA protein | 105.7 | Up |
| Sb03g012500.1 | Mitochondrial import inner membrane translocase subunit Tim17/Tim22/Tim23 family protein | 105.6 | Up |
| Sb03g030050.2 | Unknown protein | 100.8 | Up |
| Sb08g009120.1 | Unknown protein | 99.0 | Up |
| Sb03g036040.1 | HMT2 (HOMOCYSTEINE METHYLTRANSFERASE 2) | 93.5 | Up |
| Sb01g017695.1 | LTI65 (LOW-TEMPERATURE-INDUCED 65) | 91.2 | Up |
| Sb01g036790.1 | ECP63 (EMBRYONIC CELL PROTEIN 63) | 90.3 | Up |
| Sb06g019610.1 | PFK2 (PHOSPHOFRUCTOKINASE 2) | 89.6 | Up |
| Sb10g002440.1 | Unknown protein | 89.2 | Up |
| Sb07g003720.1 | TT7 (TRANSPARENT TESTA 7) | 89.2 | Up |
| Sb01g039890.1 | Protein phosphatase 2C | 88.0 | Up |
| Sb04g020543.1 | RXF12 | 86.6 | Up |
| Sb09g023040.1 | Phosphatidylethanolamine-binding family protein | 86.4 | Up |
| Sb02g004640.1 | Unknown protein | 85.4 | Up |
| Sb10g000930.1 | LEA groUp 1 domain-containing protein | 85.2 | Up |
| Sb06g025580.1 | unknown protein | 84.9 | Up |
| Sb09g006220.1 | basic helix-loop-helix (bHLH) family protein | 84.6 | Up |
| Sb01g043910.1 | HB40 (HOMEOBOX PROTEIN 40) | 82.8 | Up |
| Sb02g004560.1 | Unknown protein | 82.6 | Up |
| Sb06g020045.1 | C2 domain-containing protein | 80.2 | Up |
| Sb06g027090.1 | MLP423 (MLP-LIKE PROTEIN 423) | 80.1 | Up |
| Sb03g041320.1 | Unknown protein | 79.9 | Up |
| Sb09g018630.1 | ERF1-2 (EUKARYOTIC RELEASE FACTOR 1–2) | 78.6 | Up |
| Sb04g000620.1 | BETAFRUCT4; beta-fructofuranosidase | 77.7 | Up |
| Sb06g025570.1 | Unknown protein | 76.2 | Up |
| Sb02g010080.1 | AWPM-19-like membrane family protein | 74.1 | Up |
| Sb06g025450.1 | Unknown protein | 72.6 | Up |
| Sb03g032380.1 | LEA protein | 72.1 | Up |
| Sb09g024255.1 | EDL3 (EID1-like 3) | 71.2 | Up |
| Sb02g025810.1 | Subtilase family protein | 70.9 | Up |
| Sb03g006690.1 | Unknown protein | 70.6 | Up |
| Sb01g030345.1 | Plant EC metallothionein-like family 15 protein | 70.3 | Up |
| Sb04g016960.1 | Unknown protein | 69.8 | Up |
| Sb03g039820.2 | Unknown protein | 69.1 | Up |
| Sb10g008130.1 | FTSH6 (FTSH PROTEASE 6) | 66.3 | Up |
| Sb01g005110.1 | SHY2 (SHORT HYPOCOTYL 2) | 66.3 | Up |
| Sb03g039820.1 | P5CS2 (DELTA 1-PYRROLINE-5-CARBOXYLATE SYNTHASE 2) | 64.4 | Up |
| Sb06g033100.1 | Unknown protein | 63.9 | Up |
| Sb03g013660.1 | Unknown protein | 63.1 | Up |
| Sb01g048120.1 | Transcription activator-related | 60.3 | Up |
| Sb01g020830.1 | Peroxidase, putative | 59.5 | Up |
| Sb09g020240.1 | proton-dependent oligopeptide transport (POT) family protein | 59.3 | Up |
| Sb03g035570.1 | serine protease inhibitor | 58.9 | Up |
Figure 2.
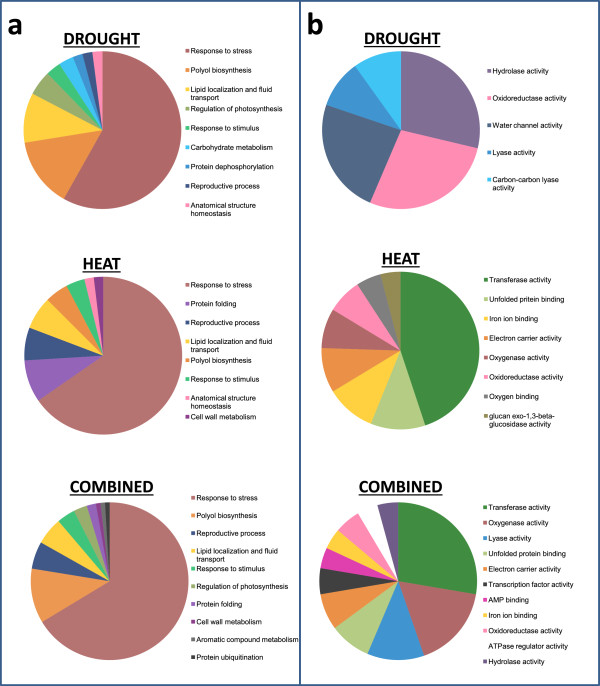
Pie charts showing summarised Gene Ontology (GO) analysis of the total gene sets responding to either drought, heat or combined drought and heat stress. (a) shows biological process GO terms and (b) shows molecular process GO terms. Only GO terms enriched with a p value of <0.05 were selected and summarized using REVIGO (see methods). Detailed breakdowns of the ontologies are available in Additional file 1: Tables S2, S5 and S8.
Figure 3.
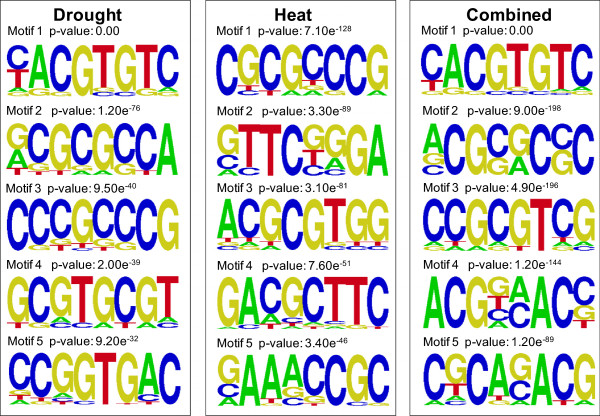
Most significantly enriched sequences found in promoters of genes up-regulated in response to drought (left), heat (centre) and combined heat and drought (right). Figure shows top 5 statistically-significant consensus sequences generating using AMADEUS and enoLOGOS. Probability values representing significance of enrichment (calculated as described in Methods) are shown for each motif.
Three hundred and eighty transcripts were found to be up-regulated exclusively in response to drought stress i.e. were not also up-regulated in response to heat, or heat and drought in combination (Figure 1a). This was validated by carrying out qPCR on selected genes and is exemplified by Sb01g021320 (Figure 4a). These 380 genes include examples associated with lipid transport such as a number of lipid transfer proteins (LTPs) and genes involved with the regulation of cell size such an expansin (see Additional file 1: Table S3 for full gene lists). Interestingly, 2 LEA genes were found to be up-regulated exclusively in response to drought, suggesting specific LEAs may have specific unique roles in response to different stress types.
Figure 4.
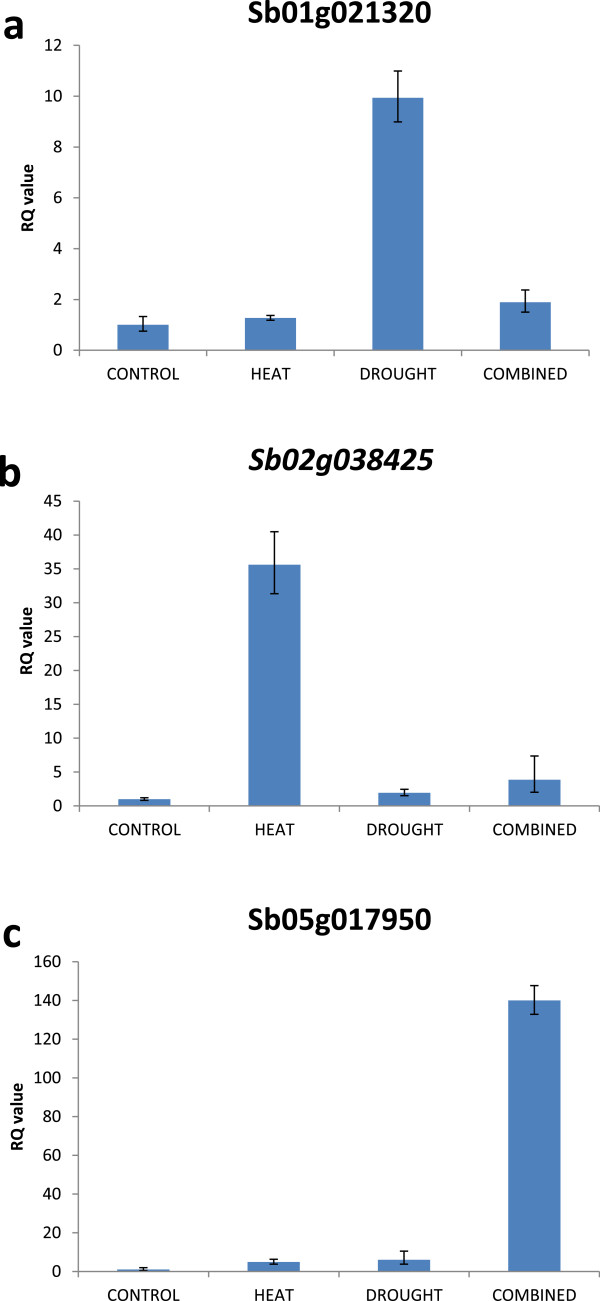
Relative transcript abundance of genes representative of the gene sets identified as being up-regulated preferentially by either drought stress (a), heat stress (b) or combined heat and drought stress (c). Error bars represent RQMIN and RQMAX and constitute the acceptable error level for a 95% confidence level according to Student’s t-test.
Previous work carried out by Dugas, et al. [21], using next generation sequencing transcriptomic approaches, has identified differentially expressed transcripts in Sorghum leaves following osmotic stress imposed by PEG treatment. In order to determine whether there are differences in the Sorghum response to different types of osmotic stress i.e. PEG treatment compared to the gradual water loss imposed here, we compared the differentially expressed transcripts identified in both studies. Approximately one third of our drought-induced transcripts were in common with those identified by Dugas et al. (Figure 5). GO analysis of these overlapping genes shows an enrichment of genes associated with response to water deprivation, regulation of photosynthesis and response to ABA (Table 2). However, 902 and 807 transcripts were unique to either the PEG treatment or the water withdrawal treatment respectively. GO analysis of the genes unique to the PEG treatment shows an enrichment of genes associated with response to stress and response to reactive oxygen species (Table 3). However, GO analysis of the genes unique to the gradual water withdrawal, shows a strong enrichment of genes associated with wax biosynthesis (Table 4). Different processes therefore seem to be associated with the different stress types.
Figure 5.
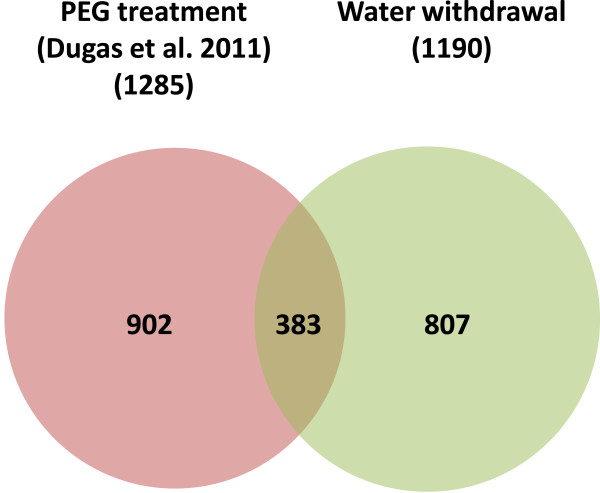
Venn digaram showing the number of transcripts differentially expressed in response to the gradual drought stress imposed here and in response to the PEG treatment imposed in Dugas et. al [21]. Only transcripts with a change of > 2 fold are included.
Table 2.
Gene Ontology (GO terms) enriched (p < 0.1) in both the differentially expressed genes following the drought treatment imposed here and also in the PEG treatment imposed in the Dugas et al. [21]
| GO ACCESSION | GO term | P-value | % count in selection | % count in total genome |
|---|---|---|---|---|
| GO:0009644 | Response to high light intensity | 0.000 | 6.23 | 0.49 |
| GO:0009415 | Response to water | 0.000 | 9.51 | 1.62 |
| GO:0009266 | Response to temperature stimulus | 0.000 | 13.77 | 3.57 |
| GO:0009628 | Response to abiotic stimulus | 0.000 | 23.93 | 9.56 |
| GO:0010205 | Photoinhibition | 0.000 | 2.62 | 0.07 |
| GO:0006950 | Response to stress | 0.000 | 28.85 | 14.70 |
| GO:0006970 | Response to osmotic stress | 0.000 | 9.84 | 2.58 |
| GO:0009409 | Response to cold | 0.000 | 9.51 | 2.45 |
| GO:0042548 | Regulation of photosynthesis, light reaction | 0.000 | 2.62 | 0.12 |
| GO:0042221 | Response to chemical stimulus | 0.000 | 25.57 | 13.05 |
| GO:0009408 | Response to heat | 0.000 | 6.56 | 1.29 |
| GO:0009737 | Response to abscisic acid stimulus | 0.000 | 8.85 | 2.38 |
| GO:0043467 | Regulation of generation of precursor metabolites and energy | 0.000 | 2.62 | 0.21 |
| GO:0042538 | Hyperosmotic salinity response | 0.002 | 3.28 | 0.49 |
| GO:0050896 | Response to stimulus | 0.002 | 40.33 | 28.12 |
| GO:0008287 | Protein serine/threonine phosphatase complex | 0.004 | 2.95 | 0.43 |
| GO:0000302 | Response to reactive oxygen species | 0.008 | 3.93 | 0.86 |
| GO:0009314 | Response to radiation | 0.010 | 9.18 | 3.82 |
| GO:0006470 | Protein dephosphorylation | 0.018 | 2.95 | 0.53 |
| GO:0010119 | Regulation of stomatal movement | 0.019 | 2.95 | 0.54 |
| GO:0023057 | Negative regulation of signaling | 0.021 | 2.95 | 0.55 |
| GO:0004722 | Protein serine/threonine phosphatase activity | 0.065 | 3.28 | 0.79 |
| GO:0009719 | Response to endogenous stimulus | 0.065 | 12.79 | 6.94 |
| GO:0008289 | Lipid binding | 0.066 | 3.93 | 1.12 |
Table 3.
Gene Ontology (GO terms) enriched (p < 0.1) in the differentially expressed genes following the Sorghum PEG treatment carried out in Dugas et al. [21] but not in the drought treatment imposed here
| GO ACCESSION | GO term | P-value | % count in selection | % count in total genome |
|---|---|---|---|---|
| GO:0050896 | Response to stimulus | 0.000 | 39.6 | 28.1 |
| GO:0006950 | Response to stress | 0.000 | 23.7 | 14.7 |
| GO:0009642 | Response to light intensity | 0.000 | 3.0 | 0.7 |
| GO:0010035 | Response to inorganic substance | 0.000 | 5.5 | 2.2 |
| GO:0042221 | Response to chemical stimulus | 0.000 | 19.9 | 13.1 |
| GO:0006805 | Xenobiotic metabolic process | 0.001 | 1.2 | 0.1 |
| GO:0009408 | Response to heat | 0.001 | 3.9 | 1.3 |
| GO:0009410 | Response to xenobiotic stimulus | 0.002 | 1.2 | 0.1 |
| GO:0009607 | Response to biotic stimulus | 0.002 | 10.0 | 5.5 |
| GO:0051707 | Response to other organism | 0.004 | 9.3 | 5.1 |
| GO:0009644 | Response to high light intensity | 0.005 | 2.1 | 0.5 |
| GO:0000302 | Response to reactive oxygen species | 0.008 | 2.8 | 0.9 |
| GO:0005576 | Extracellular region | 0.008 | 6.4 | 3.1 |
| GO:0006026 | Aminoglycan catabolic process | 0.023 | 1.1 | 0.2 |
| GO:0009055 | Electron carrier activity | 0.023 | 7.6 | 4.2 |
| GO:0051704 | Multi-organism process | 0.027 | 10.7 | 6.6 |
| GO:0005385 | Zinc ion transmembrane transporter activity | 0.029 | 0.8 | 0.1 |
| GO:0009628 | Response to abiotic stimulus | 0.029 | 14.2 | 9.6 |
| GO:0071577 | Zinc ion transmembrane transport | 0.029 | 0.8 | 0.1 |
| GO:0006030 | Chitin metabolic process | 0.032 | 1.1 | 0.2 |
| GO:0009719 | Response to endogenous stimulus | 0.041 | 10.9 | 6.9 |
| GO:0061134 | Peptidase regulator activity | 0.083 | 1.7 | 0.4 |
Table 4.
Gene Ontology (GO terms) enriched (p < 0.1) in the differentially expressed genes following the drought treatment imposed here but not in the PEG treatment imposed in the Dugas et al. [21]
| GO ACCESSION | GO term | P-value | % count in selection | % count in total genome |
|---|---|---|---|---|
| GO:0010025 | Wax biosynthetic process | 0.065 | 1.50 | 0.25 |
| GO:0032787 | Monocarboxylic acid metabolic process | 0.065 | 5.26 | 2.35 |
| GO:0042221 | Response to chemical stimulus | 0.068 | 18.80 | 13.05 |
| GO:0016740 | Rransferase activity | 0.081 | 25.26 | 18.90 |
| GO:0043765 | T/G mismatch-specific endonuclease activity | 0.081 | 0.60 | 0.03 |
| GO:0003824 | Catalytic activity | 0.084 | 58.95 | 51.25 |
| GO:0050896 | Response to stimulus | 0.084 | 35.19 | 28.12 |
Gene expression responses to heat
Following heat stress, 2765 Sorghum transcripts were up-regulated and 2406 down-regulated (~18% of the genes on the chip in total) (Figure 1 and Additional file 1: Table S4). The most enriched promoter motif in the 2765 heat up-regulated genes was found to be, CGCGCCCG which, whilst showing some similarity to CAMTA binding sites, was not identical to known promoter motifs. The second and fourth most enriched sequences, however, had consensuses containing the basic 5 bp heat shock element (HSE) motif, nGAAn (nTTCn in reverse complement) and overlapping with the full triple repeat HSE, nGAAnnTTCnnGAAn (Figure 3). As expected, amongst the transcripts most highly up-regulated in response to heat were a large number of genes encoding Heat Shock Proteins (HSPs) (23 of the top 100 gene changes) and Universal Stress Proteins (USPs) (Table 5). Some of these are unique to heat stress with 5 elevated only in response to this stress type (not expressed in response to heat and drought combined, or drought alone). These HSP genes are accompanied by the unique up-regulation of 2 heat shock factors (HSFs) which are known to regulate the expression of HSPs (Wang et al., 2003). Genes which are up-regulated only by heat stress are represented by Sb02g038425 (Figure 4b). Other highly induced genes are associated with protection from oxidative stress and include ascorbate peroxidase 3 (see Additional file 1: Table S6 for full gene list). Gene ontology analysis of the heat up-regulated genes shows an enrichment of the following categories: response to heat, response to high light, response to ROI and protein folding (Additional file 1: Table S5). Enriched pathways which are in common with the drought stress response include response to ABA and lipid localization whilst other categories such as protein folding are only enriched in the heat gene set (Figure 2a and Additional file 1: Tables S2 and S5).
Table 5.
Top 100 genes differentially expressed in response to heat (based on average absolute fold change) compared to control unstressed plants
| SbID | Annotation | Average fold change (Abs) | Regulation |
|---|---|---|---|
| Sb06g017850.1 | HSP22.0 | 5670.2 | Up |
| Sb03g034390.1 | HSP101 | 4552.7 | Up |
| Sb10g012970.1 | Peptidyl-prolyl cis-trans isomerase, putative | 1854.5 | Up |
| Sb01g039990.1 | HSP18.2 | 1738.0 | Up |
| Sb01g040000.1 | HSP18.2 | 1567.4 | Up |
| Sb04g034630.1 | Universal stress protein (USP) family protein | 1510.5 | Up |
| Sb06g016710.1 | RAP2.6 (related to AP2 6) | 1459.0 | Up |
| Sb09g022400.1 | Cytochrome-c oxidase | 1437.9 | Up |
| Sb06g000660.1 | HSP90.1 | 1425.2 | Up |
| Sb03g003530.1 | HSP17.6II (17.6 KDA CLASS II HEAT SHOCK PROTEIN) | 1021.6 | Up |
| Sb01g015760.1 | Scarecrow-like transcription factor 9 (SCL9) | 1018.0 | Up |
| Sb02g042790.1 | Unknown protein | 1000.0 | Up |
| Sb03g006920.1 | HSP18.2 (heat shock protein 18.2) | 984.6 | Up |
| Sb04g007585.1 | HSP17.6A (HEAT SHOCK PROTEIN 17.6A) | 832.2 | Up |
| Sb04g007600.1 | HSP17.6A (HEAT SHOCK PROTEIN 17.6A) | 820.9 | Up |
| Sb04g030895.1 | Unknown protein | 785.0 | Up |
| Sb04g030895.2 | Unknown protein | 710.6 | Up |
| Sb10g008130.1 | FTSH6 (FTSH PROTEASE 6) | 676.4 | Up |
| Sb05g021400.1 | CYP76C2 | 512.6 | Up |
| Sb02g026070.1 | Unknown protein | 491.0 | Up |
| Sb03g006900.1 | HSP18.2 (heat shock protein 18.2) | 451.6 | Up |
| Sb07g028370.1 | HSP21 (HEAT SHOCK PROTEIN 21) | 451.2 | Up |
| Sb06g030310.1 | Pectinesterase family protein | 446.2 | Up |
| Sb08g002950.1 | Unknown protein | 412.0 | Up |
| Sb01g010460.1 | BIP1 | 364.4 | Up |
| Sb10g007320.1 | OPR2 | 324.5 | Up |
| Sb09g027030.1 | Basic helix-loop-helix (bHLH) family protein | 318.1 | Up |
| Sb03g006880.1 | HSP18.2 (heat shock protein 18.2) | 313.4 | Up |
| Sb08g020850.1 | Lectin protein kinase, putative | 303.8 | Up |
| Sb07g001530.1 | Unknown protein | 303.7 | Up |
| Sb10g025830.1 | Unknown protein | 287.7 | Up |
| Sb09g024255.1 | EDL3 (EID1-like 3) | 261.0 | Up |
| Sb01g015750.1 | Unknown protein | 253.7 | Up |
| Sb04g030135.1 | 17.6 kDa class I small heat shock protein (HSP17.6C-CI) | 253.0 | Up |
| Sb01g046350.1 | HSFA6B | 241.9 | Up |
| Sb01g038670.1 | Low temperature and salt responsive protein | 234.3 | Up |
| Sb01g030345.1 | Plant EC metallothionein-like family 15 protein | 229.5 | Up |
| Sb02g030040.1 | UDP-glucoronosyl/UDP-glucosyl transferase family protein | 221.6 | Up |
| Sb05g018030.1 | BAG5 (BCL-2-ASSOCIATED ATHANOGENE 5) | 213.5 | Up |
| Sb03g006890.1 | HSP18.2 (heat shock protein 18.2) | 210.9 | Up |
| Sb10g023010.1 | MBF1C (MULTIPROTEIN BRIDGING FACTOR 1C) | 205.4 | Up |
| Sb05g008770.1 | Disease resistance-responsive family protein | 204.0 | Up |
| Sb09g023040.1 | Phosphatidylethanolamine-binding family protein | 203.8 | Up |
| Sb04g027330.1 | 23.5 kDa mitochondrial small heat shock protein (HSP23.5-M) | 197.4 | Up |
| Sb02g026600.1 | CYP707A4 | 195.6 | Up |
| Sb10g007330.1 | OPR2 | 188.9 | Up |
| Sb08g001520.1 | No apical meristem (NAM) family protein | 188.3 | Up |
| Sb06g001970.1 | APX3 (ASCORBATE PEROXIDASE 3) | 181.9 | Up |
| Sb03g032910.1 | Unknown protein | 179.3 | Up |
| Sb03g038160.1 | C4H (CINNAMATE-4-HYDROXYLASE) | 178.0 | Up |
| Sb03g012940.1 | SAG21 (SENESCENCE-ASSOCIATED GENE 21) | 177.6 | Up |
| Sb01g027480.1 | Unknown protein | 170.0 | Up |
| Sb01g008350.1 | Glutamate binding | 163.9 | Up |
| Sb02g025930.1 | GEX1 (GAMETE EXPRESSED PROTEIN 1) | 155.6 | Up |
| Sb03g041980.1 | Pentatricopeptide (PPR) repeat-containing protein | 154.9 | Up |
| Sb09g027890.1 | Ferredoxin-related | 148.2 | Up |
| Sb10g009970.1 | Protein kinase family protein | 142.4 | Up |
| Sb10g009090.1 | 15.7 kDa class I-related small heat shock protein-like (HSP15.7-CI) | 140.2 | Up |
| Sb05g027880.1 | RCA (RUBISCO ACTIVASE) | 137.7 | Up |
| Sb06g016240.1 | Nucleic acid binding | 134.1 | Up |
| Sb02g025930.2 | Unknown protein | 129.4 | Up |
| Sb01g040025.1 | EDM2; transcription factor | 129.4 | Up |
| Sb02g028060.1 | Unknown protein | 129.0 | Up |
| Sb1058s002010 | Unknown protein | 119.0 | Up |
| Sb03g005090.1 | tRLP7 (Receptor Like Protein 7) | 117.8 | Up |
| Sb06g001260.1 | ACX4 (ACYL-COA OXIDASE 4) | 115.5 | Up |
| Sb01g039436.1 | Heat shock cognate 70 kDa protein 2 (HSC70-2) | 113.4 | Up |
| Sb09g024180.1 | CYC1BAT; cyclin-dependent protein kinase regulator | 111.1 | Up |
| Sb07g003040.1 | Tyrosine decarboxylase, putative | 106.9 | Up |
| Sb07g019840.1 | CFIM-25 | 103.9 | Up |
| Sb01g037590.1 | Unknown protein | 103.3 | Up |
| Sb01g016900.1 | CYP76C1 | 102.6 | Up |
| Sb07g025210.1 | DREB1A (DEHYDRATION RESPONSE ELEMENT B1A) | 102.0 | Up |
| Sb02g017220.2 | unknown protein | 100.3 | Up |
| Sb08g000570.1 | unknown protein | 98.8 | Up |
| Sb10g003880.1 | carboxylesterase/ hydrolase/ hydrolase, acting on ester bonds | 98.5 | Up |
| Sb04g024540.1 | unknown protein | 97.7 | Up |
| Sb10g007430.1 | glycine-rich protein | 97.6 | Up |
| Sb02g017220.1 | Metal ion binding | 97.4 | Up |
| Sb03g034980.1 | KAT1 (POTASSIUM CHANNEL IN ARABIDOPSIS THALIANA 1) | 90.6 | Up |
| Sb01g009370.1 | EGY3 (ETHYLENE-DEPENDENT GRAVITROPISM-DEFICIENT AND YELLOW-GREEN-LIKE 3) | 90.5 | Up |
| Sb01g039510.1 | HSC70-1 (HEAT SHOCK COGNATE PROTEIN 70–1) | 90.2 | Up |
| Sb01g037090.1 | GolS1 (Arabidopsis thaliana galactinol synthase 1) | 89.6 | Up |
| Sb01g014230.1 | 5PTASE11 (INOSITOL POLYPHOSPHATE 5-PHOSPHATASE 11) | 87.2 | Up |
| Sb01g041180.1 | HSP21 (HEAT SHOCK PROTEIN 21) | 87.1 | Up |
| Sb04g035130.1 | 17.4 kDa class III heat shock protein (HSP17.4-CIII) | 84.7 | Up |
| Sb01g040030.1 | HSP17.4 | 84.5 | Up |
| Sb02g009720.1 | Unknown protein | 82.8 | Up |
| Sb08g001710.1 | MATE efflux family protein | 81.6 | Up |
| Sb02g009430.1 | UBX domain-containing protein | 81.2 | Up |
| Sb01g047480.1 | Zinc finger (C3HC4-type RING finger) family protein | 79.5 | Up |
| Sb01g039470.1 | HSP70 (heat shock protein 70) | 77.7 | Up |
| Sb06g027420.1 | AOX1B; alternative oxidase | 75.1 | Up |
| Sb06g026350.1 | Oxidoreductase, 2OG-Fe(II) oxygenase family protein | 73.8 | Up |
| Sb10g009140.1 | Caleosin-related family protein | 73.5 | Up |
| Sb01g003280.1 | Zinc finger (C2H2 type) family protein | 72.7 | Up |
| Sb06g023160.1 | Trypsin and protease inhibitor family protein | 72.6 | Up |
| Sb01g004060.1 | CYP76C2 | 72.0 | Up |
| Sb07g016730.1 | Unknown protein | 70.1 | Up |
| Sb09g030140.1 | Glycoside hydrolase family 28 protein | 69.4 | Up |
Combined heat and drought control the expression of distinct group of genes
Following the combined heat and drought stress 3003 transcripts were up-regulated and 2776 were down-regulated (~20% of gene spots in total) compared to the untreated control. The top 100 gene changes are shown in Table 6 (see Additional file 1: Table S7 for full list). Out of this total of 5779 (both up and down) gene expression changes, a large proportion (60%) were shared with the heat stress only response and 13% were shared with the response to drought (Figure 1). Despite this greater overlap with heat, none of the top 5 promoter motifs enriched in genes upregulated by combined heat and drought contained the basic 5 bp HSE. Indeed the most enriched motif was most similar to the ABRE, (C/T)ACGTGTC (Figure 3). Gene expression changes that were in common in the response to all 3 treatments totalled 438 (335 up-regulated, and 103 down-regulated). These particular genes are associated with the general plant stress response and include heat shock proteins, senescence-associated genes (SAGs) and glutathione transferases (Additional file 1: Table S11). It is not surprising that many of the GO categories enriched following combined stress are in common with those enriched following drought or heat alone (Figure 2). For example, lipid localization and fluid transport, regulation of photosynthesis and protein folding are all enriched in the combined stress gene set (Additional file 1: Table S8). However, some ontological processes appear unique to the combined stress up-regulated transcripts. These include genes associated with protein ubiquitination and aromatic compound metabolism (Figure 2a).
Table 6.
Top 100 genes differentially expressed in response to combined heat and drought stress (based on average absolute fold change) compared to control unstressed plants
| SbID | Annotation | Average fold change (Abs) | Regulation |
|---|---|---|---|
| Sb06g017850.1 | HSP22.0 | 17429.6 | Up |
| Sb03g034390.1 | HSP101 (HEAT SHOCK PROTEIN 101) | 16893.6 | Up |
| Sb10g012970.1 | Peptidyl-prolyl cis-trans isomerase | 6262.9 | Up |
| Sb04g034630.1 | Universal stress protein (USP) family protein | 5788.6 | Up |
| Sb04g030135.1 | 17.6 kDa class I small heat shock protein (HSP17.6C-CI) | 5135.6 | Up |
| Sb06g000660.1 | HSP90.1 (HEAT SHOCK PROTEIN 90.1) | 4744.9 | Up |
| Sb02g042790.1 | Unknown protein | 4705.1 | Up |
| Sb09g022400.1 | Cytochrome-c oxidase | 4527.3 | Up |
| Sb01g015760.1 | Scarecrow-like transcription factor 9 (SCL9) | 3631.6 | Up |
| Sb03g003530.1 | HSP17.6II (17.6 KDA CLASS II HEAT SHOCK PROTEIN) | 3174.2 | Up |
| Sb03g006920.1 | HSP18.2 (heat shock protein 18.2) | 3167.3 | Up |
| Sb01g039990.1 | HSP18.2 (heat shock protein 18.2) | 2929.5 | Up |
| Sb01g010460.1 | BIP1 | 2856.4 | Up |
| Sb05g021400.1 | CYP76C2 | 2799.2 | Up |
| Sb01g040000.1 | HSP18.2 (heat shock protein 18.2) | 2561.3 | Up |
| Sb06g030310.1 | pectinesterase family protein | 2467.5 | Up |
| Sb04g007585.1 | HSP17.6A (HEAT SHOCK PROTEIN 17.6A) | 2375.8 | Up |
| Sb04g007600.1 | HSP17.6A (HEAT SHOCK PROTEIN 17.6A) | 2356.4 | Up |
| Sb01g046000.1 | Unknown protein | 2277.8 | Up |
| Sb10g008130.1 | FTSH6 (FTSH PROTEASE 6) | 2085.7 | Up |
| Sb06g016710.1 | RAP2.6 (related to AP2 6) | 1584.4 | Up |
| Sb07g028370.1 | HSP21 (HEAT SHOCK PROTEIN 21) | 1286.9 | Up |
| Sb08g002950.1 | Unknown protein | 1276.5 | Up |
| Sb03g006900.1 | HSP18.2 (heat shock protein 18.2) | 1240.0 | Up |
| Sb07g026340.1 | F-box family protein | 1180.5 | Up |
| Sb05g018030.1 | BAG5 (BCL-2-ASSOCIATED ATHANOGENE 5) | 1162.8 | Up |
| Sb02g028060.1 | Unknown protein | 1142.1 | Up |
| Sb08g020850.1 | Lectin protein kinase, putative | 1128.9 | Up |
| Sb07g021850.1 | Unknown protein | 1097.8 | Up |
| Sb09g024255.1 | EDL3 (EID1-like 3) | 994.9 | Up |
| Sb01g038670.1 | Hydrophobic protein, putative | 981.7 | Up |
| Sb10g028640.2 | Unknown protein | 976.7 | Up |
| Sb08g000570.1 | Unknown protein | 924.9 | Up |
| Sb09g027110.2 | Unknown protein | 815.4 | Up |
| Sb09g027110.1 | LEA protein | 806.6 | Up |
| Sb09g027890.1 | Ferredoxin-related | 769.4 | Up |
| Sb03g029830.1 | Unknown protein | 744.5 | Up |
| Sb10g023010.1 | MBF1C (MULTIPROTEIN BRIDGING FACTOR 1C) | 700.8 | Up |
| Sb04g032890.1 | Unknown protein | 694.9 | Up |
| Sb07g001530.1 | Unknown protein | 664.5 | Up |
| Sb01g015750.1 | Unknown protein | 661.5 | Up |
| Sb04g030895.1 | Unknown protein | 636.7 | Up |
| Sb08g023230.1 | Unknown protein | 625.0 | Up |
| Sb05g008770.1 | Disease resistance-responsive family protein | 608.9 | Up |
| Sb04g030895.2 | Unknown protein | 602.7 | Up |
| Sb03g034280.1 | NADP-ME1 (NADP-malic enzyme 1) | 582.7 | Up |
| Sb09g023040.1 | Phosphatidylethanolamine-binding family protein | 569.4 | Up |
| Sb03g006880.1 | HSP18.2 (heat shock protein 18.2) | 567.1 | Up |
| Sb01g030345.1 | Plant EC metallothionein-like family 15 protein | 536.6 | Up |
| Sb04g035130.1 | 17.4 kDa class III heat shock protein (HSP17.4-CIII) | 515.5 | Up |
| Sb10g009970.1 | Protein kinase family protein | 506.1 | Up |
| Sb01g039436.1 | Heat shock cognate 70 kDa protein 2 (HSC70-2) | 489.0 | Up |
| Sb07g000520.1 | CYP71A25 | 452.0 | Up |
| Sb06g004280.1 | Transketolase, putative | 449.2 | Up |
| Sb02g026070.1 | Unknown protein | 441.9 | Up |
| Sb06g001970.1 | APX3 (ASCORBATE PEROXIDASE 3) | 433.7 | Up |
| Sb09g018420.1 | RAB18 (RESPONSIVE TO ABA 18) | 428.4 | Up |
| Sb04g027330.1 | 23.5 kDa mitochondrial small heat shock protein (HSP23.5-M) | 421.7 | Up |
| Sb09g027030.1 | Basic helix-loop-helix (bHLH) family protein | 417.0 | Up |
| Sb03g001130.1 | AAA-type ATPase family protein | 414.0 | Up |
| Sb07g003040.1 | Tyrosine decarboxylase, putative | 410.9 | Up |
| Sb03g043410.1 | Unknown protein | 402.9 | Up |
| Sb07g027140.1 | Unknown protein | 401.4 | Up |
| Sb02g009430.1 | UBX domain-containing protein | 386.7 | Up |
| Sb01g046490.1 | LEA protein | 379.2 | Up |
| Sb02g031940.1 | FMO1 (FLAVIN-DEPENDENT MONOOXYGENASE 1) | 365.8 | down |
| Sb08g001520.1 | No apical meristem (NAM) family protein | 343.9 | Up |
| Sb03g006890.1 | HSP18.2 (heat shock protein 18.2) | 343.6 | Up |
| Sb06g023160.1 | Trypsin and protease inhibitor family protein | 341.9 | Up |
| Sb10g007320.1 | OPR2 | 339.7 | Up |
| Sb01g040025.1 | EDM2 | 337.0 | Up |
| Sb05g003200.1 | Phosphatidylethanolamine binding | 335.7 | Up |
| Sb07g003010.1 | Tyrosine decarboxylase, putative | 335.6 | Up |
| Sb01g008350.1 | Glutamate binding | 332.5 | Up |
| Sb01g026780.1 | Unknown protein | 322.7 | Up |
| Sb04g031810.1 | Unknown protein | 320.5 | Up |
| Sb06g016240.1 | Nucleic acid binding | 318.6 | Up |
| Sb01g046350.1 | HSFA6B | 310.5 | Up |
| Sb01g009370.1 | EGY3 (ETHYLENE-DEPENDENT GRAVITROPISM-DEFICIENT AND YELLOW-GREEN-LIKE 3) | 296.4 | Up |
| Sb03g038160.1 | C4H (CINNAMATE-4-HYDROXYLASE) | 294.8 | Up |
| Sb02g034590.1 | Aconitate hydratase | 287.0 | Up |
| Sb05g027880.1 | RCA (RUBISCO ACTIVASE) | 285.7 | Up |
| Sb03g041980.1 | Pentatricopeptide (PPR) repeat-containing protein | 284.7 | Up |
| Sb08g005220.1 | Unknown protein | 272.7 | Up |
| Sb01g039470.1 | HSP70 (heat shock protein 70) | 271.7 | Up |
| Sb07g014620.1 | DNAJ heat shock protein, putative | 270.1 | Up |
| Sb09g028410.1 | DNAJ heat shock family protein | 268.3 | Up |
| Sb03g005090.1 | AtRLP7 (Receptor Like Protein 7) | 260.8 | Up |
| Sb03g012940.1 | SAG21 (SENESCENCE-ASSOCIATED GENE 21) | 259.2 | Up |
| Sb02g013190.1 | Unknown protein | 255.0 | Up |
| Sb07g021840.1 | Unknown protein | 250.7 | Up |
| Sb02g017220.2 | Unknown protein | 247.7 | Up |
| Sb10g009090.1 | 15.7 kDa class I-related small heat shock protein-like (HSP15.7-CI) | 246.2 | Up |
| Sb02g017220.1 | Metal ion binding | 243.7 | Up |
| Sb01g034800.1 | Nucleic acid binding | 242.5 | Up |
| Sb01g042680.1 | HSP70T-2 (HEAT-SHOCK PROTEIN 70 T-2) | 235.4 | Up |
| Sb02g030040.1 | UDP-glucosyl transferase family protein | 230.6 | Up |
| Sb10g000930.1 | LEA group 1 domain-containing protein | 230.2 | Up |
| Sb10g003700.1 | XERO1 (DEHYDRIN XERO 1) | 230.2 | Up |
| Sb01g000352.1 | ERF1 (ETHYLENE RESPONSE FACTOR 1) | 224.2 | Up |
Identification of genes responding only when drought and heat occur simultaneously
Interestingly, a number of genes, 896 and 1147, were significantly up or down regulated, respectively, only in response to combined heat and drought stress (Figure 1). Again, the most enriched promoter motif in the 896 up-regulated genes was an ABRE-like motif, and there was no evidence of HSE-like motifs (Figure 6a). Genes uniquely elevated by combined stress, as exemplified by Sb05g017950 (Figure 4c) include a number of ion transporters. For example, the potassium transporters AKT1, AKT2/3 and HAK5 were all (up to 8-fold) and specifically up-regulated. As mentioned earlier there is also specificity in LEA and HSP expression with, in this case, 2 HSP and 3 LEA genes being uniquely up-regulated following combined stress. A number of genes encoding signalling proteins and transcription factors were up or down-regulated only by combined stress. These include ATAF1, MYB78 and WOX1 amongst others (Additional file 1: Table S9). Genes uniquely down-regulated by combined stress include the transcription factors MYB61 and BZIP61. In addition, there is specificity of calcium-binding proteins with the genes encoding OST1, TCH2, CPK16 and CIPK9 specifically being up-regulated following combined stress. Genes encoding the MAP kinases MKK9 and MPK20 are also uniquely expressed. Ontological analysis of the transcripts uniquely up-regulated by combined stress (Figure 6b and c and Additional file 1: Table S10) showed an enrichment of genes involved in polyamine metabolism and in particular spermidine biosynthesis such as spermidine synthase (SPDS1) and S-adenosylmethionine decarboxylase (SAMDC). The transcriptomic response of Sorghum to combined heat and drought stress therefore appears unique to that when each stress is imposed individually.
Figure 6.
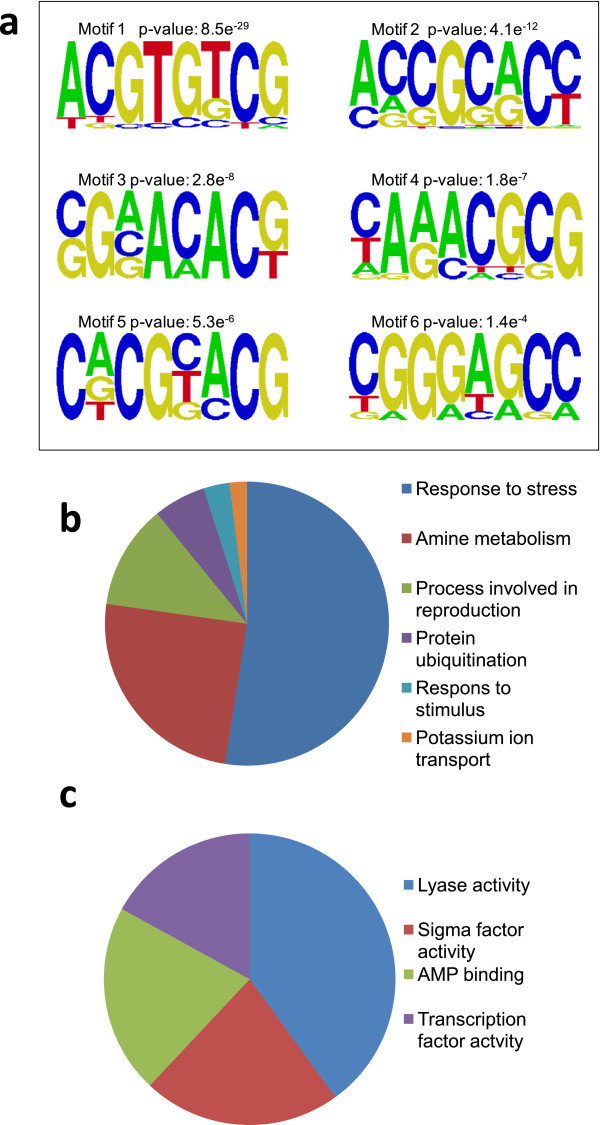
Analysis of genes up-regulated only by combined heat and drought treatment. (a) Most significantly enriched sequences found in promoters of genes uniquely upregulated in response to combined heat and drought. Figure shows top 6 statistically significant consensus sequences generating using AMADEUS and enoLOGOS. Probability values representing significance of enrichment (calculated as described in Methods) are shown for each motif. (b & c) Ontological analysis showing enriched biological process (b) and molecular function (c) GO terms p < 0.05. Ontological terms were summarized using the REVIGO tool. Detailed breakdowns of the ontologies are available in Additional file 1: Table S10.
Discussion
Transcriptomic analyses of plant responses to stress are an effective way in which genes, pathways and processes responsible for plant stress tolerance can be identified. Here, we examined the effect of combined heat and drought stress on the Sorghum transcriptome, using custom designed microarrays containing 28585 individual gene probes. These probes correspond to the latest genome annotation at the time of printing therefore this is the largest microarray study carried out on Sorghum to date.
In response to drought stress we found that expression of ~3.5% of the Sorghum genome was changed by > 2-fold. The genes identified were mostly in known drought-tolerance pathways and there was enrichment of expected promoter motifs. The ABA-responsive element (ABRE) for example, is a known promoter in genes induced by dehydration, salinity and ABA [28]. The number of gene changes identified here is similar to previous studies in which expression of ~4% of the Sorghum genome was changed when subjected to osmotic stress by PEG treatment [21, 22]. Out of our total 1190 drought-induced gene changes 32% were shared with the PEG induced gene changes identified by Dugas et al. using a next generation sequencing transcriptomic approach. There is a significant overlap between the studies although it is clear that the slightly different treatments i.e. a sharp osmotic shock compared to the gradual loss of water have also resulted in the induction of some different response pathways and genes. For example, there is an enrichment of genes associated with response to reactive oxygen species in the transcripts only changed by the PEG treatment whereas there is an enrichment of genes associated with wax biosynthesis in the transcripts only changed by the water withdrawal treatment imposed here. Large quantities of reactive oxygen species (ROI) are generated as an early response to stress [29] therefore reducing ROI levels could be seen as a short term solution to drought. The induction of wax biosynthesis genes on the other hand could result in increased epiculticuar wax which would result in reduced water loss and therefore could be seen as a longer term strategy for survival.
Heat shock resulted in >2-fold changes in expression of 15% of the Sorghum genome. This relatively high level of gene expression changes is not surprising given the acute, severe nature of the heat shock and is comparable to studies in other species [12, 13]. The differentially expressed genes were mostly associated with the heat shock response and again resulted in the expected promoter motifs including CAMTA-like and heat shock elements (HSE) [30].
The combined stress response resulted in 5779 gene changes of which a large proportion were in common with the heat-regulated gene set (60%) and around 13% were shared with the response to drought (Figure 1). Such overlap is understandable: whilst there will be unique challenges presented to the plant when stresses are combined, there is still the need to attend to fundamental issues arising from each stress individually. Reactive oxygen intermediate (ROI) detoxification is required following a number of different stress types [31]. This is displayed here by the enrichment of the GO category ‘response to reactive oxygen species’ in all of the stress types studied (Additional file 1: Tables S2, S5 and S8). Many of the other GO categories enriched by combined stress share elements of those enriched following the other stress types. For example, protein folding is enriched in both the heat and combined stress response and regulation of photosynthesis and water channel activity is also enriched in the drought stress response (Figure 2). It is understandable that similar stresses would require similar downstream processes. This induction of similar pathways can produce cross-tolerance whereby previous exposure to one stress type can provide protection from another [32]. The fact that more genes were found to be in common with the heat stress response is likely to be due the acute nature of the heat shock treatment which results in more synchronised induction of genes.
Despite this large overlap however, there is obvious specificity of gene expression in that there are clear sets of genes which are only changed by the combined heat and drought treatment. These specific changes suggest that, similar to what has been found for Arabidopsis and tobacco, Sorghum has a unique transcriptional response to the combined heat and drought stress [16, 17]. Sorghum must therefore be able to perceive this combined stress as a unique environmental condition and reacts to it accordingly. Drought is likely perceived by proteins at the plasma membrane. For example, HK1, a transmembrane histidine kinase is thought to be the first component in relaying an osmotic stress signal to the nucleus [33]. Heat stress is sensed by a complex network of sensors which include plasma membrane proteins and components of the unfolded protein response [34]. The sensing of combined heat and drought would require crosstalk between these sensor systems, or more unlikely, a totally separate sensor for this purpose.
Specificity may also arise at the level of signal transduction. For example, mitogen-activated protein kinase (MAPK) cascades are important signal transducers. These are known to be activated by a number of abiotic stresses and can introduce specificity into a system [35]. Interestingly, there are a number of genes encoding MAP kinases, such as MPK20, which are only elevated by combined stress. Additionally, a number of genes encoding calcium-interacting proteins are specifically elevated such as CPK16. Calcium is an important second messenger and it is thought that unique calcium signatures can result in the expression of unique sets of genes [36]. Calcium binding proteins control these responses and different isoforms have been found to be induced by different plant stresses [10, 37]. It is therefore possible that the CDPK isoforms elevated here are involved specifically in transducing the combined stress signal.
Once in the nucleus unique transcription factors may be responsible for switching on particular sets of genes. A number of transcription factors are only elevated by combined heat and drought (Figure 2). An example transcription factor is ATAF1 which belongs to the NAC family of transcription factors. This has been found to be induced by a number of stresses in Arabidopsis including drought, salinity and wounding [38] therefore it is possible that this has evolved an alternative role in the combined stress response in Sorghum. The HSFC1 transcription factor which is known to induce HSPs in Arabidopsis is also elevated along with some unique HSPs. Other uniquely elevated chaperones include some LEAs which are hydrophilic proteins involved in stress protection. It is possible that these known chaperone molecules contain different motifs which allow recognition and binding of a specific set of molecular targets (Olvera-Carrillo, 2011) and has similarly been shown to be the case in the combined stress response of Arabidopsis [17]. It must be borne in mind however, that these experiments were carried out at one specific time point therefore a detailed time course is required to be able to draw more detailed conclusions.
Amongst other downstream genes regulated by combined stress were those encoding enzymes which are involved in the biosynthesis of polyamines and in particular spermidine such as SAMDC and SPDS1. Polyamines have been implicated in tolerance to multiple stresses including high and low temperature, oxidative stress and salinity [39, 40]. They have been suggested to play a role in ROI scavenging and membrane protection [41]. Perhaps the combined heat and drought treatment results in a higher levels of ROI production than heat and drought treatment individually and therefore higher polyamine levels are required to counteract this. Interestingly, one of the uniquely elevated transcription factors, WOX1, has been shown to physically interact with SAMDC suggesting a possible way in which the activity of this enzyme is regulated by combined stress [42].
Conclusions
It is clear that there is a degree of plasticity in the Sorghum response to abiotic stress, with evidence for both cross-talk and specificity. This is similar to previous findings in Arabidopsis and tobacco suggesting conservation of mechanisms across species. There are however some elements of the combined stress response which appear unique to Sorghum such as a potential role for polyamine biosynthesis and specific transcription factors and signalling molecules. A functional characterization of these identified genes and pathways is required as they could be used as possible targets for the enhancement of stress tolerance either by marker assisted selection or transgenics. Given the predicted increase in prevalence of drought and heat stress on agricultural land there is a further need to analyse the effect of combined stress on crop species.
Methods
Plant growth conditions and stress treatments
Seeds of Sorghum (Sorghum bicolor L. Moench.) R16 variety were imbibed overnight in water and surface-sown singly onto soaked 42 mm Jiffy peat pellets (LBS horticulture Ltd, Lancashire, UK). Seedlings were grown in a controlled growth chamber at 28°C day, 23°C night, 12 h photoperiod and set to 0% humidity. Plants were subjected either to control (no treatment), heat, drought or combined heat and drought conditions (6 plants per treatment). These stress assays were developed specifically for Sorghum and are detailed below. Drought stress was applied to the “drought” and “heat and drought” plants by withholding water from 14 days after sowing. At this stage the seedlings had 3 leaves. The remaining plants were well watered. The first visual symptoms of drought stress appeared in the form of leaf curling and slight wilting at 4 days following water withdrawal. This is similar to previous studies in which plants grown under similar conditions showed signs of water stress including a reduction in CO2 assimilation and reduced transpiration rate after 4 days of withholding water [43]. Measurements of the ratio of variable fluorescence (Fv) to maximal fluorescence (Fm) of plant photosystems can be used as a proxy for the stress status of plants because a reduction in Fv/Fm indicates photoinibition and therefore that a plant is actually experiencing stress [23, 24]. Therefore in order to quantify when drought stress was first starting to have a physiological effect, the Fv/Fm of all of the plants was measured daily using a FluorCam 700mf (Photon Systems instruments, Brno, Czech Republic) on the Fo, Fm and Kautsky effect setting. All plants were dark acclimated for 30 mins prior to measurements. At the timepoint at which the Fv/Fm of the un-watered plants was first significantly lower (error bars showing standard error are no longer overlapping) than that of the watered plants, they were subject to either heat shock by incubation in the dark (to ensure equal levels of light) at 50°C for 3 h (heat and combined treatment) or 28°C for 3 h (control and drought treatment). The youngest 3 leaves were sampled and tissue was pooled for each treatment set. Experiments were carried out in triplicate to give 3 biological replicates. All treatments were carried out at the same time of day for each biological replicate to reduce variation due to circadian/diurnal factors. Tissues samples were harvested into liquid nitrogen and stored at −80°C.
Microarray design
Custom expression microarrays (4X44K format) for Sorghum were designed and submitted for manufacturing using the Agilent Technologies eArray web-based application (https://earray.chem.agilent.com/earray/). Briefly, Sbicolor release 79 coding sequences were downloaded from http://www.plantgdb.org/SbGDB/, based upon these 29289 CDS sequences, 28585 microarray probes (60 mer oligonucleotides) were designed. In addition, for 10 of the longest CDS, 10 tiling probes were also designed. These probes were randomly laid out onto the 4X44K microarray design format by eArray, along with default Agilent control probes (Agilent Technologies UK Ltd., Wokingham, Berkshire, UK), and 10 additional replicate probes of 100 randomly selected Sorghum CDSs.
cRNA synthesis and labelling
All products were obtained from Agilent Technologies UK Ltd. (Wokingham, Berkshire, UK) and used according to manufacturer’s protocol unless stated otherwise. Total RNA was isolated using the RNeasy Mini Kit (Qiagen Sussex, UK). The integrity of the RNA was confirmed with analysis by the Agilent 2100 bioanalyzer (Palo Alto, CA) and the Agilent RNA 6000 Nano Kit (Cat no # 5067–1511). RNA (1 μg) was added to 1.2 μL of T7 promoter primer and 5 μL of a “spike-in” control and made to a total volume of 11.5 μL with nuclease free water. The primer and template was denatured at 65°C for 10 mins. The One-Color Low RNA Input Linear Amplification Kit PLUS was used for the synthesis of cRNA as follows: 5 × First Strand Buffer, DTT (to 10 mM), dNTP mix (to 0.5 mM), Moloney murine leukemia virus (MMLV) reverse transcriptase (1 μL stock to 20 μL reaction) and RNaseOut (0.5 μL of stock to 20 μL reaction) were added to the denatured template. The cRNA was synthesized by incubation at 40°C for 2 h and then denaturation at 65°C for 15 minutes. Transcription Buffer (×4), DTT (to 7.5 mM), NTP mix (8 μL stock to 80 μL reaction), PEG (to 4%), RNaseOUT (0.5 μL to 80 μL), inorganic pyrophosphate (0.6 μL to 80 μL reaction), T7 RNA Polymerase (0.8 μL to 80 μL reaction) and Cyanine 3-CTP (2.4 μL to 80 μL reaction) were added. The synthesis of the cRNA was performed by incubation at 40°C for 2 h. The labelled cRNA was purified using the RNeasy Mini Kit (Qiagen, Sussex, UK) according to the manufacturer’s protocol and quantified using a UV–VIS Spectrophotometer.
Hybridization and washing of microarray slides
The Agilent Hybridization Kit (catalog no. 5188–5242) was used: 2 μg of the labelled sample RNA was added to 10 x blocking Agent, 25 × fragmentation buffer and nuclease free water to total volume of 55 μL. The RNA was fragmented by incubation at 60°C for 30 min. Fragmentation was stopped by the addition of 55 μL 2 × GE Hybridization Buffer HI-RPM. The hybridization was performed for 17 h at 65°C and 10 rpm. Slides were them washed for 1 min in Wash Solution 1; 1 min in Wash Solution 2 (prewarmed to 37°C); and 20 s in acetonitrile. Slides were incubated for 30 s in Agilent Stabilization and Drying Solution (catalog no. 5185–5979). The slides were scanned with the Agilent G2505C Microarray Scanner System (61 × 21.6 mm scan region, 5 μm single pass scanning mode, green dye channel). The accession number for the data series is GSE48205 (data is embargoed for 12 months, but can be accessed from: http://www.ncbi.nlm.nih.gov/geo/query/acc.cgi?token=rxmbxmaiogewefw&acc=GSE48205).
Bioinformatic analysis
The Agilent Feature Extraction Software (v10.7) was used to extract data from scanned microarray images. The extracted data was analysed using GeneSpring GX 11 (Agilent Technologies, CA, USA). Agilent standard scenario normalizations for FE1-color arrays were applied to the data set. Controls, spots of poor quality and gene probes which were not present in all 3 reps in either the control or treatment samples were excluded from the analysis. This yielded approximately 21000 probes for each control vs. treatment comparison. From these selected genes those with a fold-change of >2 in all 3 reps of each treatment were selected. Gene Ontology term enrichment was determined using agriGO (http://bioinfo.cau.edu.cn/agriGO/) and redundant GO terms were removed using REVIGO (http://revigo.irb.hr/) (medium similarity). Promoter motif analysis was performed using the AMADEUS program (http://acgt.cs.tau.ac.il/amadeus/). Parameters selected for AMADEUS included: promoter length - 1000 bp upstream to the transcription start site; motif length- 8 bp; motif reference database- TRANSFAC. A boot-strapping procedure was performed, which re-runs the entire algorithm on randomly selected gene sets, each with the same size as the real target set, and the lowest p-value from each run was recorded. A normal distribution was then fitted to these p-values and used to correct the p-values of the motifs discovered in the real target set. The corrected score is an estimate of the empirical probability that a motif with the same p-value (or lower) could be found in randomly selected gene sets. Fifty cycles of randomizations to obtain fixed p-values were used. The matrices obtained by AMADEUS for each motif were further processed by enoLOGOS (http://biodev.hgen.pitt.edu/cgi-bin/enologos/enologos.cgi), a web-based tool that generates sequence logos.
Realtime PCR
Quantitative Real Time PCR was used to validate the gene expression data obtained by the microarrays as described previously [44]. cDNA was synthesised from Sorghum RNA using a high capacity cDNA reverse transcription kit (Applied Biosystems, California, USA). qPCR was carried out using an AB 7300 real time PCR system (Applied Biosystems California USA) and Go Taq qPCR master mix (Promega, Wisconsin,USA). Primers were designed using Primer3 (http://frodo.wi.mit.edu/) and synthesized by Invitrogen. Sequences used: Sb03g032380.1 Forward: 5′-TCGGTACTGCTGCAAACAAG-3′ and Sb03g032380.1 Reverse: 3′-CCGTGTTCATCACCTTCTCC-5′; Sb01g021320.1 Forward: 5′-GCGCGTCCGCTATATAATGT-3′ and Sb01g021320.1 Reverse: 3′-CTTGCTGCTGTTGCTGTCTC5′; Sb02g038425.1 Forward: 5′-TGAGGAAGCTTGGGGTAATG-3′ and Sb02g038425.1 Reverse: 3′-CCCATAAGGACGCCAAAGTA-5′; Sb02g003260.1 Forward: 5′-GATGGCTCGATTTCCTTGTC-3′ and Sb02g003260.1 Reverse: 3′-GCCGATGATCTCCTTCTTCA-5′; Sb05g008020.1 Forward: 5′-AAGCGAGCAGTAAACCGTGT-3′ and Sb05g008020.1 Reverse: 3′- GTGATGAGAGGAGGGGAACA-5′; Sb05g017950.1 Forward: 5′- GGCAGCACTAGCAACAACAA-3′ and Sb05g017950.1 Reverse: 3′-GGAAAGTAGCTTCCCCTTGG-5′. These genes were chosen as exemplar genes based on the fact that the microarray data showed that they are highly up-regulated (>2 fold in all 3 reps) following only one of the treatment types i.e. heat, drought or combined stress. Sb03g038910.1 was identified from the microarray as unchanging following each treatment and was therefore used as an endogenous control with the following oligos: Sb03g038910.1 Forward: 5′-AGGTCCTGCTCCAGATCCTC-3′ and Rev: 3′-AAAGGAGAGGGTAGCGGAAG-5′.
Availability of supporting data
The data set(s) supporting the results of this article are included in the article and are available in the GEO repository, (http://www.ncbi.nlm.nih.gov/geo/query/acc.cgi?token=rxmbxmaiogewefw∾GSE48205).
Electronic supplementary material
Additional file 1: Figure S1: The Fv/Fm (variable fluorescence/maximal fluorescence of Photosystem II) measured daily following water withdrawal. Table S1 - Genes differentially expressed in response to drought. Table S2 - Gene Ontology (GO) terms enriched (p < 0.05) in the genes differentially expressed in response to drought. Table S3 - Genes differentially expressed in response to drought only. Table S4 - Genes differentially expressed in response to heat. Table S5 - Gene Ontology (GO) terms enriched (p < 0.05) in the genes differentially expressed in response to heat. Table S6 - Genes differentially expressed in response to heat only. Table S7 - Genes differentially expressed in response to combined heat and drought. Table S8 - Gene Ontology (GO) terms enriched (p < 0.05) in the genes differentially expressed in response to combined heat and drought. Table S9 - Genes differentially expressed in response to combined heat and drought only. Table S10 - Gene Ontology (GO) terms enriched (p < 0.05) in the genes differentially expressed in response to combined heat and drought only. Table S11 - Genes differentially expressed in response to all 3 stress types. (XLSX 1 MB)
Acknowledgements
We would like to thank Yaron Orenstein from the School of Computer Science, Faculty of Exact Sciences, Tel Aviv University, for assistance in cis-element analysis with the AMADEUS program. We would also like to thank Tom Hash and Santosh Despande from ICRISAT, Petancheru, India for providing the seed material and the BBSRC for their CASE studentship.
Footnotes
Competing interests
The authors declare that they have no competing interests.
Authors’ contributions
SJ participated in the design of the experiments, carried out the microarray processing and analysis and wrote the manuscript. AF and HF carried out the promoter motif analysis. FL contributed to the microarray processing. ARS participated in the design of the experiments. MRK participated in the design of the experiments, proof reading of the manuscript and in the overseeing of the work. All authors read and approved the final manuscript.
Contributor Information
Stephanie M Johnson, Email: Stephanie.johnson@durham.ac.uk.
Fei-Ling Lim, Email: Fei-ling.lim@unilever.com.
Aliza Finkler, Email: alizaf@post.tau.ac.il.
Hillel Fromm, Email: hillelf@post.tau.ac.il.
Antoni R Slabas, Email: a.r.slabas@durham.ac.uk.
Marc R Knight, Email: m.r.knight@durham.ac.uk.
References
- 1.Wang WX, Vinocur B, Altman A. Plant responses to drought, salinity and extreme temperatures: towards genetic engineering for stress tolerance. Planta. 2003;218(1):1–14. doi: 10.1007/s00425-003-1105-5. [DOI] [PubMed] [Google Scholar]
- 2.Boyer JS. Plant productivity and environment. Science. 1982;218(4571):443–448. doi: 10.1126/science.218.4571.443. [DOI] [PubMed] [Google Scholar]
- 3.Mittler R. Abiotic stress, the field environment and stress combination. Trends Plant Sci. 2006;11(1):15–19. doi: 10.1016/j.tplants.2005.11.002. [DOI] [PubMed] [Google Scholar]
- 4.Craufurd PQ, Flower DJ, Peacock JM. Effect of heat and drought stress on Sorghum (Sorghum-bicolor). 1.Panicle development and leaf appearance. Exp Agric. 1993;29(1):61–76. doi: 10.1017/S001447970002041X. [DOI] [Google Scholar]
- 5.Savin R, Nicolas ME. Effects of short periods of drought and high temperature on grain growth and starch accumulation of two malting barley cultivars. Aust J Plant Physiol. 1996;23(2):201–210. doi: 10.1071/PP9960201. [DOI] [Google Scholar]
- 6.Machado S, Paulsen GM. Combined effects of drought and high temperature on water relations of wheat and sorghum. Plant Soil. 2001;233(2):179–187. doi: 10.1023/A:1010346601643. [DOI] [Google Scholar]
- 7.Ahuja I, De Vos RCH, Bones AM, Hall RD. Plant molecular stress responses face climate change. Trends Plant Sci. 2010;15(12):664–674. doi: 10.1016/j.tplants.2010.08.002. [DOI] [PubMed] [Google Scholar]
- 8.Bray EA. Plant responses to water deficit. Trends Plant Sci. 1997;2(2):48–54. doi: 10.1016/S1360-1385(97)82562-9. [DOI] [Google Scholar]
- 9.Liu Q, Kasuga M, Sakuma Y, Abe H, Miura S, Yamaguchi-Shinozaki K, Shinozaki K. Two transcription factors, DREB1 and DREB2, with an EREBP/AP2 DNA binding domain separate two cellular signal transduction pathways in drought- and low-temperature-responsive gene expression, respectively, in Arabidopsis. Plant Cell. 1998;10(8):1391–1406. doi: 10.1105/tpc.10.8.1391. [DOI] [PMC free article] [PubMed] [Google Scholar]
- 10.Knight H, Knight MR. Abiotic stress signalling pathways: specificity and cross-talk. Trends Plant Sci. 2001;6(6):262–267. doi: 10.1016/S1360-1385(01)01946-X. [DOI] [PubMed] [Google Scholar]
- 11.Chen WQ, Provart NJ, Glazebrook J, Katagiri F, Chang HS, Eulgem T, Mauch F, Luan S, Zou GZ, Whitham SA, Budworth PR, Tao Y, Xie ZY, Chen X, Lam S, Kreps JA, Harper JF, Si-Ammour A, Mauch-Mani B, Heinlein M, Kobayashi K, Hohn T, Dangl JL, Wang X, Zhu T. Expression profile matrix of Arabidopsis transcription factor genes suggests their putative functions in response to environmental stresses. Plant Cell. 2002;14(3):559–574. doi: 10.1105/tpc.010410. [DOI] [PMC free article] [PubMed] [Google Scholar]
- 12.Qin D, Wu H, Peng H, Yao Y, Ni Z, Li Z, Zhou C, Sun Q. Heat stress-responsive transcriptome analysis in heat susceptible and tolerant wheat (Triticum aestivum L.) by using Wheat Genome Array. BMC Genomics. 2008;9:432. doi: 10.1186/1471-2164-9-432. [DOI] [PMC free article] [PubMed] [Google Scholar]
- 13.Zhang Y, Mian MAR, Chekhovskiy K, So S, Kupfer D, Lai H, Roe BA. Differential gene expression in Festuca under heat stress conditions. J Exp Bot. 2005;56(413):897–907. doi: 10.1093/jxb/eri082. [DOI] [PubMed] [Google Scholar]
- 14.Kreps JA, Wu YJ, Chang HS, Zhu T, Wang X, Harper JF. Transcriptome changes for Arabidopsis in response to salt, osmotic, and cold stress. Plant Physiol. 2002;130(4):2129–2141. doi: 10.1104/pp.008532. [DOI] [PMC free article] [PubMed] [Google Scholar]
- 15.Wang D, Pan Y, Zhao X, Zhu L, Fu B, Li Z. Genome-wide temporal-spatial gene expression profiling of drought responsiveness in rice. BMC Genomics. 2011;12:149. doi: 10.1186/1471-2164-12-149. [DOI] [PMC free article] [PubMed] [Google Scholar]
- 16.Rizhsky L, Liang HJ, Mittler R. The combined effect of drought stress and heat shock on gene expression in tobacco. Plant Physiol. 2002;130(3):1143–1151. doi: 10.1104/pp.006858. [DOI] [PMC free article] [PubMed] [Google Scholar]
- 17.Rizhsky L, Liang HJ, Shuman J, Shulaev V, Davletova S, Mittler R. When Defense pathways collide. The response of Arabidopsis to a combination of drought and heat stress. Plant Physiol. 2004;134(4):1683–1696. doi: 10.1104/pp.103.033431. [DOI] [PMC free article] [PubMed] [Google Scholar]
- 18.Rampino P, Mita G, Fasano P, Borrelli GM, Aprile A, Dalessandro G, De Bellis L, Perrotta C. Novel durum wheat genes up-regulated in response to a combination of heat and drought stress. Plant Physiol Biochem. 2012;56:72–78. doi: 10.1016/j.plaphy.2012.04.006. [DOI] [PubMed] [Google Scholar]
- 19.Rosenow DT, Quisenberry JE, Wendt CW, Clark LE. Drought tolerant Sorghum and cotton germplasm. Agric Water Manag. 1983;7(1–3):207–222. doi: 10.1016/0378-3774(83)90084-7. [DOI] [Google Scholar]
- 20.Paterson AH, Bowers JE, Bruggmann R, Dubchak I, Grimwood J, Gundlach H, Haberer G, Hellsten U, Mitros T, Poliakov A, Schmutz J, Spannagl M, Tang HB, Wang XY, Wicker T, Bharti AK, Chapman J, Feltus FA, Gowik U, Grigoriev IV, Lyons E, Maher CA, Martis M, Narechania A, Otillar RP, Penning BW, Salamov AA, Wang Y, Zhang LF, Carpita NC, et al. The Sorghum bicolor genome and the diversification of grasses. Nature. 2009;457(7229):551–556. doi: 10.1038/nature07723. [DOI] [PubMed] [Google Scholar]
- 21.Dugas DV, Monaco MK, Olsen A, Klein RR, Kumari S, Ware D, Klein PE. Functional annotation of the transcriptome of Sorghum bicolor in response to osmotic stress and abscisic acid. BMC Genomics. 2011;12:514. doi: 10.1186/1471-2164-12-514. [DOI] [PMC free article] [PubMed] [Google Scholar]
- 22.Buchanan CD, Lim SY, Salzman RA, Kagiampakis L, Morishige DT, Weers BD, Klein RR, Pratt LH, Cordonnier-Pratt MM, Klein PE, Mullet JE. Sorghum bicolor’s transcriptome response to dehydration, high salinity and ABA. Plant Mol Biol. 2005;58(5):699–720. doi: 10.1007/s11103-005-7876-2. [DOI] [PubMed] [Google Scholar]
- 23.Maxwell K, Johnson GN. Chlorophyll fluorescence - a practical guide. J Exp Bot. 2000;51(345):659–668. doi: 10.1093/jexbot/51.345.659. [DOI] [PubMed] [Google Scholar]
- 24.Oxborough K. Imaging of chlorophyll a fluorescence: theoretical and practical aspects of an emerging technique for the monitoring of photosynthetic performance. J Exp Bot. 2004;55(400):1195–1205. doi: 10.1093/jxb/erh145. [DOI] [PubMed] [Google Scholar]
- 25.Yoshiba Y, Kiyosue T, Nakashima K, YamaguchiShinozaki K, Shinozaki K. Regulation of levels of proline as an osmolyte in plants under water stress. Plant Cell Physiol. 1997;38(10):1095–1102. doi: 10.1093/oxfordjournals.pcp.a029093. [DOI] [PubMed] [Google Scholar]
- 26.Rubio F, Gassmann W, Schroeder JI. Sodium-driven potassium uptake by the plant potassium transporter HKT1 and mutations conferring salt tolerance. Science. 1995;270(5242):1660–1663. doi: 10.1126/science.270.5242.1660. [DOI] [PubMed] [Google Scholar]
- 27.Huang D, Wu W, Abrams SR, Cutler AJ. The relationship of drought-related gene expression in Arabidopsis thaliana to hormonal and environmental factors. J Exp Bot. 2008;59(11):2991–3007. doi: 10.1093/jxb/ern155. [DOI] [PMC free article] [PubMed] [Google Scholar]
- 28.Narusaka Y, Nakashima K, Shinwari ZK, Sakuma Y, Furihata T, Abe H, Narusaka M, Shinozaki K, Yamaguchi-Shinozaki K. Interaction between two cis-acting elements, ABRE and DRE, in ABA-dependent expression of Arabidopsis rd29A gene in response to dehydration and high-salinity stresses. Plant J. 2003;34(2):137–148. doi: 10.1046/j.1365-313X.2003.01708.x. [DOI] [PubMed] [Google Scholar]
- 29.Beffagna N, Buffoli B, Busi C. Modulation of reactive oxygen species production during osmotic stress in Arabidopsis thaliana cultured cells: Involvement of the plasma membrane Ca2 + −ATPase and H + −ATPase. Plant Cell Physiol. 2005;46(8):1326–1339. doi: 10.1093/pcp/pci142. [DOI] [PubMed] [Google Scholar]
- 30.Akerfelt M, Morimoto RI, Sistonen L. Heat shock factors: integrators of cell stress, development and lifespan. Nat Rev Mol Cell Biol. 2010;11(8):545–555. doi: 10.1038/nrm2938. [DOI] [PMC free article] [PubMed] [Google Scholar]
- 31.Gill SS, Tuteja N. Reactive oxygen species and antioxidant machinery in abiotic stress tolerance in crop plants. Plant Physiol Biochem. 2010;48(12):909–930. doi: 10.1016/j.plaphy.2010.08.016. [DOI] [PubMed] [Google Scholar]
- 32.Pastori GM, Foyer CH. Common components, networks, and pathways of cross-tolerance to stress. The central role of “redox” and abscisic acid-mediated controls. Plant Physiol. 2002;129(2):460–468. doi: 10.1104/pp.011021. [DOI] [PMC free article] [PubMed] [Google Scholar]
- 33.Urao T, Yakubov B, Satoh R, Yamaguchi-Shinozaki K, Seki M, Hirayama T, Shinozaki K. A transmembrane hybrid-type histidine kinase in arabidopsis functions as an osmosensor. Plant Cell. 1999;11(9):1743–1754. doi: 10.1105/tpc.11.9.1743. [DOI] [PMC free article] [PubMed] [Google Scholar]
- 34.Mittler R, Finka A, Goloubinoff P. How do plants feel the heat? Trends Biochem Sci. 2012;37(3):118–125. doi: 10.1016/j.tibs.2011.11.007. [DOI] [PubMed] [Google Scholar]
- 35.Ligterink W, Hirt H. Mitogen-activated protein (MAP) kinase pathways in plants: Versatile signaling tools. Int Rev Cytol Surv Cell Biol. 2001;201:209–275. doi: 10.1016/s0074-7696(01)01004-x. [DOI] [PubMed] [Google Scholar]
- 36.Whalley HJ, Knight MR. Calcium signatures are decoded by plants to give specific gene responses. New Phytol. 2013;197(3):690–693. doi: 10.1111/nph.12087. [DOI] [PubMed] [Google Scholar]
- 37.Heo WD, Lee SH, Kim MC, Kim JC, Chung WS, Chun HJ, Lee KJ, Park CY, Park HC, Choi JY, Cho MJ. Involvement of specific calmodulin isoforms in salicylic acid-independent activation of plant disease resistance responses. Proc Natl Acad Sci U S A. 1999;96(2):766–771. doi: 10.1073/pnas.96.2.766. [DOI] [PMC free article] [PubMed] [Google Scholar]
- 38.Wu Y, Deng Z, Lai J, Zhang Y, Yang C, Yin B, Zhao Q, Zhang L, Li Y, Yang C, Xie Q. Dual function of Arabidopsis ATAF1 in abiotic and biotic stress responses. Cell Res. 2009;19(11):1279–1290. doi: 10.1038/cr.2009.108. [DOI] [PubMed] [Google Scholar]
- 39.Kasukabe Y, He LX, Nada K, Misawa S, Ihara I, Tachibana S. Overexpression of spermidine synthase enhances tolerance to multiple environmental stresses and up-regulates the expression of various stress regulated genes in transgenic Arabidopsis thaliana. Plant Cell Physiol. 2004;45(6):712–722. doi: 10.1093/pcp/pch083. [DOI] [PubMed] [Google Scholar]
- 40.Kusano T, Berberich T, Tateda C, Takahashi Y. Polyamines: essential factors for growth and survival. Planta. 2008;228(3):367–381. doi: 10.1007/s00425-008-0772-7. [DOI] [PubMed] [Google Scholar]
- 41.Groppa MD, Tomaro ML, Benavides MP. Polyamines as protectors against cadmium or copper-induced oxidative damage in sunflower leaf discs. Plant Sci. 2001;161(3):481–488. [Google Scholar]
- 42.Zhang Y, Wu R, Qin G, Chen Z, Gu H, Qu L-J. Over-expression of WOX1 leads to defects in meristem development and polyamine homeostasis in Arabidopsis. J Integr Plant Biol. 2011;53(6):493–506. doi: 10.1111/j.1744-7909.2011.01054.x. [DOI] [PubMed] [Google Scholar]
- 43.Wood AJ, Goldsbrough PB. Characterization and expression of dehydrins in water-stressed Sorghum bicolor. Physiol Plant. 1997;99(1):144–152. [Google Scholar]
- 44.Moffat CS, Ingle RA, Wathugala DL, Saunders NJ, Knight H, Knight MR. ERF5 and ERF6 play redundant roles as positive regulators of JA/Et-mediated defense against Botrytis cinerea in Arabidopsis. PLoS One. 2012;7:4. doi: 10.1371/journal.pone.0035995. [DOI] [PMC free article] [PubMed] [Google Scholar]
Associated Data
This section collects any data citations, data availability statements, or supplementary materials included in this article.
Supplementary Materials
Additional file 1: Figure S1: The Fv/Fm (variable fluorescence/maximal fluorescence of Photosystem II) measured daily following water withdrawal. Table S1 - Genes differentially expressed in response to drought. Table S2 - Gene Ontology (GO) terms enriched (p < 0.05) in the genes differentially expressed in response to drought. Table S3 - Genes differentially expressed in response to drought only. Table S4 - Genes differentially expressed in response to heat. Table S5 - Gene Ontology (GO) terms enriched (p < 0.05) in the genes differentially expressed in response to heat. Table S6 - Genes differentially expressed in response to heat only. Table S7 - Genes differentially expressed in response to combined heat and drought. Table S8 - Gene Ontology (GO) terms enriched (p < 0.05) in the genes differentially expressed in response to combined heat and drought. Table S9 - Genes differentially expressed in response to combined heat and drought only. Table S10 - Gene Ontology (GO) terms enriched (p < 0.05) in the genes differentially expressed in response to combined heat and drought only. Table S11 - Genes differentially expressed in response to all 3 stress types. (XLSX 1 MB)