

Abstract
Phase 2 clinical trials for tuberculosis (TB) treatment require reliable culture methods to determine presence or absence of Mycobacterium tuberculosis (Mtb) over the course of therapy, as these trials are based primarily on bacteriological endpoints. We evaluate which of 5 solid media is most reliable: Lowenstein-Jensen (LJ) egg-based medium and 4 Middlebrook agar media (nonselective 7H10 and 7H11 and selective 7H10 and 7H11). We analyze 393 specimens from 50 HIV-negative Ugandan adults with newly-diagnosed, pulmonary TB and high acid-fast bacillus smear grade. Specimens were collected every 2–4 weeks during the first 12 weeks of therapy. We compare the results for each culture to 2 composite reference standards—one that was deemed positive if any solid culture was positive for Mtb and another based on latent class analysis. Both reference standards established that the 2 selective Middlebrook media most reliably determine the presence or absence of Mtb (P<0.003), largely because of their lower contamination rates. We also showed that results on Middlebrook media were similar to each other, while LJ was most frequently discordant. Contaminated results appeared more likely to be truly negative than to harbor undetected Mtb.
Keywords: Middlebrook agar culture media, Lowenstein-Jensen culture medium, composite reference standard, latent class model
Introduction
Phase 2 clinical trials for tuberculosis (TB) treatment require reliable culture methods to determine presence or absence of Mycobacterium tuberculosis (Mtb) over the course of therapy, as phase 2 trial endpoints are based primarily on bacteriological status at baseline and multiple time points during treatment and follow-up. Historically, most trials have involved culture on solid media, particularly egg-base, locally made Lowenstein-Jensen media. In contemporary trials, sputum often is cultured on both solid and liquid media. Even with the advent of more sensitive liquid culture methods and other methods for detecting Mtb, solid media will continue to provide an important bridge to historical data linking solid media culture results during therapy to clinical outcomes such as treatment failure and relapse. Many solid media are available for mycobacterial culture and little systematic research has been done to compare the utility of different solid media to determine which is best for use in TB treatment trials.
We conducted a prospective cohort study comparing 5 solid media for recovery of Mtb during treatment of adults with pulmonary TB with standard chemotherapy: Lowenstein-Jensen (LJ) egg-base medium and 4 Middlebrook agar media (nonselective 7H10 and 7H11 and selective 7H10 and 7H11). Each of these has been used for both diagnostic and research purposes. Which one is the most reliable? By reliable we mean that the culture method (1) correctly indicates Mtb growth when it is present in a sputum specimen, (2) correctly indicates a lack of growth when Mtb is absent from a sputum specimen, within the medium’s limits of detection, and (3) produces evaluable results as often as possible by minimizing contamination and other sources of interference. Several culture methods reliably detect Mtb for diagnostic purposes, that is, prior to beginning TB therapy. There is, however, no consensus regarding which method is the most reliable for repeated assessments within a clinical trial as the bacillary burden diminishes in response to therapy. We need a benchmark or standard against which to compare candidate culture methods, with the intention to select the method that best conforms to the benchmark reference standard.
In this paper, we explore data-derived benchmarks, also known as composite reference standards [Alonzo 1999; Rutjes 2007 p 19–21], constructed from the combined results of the 5 separate culture methods. In synthesizing these discrete results, we must have a principled way to reconcile apparently contradictory patterns, wherein we can observe any mixture of positive, contaminated, and negative cultures from a single specimen. Consequently, we pose 2 methodological questions in connection with constructing reference standards to characterize the reliability of solid culture media: First, how do we resolve the situation in which results on different media contradict each other? Second, what information is conveyed by contaminated culture results?
To address our research questions, we considered 2 composite reference standards: one method that infers the presence of Mtb when any of the 5 solid media yields a positive culture result, and a second method using latent class analysis (LCA) to optimize information about the presence of Mtb from all 5 solid-media culture results. LCA has been used in other applications to TB [Hui 1980; Vacek 1985; Uebersax 1990; Law 1997], and several overviews are available [Formann 1996; Hui 1998; Rutjes 2007].
We examined how each of these constructs informs our understanding of the reliability of each culture method, provides clues about how to resolve apparently contradictory culture results, and yields statistical information about contaminated results, with further implications about the impact of contamination on statistical analysis of culture-based study outcomes. In a separate manuscript [Joloba 201x], we applied LCA and concluded that the 2 selective media were the most reliable, with 7H11S showing superior ability to detect Mtb when it is present. In this manuscript, we expand on our methods, provide additional motivation for our latent-class approach, and give a more complete justification of our conclusions.
Methods
Setting
From August 2009 to August 2010, 50 participants were enrolled in an observational study conducted at the National Tuberculosis Treatment Centre, Mulago Hospital, Kampala, Uganda. All participants were HIV-negative adults over 18 years old with newly diagnosed, cavitary, pulmonary TB with sputum that is positive for acid-fast bacilli (AFB). We selected participants with AFB smear grade 3+ or 4+ (≥1 AFB per high-power field [Kent PT, Kubica GP. Public Health Mycobacteriology: A Guide for the Level III Laboratory. Atlanta, Georgia: Centers for Disease Control; 1985]) because they have a high number of tubercle bacilli in the sputum at diagnosis, are the most frequent type of person enrolled in TB treatment trials, and are more likely to experience poor treatment outcomes. Participants received standard combination anti-TB treatment in accordance with CDC-ATS-IDSA guidelines [Blumberg 2003]; all available specimens were included in this analysis, even if a participant’s regimen was changed because of drug resistance or other factors. The study protocol was approved by research ethics committees at the Joint Clinical Research Centre, Case Western Reserve University, and the US Centers for Disease Control and Prevention, and by the Ugandan National Council for Science and Technology. All participants freely consented in writing.
Sputum collection
Clinic staff instructed patients in standard sputum collection procedures at baseline and follow-up visits. Two on-the-spot, deep-cough sputum specimens were collected prior to treatment. During TB treatment, 1 on-the-spot sputum specimen was obtained at weeks 2, 4, and 6, 2 specimens at week 8, and 1 specimen every 4 weeks thereafter through to the end of TB treatment (week 24 or 36). Each sputum specimen was cultured on 5 solid media (LJ, 7H10, 7H11, 7H10S, and 7H11S) and in liquid MGIT medium (BACTEC MGIT, Becton, Dickinson, and Company, Franklin Lakes NJ USA ). (See Joloba 201x for the details of sputum preparation and culturing.) For this analysis, we used data from specimens collected from baseline through week 12. Culture results on each medium were categorized as Mtb-positive, contaminated, or Mtb-negative. If a culture showed both Mtb growth and contamination, both were reported but it was categorized as Mtb-positive; cultures with contamination and no detectable Mtb growth were regarded as contaminated.
Data analysis
We characterized the pairwise discordance between solid media by the frequency with which the 2 media directly contradicted each other—that is, where 1 medium was Mtb-positive, and the other was Mtb-negative.
We constructed 2 reference standards by using information from all 5 solid media and compared the results of individual solid media to these reference standards. Our analytic tasks for each reference were to determine which solid medium agreed with this constructed reference most often, how to interpret discrepancies for specimens that yielded contradictory results, how to interpret contaminated cultures relative to the constructed standard, and whether the construct was ultimately credible.
We first constructed an intuitively appealing reference, called here the any-positive construct, which was positive if any of the 5 solid media showed Mtb growth and negative if none showed Mtb growth.
For this construct, we assumed that, with proper quality control, observed Mtb growth was real. Furthermore, when 1 medium showed growth and another was Mtb-negative or contaminated, the negative result could reflect inhomogeneous sputum preparation or the insensitivity of 1 medium relative to another. We looked closer at this construct by considering patterns in which exactly 1 culture medium was positive (and at least 1 other was negative) and patterns in which exactly 1 culture medium was negative (and at least 1 other was positive), with particular attention to how often each medium tends to agree or disagree with the other media. We also computed the pairwise concordance between solid media.
We next constructed a reference, called here the latent-class construct, which used the statistical information from all 5 solid media. The latent-class construct was positive if, according to a statistical model based on latent class analysis (LCA), the pattern of all 5 results on solid media was more likely to indicate the presence of Mtb than its absence. The observed combinations of solid-media results were separated into 2 sets, based on latent classes, in a way that optimized the statistical likelihood function. Compared to the any-positive construct, the latent-class procedure can give greater insight into the variability in the data.
We used the bootstrap resampling method [Davison and Hinkley 1997] to characterize the joint variability of the parameter estimates in both our models. Technical details of model assumptions, model selection (including the choice of 2 latent classes), and model criticism appear in an online supplement.
After fitting and reviewing the latent-class construct, we compared it to the any-positive construct for further insight into the association among the 5 solid media in this study. Some patterns of culture results mapped to the positive value on both constructs, and some mapped to negative on both. We inspected the patterns that mapped to a positive value on 1 construct and not the other to evaluate more fully the differences between media in recovery of Mtb and in contamination.
For each reference construct, we computed the conditional probability that each solid medium was contaminated, given the status of the construct, to determine whether contamination was informative with respect to the unobserved Mtb status.
We conducted our analyses in R v 2.11 [R Development Core Team, Vienna, Austria] using packages poLCA [Linzer 2011] and randomLCA [Beath 2011] and SASv9.2 [SAS Institute, Cary NC, USA] using the LCA procedure created by The Methodology Center at Pennsylvania State University [Lanza 2010].
Results
Patterns across solid media
Research staff collected 393 sputum specimens from 50 study participants between enrollment and 12 weeks of therapy. Between 51% and 62% of specimens yielded Mtb on each solid medium (table 1). The 2 selective Middlebrook media (7H10S and 7H11S) have the greatest percentage positive (59%, 62%, respectively) and the greatest percentage negative (34%, 29%, respectively). The selective media also have lower contamination rates (7% each), compared to rates on LJ, 7H10, and 7H11.
Table 1.
Frequency and percentages of results on all solid media.
| Medium | Culture result | |||
|---|---|---|---|---|
| Positive (%) | Contaminated (%) | Negative (%) | Missing (%) | |
|
| ||||
| LJ | 200(50.9) | 73(18.6) | 101(25.7) | 19(4.8) |
| 7H10 | 203(51.7) | 90(22.9) | 100(25.4) | 0(0.0) |
| 7H11 | 228(58.0) | 83(21.1) | 77(19.6) | 5(1.3) |
| 7H10S | 233(59.2) | 25(06.4) | 135(34.4) | 0(0.0) |
| 7H11S | 242(61.6) | 29(07.3) | 113(28.8) | 9(2.3) |
Sputum specimens were collected over the course of the first 12 weeks of tuberculosis treatment from 50 Ugandan participants.
LJ: Lowenstein-Jensen culture medium; 7H10 and 7H11: nonselective Middlebrook agar media; 7H10S and 7H11S: selective Middlebrook agar media
We observed 81 distinct patterns, or combinations of positive, contaminated, and negative results on the 5 solid media; 63 of these patterns had no missing culture results. (Some example patterns appear in table 2; all 81 are in a supplemental table.) Among the 393 specimens, 146 (37%) were positive on all 5 solid media (see table 2, row 1), 31 (8%) were negative on all 5 media (see table 2, row 17), and 2 (1%) were contaminated or missing on all solid media. The remaining 214 (54%) specimens had mixed positive, contaminated, and negative results.
Table 2.
Selected patterns of mycobacterial culture results for 393 specimens cultured on 5 solid media.
| LJ | 7H10 | 7H11 | 7H10S | 7H11S | freq | # pos | # ctm | # neg | AP | LC | |
|---|---|---|---|---|---|---|---|---|---|---|---|
| 1 | pos | pos | pos | pos | pos | 146 | 5 | pos | pos | ||
| 2 | ctm | pos | pos | pos | pos | 24 | 4 | 1 | pos | pos | |
| 3 | pos | ctm | pos | pos | pos | 12 | 4 | 1 | pos | pos | |
| 4 | neg | pos | pos | pos | pos | 8 | 4 | 1 | pos | pos | |
| 5 | pos | neg | pos | pos | pos | 3 | 4 | 1 | pos | pos | |
| 6 | pos | neg | pos | neg | pos | 4 | 3 | 2 | pos | Pos | |
| 7 | pos | neg | neg | neg | ctm | 2 | 1 | 1 | 3 | pos | neg |
| 8 | pos | ctm | neg | neg | neg | 3 | 1 | 1 | 3 | pos | neg |
| 9 | pos | neg | neg | neg | neg | 5 | 1 | 4 | pos | neg | |
| 10 | ctm | ctm | ctm | neg | neg | 5 | 3 | 2 | neg | neg | |
| 11 | neg | neg | ctm | neg | ctm | 6 | 2 | 3 | neg | neg | |
| 12 | ctm | neg | ctm | neg | neg | 10 | 2 | 3 | neg | neg | |
| 13 | ctm | ctm | neg | neg | neg | 5 | 2 | 3 | neg | neg | |
| 14 | neg | neg | ctm | neg | neg | 11 | 1 | 4 | neg | neg | |
| 15 | neg | ctm | neg | neg | neg | 5 | 1 | 4 | neg | neg | |
| 16 | ctm | neg | neg | neg | neg | 5 | 1 | 4 | neg | neg | |
| 17 | neg | neg | neg | neg | neg | 31 | 5 | neg | neg |
Sputum specimens were collected over the course of the first 12 weeks of tuberculosis treatment from 50 Ugandan participants.
LJ: Lowenstein-Jensen culture medium; 7H10 and 7H11: nonselective Middlebrook agar media; 7H10S and 7H11S: selective Middlebrook agar media
pos: positive culture result or construct value; ctm: contaminated culture result; neg: negative culture result or construct value; AP: any-positive construct; LC: latent-class construct
These 17 patterns include results from 285 specimens for which no results were missing, the pattern occurred at least 2 times, and at least one of the following: the pattern occurred at least 5 times, had no contaminated results, or had different values on each of the reference constructs. The other 108 specimens produced 64 additional patterns 1–4 times each. A complete list of all 81 unique patterns is provided in a supplementary appendix.
At least 1 solid medium was positive in 271 (69%) specimens. Among the 22 specimens with exactly 1 negative result and 2 or more positive results, LJ was the negative medium 14 times (64%; see example in table 2, row 4).Among the 15 specimens with exactly 1 positive result and 2 or more negative results, LJ was the positive result 11 times (73%; see example in table 2, row 9).
Pairwise discordance (table 3) was lowest among the Middlebrook media (2%–6%), especially when comparing 7H11 to 7H11S (2%) and 7H10 to 7H10S (3%). LJ results contradict Middlebrook results substantially more often (11%–14%).
Table 3.
Pairwise discordance among solid culture media.
| 7H10 | 7H11 | 7H10S | 7H11S | |
|---|---|---|---|---|
| LJ | 13.0 | 11.1 | 14.4 | 11.1 |
| 7H10 | 6.2 | 3.0 | 6.4 | |
| 7H11 | 5.7 | 1.7 | ||
| 7H10S | 5.4 |
Discordance is the percentage of specimens where 1 medium was Mtb-positive and the other was Mtb-negative, out of cases where both media were evaluable.
Sputum specimens were collected over the course of the first 12 weeks of tuberculosis treatment from 50 Ugandan participants.
LJ: Lowenstein-Jensen culture medium; 7H10 and 7H11: nonselective Middlebrook agar media; 7H10S and 7H11S: selective Middlebrook agar media
Media compared to reference constructs
Among the 271 (69%) specimens for which the any-positive construct was positive (table 4), solid media ranged from 75% positive (7H10) to 91% positive (7H11S), and contamination ranged from 2% (7H10S) to 16% (7H10). Where the any-positive construct was negative, the solid media ranged from 50% negative (7H11) to 84% negative (7H10S), and contamination ranged between 16% (7H10S) and 50% (7H11). The selective Middlebrook media appeared to have the highest concordance with the any-positive construct, while the nonselective Middlebrook media had the lowest concordance. Furthermore, contamination was higher when the reference construct was negative than when it was positive. A graphical depiction with 99% confidence regions (figure 1) suggested that the selective media were most reliable relative to the any-positive construct, with poorer performance by all 3 nonselective media. In bootstrap analysis, 7H11S performed best relative to a positive-valued construct in 99.9% of 50,000 bootstrap replicates, and either 7H10S or 7H11S performed best relative to a negative-valued construct in > 99.9% of replicates.
Table 4.
Association of observed culture results with any-positive construct and with latent-class construct (as percentage)
| Observed culture result | Any-positive construct | Latent-class construct | ||
|---|---|---|---|---|
| Positive (n=271) | Negative (n=122) | Positive (n=244) | Negative (n=149) | |
|
| ||||
| Agrees with construct | ||||
| LJ | 76.3 (70.8, 81.1) | 68.8 (59.7, 76.6) | 77.9 (72.1, 82.7) | 60.4 (52.1, 68.2) |
| 7H10 | 74.9 (69.4, 79.7) | 61.5 (52.6, 69.6) | 81.6 (76.2, 85.9) | 61.1 (53.1, 68.5) |
| 7H11 | 85.4 (80.7, 89.1) | 50.4 (41.6, 59.2) | 93.8 (89.9, 96.2) | 52.0 (44.0, 59.9) |
| 7H10S | 86.0 (81.3, 89.6) | 83.6 (76.0, 89.1) | 93.9 (90.1, 96.2) | 82.6 (75.7, 87.8) |
| 7H11S | 91.3 (87.3, 94.1) | 82.4 (74.5, 88.2) | 98.7 (96.4, 99.6) | 76.7 (69.2, 82.8) |
| Is contaminated | ||||
| LJ | 14.5 (10.8, 19.3) | 31.3 (23.4, 40.3) | 14.9 (10.9, 20.0) | 27.3 (20.6, 35.3) |
| 7H10 | 15.9 (12.0, 20.7) | 38.5 (30.4, 47.4) | 14.8 (10.9, 19.7) | 36.2 (29.0, 44.2) |
| 7H11 | 08.6 (05.8, 12.6) | 49.6 (40.8, 58.4) | 06.3 (03.8, 10.1) | 45.9 (38.1, 54.0) |
| 7H10S | 01.8 (00.8, 04.2) | 16.4 (10.9, 24.0) | 01.2 (00.4, 03.6) | 14.8 (10.0, 21.3) |
| 7H11S | 03.0 (01.5, 05.8) | 17.6 (11.8, 25.5) | 00.8 (00.2, 03.0) | 18.5 (13.0, 25.6) |
LJ: Lowenstein-Jensen culture medium; 7H10 and 7H11: nonselective Middlebrook agar media; 7H10S and 7H11S: selective Middlebrook agar media
The table includes proportions together with their 95% confidence intervals, which were calculated using Wilson’s score method [Newcombe 1998].
Figure 1. Conditional probabilities that solid media results agree with each reference construct.
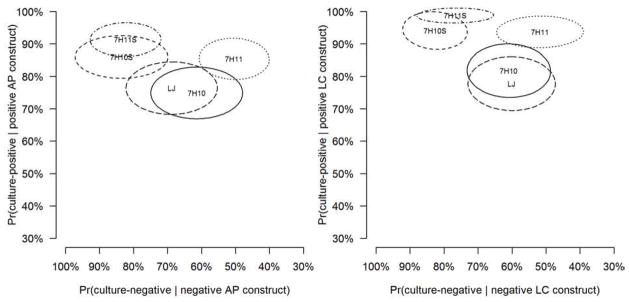
The ellipses represent 99% confidence regions for the probability that each culture medium agrees with the corresponding any-positive or latent-class construct. The graphic is clipped at 30% to highlight the region containing the results. Values in the upper left regions indicate greater agreement between media and reference constructs.
Among the 244 (62%) specimens for which the latent-class construct was positive (table 4), solid media ranged from 78% positive (LJ) to 99% positive (7H11S), and contamination ranged from 1% (7H10S) to 15% (LJ and 7H10). Where the latent-class construct was negative, the solid media ranged from 52% negative (7H11) to 83% negative (7H10S), and contamination ranged between 15% (7H10S) and 46% (7H11). Taking account of variability in both sampling and model construction, the 99% confidence regions (figure 1) demonstrate separation in performance of the 5 solid media relative to the latent-class model. The selective Middlebrook media appeared to have similar accuracy relative to the latent-class construct, as did LJ and 7H10. The performance of 7H11 resembled the superior performance of the selective media when the latent-class construct was positive, but it mimicked the inferior performance of LJ and 7H10 when the construct was negative. Contamination was substantially higher when the latent-class construct was negative, as seen with the any-positive construct. The bootstrap analysis showed that 7H11S performed best relative to a positive latent-class construct in 99.7% of 50,000 bootstrap replicates, and either 7H10S or 7H11S performed best relative to a negative latent-class construct in 100% of replicates (with 7H10S itself superior in 90.2% of replicates).
The online supplement contains the analysis of the assumption of conditional independence of manifest variables given the latent classes.
The any-positive construct and latent-class construct agreed on 366 specimens (93%), including all 122 specimens in which no solid medium was Mtb-positive. The other 27 specimens were Mtb-positive on at least 1 solid medium (hence positive on the any-positive construct), but they were negative on the latent-class construct. Table 2 depicts 3 example patterns (rows 7–9) summarizing 10 specimens on which the constructs disagreed; in each of these 3 patterns, only LJ was positive. The constructs disagreed for another 17 patterns, each of which occurred once. These patterns had 1 or 2 positive results on individual media, and every medium was positive at least once.
Discussion
Most reliable solid culture medium
The most reliable solid culture medium is the one that best conforms to the chosen reference standard, for which we have constructed 2 candidates—the any-positive construct and the latent-class construct. We found a clear separation of the solid media: 7H10S and 7H11S were significantly more reliable than LJ, 7H10, and 7H11. Relative to the positive value of each construct, 7H11, 7H10S, and 7H11S correctly recovered Mtb more frequently than LJ and 7H10. Relative to the negative value of each construct, 7H10S and 7H11S correctly reflected an absence of Mtb more frequently than LJ, 7H10, and 7H11. Bootstrap resampling demonstrated that, with very high confidence, 7H11S performed best relative to positive reference constructs, and either 7H10S or 7H11S performed best relative to negative reference constructs.
Despite apparent conditional dependence in the latent-class model, the ranking among the 5 solid media is credible, in part because it closely mimics the ranking among them with respect to the any-positive construct. The literature also bears this out, as even with misspecified conditional dependence, “[i]n most cases, the rankings of sensitivity and specificity across tests are preserved asymptotically.” [Albert 2004, p 431; see also Torrance-Rynard 1997, p 2173; Goetghebeur 2000, p 241; Bertrand 2005, p 695]
Contradictory media results
The solid media sometimes returned disparate results for the same specimen, with 14% of specimens showing at least 1 positive and 1 negative culture result. What can we infer from these apparent contradictions? It is possible that the positive result was correct and the negative result was below a limit of reliable detection of the negative medium; that the negative result was correct but the positive result is false; that the different media detect different populations of mycobacteria (varying by metabolic state, for example); or that the separate culture media yielded different results because of variations in sampling from incompletely homogenized viscous specimens. These possibilities exceed the scope of the present analysis but would need to be addressed for a complete resolution of our motivating questions.
Nonetheless, we observed some interesting relationships between the various solid media, especially the contrast between LJ and the Middlebrook media. The Middlebrook media agreed with each other more often than with LJ, especially 7H10 with 7H10S and 7H11 with 7H11S (table 3), suggesting that these media grew the same Mtb subpopulations and that they differed primarily by the frequency of contamination. This could account for the excessive correlation residuals (supplementary figure), where 4 of the 5 excessive residuals involve only Middlebrook media. Looking in the other direction, we saw that LJ stood out relative to the other solid media: LJ was the lone positive more often (73%) and the lone negative more often (64%) than the other 4 solid media considered together. Furthermore, it was pairwise discordant with the other solid media about 2 or more times as often as the other solid media are with each other (table 3). If a researcher were considering 2 separate solid media, the apparent distinction between Middlebrook media and LJ suggests that it would be worthwhile to consider using either 7H11S or 7H10S together with LJ, especially if the contamination rate of LJ can be reduced beyond the level observed in this analysis.
Contamination
We can attribute the superior performance of the selective Middlebrook media in this analysis in part to their relatively low contamination rates. With a lower number of contaminated results, the selective media yielded a larger number of evaluable cultures. All contaminated cultures, however, might carry some additional statistical information. It is customary to treat contaminated results as missing data, often deleting them from analysis. We used our 2 reference constructs to determine the extent to which this practice of censoring contaminated results might introduce bias relative to the true proportion with Mtb, if that could be observed absent contamination.
The proportion of contaminated results relative to the negative reference standards exceeded the proportion among the positive standards by 12% (on LJ relative to the latent-class construct) to 41% (on nonselective 7H11 relative to the any-positive construct) (table 4). The consistent direction of this difference stemmed at least in part from the practice in this laboratory and during this study of reporting Mtb growth even when it was detected in the presence of contamination; some laboratories report contamination without any indication of whether Mtb was detected or not. A culture categorized as contaminated in this study, therefore was interpreted to indicate that Mtb was not detectable relative to the amount of contamination; if the contamination level were low, for example, this might effectively rule out Mtb growth on the solid medium. Thus, removing contaminated cultures from an analysis, or grouping them with positive results, would likely overestimate the proportion on which Mtb could be recovered in the absence of contamination. In contrast, grouping contaminated results with negative results would introduce a bias in the opposite direction. This bias could become especially important if these methods were used to find small differences between outcomes with different treatment regimens or in different subgroups; more so if the bias itself varies by subgroup. Therefore, reducing the loss of informative data, contaminated results can be reported and included in analysis as another category of evaluable result.
Supplementary Material
Acknowledgments
This work was supported by the Tuberculosis Trials Consortium (sponsored by the U.S. Centers for Disease Control and Prevention under contract 200-2009-32598) and the Tuberculosis Research Unit at Case Western Reserve University (established with funds from the U. S. National Institutes of Health under contract HHSN266200700022C/NO1-AI-70022).
Footnotes
The findings and conclusions in this report are those of the authors and do not necessarily represent the views of the Centers for Disease Control and Prevention.
Publisher's Disclaimer: This is a PDF file of an unedited manuscript that has been accepted for publication. As a service to our customers we are providing this early version of the manuscript. The manuscript will undergo copyediting, typesetting, and review of the resulting proof before it is published in its final citable form. Please note that during the production process errors may be discovered which could affect the content, and all legal disclaimers that apply to the journal pertain.
References
- Albert PS, Dodd LE. A cautionary note on the robustness of latent class models for estimating diagnostic error without a gold standard. Biometrics. 2004;60:427–435. doi: 10.1111/j.0006-341X.2004.00187.x. [DOI] [PubMed] [Google Scholar]
- Alonzo TA, Pepe MS. Using a combination of reference tests to assess the accuracy of a new diagnostics test. Statistics in Medicine. 1999;18:2987–3003. doi: 10.1002/(sici)1097-0258(19991130)18:22<2987::aid-sim205>3.0.co;2-b. [DOI] [PubMed] [Google Scholar]
- Beath K. randomLCA: Random Effects Latent Class Analysis. R package version 0.7-5. 2011 http://CRAN.R-project.org/package=randomLCA.
- Bertrand P, Béichou J, Grenier P, Chastang C. Hui and Walter’s latent-class reference-free approach may be more useful in assessing agreement than diagnostic performance. Journal of Clinical Epidemiology. 2005;58:688–700. doi: 10.1016/j.jclinepi.2004.10.021. [DOI] [PubMed] [Google Scholar]
- Boelaert M, Aoun K, Liinev J, Goetgheberu E, Van der Stuyft P. The potential of latent class analysis in diagnostic validation for canind Leishmania infantum infection. Epidemiol Infect. 1999;123:499–506. doi: 10.1017/s0950268899003040. [DOI] [PMC free article] [PubMed] [Google Scholar]
- Blumberg HM, Burman WJ, Chaisson RE, et al. American Thoracic Society/Centers for Disease Control and Prevention/Infectious Diseases Society of America. Treatment of tuberculosis. Am J Respir Crit Care Med. 2003;167:603–662. doi: 10.1164/rccm.167.4.603. [DOI] [PubMed] [Google Scholar]
- Davison AC, Hinkley DV. Bootstrap methods and their application. Vol. 1. Cambridge University Press; 1997. [Google Scholar]
- Formann AK, Kohlmann T. Latent class analysis in medical research. Statistical Methods in Medical Research. 1996;5:179–211. doi: 10.1177/096228029600500205. [DOI] [PubMed] [Google Scholar]
- Goetghebeur E, Liinev J, Boelaert M, Van der Stuft P. Diagnostic test analyses in search of their gold standard: latent class analyses with random effects. Statistical Methods in Medical Research. 2000;9:231–248. doi: 10.1177/096228020000900304. [DOI] [PubMed] [Google Scholar]
- Hadgu A, Qu Y. A biomedical application of latent class models with random effects. Appl Statist. 1998;47:603–616. [Google Scholar]
- Hagenaars JA. Latent structure models with direct effects between indicators. Sociological Methods and Research. 1988;16:379–405. [Google Scholar]
- Hui SL, Walter SD. Estimating the error rates of diagnostic tests. Biometrics. 1980;36:167–171. [PubMed] [Google Scholar]
- Hui SL, Zhou XH. Evaluation of diagnostic tests without gold standards. Statistical Methods in Medical Research. 1998;7:354–370. doi: 10.1177/096228029800700404. [DOI] [PubMed] [Google Scholar]
- Joloba ML, Johnson JL, Feng P, Goldberg S, Morgan K, Gitta P, Boom HW, Heilig CM, Kizza H, Eisenach K. What is the most reliable solid medium for tuberculosis clinical research trials? Tuberculosis (Edinb) 2014 May;94(3):311–316. doi: 10.1016/j.tube.2014.03.002. doi: 10.1016/j.tube.2014.02.006. [DOI] [PubMed] [Google Scholar]
- Lanza ST, Dziak JJ, Huang L, Xu S, Collins LM. PROC LCA & PROC LTA user’s guide (Version 1.2.7) University Park: The Methodology Center, Penn State; 2011. Retrieved from http://methodology.psu.edu. [Google Scholar]
- Lau T. The latent class model for multiple binary screening tests. Statistics in Medicine. 1997;16:2283– 2295. doi: 10.1002/(sici)1097-0258(19971030)16:20<2283::aid-sim658>3.0.co;2-t. [DOI] [PubMed] [Google Scholar]
- Linzer DA, Lewis JB. poLCA: An R Package for Polytomous Variable Latent Class Analysis. Journal of Statistical Software. 2011;42(10):1–29. URL http://www.jstatsoft.org/v42/i10/ [Google Scholar]
- Newcombe RG. Two-sided confidence intervals for the single proportion: comparison of seven methods. Statistics in Medicine. 1998;17:857–872. doi: 10.1002/(sici)1097-0258(19980430)17:8<857::aid-sim777>3.0.co;2-e. [DOI] [PubMed] [Google Scholar]
- Qu Y, Tan M, Kutner MH. Random effects models in latent class analysis for evaluating accuracy of diagnostic tests. Biometrics. 1996;52:797–810. [PubMed] [Google Scholar]
- R Development Core Team. R: A language and environment for statistical computing. R Foundation for Statistical Computing; Vienna, Austria: 2010. URL http://www.R-project.org/ [Google Scholar]
- Rutjes AWS, Reistma JB, Coomarasamy A, Khan KS, Bossuyt PMM. Evaluation of diagnostic tests when there is no gold standard. A review of methods. Health Technology Assessment. 2007;11(50) doi: 10.3310/hta11500. [DOI] [PubMed] [Google Scholar]
- Torrance-Rynard VL, Walter SD. Effects of dependent errors in the assessment of diagnostic test performance. Statistics in Medicine. 1997;16:2157–2175. doi: 10.1002/(sici)1097-0258(19971015)16:19<2157::aid-sim653>3.0.co;2-x. [DOI] [PubMed] [Google Scholar]
- Uebersax JS, Grove WM. Latent class analysis of diagnostic agreement. Statistics in Medicine. 1990;9:559–572. doi: 10.1002/sim.4780090509. [DOI] [PubMed] [Google Scholar]
- Vacek PM. The effect of conditional dependence on the valuation of diagnostic tests. Biometrics. 1985;41:959–968. [PubMed] [Google Scholar]
Associated Data
This section collects any data citations, data availability statements, or supplementary materials included in this article.