

Abstract Abstract
The platelet-derived growth factor (PDGF) signaling pathway has been found to be activated in human pulmonary arterial hypertension (PAH) and in animal models of the disease. Our study tested the hypothesis that a novel, nonselective inhaled PDGF receptor inhibitor, PK10453, would decrease pulmonary hypertension both in the rat monocrotaline (MCT) model and the rat MCT plus pneumonectomy (MCT+PN) model of PAH. PK10453, delivered by inhalation for 4 (D4)- and 8 (D8)-minute exposures 3 times a day for 2 weeks, decreased right ventricular systolic pressure (RVSP) in both the rat MCT and rat MCT+PN models: RVSP was 80.4 ± 2.6 mmHg in the vehicle MCT group (n = 6), 44.4 ± 5.8 mmHg in the D4 MCT group (n = 6), and 37.1 ± 4.5 mmHg in the D8 MCT group (n = 5; P < 0.001 vs. vehicle); RVSP was 75.7 ± 7.1 mmHg in the vehicle MCT+PN group (n = 9), 40.4 ± 2.7 mmHg in the D4 MCT+PN group (n = 10), and 43.0 ± 3.0 mmHg in the D8 MCT+PN group (n = 8; P < 0.001). In the rat MCT+PN model, continuous telemetry monitoring of pulmonary artery pressures also demonstrated that PK10453 prevented the progression of PAH. Imatinib given by inhalation was equally effective in the MCT model but was not effective in the MCT+PN model. Immunohistochemistry demonstrated increased activation of the PDGFβ receptor compared to the PDGFα receptor in neointimal and perivascular lesions found in the MCT+PN model. We show that imatinib is selective for the PDGFα receptor, whereas PK10453 has a lower half-maximal inhibitor concentration (IC50) for inhibition of kinase activity of both the PDGFα and PDGFβ receptors compared to imatinib. In conclusion, PK10453, when delivered by inhalation, significantly decreased the progression of PAH in the rat MCT and MCT+PN models. Nonselective inhibition of both the PDGFα and PDGFβ receptors may have a therapeutic advantage over selective PDGFα receptor inhibition in PAH.
Keywords: pulmonary arterial hypertension, kinase inhibitors, platelet-derived growth factor (PDGF)
There has been a growing interest in the potential of kinase inhibitors as a treatment for pulmonary arterial hypertension (PAH). In particular, platelet-derived growth factor receptor (PDGFR) tyrosine kinases have attracted attention as a potential therapeutic target for PAH. The platelet-derived growth factor (PDGF) signaling pathway has been found to be activated in human idiopathic PAH (iPAH) and in animal models of the disease. For example, PDGFA, PDGFB, PDGFRα, and PDGFRβ messenger RNA (mRNA) expression was increased in small pulmonary arteries from patients with iPAH, compared to control subjects, and Western blot analysis showed a significant increase in protein expression of PDGFRβ in PAH lungs.1 The migration of pulmonary artery smooth muscle cells (PASMCs) was inhibited by imatinib, a PDGFR inhibitor.1 Imatinib also decreased right ventricular systolic pressure (RVSP) and improved survival in the rat monocrotaline (MCT) model of PAH.2 In several case reports of patients with refractory PAH, a favorable response to imatinib was observed.3,4 The IMPRES (Imatinib in Pulmonary Arterial Hypertension, a Randomized, Efficacy Study) trial, which examined the effect of imatinib in patients with severe PAH, showed improvements in 6-minute walk distance and cardiopulmonary hemodynamics.5 However, orally administered imatinib may be associated with systemic side effects, including gastrointestinal distress and bone marrow suppression.6 To improve the therapeutic window (i.e., increase efficacy and decrease systemic side effects), inhalation drug delivery of kinase inhibitors for PAH is a reasonable approach.7,8
In this study, we report, for the first time, that a novel, nonselective PDGFR inhibitor, PK10453, when administered by inhalation, decreases the severity of PAH in two animal models of the disease: the rat MCT, and the rat MCT plus pneumonectomy (MCT+PN) model. We show that PK10453 is highly potent against both PDGFRα and PDGFRβ, whereas imatinib is selective for PDGFRα. Both PK10453 and imatinib were effective in the rat MCT model, but only PK10453 decreased pulmonary hypertension in the rat MCT+PN model when administered by inhalation. We present evidence that this differential effect may be due to hyperactivation of signaling through PDGFRβ in precapillary pulmonary arteriole neointimal lesions, compared to PDGFRα, in the rat MCT+PN model.
Methods
Materials
PK10453, (R-phenyl)pyrazin-R-methylnicotinamide, was synthesized by Organix (Woburn, MA). Imatinib mesylate was obtained from LC Laboratories (Woburn, MA). Human fetal lung fibroblasts (HLFs) were obtained from Cell Applications (San Diego, CA). DMEM (Dulbecco’s Modified Eagle Medium) was obtained from Mediatech (Manassas, VA). PDGF AA, PDGF BB, and Glutamax were obtained from Life Technologies (Grand Island, NY). Para-toluene sulfonic acid, ammonium hydroxide, IR-780, and MCT (C2401; lots 031M1921V and SLBB7802V) were obtained from Sigma Aldrich (St. Louis, MO). Anti-phospho-AKT(Ser473), anti-phospho-AKT(Thr308), pan-AKT (mouse mAB [CST2920] and rabbit mAb [CST2965]), anti-phospho-ERK1/2 (extracellular signal-regulated kinases 1/2), anti-phospho-STAT3 (signal transducer and activator of transcription 3), and total STAT3 antibodies were obtained from Cell Signaling Technologies (Waltham, MA). Anti-total ERK1/2 antibody was obtained from Protein Simple (Santa Clara, CA). Anti–von Willebrand factor (vWF), actin, phospho-PDGFRα (Y754), and PDGF BB antibodies were obtained from AbCam (Cambridge, MA). Antibodies against PDGF AA (sc-128), PDGFRα (sc-338), PDGFRβ (sc-432), and phosphorylated PDGFRβ (p-PDGFRβ; Tyr 1021; sc-12909) were obtained from Santa Cruz Biotechnology (Santa Cruz, CA). The 680LT goat anti-mouse immunoglobin G (IgG), IRDye 800 W goat anti-rabbit IgG, and Odyssey blocking buffer were obtained from LI-COR (Lincoln, NE).
In vitro kinase assay
A Z-lyte kinase assay was performed to determine the inhibition of PDGFRα- and PDGFRβ-mediated phosphorylation by PK10453 and imatinib. Ten-point titration curves were modeled to calculate the half-maximal inhibitor concentration (IC50; Invitrogen Select Screen).
In-cell Western assay
To compare the inhibitory profiles of PK10453 and imatinib for PDGF BB- and PDGF AA-stimulated AKT phosphorylation, we performed an in-cell-Western assay according to the method of Chen et al.,9 with slight modifications. HLFs were maintained in subculture at no more than 6 passages in DMEM with 5% fetal bovine serum (FBS) and 4 mM Glutamax at 37°C and 5% CO2. HLFs were plated and grown to 70%–80% confluence in 96-well plates and then serum starved for 48 hours. Cells were treated with the drug (PK10453 or imatinib) at indicated concentrations for 30 minutes and then exposed to 10 ng/mL PDGF AA or PDGF BB for a period of 7.5 minutes. Cells were fixed in 3.7% formaldehyde, washed with 0.1% Triton X-100, and treated with Odyssey Blocking Buffer for 90 minutes. Proteins were incubated overnight with 1∶100 diluted rabbit mAb to phosphorylated AKT(Ser473 or Thr308) and 1∶100 mouse mAb to total AKT-pan-4040D. Antibodies were detected by means of IRDye 680LT goat anti-mouse IgG and IRDye 800 W goat anti-rabbit IgG conjugated antibodies. After the final wash, signal was quantified with an Odyssey Infrared Imaging System (LI-COR). Phosphoprotein signal (800 nm) was normalized to the total protein signal (700 nm) acquired from each well, and experimental duplicates on same plate were averaged and reported.
Animals
Male Sprague Dawley rats (weight: 300–330 g; Taconic) were used for this study. Animals were housed in standard rat cages with a 12-hour light/dark cycle, and standard rat chow and water were provided ad lib. Animals were cared for and used in accordance with the National Institutes of Health Guide for the Care and Use of Animals. All animal protocols were approved by the Bassett Medical Center and Pulmokine Institutional Animal Care and Use Committee.
Formulation and aerosol delivery
PK10453 was dissolved at a concentration of 20 mg/mL in 1 M tosylic acid. Nebulization was performed with a PARI nebulizer with an air pressure of 12.5 psi. The aerosol droplets were neutralized by ammonia vapor that was passed into the aerosol airstream. The particles were then dried by passage through an annular ring of silica bead cartridges before reaching the exposure chamber. The 6-port exposure chamber was a nose-only exposure system custom designed and built by Powerscope (Minneapolis, MN). The vacuum flow rate at each port was separately controlled by a flow meter. The aerosol particle size was measured at the exit port of the drying column with an Anderson (Mark II) cascade impactor. The mass median aerodynamic diameter was 2 μm, and the associated geometric standard deviation was 1.6. Imatinib mesylate was dissolved in water at 20 mg/mL, delivered by a PARI nebulizer, and then dried by passage through an annular ring of silica bead cartridges prior to inhalation.
Estimation of inhaled dose
Filters exposed to PK10453 for either 4 or 8 minutes (n = 6 each group) via the Powerscope exposure chamber were placed in amber glass vials. Twelve (12) milliliters of 1∶3 (v/v) methanol∶acetonitrile were added to each vial containing a filter for approximately 1 hour, with periodic mixing, followed by sonication for 60 seconds. An aliquot was then diluted 100-fold by adding 10 μL of unknown filter extract to 990 μL of 1∶3 (v/v) methanol∶acetonitrile. Samples were vortex mixed for 30 seconds, and then a 100-μL diluted aliquot was combined with 100 μL of a 172-ng/mL solution of a non–chemically related internal standard (PK18855) in 1∶1 methanol∶water, vortex mixed, and transferred to autosampler vials for LC-MS/MS (liquid chromatography with tandem mass spectrometry) analysis. Filter extracts were compared against a calibration curve prepared in 100% methanol (PharmOptima, Portage, MI). The calculated aerosol concentration of PK10453, in micrograms per liter of air, was based on the average total micrograms of PK10453 on the filters for the 4- and 8-minute exposure times and the flow rate past each filter (0.8 L/min). The inhaled dose was calculated with the average concentration of PK10453 per square centimeter of filter paper (average of 4-minute and 8-minute exposures), the average minute ventilation (MV) measured by plethysmography (0.15 L/min), and an estimated deposition fraction of 0.1.10 Calculation of the imatinib 8-minute dose was based on gravimetric analysis.
Imaging
The spatial distributions of inhaled PK10453 and imatinib in the lung were evaluated by fluorescent imaging. For this study, a near-infrared (IR) fluorescent tracer, IR-780, was added to the drug solution in the nebulizer. In this way, the dried aerosol particles contained both the drug and the IR tracer. After a 2-minute (PK10453) or 8-minute (imatinib) exposure, animals were placed under general anesthesia and underwent intubation via tracheostomy, and the lungs were excised. Optimal cutting temperature compound–phosphate-buffered saline (OCT/PBS) was infused via the pulmonary artery, and the lungs were insufflated with air and frozen in the vapor phase of liquid nitrogen. Serial approximate 2-mm sections of the lung were made and imaged on a LI-COR Odyssey Imager.
Pharmacokinetic studies
PK10453 was administered intravenously (1 mg/kg) or by inhalation (8-minute exposure) to animals, which were then euthanized at times 0, 10, 20, and 60 minutes (n = 3 at each time point). Blood samples were taken by cardiac puncture, and the lungs were excised. The lungs were homogenized, and PK10453 was extracted with a 1∶3 mixture of acetonitrile∶methanol. Similarly, plasma was extracted with a 1∶3 mixture of acetonitrile∶methanol. The drug was assayed by LC-MS/MS (PharmOptima). First-order exponential curves were fitted to the data with Excel. The area under the curve (AUC) was determined with the trapezoidal method of integration.
Efficacy studies in the rat MCT model
Efficacy study 1: PK10453 dose-response study in the rat MCT model
Male Sprague-Dawley rats received 60 mg/kg MCT intraperitoneally (IP). After 3 weeks, PK10453 or a vehicle control was administered by inhalation. Four groups were studied: vehicle control (4-minute exposure) and three treatment groups of PK10453, with exposure times of 2 minutes (D2), 4 minutes (D4), or 8 minutes (D8) 3 times a day. These regimens were administered for 2 weeks. The vehicle consisted of aerosolized 1 M tosylic acid neutralized with ammonia vapor as described above. The pH of a solution prepared by dissolving captured aerosol particles in water was measured for every dose and was consistently in the range of 5.5–6.0. At the end of the study, the RVSP was measured, and the heart chambers were dissected and weighed.
Efficacy study 2: PK10453 versus imatinib in the rat MCT model
In this study, male Sprague Dawley rats were given 60 mg/kg MCT IP. Three weeks later, vehicle (1 M tosylic acid), PK10453 (20 mg/mL free base in 1 M tosylic acid), or imatinib mesylate (20 mg/mL in nebulizer solution) was administered to designated groups for 8-minute inhalation exposures, 3 time a day, for 2 weeks. At the end of the study, RVSP was measured, and the lungs and heart were fixed in formalin. For measurement of RVSP, animals were sedated with isoflurane, intubated via a tracheostomy, and ventilated with a TOPOVENT pressure-regulated ventilator (peak inspiratory pressure: 18 cm H2O; positive end-expiratory pressure [PEEP]: 5 cm H2O). A sternotomy was performed, and a Scisense high-fidelity catheter was inserted via the right ventricular (RV) apex.
Efficacy studies in the rat MCT+PN model
Telemetry efficacy studies 3 and 4 in the rat MCT+PN model
Pneumonectomy and implantation of a TRM53P or DSI PAC40 telemetry monitor in the pulmonary artery (Telemetry Research, Auckland, New Zealand, and DSI, Minneapolis, MN) were carried out in rats. In protocol 3 (PK10453 vs. vehicle), the animals received TRM53P transmitters, and 60 mg/kg MCT IP (lot 031M1921V) was administered after the animals had fully recovered from surgery. Two weeks after MCT administration, PK10453 or vehicle was administered (4-minute exposure 3 times daily for 9 days). Dosing was begun 2 weeks after MCT administration rather than after 3 weeks, because in this more aggressive model the animals developed PAH more quickly and developed distress sooner than in MCT-only treatment.11 Sampling of pulmonary artery (PA) pressure was performed for 5 minutes before each morning dose in ambulatory animals in room air. In protocol 4 (imatinib vs. vehicle), the animals received DSI PAC40 transmitters, followed by 50 mg/kg MCT IP (lot SLBB7802V). A lower dose of MCT was used for this study because attempts to use 60 mg/kg of this lot of MCT resulted in the need for early euthanasia in a high proportion of animals due to weight loss and tachypnea. Two weeks after MCT IP injection, vehicle (mesylate 3 mg/mL) or imatinib mesylate (20 mg/mL in nebulizer solution) was administered for 8-minute exposures 3 times a day for 9 days. Telemetry data were obtained for 10 minutes daily before each morning dose for this protocol.
Efficacy study 5: measurement of RV pressure and pressure-volume loops in the MCT+PN model; PK10453 dose-response study
In a separate cohort of animals, the MCT+PN model was developed as described above, and PK10453 was then administered for 4 or 8 minutes 3 times a day to the drug-treated group. The vehicle-control group underwent 4-minute exposures 3 times a day. RV pressures were obtained in each group after 14 days of treatment. In a subset of each group, pressure-volume (PV) loops were obtained with an admittance system (high-fidelity catheter FTE1918B, Scisense) after 14 days of treatment. After induction of general anesthesia and intubation via tracheostomy, the rats were placed on a pressure-controlled ventilator (TOPOVENT). General anesthesia consisted of isoflurane and 100% Fio2, with peak inspiratory pressure set at 18 cm H2O and PEEP at 5 cm H2O. A left thoracotomy was performed, and the admittance catheter was inserted into the RV via the RV outflow tract.
Systemic blood pressure (BP) study
The effect of PK10453 on systemic BP was studied in ambulatory MCT-treated rats with DSI PAC40 transmitters implanted in the descending aorta. Three weeks after administration of MCT 60 mg/kg IP, animals inhaled PK10453 or vehicle 3 times/day, with a 4-minute exposure of each dose for 7 days. BP was recorded before each morning dose.
Plethysmography
Plethysmography was performed with an EMKA dual-chamber plethysmograph and IOX software. Parameters measured included breathing frequency, tidal volume, MV, peak inspiratory and expiratory flow, and airway resistance. Animals were acclimatized to the plethysmograph for 3 days before first data acquisition. Measurements were made before the first dose of drug and at the end of the study.
Histology and morphometric analysis
At the end of the study, the heart and lungs were removed from ventilated animals under general anesthesia. Heparinized saline was infused under pressure through the main pulmonary artery. The right upper lobe was immediately tied off and placed in liquid nitrogen for NanoPro 100 assay analysis. The heart was removed, and the RV free wall, interventricular septum, and left ventricular (LV) free wall were dissected and weighed. Buffered formalin (10%) was infused under pressure through both the pulmonary artery and the trachea. Morphometric analysis was performed on H&E (hematoxylin and eosin)-stained formalin fixed tissue sectioned at 8 μm. The media area and lumen area of pulmonary arterioles were measured with ImageJ software by a technician blinded to treatment group. Measurements were made on at least 40 pulmonary arterioles per section. The ratio of the lumen area to the total media area (L/M) was determined. This ratio normalizes the variation in total pulmonary arteriole area. In addition, occlusive analysis was performed in the MCT+PN study (specifically, efficacy study 5) according to the method of Homma et al.12 Briefly, precapillary arterioles were assigned grade 0 for no evidence of neointimal lesions, grade 1 for less than 50% luminal occlusion, and grade 2 for greater than 50% occlusion. Masson trichrome stains were performed on lung sections from the MCT+PN model.
NanoPro immunoassay
Relative differences in phosphorylated AKT, ERK1/2, and STAT isoforms were measured with a NanoPro100 immunoassay system (Protein Simple/Cell Biosciences, Santa Clara, CA) according to the methods of Iacovides et al.13 and Fan et al.14
Immunohistochemistry
Antigen retrieval was performed with citrate buffer (pH 6.0) or Tris-EDTA (ethylenediaminetetraacetic acid) buffer (pH 9.0). Immunohistochemistry was performed for the following targets: vWF, alpha-smooth muscle actin (αSMC), PDGF AA, PDGF BB, PDGFRα, total PDGFRβ, phospho-PDGFRα, and phospho-PDGFRβ. Signal detection was performed with an EXPOSE HRP/DAB (horseradish peroxidase/diaminobenzidine) kit (AbCam).
Statistical analysis
Data are presented as mean ± SEM unless otherwise noted. Analysis of variance (ANOVA), with the Bonferroni correction for multiple-group comparisons, or repeated-measures ANOVA was used (XLSTAT, Addinsoft, New York, and SPSS 14.0). For in-cell Western assays, the IC50 of drug response was determined on the basis of best-fit curves using a nonlinear regression model (XLSTAT). Significance was set at the P = 0.05 level.
Results
Characterization of PK10453
An in vitro kinase assay demonstrated that the IC50 for PK10453 at the Michaelis-Menten constant for adenosine triphosphate (ATP Km) was 10.1 nM for PDGFRα and 35 nM for PDGFRβ. For imatinib, the IC50 at ATP Km was 71 nM for PDGFRα and 607 nM for PDGFRβ (Fig. 1).
Figure 1.
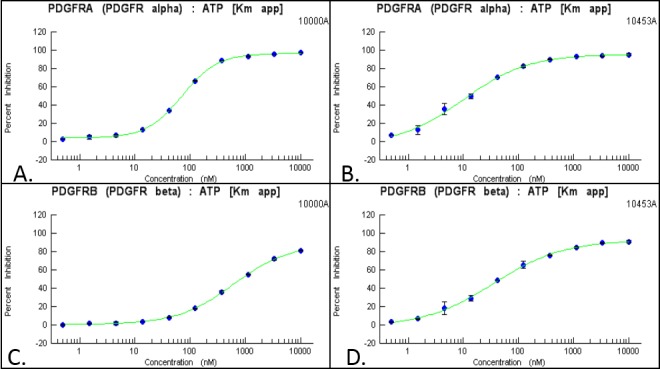
The IC50 (half-maximal inhibitor concentration) of imatinib against PDGFRα was 71 nM (A), and that against PDGFRβ was 607 nM (C). The IC50 of PK10453 against PDGFRα was 10.1 nM (B), and that against PDGFRβ was 35 nM (D). ATP: adenosine triphosphate; Km: Michaelis-Menten constant; PDGFR: platelet-derived growth factor receptor.
In-cell Western assay
Results of this assay are show in Figure 2. The IC50 of PK10453 for PDGF BB-stimulated AKT phosphorylation at Ser473 was 0.13 μM, compared to 1.8 μM for imatinib (P < 0.01). The IC50 of PK10453 for PDGF BB-stimulated AKT phosphorylation at Thr308 was 0.43 μM, versus 3.25 μM for imatinib (P < 0.001). The IC50s of PK10453 and imatinib for PDGF AA-stimulated AKT phosphorylation were not significantly different.
Figure 2.

In-cell Western assays (ICWs) demonstrating the lower IC50 (half-maximal inhibitor concentration) of PK10453 against PDGF BB-stimulated phosphorylation of AKT at Ser473 and Thr308, compared to that of imatinib, in human fetal lung fibroblasts (HLFs). A, B, PDGF AA stimulation of pAKT(Ser473) (A) and pAKT(Thr308) (B) in HLFs was blocked by PK10453 (squares) and imatinib (triangles), with a comparable IC50 between 0.3 and 0.6 μM. C, PDGF BB stimulation of pAKT(Ser473) was blocked by PK10453 (squares) with an IC50 of 0.13 μM, compared to 1.8 μM for imatinib (triangles). D, PDGF BB stimulation of pAKT(Thr308) was blocked by PK10453 (squares) with an IC50 of 0.43 μM, compared to 3.25 μM for imatinib (triangles). Bottom, examples of ICWs for PDGF AA- and PDGF BB-stimulated AKT phosphorylation, PK10453 versus imatinib. The signal at 800 nm is color-coded green and represents the phospho-protein-specific signal; the signal at 700 nm is color-coded red and represents signal from total AKT. In the examples shown, the 800- and 700-nm signals are superimposed. PDGF: platelet-derived growth factor. In A–D, pAKT: phosphorylated AKT; tAKT: total AKT; section sign (§) indicates P < 0.01; asterisk indicates P < 0.001.
Estimated inhaled dose
The average concentration of PK10453 was 62.4 ± 3.3 μg/cm2 filter paper for the 4-minute exposure and 137 ± 7.0 μg/cm2 for the 8-minute exposure, which resulted in an aerosol concentration of 91.65 μg/L air for the 4-minute exposure and 100.6 μg/L air for the 8-minute exposure. The aerosol concentration of imatinib, from gravimetric analysis, was 167 μg/L. The average inhaled dose (8-minute exposure), assuming a deposition fraction of 0.1 and a rat weight of 300 g, was approximately 20 μg/kg for PK10453 and 40 μg/kg for imatinib (Table 1).
Table 1.
Estimated inhaled dose calculated from the measured concentration of PK10453 and gravimetric analysis of imatinib in the aerosol, the measured minute ventilation (MV), the estimated deposition fraction of 0.1, and rat weight of 300 g
| Active pharmaceutical ingredient | ||
|---|---|---|
| PK10453 | Imatinib | |
| Aerosol concentration, μg/L | 96.13 | 167.4 |
| Exposure, minutes | 8.00 | 8.00 |
| MV, L/min | 0.15 | 0.15 |
| MV × exposure time | 1.20 | 1.20 |
| Total deposition fraction | 0.10 | 0.10 |
| Lung deposition fraction | 0.60 | 0.60 |
| Total inhaled, μg | 115.36 | 200.88 |
| Total deposited, μg | 11.54 | 20.09 |
| Lung deposited, μg | 6.92 | 12.05 |
| Lung deposited, μg/kg | 23.07 | 40.18 |
Lung distribution and pharmacokinetics of inhaled PK10453
Fluorescent images of the lung sections following inhalation of PK10453 with IR-780 tracer are shown in Figure 3. The fluorescence intensity is well distributed throughout the lungs. The network of darker lines arises from the connective tissue and therefore does not represent the airways affected by the disease. The spatial distribution of imatinib was similar (data not shown).
Figure 3.

Images of frozen lung sections (right upper, middle, and lower lobes) after inhalation of PK10453+IR-780 tracer; 2-minute inhalation time. IR-780 emits at 800 nm. Image acquisition at 800 nm is color-coded green; image acquisition at 700 nm is color-coded red and represents tissue autofluorescence. Intervals of the digital ruler are 1 cm.
For the pharmacokinetic study, the concentration of PK10453 in the lung when administered by inhalation was compared to the concentration achieved with intravenous (IV) administration. It is possible to estimate the pharmacokinetic advantage of inhalation (INH) relative to IV administration, Rd, by comparing the AUCs of a plot of the drug concentration as a function of time following INH and IV administration:10,15,16
 |
The pharmacokinetic data were modeled to a first-order exponential curve, and the AUC was calculated from the curves (Table 2). Figure 4 shows the drug level in lung and plasma as a function of time following inhalation or IV administration of PK10453. The data indicate a 45-fold advantage of INH administration of PK10453 over IV administration (Rd = 44.6).
Table 2.
PK10453 pharmacokinetic data were modeled to exponential curves
| Exponential curve parameters (Y = Ae−bX) | AUC | |||
|---|---|---|---|---|
| A (ng/g lung) | b (min−1) | R2 | ||
| Lung (INH) | 2498 | 0.03 | 0.89 | 1001.82 |
| Plasma (INH) | 132.7 | 0.07 | 0.93 | 65.47 |
| Lung (IV) | 440 | 0.06 | 0.96 | 211.89 |
| Plasma (IV) | 1260 | 0.07 | 0.92 | 617.25 |
| Rda | 44.58 | |||
INH: administered by inhalation; IV: administered intravenously; AUC: area under the curve.
Rd = [(AUClung/AUCplasma)INH]/[(AUClung/AUCplasma)IV].
Figure 4.

Pharmacokinetic advantage of inhaled over intravenous PK10453 was calculated by modeling PK10453 concentrations in lung and plasma over time. A, Concentration of PK10453 after intravenous (IV) administration (pIV), measured in plasma and lung tissue extracts. B, Concentration of PK10453 after inhalation exposure (pINH), measured in plasma and lung tissue extracts.
Efficacy studies in the rat MCT model
Efficacy study 1: PK10453 dose-response study in the rat MCT model
RVSP values are shown in Figure 5A. In the vehicle (V) group (n = 6), RVSP was 80.4 ± 2.6 mmHg. For the treatment groups, RVSP was 51.4 ± 6.5 mmHg for D2 (n = 6), 44.4 ± 5.8 mmHg for D4 (n = 6), and 37.1± 4.5 mmHg for D8 (n = 5; P < 0.001). The normal control group (C) RVSP was 28.5 ± 1.9 mmHg (n = 3). In the D4 group, there was a 44% reduction in RVSP, and in the D8 group, there was a 54% reduction in RVSP, compared to the V group. There was also a significant reduction in the degree of RV hypertrophy, as measured by the ratio of the combined weight of the right ventricle and the interventricular septum to the weight of the left ventricle ((RV + IVS)/LV; V: 0.787 ± 0.04; D2: 0.651 ± 0.04; D4: 0.525 ± 0.02; D8: 0.489 ± 0.02; C: 0.511 ±0.02; P < 0.001 for D4 and D8 vs. V; Figure 5B). The data are represented by this ratio because the septum is shared by the RV and the LV. However, use of the RV/(IVS + LV) ratio also showed similar results.
Figure 5.

A, Effect of PK10453 on right ventricular (RV) systolic pressure in the rat monocrotaline (MCT) model. B, Effect of PK10453 on RV hypertrophy in the rat MCT model. The (RV + IVS)/LV weight ratio ((right ventricle + interventricular septum)/left ventricle) was compared between the groups (V: 0.787 ± 0.04; D2: 0.651 ± 0.04; D4: 0.525 ± 0.02; D8: 0.489 ± 0.02; C: 0.511 ± 0.02). Treatment groups in A, B: V (n = 6): vehicle; D2 (n = 6), D4 (n = 6), D8 (n = 5): 2-, 4-, or 8-minute exposure 3 times/day for 2 weeks; C (n = 3): normal controls. C, RV systolic pressure in the rat MCT model: comparison of PK10453 to imatinib. D, Lumen/media ratio in MCT rat model comparison of PK10453 and imatinib to vehicle: vehicle (V, n = 4): 0.55 ± 0.1; PK10453 (D8, n = 12): 0.94 ± 0.08; imatinib (I8, n = 5): 0.99 ± 0.07. In all plots, a section sign (§) indicates P < 0.05, a pound sign indicates P < 0.01, and an asterisk indicates P < 0.001.
Efficacy study 2: PK10453 or imatinib versus vehicle in the rat MCT model
There were 6 animals in the vehicle (V) group, but accurate RV end-systolic pressures (ESPs) were not obtained because of bleeding in 2 animals. Therefore, RVSP is based on 4 animals in the V group and was 57.9± 7.6 mmHg. In the PK10453 group (D8; n = 12), RV ESP was 36.3 ± 2.6 mmHg, and in the imatinib group (I8; n = 6) it was 31.8 ± 1.8 mmHg (P = 0.001 for V vs. D8; P = 0.002 for V vs. I8; Fig. 5C). End-systolic volume was greater in the V group (158 ± 12.6 μL) than in the D8 (99.5 ± 10 μL) and I8 (81 ± 4.3 μL) groups (P = 0.05 for V vs. D8; P = 0.014 for V vs. I8; P was not significant for D8 vs. I8). There were no significant differences between the groups for the following parameters: end-diastolic volume, ejection fraction (EF), cardiac output, and stroke work. The L/M was improved by both PK10453 and imatinib, compared to vehicle, in the MCT model (V [n = 4]: 0.55 ± 0.1; D8 [n = 12]: 0.94 ± 0.08; I8 [n = 5]: 0.99 ± 0.07; P < 0.01 for D8 vs. V; P < 0.05 for I8 vs. V; Fig. 5D).
Efficacy studies in the rat MCT+ PN model
Telemetry efficacy studies 3 and 4
The results of the telemetry studies in the rat MCT+PN model are shown in Figure 6. For the PK10453 telemetry study (study 3) at day 1 before start of treatment, the PA systolic pressure in the vehicle group was 47.4 ± 10.2 mmHg, and that in the PK10453 group was 43.1 ± 3.5 mmHg (P not significant). After 5 days of treatment, the PA systolic pressure was 67.4 ± 11.4 mmHg in the vehicle group, and that in the PK10453 group was significantly lower, 47.2 ± 3.0 mmHg (P = 0.03). On treatment day 9, the PA systolic pressure in the vehicle group was 92.8 ± 9.1 mmHg, but that in the PK10453 group was significantly lower, 50.5 ± 7 mmHg (P = 0.03). For the imatinib telemetry study (study 4), at day 1, the PA systolic pressure in the vehicle group was 51.4 ± 8.9 mmHg, and that in the imatinib group was 41.5 ± 3.5 mmHg. At treatment day 9, the PA systolic pressure in the vehicle group was 80.4 ±14.2 mmHg, and that in the imatinib group was 75.1 ± 7 mmHg (P not significant).
Figure 6.

Telemetry study in the rat monocrotaline plus pneumonectomy (MCT+PN) model. Pulmonary artery (PA) systolic pressure was measured over time in ambulatory rats. Top, PK10453; V: vehicle (n = 5); D: 4-minute exposure to PK10453 3 times/day (n = 6). Pound sign (#) indicates P < 0.01; section sign (§) indicates P < 0.05. Bottom, imatinib; V: vehicle; I: imatinib (P not significant).
Efficacy study 5: measurement of RV pressure and PV loops in the MCT+PN model; PK10453 dose-response study
In a separate cohort of animals, the MCT+PN model was developed as described above. RV pressure was obtained after 14 days of vehicle exposure, and PK10453 treatment was carried out with 4-minute (D4) and 8-minute exposures (D8) 3 times a day. In the vehicle group (V; n = 9), RVSP was 75.7 ± 7.1 mmHg, that in the D4 group (n = 10) was 40.4 ± 2.7 mmHg, and that in the D8 MCT+PN group was 43 ± 3.0 mmHg (P < 0.001 for V vs. D4 and V vs. D8; Fig. 7A). PV loops were obtained in a subset of animals from each group (V: n = 3; D4: n = 5; D8: n = 4). The RV ESP was lower and the RV EF was higher in both the D4 and D8 treatment groups, compared to those in the V group. Cardiac output in the D8 group was increased compared to that in the V group (Table 3).
Figure 7.

Hemodynamic and morphometric analyses in the rat monocrotaline plus pneumonectomy (MCT+PN) model. A, Right ventricular (RV) systolic pressure: 75.7 ± 7.1 mmHG for V (n = 9), 40.4 ± 2.7 mmHg for D4 (n = 10), 43 ± 3.0 mmHg for D8 (n = 8); asterisks indicate P < 0.001 for V versus D4 and V versus D8. B, RV hypertrophy was decreased by treatment with PK10453. The weight ratio of (right ventricle + interventricular septum) to left ventricle ((RV + IVS)/LV) is shown; n = 11 for V, n = 13 for D4, and n = 7 for D8; asterisk indicates P < 0.001 for D4 versus V, and section sign (§) indicates P < 0.05 for D8 versus V. C, In the rat MCT+PN model, the lumen area/media area ratio was greater in the D8 (n = 5) treatment group than in the D4 (n = 6) and V (n = 6) groups; the asterisk indicates P < 0.0001 for D8 versus V and D8 versus D4. D, Occlusion analysis was performed on the same animal samples used for the lumen/media ratio analysis. This analysis showed a significant decrease in grade 2 (>50% occlusive) lesions in the D8 group; a pound sign (#) indicates P < 0.01. Treatment groups: V: vehicle only; D4: 4-minute PK10453 treatments 3 times/day for 2 weeks; D8: 8-minute PK10453 treatments 3 times/day for 2 weeks.
Table 3.
Rat monocrotaline plus pneumonectomy model
| Drug group | |||
|---|---|---|---|
| V | D4 | D8 | |
| n | 3 | 5 | 4 |
| HR, bpm | 290 ± 25 | 288 ± 19 | 315 ± 41 |
| ESP, mmHg | 83.21 ± 3.49 | 43.2 ± 6.08* | 38.44 ± 1.43* |
| EDP, mmHg | 10.31 ± 1.24 | 2.62 ± 0.3§ | 4.87 ± 1.86 |
| ESV, μL | 484.17 ± 148.32 | 144.14 ± 25.89 | 155.40 ± 22.69 |
| EDV, μL | 621.32 ± 139.49 | 408.95 ± 34.94 | 488.68 ± 52.00 |
| SV, μL | 137.15 ± 14.19 | 264.81 ± 12.66 | 333.28 ± 49.81** |
| CO, mL/min | 39.03 ± 0.62 | 77.59 ± 2.59 | 105.1 ± 15.51** |
| EF, % | 25.43 ± 8.36 | 65.4 ± 3.47** | 67.1 ± 4.59** |
| SW, mJ | 10,123 ± 2698 | 9818 ± 769 | 5481 ± 1829 |
The study animals underwent left pneumonectomy, followed 7 days later by 60 mg/kg monocrotaline (MCT), administered intraperitoneally. Two weeks after MCT administration, PK10453 or vehicle was given by inhalation 3 times a day for 2 weeks. Pressure-volume loops were acquired at the end of this period. Data are reported as mean ± SEM. Treatment groups: V = vehicle only; D4 = 4-minute inhalation treatment with PK10453; D8=8-minute inhalation treatment with PK10453. HR: heart rate (bpm: beats/min); ESP: end-systolic pressure; EDP: end-diastolic pressure; ESV: end-systolic volume; EDV: end-diastolic volume; SV: stroke volume; CO: cardiac output; EF: ejection fraction; SW: stroke work.
P < 0.001 versus V.
P ≤ 0.01 versus V.
P ≤ 0.05 versus V.
Effect of PK10453 on RV hypertrophy
Treatment with PK10453 resulted in a significant decrease in RV hypertrophy in the rat MCT+PN model (Fig. 7B). The (RV + IVS)/LV ratio in the vehicle group (V; n = 11) was 0.88 ± 0.05, that in the PK10453 D4 group (n = 13) was 0.62 ± 0.04, and that in the PK10453 D8 group (n = 7) was 0.68 ± 0.05 (P < 0.001 for D4 vs. V; P = 0.012 for D8 vs. V).
Pulmonary arteriole histology and morphometric analysis
The L/M was significantly higher in the PK10453-treated D8 group than in the D4 or vehicle (V) groups: 0.72 ± 0.05 for D8 (n = 5), 0.33 ± 0.06 for D4 (n = 6), and 0.26 ± 0.04 for V (n = 6; P < 0.0001 for D8 vs. V or D8 vs. D4; Fig. 7C). Occlusion analysis was performed on the same animal samples used for the L/M measurements. The occlusion analysis demonstrated a significant reduction in grade 2 occlusion lesions in the PK10453 D8 treatment group (V: 41.5% ± 7.1%; D4: 28.5% ± 4.2%; D8: 11.4% ± 4.1%; P < 0.01 for D8 vs. V; Fig. 7D). Figure 8A shows an H&E stain of an occlusive (grade 2) lesion in a vehicle-treated animal (MCT+PN model); comparison is made to a grade 0 vessel from a PK10453 (D8)-treated animal (Fig. 8B). An example of a grade 2 lesion stained for phospho-PDGFRβ is shown in Figure 8C, with comparison to a grade 0 lesion from a PK10453 (D8)-treated animal (MCT+PN model) in Figure 8D. Staining for phospho-PDGFRβ showed intense signal in a cobblestone pattern in grade 2 lesions.
Figure 8.

Effect of PK10453 on neointimal lesions in the rat monocrotaline plus pneumonectomy model. A, Hematoxylin and eosin (H&E) stain, vehicle-treated animal. B, H&E stain, PK10453-treated (8-minute exposure 3 times/week [D8]) animal. C, Phospho-PDGFRβ stain, vehicle-treated animal. D, Phospho-PDGFRβ stain, D8 animal. 40× objective. PDGFR: platelet-derived growth factor receptor.
Trichrome and immunohistochemistry for αSMC actin, and vWF
Immunohistochemistry for vascular SMCs (αSMC actin), endothelial cell markers (vWF), and trichrome stains of pulmonary arterioles in the rat MCT+PN model was performed to further characterize grade 0, 1, and 2 lesions. Grade 0 lesions were characterized by early neointimal (intraluminal) proliferation of endothelial cells (ECs), with preservation of vascular SMCs in the media, grade 1 or 2 lesions by neointimal (intraluminal) proliferation/invasion of mixed myofibroblast-like cells (MFs) and ECs with partial loss of vascular smooth muscle cells (SMCs) in the medial layer, and advanced Grade 2 lesions by extensive MF and EC intraluminal proliferation with complete loss of vascular SMCs in the medial layer and fibrotic replacement of the media (Fig. 9).
Figure 9.

Immunohistochemistry for alpha-smooth muscle actin (αSMC), trichrome, and von Willenbrand factor (vWF) stains showed a mixed population of endothelial and myofibroblast-like cells comprising the neointimal and proliferative lesions in pulmonary arterioles in grade 0–2 lesions. Grade 0 lesions were characterized by early intraluminal endothelial cell proliferation and the presence of vascular smooth muscle cells in the media (A, αSMC; D, trichrome; G, vWF). Grade 1–2 lesions had extensive intraluminal myofibroblast-like cells, some endothelial cells, and partial fibrosis of the medial layer (B, αSMC; E, trichrome; H, vWF). Advanced grade 2 lesions were characterized by extensive intraluminal myofibroblast-like and endothelial cell proliferation and complete fibrotic replacement of medial layer (C, αSMC; F, trichrome; I, vWF). Long arrows point to the intraluminal space with proliferative lesions, and short arrows point to the medial layer of the pulmonary arterioles. All photomicrographs were taken from a vehicle-treated animal (monocrotaline plus pneumonectomy model); 40× objective.
Immunohistochemistry for PDGF signaling
In precapillary pulmonary arterioles, signaling through the PDGFRβ pathway was dominant. Signal for the PDGF AA ligand and PDGFRα was present but qualitatively lower than signal for PDGF BB and PDGFRβ. Phosphorylated PDGFRβ had a cobblestone appearance in neointimal cells and in perivascular cells and was stronger than the signal for phospho-PDGFRα in precapillary pulmonary arterioles. Minimal signal for phospho-PDGFRβ or phospho-PDGFRα was detected in the medial layers of the precapillary pulmonary arterioles (Fig. 10). In larger (>50-μm) vessels, signal for phospho-PDGFRα was present in medial vascular SMCs. In contrast, phospho-PDGFRβ signal in the medial layer was low (Fig. 11).
Figure 10.

Platelet-derived growth factor receptor (PDGFR) signaling in the rat monocrotaline plus pneumonectomy model. A, PDGF AA in a pulmonary arteriole; B, PDGF BB; C, total PDGFRα; D, total PDGFRβ; E, phospho-PDGFRα; F, phospho-PDGFRβ. Signal intensity was greater for PDGF BB, PDGFRβ, and especially phospho-PDGFRβ than for PDGF AA, PDGFRα, and phospho-PDGFRα. The phospho-PDGFRβ signal was intense in a cobblestone pattern in neointimal proliferative and perivascular lesions. Signal intensity was relatively low in the vessel media layer. Arrows points to the vessel lumen containing proliferative lesions. All slides are from the vehicle-treated group, 40× objective.
Figure 11.

Comparison of phospho-PDGFRα and phospho-PDGFRβ in larger pulmonary arterioles (rat monocrotaline plus pneumonectomy model). Immunohistochemistry for phospho-PDGFRα demonstrated signal in the media. Arrows in A and B point to a smooth muscle cell positive for phosho-PDGFRα (A, 20× objective; B, 40× objective). In contrast, there was very little signal in the media for phospho-PDGFRβ (C, 20× objective; D, 40× objective). Signal for phospho-PDGFRβ was noted in perivascular cells (upper left corner of C and D) and endothelial cells. PDGFR: platelet-derived growth factor receptor.
NanoPro immunoassays and Western blots. NanoPro immunoassays for pAKT (phosphorylated AKT)/AKT are shown in Figure 12 and those for pSTAT3/STAT3 in Figure 13. There was a significant reduction in the ratio pAKT(Ser473)/AKT in the D8 group compared to that in the vehicle group. In both the D4 and D8 groups, the pSTAT3/STAT3 was decreased compared to that in the vehicle group. Figure 14 shows the effect of inhaled PK10453 on ppERK1/ERK1, pERK1/ERK1, ppERK2/ERK2, and pERK2/ERK2 (where “p” stands for “monophosphorylated and “pp” for “diphosphorylated”) in lung homogenates. There were significant reductions in ppERK1/ERK1 and pERK1/ERK1 in the D4 and D8 groups, compared to those in the vehicle group.
Figure 12.

A–D, NanoPro immunoassays for the monocrotaline plus pneumonectomy model: A, pAKT(Thr308) and total AKT, vehicle-treated animals; B, pAKT(Thr308) and total AKT, PK10453-treated animals; C, pAKT(Ser473) and total AKT, vehicle-treated animals; D, pAKT(Ser473) and total AKT, PK10453-treated animals. E, The pAKT(Thr308)/AKT ratio in lung extracts was not significantly different between the groups. F, The pAKT(Ser473)/AKT ratio in lung extracts was lower in the D8 group than in the V group (n = 5 for V and D8; n = 4 for D4); section sign (§) indicates P < 0.05 for D8 versus V. pAKT: phosphorylated AKT. Treatment groups in E, F: V: vehicle only; D4: 4-minute PK10453 treatments 3 times/day for 2 weeks; D8: 8-minute PK10453 treatments 3 times/day for 2 weeks.
Figure 13.

A, B, Examples of NanoPro immunoassay lumogram for pSTAT3 and STAT3 in MCT+PN (monocrotaline plus pneumonectomy) rats (A, vehicle treated; B, PK10453 treated). C, PK10453 treatment decreased pSTAT3/STAT3 in the lungs of rats in the MCT+PN model. pSTAT3: phosphorylated signal transducer and activator of transcription 3. Treatment groups: V: vehicle only; D4: 4-minute PK10453 treatments 3 times/day for 2 weeks; D8: 8-minute PK10453 treatments 3 times/day for 2 weeks, n = 4 for each group. Asterisk indicates P < 0.01 for D4 versus V; section sign (§) indicates P < 0.05 for D8 versus V.
Figure 14.

A–D, NanoPro immunoassay lumograms for phospho-ERK1/2 and total ERK1/2 in MCT+PN (monocrotaline plus pneumonectomy) rats: A, phospho-ERK1/2 in a vehicle-treated animal; B, phospho-ERK1/2 in a PK10453-treated animal; C, total ERK1/2, vehicle-treated animal; D, total ERK1/2, PK10453-treated animal. E, F, PK10453 decreased ppERK1/ERK1 (E) and pERK1/ERK1 (F) in the lung; asterisk indicates P < 0.001 for D8 versus V; section sign (§) indicates P < 0.05 for D4 versus V. G, H, No significant effect on ppERK2/ERK2 (G) or pERK2/ERK2 (H) was found. Treatment groups in E–H: V: vehicle only; D4: 4-minute PK10453 treatments 3 times/day for 2 weeks; D8: 8-minute PK10453 treatments 3 times/day for 2 weeks (n = 4 each group). In all panels, an initial “p” stands for “monophosphorylated, and “pp” stands for “diphosphorylated”; ERK1/2: extracellular signal-regulated kinase 1/2.
Body weights, systemic BP, and plethysmography studies
Compared to that in the vehicle group, there was a trend toward a slower rate of decline in body weight in the treated groups (data not shown). On day 7 of treatment, systolic BP was 111 ± 21 mmHg in the MCT vehicle group (n = 3), compared to 131 ± 10 mmHg in the MCT PK10453 group (n = 3). Two-chamber plethysmography was measured at days 1 and 15 of PK10453/vehicle administration in the rat MCT+PN model. The results are shown in Table 4. Treatment with PK10453 was associated with a slower decline in MV and a significant improvement in peak inspiratory flow (PIF) and peak expiratory flow (PEF) in the 4-minute exposure group (D4), compared to the vehicle group.
Table 4.
Summary of plethysmography data: rat monocrotaline plus pneumonectomy model
| Drug group | PIF, mL/s | PEF, mL/s | TV, mL | MV, mL/min | f, breaths/min | SRaw, cm H2O/s |
|---|---|---|---|---|---|---|
| Day 1 | ||||||
| V (n = 6) | 8.81 ± 0.79 | 9.68 ± 0.98 | 0.86 ± 0.14 | 193.66 ± 20.66 | 244.79 ± 28.02 | 40.37 ± 4.11 |
| D4 (n = 5) | 9.82 ± 0.70 | 11.04 ± 0.56 | 1.00 ± 0.07 | 223.24 ± 11.99 | 224.68 ± 9.87 | 39.73 ± 3.33 |
| D8 (n = 5) | 8.54 ± 0.72 | 9.43 ± 1.01 | 0.74 ± 0.15 | 174.68 ± 22.32 | 259.13 ± 26.42 | 36.01 ± 3.82 |
| Day 15 | ||||||
| V (n = 6) | 4.97 ± 0.39 | 5.86 ± 0.44 | 0.52 ± 0.07 | 107.59 ± 9.58 | 214.43 ± 13.83 | 38.93 ± 6.53 |
| D4 (n = 5) | 7.82 ± 0.34* | 9.33 ± 0.67* | 0.85 ± 0.12 | 176.12 ± 14.53§ | 217.12 ± 18.64 | 33.09 ± 4.80 |
| D8 (n = 5) | 6.06 ± 0.84 | 6.64 ± 0.99 | 0.63 ± 0.16 | 128.49 ± 19.47 | 232.11 ± 30.71 | 49.26 ± 7.11 |
Data are presented as mean ± SEM. PIF: peak inspiratory flow; PEF: peak expiratory flow; TV: tidal volume; MV: minute ventilation; f: breathing frequency; SRaw: airway resistance.
P < 0.01, D4 versus V.
P = 0.02, D4 versus V.
Discussion
This study demonstrated that a novel, nonselective PDGFR inhibitor, PK10453, when delivered by inhalation, prevented the progression of PAH in both the rat MCT and the rat MCT+PN models. Of note, this is the first study to report efficacy of PDGFR inhibition in the rat MCT+PN model. A sustained reduction in PA pressure was also found in ambulatory PAH (MCT+PN) animals treated with PK10453. Concomitant with a significant reduction of PA systolic pressure and RVSP in these models, a reduction in RV hypertrophy and an improvement in the L/M of pulmonary arterioles were demonstrated. PV loops displayed an improvement in RV EF, a higher cardiac output, and a trend toward lower stroke work in PK10453-treated animals, compared to those in control animals. In lung extracts of PK10453-treated animals, there was a significant reduction in the pAKT(Ser473)/AKT, pSTAT3/STAT3, ppERK1/ERK1, and pERK1/ERK1 ratios.
Because PAH is a disease substantially localized to the lung, we tested the hypothesis that direct administration of the drug to the target site via inhalation would offer the advantage of higher local concentrations (greater efficacy) and lower systemic concentrations of drug (lower side effects). Pharmacokinetic studies demonstrated a 45-fold advantage of inhalation delivery over IV administration of PK10453. While PK10453 decreased RVSP by 50% in the rat MCT model, it did not have an adverse effect on systemic BP. In addition, inhaled PK10453 did not appear to adversely affect lung function over a 2-week course of administration.
In the rat MCT model, we compared inhaled PK10453 to inhaled imatinib and found the two to be equally effective. These results are consistent with prior reports that the PDGFR inhibitor imatinib, when delivered systemically, decreased pulmonary hypertension in the rat MCT model.2 However, in the rat MCT+PN model, while inhaled PK10453 was effective in lowering pulmonary pressures, inhaled imatinib was not. The rat MCT+PN model is a more aggressive model of PAH than the MCT-only model and may more accurately reflect the pathology of the human disease.11 In vitro measurement of IC50 for inhibition of PDGFRα and PDGFRβ showed that PK10453 was more potent than imatinib against both isoforms and that imatinib is only a modest inhibitor of the PDGFRβ isoform. Immunohistochemistry demonstrated that the neointimal lesions in the rat MCT+PN model have high levels of phospho-PDGFRβ, with less phospho-PDGFRα. These findings could explain why nonselective inhibition of both PDGFRβ and PDGFRα provided a therapeutic advantage over selective inhibition of PDGFRα.
Our findings are consistent with those reported by Panzhinskiy et al.17 for the neonatal calf model of high altitude–induced pulmonary hypertension. In this model, extensive perivascular proliferation of adventitial fibroblasts was demonstrated, along with activation of phospho-PDGFRβ. These lesions are similar to the pattern we observed in the rat MCT+PN model. Our findings are also consistent with those reported for human PAH. Perros et al.1 described the distribution of PDGFA, PDGFB, PDGFRα, PDGFRβ, and phospho-PDGFRβ in pulmonary arterial lesions of patients with PAH. PDGFRα expression was found mainly within the muscular medial layer of hypertrophied pulmonary arterioles, whereas PDGFRβ and phospho-PDGFRβ were dominant in ECs of plexiform lesions.
The selectivity of imatinib for PDGFRα has not been previously emphasized in studies of PAH. Inhibition by imatinib of PDGF AA-stimulated PDGFRα phosphorylation was reported to be 0.1 μM, whereas inhibition of PDGF BB-stimulated PDGFRβ phosphorylation was 0.38 μM.18,19 In our studies, we found that, at  , imatinib was 8.5-fold more selective for PDGFRα than for PDGFRβ (IC50: 71 nM against PDGFRα vs. 607 nM against PDGFRβ). Most PAH-related cell-based studies interrogating the PDGFR pathway have used high doses of imatinib (5–10 μM), which would not allow a differentiation between inhibition of the PDGFRα isoform and that of the PDGFRβ isoform.1,20
Wu et al.21 examined PDGFR signaling in genetically defined mouse embryonic fibroblasts (MEFs). The MEFs were engineered to express only PDGFRα or PDGFRβ, both, or neither. Signaling through PDGFRα and PDGFRβ was found to have both shared and distinct pathways. Thirty-three gene sets were distinctly activated by PDGFRα and 15 by PDGFRβ. PDGFRα/β heterodimers activated components of NFκB (nuclear factor kappa-B) and IL-6 (interleukin-6) signaling. Calcium flux pathways were regulated by both PDGFRα and PDGFRβ. Signaling involved with angiogenesis was solely regulated through the PDGFRβ pathway. This finding is consistent with the selective increase in phospho-PDGFRβ that we found within the neointimal lesions of precapillary pulmonary arterioles of the rat MCT+PN model.
PDGF BB has been found to induce phosphorylation of AKT at Ser473 in PASMCs and fibroblasts but not in pulmonary arterial ECs.22,23 Increased phosphorylation of AKT(Ser473) was also found in cells with a smooth muscle phenotype from endarterectomies of patients with chronic thromboembolic PAH.24 PDGF BB stimulation increased store-operated calcium entry via the AKT/mTOR (mammalian target of rapamycin) pathway in these cells.23,24 In PASMCs from control and MCT-treated rats, imatinib (0.1 μM) decreased fetal calf serum–stimulated Ser473 AKT phosphorylation but had no effect on phosphorylation of AKT at Thr308.25 At this concentration, it is likely that imatinib was acting via PDGFRα. Wu et al.21 found that STI-571 (imatinib) at 5 μM blocked PDGF BB-stimulated AKT phosphorylation (Ser473) in both PDGFRβ-null and PDGFRα-null cell lines. We developed an in-cell Western assay to examine PDGF AA and PDGF BB stimulation of AKT(Ser473) and AKT(Thr308) phosphorylation in HLFs. We compared inhibition by imatinib of PDGF AA- or PDGF BB-stimulated phosphorylation of AKT to inhibition by PK10453 in this system and found that PK10453 was more potent. We used a nanofluidic proteomic immunoassay to quantify phosphorylated species of AKT, STAT3, and ERK1/2 in lung extracts of MCT+PN animals. We found a significant reduction of phospho-AKT(Ser473), phospho-STAT3, ppERK1/ERK, and pERK1/ERK1 in the PK10453-treated groups, compared to levels in the vehicle-treated group. Schermuly et al.2 demonstrated a reduction in phospho-ERK1/2 by imatinib in the rat MCT model of PAH. Jasmin et al.26 have shown activation of STAT3 in the rat MCT model, and Masri et al.27 found that STAT3 was activated in human iPAH. The nanofluidic proteomic immunoassays used in our study were previously used to examine the effects of imatinib on pSTAT3 and pERK1/2 in chronic myelogenous leukemia (CML).14 This assay has utility in distinguishing monophosphorylated and diphosphorylated isoforms of proteins. For example, patients with CML who responded to imatinib had a distinct reduction in levels of monophosphorylated ERK2.14 In our study, the ERK1 isoform and both the diphosphorylated form of ERK1 and the monophosphorylated form of ERK1 predominated in lungs of MCT+PN rats. Treatment with PK10453 significantly and selectively decreased ppERK1/ERK and pERK1/ERK1.
We performed an occlusion analysis according to the method of Homma et al.12 In the rat MCT+PN model, a higher dose of inhaled PK10453 was associated with fewer grade 2 occlusive lesions. We characterized these lesions by immunohistochemistry with markers for vascular SMCs and ECs and performed trichrome stains to differentiate muscular from fibrotic lesions. We found that the neointimal proliferative grade 1–2 lesions contained myofibroblasts and ECs. In advanced grade 2 lesions, there was fibrotic replacement of the vessel media. The origin of myofibroblasts in these lesions is not entirely clear. They could originate from infiltration of perivascular fibroblasts or pericytes, from circulating stem cells or resident progenitor cells, or as a consequence of endothelial-mesenchymal transition.28,29 While these lesions were detected at a single time point at the end of the study, it seems reasonable to propose that the type 0 lesion is an earlier-stage lesion that can progress to type 1 and type 2. In this model, intraluminal ECs proliferate, transition to a myofibroblast phenotype (and/or the lumen is infiltrated by perivascular cells/myofibroblasts), and progressively occlude the vessel lumen.
Sakao et al.30 have highlighted the importance of distinguishing regression of vascular muscularization (reverse remodeling) from potentially irreversible EC proliferation in PAH. Our data suggest that signaling through the PDGFRα pathway plays an important role in vascular remodeling of larger pulmonary arterioles in PAH, whereas the PDGFRβ pathway is more important in the proliferative neointimal lesions of precapillary pulmonary arterioles. Targeting the PDGFRβ pathway with a PDGFR inhibitor that potently blocks this isoform (more potently than imatinib) may influence progression of these lesions. We propose that if such lesions are treated before full fibrotic replacement and vessel regression, there may still be some reversibility of these lesions.
In conclusion, an inhaled nonselective PDGFR inhibitor, PK10453, was effective in both the MCT and MCT+PN rat models of PAH. Treatment with PK10453 was associated with a significant reduction in PA pressures in ambulatory animals, an improvement in RV function, and a reduction in RV hypertrophy. Histologic analysis demonstrated an improvement in the pulmonary arteriole L/M in animals treated with PK10453 and a decrease in the phosphorylation state of AKT(Ser473), STAT3, and ERK1. There was no significant effect of PK10453 on systemic BP and no adverse effect of PK10453 on lung function. In contrast to imatinib, PK10453 is not selective for PDGFRα but rather is highly potent against both the PDGFRα and PDGFRβ isoforms. Because the PDGFRβ pathway is more highly activated than the PDGFRα in plexiform lesions of PAH, a nonselective PDGFR inhibitor such as PK10453 may have advantages in the treatment of PAH. PK10453, when administered by inhalation, has potential as a treatment for PAH.
editor’s note
In an effort to maintain their ability to continue development of this or related compounds toward eventual clinical trials, the authors of this article prefer to disclose only the compound class. However, the authors are willing to provide the full structure to academic researchers and to provide samples to academic researchers under confidentiality agreements and material transfer agreements.
Source of Support: The research was supported by National Institutes of Health grants 1R43HL102946–01 and 2R44HL102946–02 to LSZ.
Conflicts of Interest: LSZ owns stock in Pulmokine. All other authors declare no conflict of interest.
References
- 1.Perros F, Montani D, Dorfmüller P, Durand-Gasselin I, Tcherakian C, Le Pavec J, Mazmanian M, et al. Platelet-derived growth factor expression and function in idiopathic pulmonary arterial hypertension. Am J Respir Crit Care Med 2008;178:81–88. [DOI] [PubMed]
- 2.Schermuly RT, Dony E, Ghofrani HA, Pullamsetti S, Savai R, Roth M, Sydykov A, et al. Reversal of experimental pulmonary hypertension by PDGF inhibition. J Clin Invest 2005;115:2811–2821. [DOI] [PMC free article] [PubMed]
- 3.Ghofrani HA, Morrell NW, Hoeper MM, Olschewski H, Peacock AJ, Barst RJ, Shapiro S, et al. Imatinib in pulmonary arterial hypertension patients with inadequate response to established therapy. Am J Respir Crit Care Med 2010;182:1171–1177. [DOI] [PMC free article] [PubMed]
- 4.Ghofrani HA, Seeger W, Grimminger F. Imatinib for the treatment of pulmonary arterial hypertension. N Engl J Med 2005;353:1412–1413. [DOI] [PubMed]
- 5.Hoeper MM, Barst RJ, Bourge RC, Feldman J, Frost AE, Galiè N, Gómez-Sánchez MA, et al. Imatinib mesylate as add-on therapy for pulmonary arterial hypertension: results of the randomized IMPRES study. Circulation 2013;127:1128–1138. [DOI] [PubMed]
- 6.Paniagua RT, Robinson WH. Imatinib for the treatment of rheumatic diseases. Nat Clin Pract Rheumatol 2007;3:190–191. [DOI] [PubMed]
- 7.Fujita H, Fukumoto Y, Saji K, Sugimura K, Demachi J, Nawata J, Shimokawa H. Acute vasodilator effects of inhaled fasudil, a specific Rho-kinase inhibitor, in patients with pulmonary arterial hypertension. Heart Vessels 2010;25:144–149. [DOI] [PubMed]
- 8.Nagaoka T, Fagan KA, Gebb SA, Morris KG, Suzuki T, Shimokawa H, McMurtry IF, Oka M. Inhaled Rho kinase inhibitors are potent and selective vasodilators in rat pulmonary hypertension. Am J Respir Crit Care Med 2005;171:494–499. [DOI] [PubMed]
- 9.Chen H, Kovar J, Sissons S, Cox K, Matter W, Chadwell F, Luan P, Vlahos CJ, Schutz-Geschwender A, Olive DM. A cell-based immunocytochemical assay for monitoring kinase signaling pathways and drug efficacy. Anal Biochem 2005;338:136–142. [DOI] [PubMed]
- 10.Sakagami M. In vivo, in vitro and ex vivo models to assess pulmonary absorption and disposition of inhaled therapeutics for systemic delivery. Adv Drug Deliv Rev 2006;58:1030–1060. [DOI] [PubMed]
- 11.White RJ, Meoli DF, Swarthout RF, Kallop DY, Galaria II, Harvey JL, Miller CM, et al. Plexiform-like lesions and increased tissue factor expression in a rat model of severe pulmonary arterial hypertension. Am J Physiol Lung Cell Mol Physiol 2007;293:L583–L590. [DOI] [PubMed]
- 12.Homma N, Nagaoka T, Karoor V, Imamura M, Taraseviciene-Stewart L, Walker LA, Fagan KA, McMurtry IF, Oka M. Involvement of RhoA/Rho kinase signaling in protection against monocrotaline-induced pulmonary hypertension in pneumonectomized rats by dehydroepiandrosterone. Am J Physiol Lung Cell Mol Physiol 2008;295:L71–L78. [DOI] [PMC free article] [PubMed]
- 13.Iacovides DC, Johnson AB, Wang N, Boddapati S, Korkola J, Gray JW. Identification and quantification of AKT isoforms and phosphoforms in breast cancer using a novel nanofluidic immunoassay. Mol Cell Proteomics 2013;12:3210–3220. [DOI] [PMC free article] [PubMed]
- 14.Fan AC, Deb-Basu D, Orban MW, Gotlib JR, Natkunam Y, O’Neill R, Padua R-A, et al. Nanofluidic proteomic assay for serial analysis of oncoprotein activation in clinical specimens. Nat Med 2009;15:566–571. [DOI] [PMC free article] [PubMed]
- 15.Hitzman CJ, Wattenberg LW, Wiedmann TS. Pharmacokinetics of 5-fluorouracil in the hamster following inhalation delivery of lipid-coated nanoparticles. J Pharm Sci 2006;95:1196–1211. [DOI] [PubMed]
- 16.Zhang G, David A, Wiedmann TS. Performance of the vibrating membrane aerosol generation device: Aeroneb Micropump Nebulizer. J Aerosol Med 2007;20:408–416. [DOI] [PubMed]
- 17.Panzhinskiy E, Zawada WM, Stenmark KR, Das M. Hypoxia induces unique proliferative response in adventitial fibroblasts by activating PDGFβ receptor-JNK1 signalling. Cardiovasc Res 2012;95:356–365. [DOI] [PMC free article] [PubMed]
- 18.Buchdunger E, Cioffi CL, Law N, Stover D, Ohno-Jones S, Druker BJ, Lydon NB. Abl protein-tyrosine kinase inhibitor STI571 inhibits in vitro signal transduction mediated by c-kit and platelet-derived growth factor receptors. J Pharmacol Exp Ther 2000;295:139–145. [PubMed]
- 19.Deininger M, Buchdunger E, Druker BJ. The development of imatinib as a therapeutic agent for chronic myeloid leukemia. Blood 2005;105:2640–2653. [DOI] [PubMed]
- 20.Ciuclan L, Hussey MJ, Burton V, Good R, Duggan N, Beach S, Jones P, et al. Imatinib attenuates hypoxia-induced pulmonary arterial hypertension pathology via reduction in 5-hydroxytryptamine through inhibition of tryptophan hydroxylase 1 expression. Am J Respir Crit Care Med 2013;187:78–89. [DOI] [PubMed]
- 21.Wu E, Palmer N, Tian Z, Moseman AP, Galdzicki M, Wang X, Berger B, Zhang H, Kohane IS. Comprehensive dissection of PDGF-PDGFR signaling pathways in PDGFR genetically defined cells. PLoS ONE 2008;3:e3794. [DOI] [PMC free article] [PubMed]
- 22.Nakamura K, Akagi S, Ogawa A, Kusano KF, Matsubara H, Miura D, Fuke S, et al. Pro-apoptotic effects of imatinib on PDGF-stimulated pulmonary artery smooth muscle cells from patients with idiopathic pulmonary arterial hypertension. Int J Cardiol 2011;159:100–106. [DOI] [PubMed]
- 23.Ogawa A, Firth AL, Smith KA, Maliakal MV, Yuan JX. PDGF enhances store-operated Ca2+ entry by upregulating STIM1/Orai1 via activation of Akt/mTOR in human pulmonary arterial smooth muscle cells. Am J Physiol Cell Physiol 2012;302:C405–C411. [DOI] [PMC free article] [PubMed]
- 24.Ogawa A, Firth AL, Yao W, Madani MM, Kerr KM, Auger WR, Jamieson SW, Thistlethwaite PA, Yuan JX. Inhibition of mTOR attenuates store-operated Ca2+ entry in cells from endarterectomized tissues of patients with chronic thromboembolic pulmonary hypertension. Am J Physiol Lung Cell Mol Physiol 2009;297:L666–L676. [DOI] [PMC free article] [PubMed]
- 25.Houssaini A, Abid S, Mouraret N, Wan F, Rideau D, Saker M, Marcos E, et al. Rapamycin reverses pulmonary artery smooth muscle cell proliferation in pulmonary hypertension. Am J Respir Cell Mol Biol 2013;48:568–577. [DOI] [PMC free article] [PubMed]
- 26.Jasmin JF, Mercier I, Dupuis J, Tanowitz HB, Lisanti MP. Short-term administration of a cell-permeable caveolin-1 peptide prevents the development of monocrotaline-induced pulmonary hypertension and right ventricular hypertrophy. Circulation 2006;114:912–920. [DOI] [PubMed]
- 27.Masri FA, Xu W, Comhair SAA, Asosingh K, Koo M, Vasanji A, Drazba J, Anand-Apte B, Erzurum SC. Hyperproliferative apoptosis-resistant endothelial cells in idiopathic pulmonary arterial hypertension. Am J Physiol Lung Cell Mol Physiol 2007;293:L548–L554. [DOI] [PubMed]
- 28.Piera-Velazquez S, Li Z, Jimenez SA. Role of endothelial-mesenchymal transition (endoMT) in the pathogenesis of fibrotic disorders. Am J Pathol 2011;179:1074–1080. [DOI] [PMC free article] [PubMed]
- 29.Yeager ME, Frid MG, Stenmark KR. Progenitor cells in pulmonary vascular remodeling. Pulm Circ 2011;1:3–16. [DOI] [PMC free article] [PubMed]
- 30.Sakao S, Tatsumi K, Voelkel NF. Reversible or irreversible remodeling in pulmonary arterial hypertension. Am J Respir Cell Mol Biol 2010;43:629–634. [DOI] [PMC free article] [PubMed]