

Abstract Abstract
Normal resting mean pulmonary artery pressure (PAP) is 8–20 mmHg. Pulmonary hypertension is defined as mean PAP of ≥25 mmHg. Borderline PAP levels of 21–24 mmHg are of unclear significance. We sought to determine the clinical characteristics and survival of subjects with mean PAP of 21–24 mmHg. We examined 1,491 patients enrolled in the Cleveland Clinic Pulmonary Hypertension Registry between February 1990 and May 2012 with baseline right heart catheterization. The relationship between PAP and all-cause mortality was assessed by Cox models and a tree-based analysis. Sixty-three patients had borderline PAP (underlying conditions: 12 left heart disease, 20 respiratory disease, 17 connective-tissue disease, 4 others, and 10 none). We then compared 3 groups: borderline PAP without heart or lung disease ( ), normal PAP without heart or lung disease (
 ), and category 1 pulmonary arterial hypertension (PAH;
  ). Borderline-PAP patients had levels of hemodynamic and functional compromise between those for normal-PAP patients and those for patients with PAH. Borderline PAP was associated with increased mortality compared to normal PAP (hazard ratio: 4.03 [95% confidence interval: 0.78–20.80],
  ). A tree-based analysis demonstrated almost identical cut points in mean PAP (≤20, 21–26, and ≥27 mmHg) associated with differential survival (
 ). Connective-tissue disease and an elevated transpulmonary gradient were predictors of worse survival in the borderline-PAP population. Borderline PAP elevation is associated with decreased survival, particularly in the context of connective-tissue disease and an elevated transpulmonary gradient.
Keywords: pulmonary artery pressure, pulmonary hypertension, pulmonary heart disease, survival
Introduction
A diagnosis of pulmonary arterial hypertension (PAH) carries deep psychological1 and financial2 consequences. Patients and families fear the dismal prognosis of the disease,3 which remains suboptimal even in the current treatment era.4 Thus, a careful definition of the disease is critical. While the sharp distinction between pulmonary hypertension, a hemodynamic and pathophysiologic state, and PAH, a group of relatively rare conditions, is of paramount importance,5 a key step is the determination of whether abnormally elevated pulmonary artery pressure (PAP) is present.
Pulmonary hypertension was first defined as a level of mean PAP greater than 25 mmHg during the First World Symposium on Pulmonary Hypertension sponsored by the World Health Organization (WHO) in 1973; the cutoff was arrived at by debate and consensus among experts.6 The World Symposium conference held in 2008 modified this slightly (mean PAP ≥25 mmHg),7 but acknowledged that a recent systematic review of all the available literature identified the normal resting mean PAP in adults to be  mmHg.8 By adding 2 standard deviations to that normal mean PAP, an upper limit of normal of 20 mmHg was obtained, thus leaving an area, mean PAP between 21 and 24 mmHg, of unclear significance. While the term “borderline pulmonary hypertension” was contemplated, the idea was rejected, and the need to characterize patients with PAP in this range was emphasized.7 The debate carried on in the most recent World Symposium, held in Nice in February 2013. We conducted this study to assess the clinical characteristics and survival of patients with mean PAP between 21 and 24 mmHg, compared to those with normal PAP and those with category 1 PAH.
Material and Methods
Population and data collection
The Cleveland Clinic Pulmonary Hypertension registry was established in May 2005 (IRB protocol 8097). Consecutive patients seen by the Pulmonary Vascular Group before May 2005 were entered retrospectively, and those seen after that date were entered prospectively. For this study, the registry was queried in May 2012. Data collected include demographics, comorbidities, body mass index, right heart catheterization (RHC), Doppler echocardiography, 6-minute walk distance, pulmonary function testing, B-type natriuretic peptide levels, complete blood counts and chemistries, and PAH-targeted therapies, both at baseline and during follow-up. A group of expert heart failure cardiologists performed all RHC. Pressure tracings were recorded on a paper strip, and hemodynamic measurements were obtained by averaging several breathing cycles at end-expiration. The mid–right atrium level was used as the zero reference level, estimated by the midaxillary line or the top of the humerus head.
Patients with baseline RHC data available before the start of PAH-targeted therapies were included and divided into three groups: those with normal PAP, defined as mean PAP less than or equal to 20 mmHg; those with borderline PAP, defined as mean PAP between 21 and 24 mmHg (inclusive); and those with pulmonary hypertension, defined as mean PAP greater than or equal to 25 mmHg. For patients with normal and borderline PAP, we investigated the reason RHC was indicated and all underlying comorbidities. Specifically, we collected information regarding underlying conditions known to be associated with pulmonary vascular disease according to the latest WHO diagnostic classification of pulmonary hypertension.9 Any patient with pulmonary artery wedge pressure (PAWP) greater than 15 mmHg and/or Doppler echocardiographic evidence of valvular disease or left ventricular dysfunction was classified as having left heart disease. Respiratory disease was defined as the presence of any of the following: ratio of forced expiratory volume in 1 s to forced vital capacity less than or equal to 0.60, total lung capacity or forced vital capacity percent predicted less than or equal to 60%,10 obstructive sleep apnea, combined restrictive and obstructive lung disease, or alveolar hypoventilation syndrome. Connective-tissue disease was diagnosed by expert rheumatologists at the Cleveland Clinic.
Among patients with mean PAP greater than or equal to 25 mmHg, we identified those with diagnostic category 1 PAH first by selecting patients with PAWP less than or equal to 15 mmHg plus pulmonary vascular resistance greater than or equal to 3 Wood units plus preserved pulmonary function. The latter was defined as a ratio of forced expiratory volume in 1 s to forced vital capacity greater than 0.60 and total lung capacity or forced vital capacity percent predicted greater than 60%. Then, each case was reviewed by one of the authors in order to classify the patient into one of the current diagnostic categories based on the diagnostic impression of the treating pulmonary hypertension expert and the author’s interpretation of the medical record data. In case of discrepancy or doubt, the case was discussed among all the authors to reach a conclusion by consensus.
All-cause mortality was determined in all subjects by manual and electronic query of the medical record and the Social Security Death Index in May 2012. Patients who were alive at that point were censored for the survival analysis. Entry point into the study was the date of the diagnostic RHC. All baseline variables described were obtained closest to the RHC.
Statistical methods
Analyses were performed with R, version 2.14.2.11 Categorical variables were summarized as frequency (%), and continuous variables were summarized as mean ± standard deviation. Comparisons across the three groups were performed with χ2 tests, the Fisher exact test, or the Kruskal-Wallis test, as appropriate. Pairwise comparisons between groups were done with the Fisher exact test or the χ2 test for categorical variables and with the Wilcoxon rank-sum test for quantitative and ordinal variables. Kaplan-Meier curves were used to describe the time from the diagnostic RHC to all-cause mortality. Patients were censored if they underwent lung transplantation. Groups were compared with the log-rank test, and 1-, 3-, and 5-year estimates of survival were calculated with their respective 95% confidence intervals (CIs). Univariate Cox proportional-hazard models were used to estimate the hazard ratios (HRs) for death according to baseline mean PAP and with respect to other study variables. A multivariable Cox model was used specifically to adjust for patients’ age and sex.
We applied a tree-based procedure using the R function rpart to identify cut points of mean PAP that had optimal discriminatory ability with regard to all-cause mortality as the outcome. Beginning with the entire set of patients, each possible threshold of mean PAP was evaluated to find the split that formed two groups with the greatest difference in patient survival, as measured by estimated event rates after exponential scaling.12 Within the patient subsets defined by the first split, the process was repeated to identify optimal splits at a second level. This repeated splitting was stopped when the goodness of fit of the tree model could no longer be improved with further splits or when resulting subgroups fell in size to less than 20 patients. Analyses comparing the tree-based groups with respect to survival were then performed to demonstrate the utility of the identified splits. These analyses allowed us to use our data to estimate which cut points of mean PAP might be best for discriminating survival, rather than assessing only previously established cut points. We also performed standard receiver operating characteristic (ROC) curve analysis.
Results
Population and baseline characteristics
Figure 1 depicts a flow chart of the study population. There were 1,491 patients seen by the Cleveland Clinic Pulmonary Vascular Program with a baseline RHC (before targeted therapy) between February 1990 and May 2012. Eighty-five patients (5.7%) had a mean PAP less than or equal to 20 mmHg, 63 (4.2%) had a mean PAP between 21 and 24 mmHg, and 1,343 (90.1%) had a mean PAP greater than or equal to 25 mmHg. Among patients with pulmonary hypertension, 387 had WHO category 1 PAH, according to established diagnostic guidelines:9 150 idiopathic (38.7%), 20 heritable (5.2%), 9 anorexigen-induced (2.3%), and 208 associated PAH (53.7%; 111 connective-tissue disease, 49 congenital heart disease, 44 portal hypertension, 3 human immunodeficiency virus infection, and 1 chronic hemolytic anemia).
Figure 1.
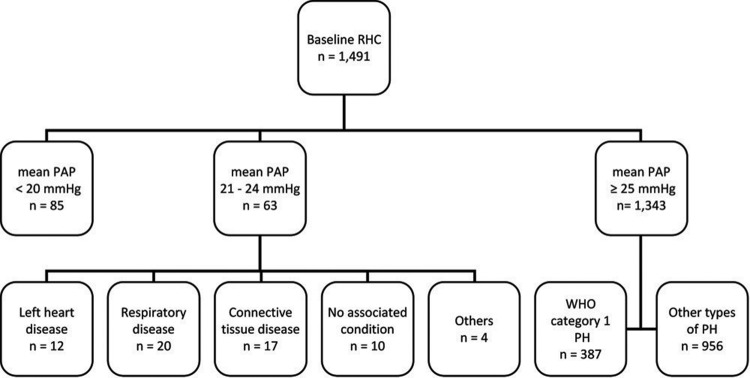
Study population flow chart. RHC: right heart catheterization; PAP: pulmonary artery pressure; WHO: World Health Organization; PH: pulmonary hypertension.
Table 1 shows the associated conditions in the 63 patients with mean PAP between 21 and 24 mmHg and the 85 patients with mean PAP less than or equal to 20 mmHg. Eight patients with borderline PAP believed to be due to heart disease had a PAWP of >15 mmHg, including all 5 with diastolic dysfunction and 3 with valvular heart disease. Hereafter, we compare subjects without left heart or respiratory disease ( for borderline PAP,
  for normal PAP) with WHO group 1 PAH patients, unless otherwise noted.
Table 1.
Associated conditions in patients with normal and borderline mean pulmonary artery pressure (PAP)
| Underlying condition | Normal PAPa (%), n = 85 | Borderline PAP (%), n = 63 |
|---|---|---|
| Heart disease | 12 (14.1) | 12 (19) |
| Diastolic dysfunction | 4 | 5 |
| Valvular disease | 5 | 5 |
| Systolic dysfunction/pulmonary vein stenosis | 1/0 | 1/1 |
| Post–heart transplant | 2 | 0 |
| Respiratory disease | 24 (28.2) | 20 (32) |
| Chronic obstructive pulmonary disease | 2 | 5 |
| Obstructive sleep apnea | 12 | 4 |
| Interstitial lung disease | 10 | 3 |
| Overlap syndrome | 0 | 3 |
| Mixed restriction and obstruction | 0 | 2 |
| Otherb | 0 | 3 |
| Connective-tissue disease | 11 (12.9) | 17 (27) |
| Scleroderma | 4 | 11 |
| Mixed connective-tissue disease | 1 | 4 |
| Rheumatoid arthritis | 1 | 2 |
| Systemic lupus erythematosus | 3 | 0 |
| Dermatomyositis | 2 | 0 |
| Others | 5 (5.9) | 4 (6) |
| Chronic thromboembolic disease | 0 | 2 |
| Portal hypertension | 1 | 1 |
| Anorexigen | 2 | 1 |
| Hyperthyroidism | 1 | 0 |
| Sickle cell disease | 1 | 0 |
| None | 35 (41.2) | 10 (16) |
One subject had both interstitial lung disease and valvular heart disease; another one had both rheumatoid arthritis and chronic obstructive pulmonary disease.
Other respiratory diseases included 1 case each of cystic fibrosis, alveolar hypoventilation, and extraparenchymal restriction.
All patients with borderline elevation in mean PAP had dyspnea on exertion upon presentation. Other common symptoms included chest discomfort (36%), cough (32%), fatigue (29%), and peripheral edema (29%). Symptoms in the normal-PAP group included dyspnea (76%), chest discomfort (41%), light-headedness (33%), fatigue (33%), cough (31%), and peripheral edema (22%). The indication for RHC and the clinical features of subjects with normal PAP, borderline PAP, and category 1 PAH are shown in Table 2. Subjects with borderline PAP had hemodynamic and functional compromise between those for normal-PAP subjects and those for PAH patients. Scleroderma patients had normal PAWP: a median of 9.5 mmHg (interquartile range [IQR]: 7.25–11.75). The rest of the borderline-PAP cohort, excluding those with heart and lung disease, had similar PAWP: median of 11 mmHg (IQR: 8–14),  . When subjects with heart and lung disease were included, the rest of the borderline-PAP subjects had a higher PAWP: a median of 12 mmHg (IQR: 9–14),
  . Baseline echocardiographic data were available for 39 of the 51 normal-PAP subjects and 26 of the 31 borderline-PAP subjects. Right ventricular systolic pressure was higher in borderline-PAP patients (median: 47 mmHg [IQR: 34–57.5]) than in normal-PAP subjects (median: 37 mmHg [IQR: 26.2–45.7],
  ).
).
Table 2.
Clinical features of patients with normal PAP, borderline PAP, and PAH
| Normal PAP, n = 51 | Borderline PAP, n = 31 | PAH, n = 387 | P | |
|---|---|---|---|---|
| Age, years | 51 ± 17a | 59 ± 14 | 54 ± 15 | 0.07 |
| Female sex, n (%) | 45 (88.2) | 27 (90) | 299 (77.3) | 0.07 |
| RHC indication, n (%) | ||||
| Elevated RVSP | 29 (56.9) | 22 (70.9) | … | … |
| Dyspnea of obscure etiology | 16 (31.4) | 6 (19.3) | … | … |
| Scleroderma plus dyspnea | 3 (5.9) | 3 (9.7) | … | … |
| Otherb | 3 (5.9) | … | … | … |
| BMI ≥ 30, n (%) | 15 (29.4) | 9 (30), n = 30 | 140 (37.6), n = 372 | 0.4 |
| MAP, mmHg | 93 ± 14 | 93 ± 12 | 95 ± 15 | 0.82 |
| HR, beats/min | 78 ± 15 | 74 ± 10 | 83 ± 14c | <0.001 |
| RAP, mmHg | 4.20 ± 2.19a | 6.81 ± 3.66 | 10.08 ± 6.73c | <0.001 |
| CI, L/min/m2 | 3.23 ± 0.89 | 3.04 ± 0.64 | 2.43 ± 0.88c | <0.001 |
| PVR, Wood units | 1.46 ± 0.61a | 2.22 ± 1.00 | 10.99 ± 6.45c | <0.001 |
| TPG, mmHg | 7.59 ± 2.65a | 11.94 ± 2.93 | 41.07 ± 14.32c | <0.001 |
| 6MWD, m | 408 ± 141, n = 29 | 391 ± 101, n = 20 | 321 ± 117, n = 308c | <0.001 |
| BNP (IQR), pg/mL | 28 (15–69), n = 29 | 36 (26–141), n = 18 | 187 (67–500), n = 254c | <0.001 |
Data are mean ± SD unless otherwise noted. P values are adjusted for age. PAP: pulmonary artery pressure; PAH: pulmonary arterial hypertension; RHC: right heart catheterization; RVSP: right ventricular systolic pressure; BMI: body mass index; MAP: mean arterial pressure; HR: heart rate; RAP: right atrial pressure; CI: cardiac index; PVR: pulmonary vascular resistance; TPG: transpulmonary gradient; 6MWD: 6-minute walk distance; BNP: B-type natriuretic peptide; IQR: interquartile range.
 between borderline PAP and normal PAP.
1 chest discomfort, 1 family history of PAH, and 1 light-headedness.
 between borderline PAP and PAH.
Survival and mean PAP cut points
There was a progressively worse survival as mean PAP increased from normal to borderline to overt PAH. One-, 3-, and 5-year survival among the three groups was as follows: 100%, 97.8% (CI: 85.8%–99.7%), and 97.8% (CI: 85.8%–99.7%) for normal PAP; 100%, 96.8% (CI: 79.2%–99.5%), and 80.9% (CI: 55.9%–92.6%) for borderline PAP; and 80.9% (CI: 76.6%–84.6%), 65.1% (CI: 60.1%–69.8%), and 53.4% (CI: 47.9%–58.5%) for PAH, respectively ( ; Fig. 2). Borderline PAP was associated with a 4-fold increase in mortality, compared to normal PAP. This result was of borderline statistical significance. PAH was associated with a 15-fold increase in mortality, compared to normal PAP, and a 3.7-fold increase when compared to borderline PAP. These results were largely unchanged when adjusted for age and sex (Table 3). When patients with heart or respiratory comorbidity were included in the normal- and borderline-PAP groups, the increasing hazard of death was similar, although with a smaller effect size (Table 4).
Figure 2.
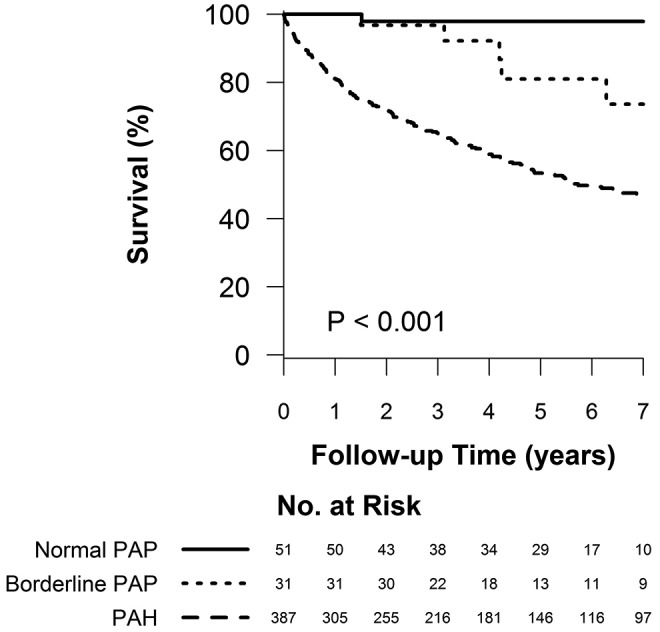
Survival of patients with normal pulmonary artery pressure (PAP), borderline PAP, and group 1 pulmonary arterial hypertension (PAH).  for the pairwise comparison between normal and borderline PAP;
  for the pairwise comparison between group 1 PAH and borderline PAP.
Table 3.
Hazard of death according to mPAP
| Univariate HR | Adjusted HRa | |||||
|---|---|---|---|---|---|---|
| Variable | Reference | Comparator | HR (95% CI) | P | HR (95% CI) | P |
| mPAP | Normal | Borderline | 4.03 (0.78–20.80) | 0.09 | 3.08 (0.60–15.90) | 0.18 |
| mPAP | Normal | PAH | 15.0 (3.72–60.3) | <0.001 | 13.5 (3.35–54.40) | <0.001 |
| mPAP | Borderline | PAH | 3.72 (1.53–9.04) | 0.004 | 4.38 (1.80–10.70) | 0.001 |
| Age | Per 5 years | … | … | 1.15 (1.10–1.21) | <0.001 | |
| Sex | Female | Male | … | … | 1.17 (0.83–1.63) | 0.37 |
mPAP: mean pulmonary artery pressure; HR: hazard ratio; CI: confidence interval; PAH: pulmonary arterial hypertension.
Adjusted for age and sex.
Table 4.
Hazard of death according to mPAP including patients with heart and respiratory disease in the normal- and borderline-PAP cohorts
| Univariate HR | Adjusted HRa | |||||
|---|---|---|---|---|---|---|
| Variable | Reference | Comparator | HR (95% CI) | P | HR (95% CI) | P |
| mPAP | Normal | Borderline | 2.24 (0.81–6.17) | 0.12 | 1.77 (0.64–4.89) | 0.27 |
| mPAP | Normal | PAH | 8.34 (3.70–18.8) | <0.001 | 8.23 (3.65–18.5) | <0.001 |
| mPAP | Borderline | PAH | 3.72 (1.97–7.03) | <0.001 | 4.64 (2.45–8.80) | <0.001 |
| Age | Per 5 years | … | … | 1.17 (1.11–1.22) | <0.001 | |
| Sex | Female | Male | … | … | 1.27 (0.92–1.75) | 0.15 |
mPAP: mean pulmonary artery pressure; HR: hazard ratio; CI: confidence interval; PAH: pulmonary arterial hypertension.
Adjusted for age and sex.
The tree-based analysis identified 26 and 21 mmHg as the levels of mean PAP with the highest ability to separate survivors and nonsurvivors. On the basis of these optimal splits, three groups of patients are formed: mean PAP less than or equal to 20 mmHg, mean PAP between 21 and 26 mmHg, and mean PAP greater than or equal to 27 mmHg. One-, 3-, and 5-year survival in each of these groups was 100%, 97.9% (CI: 85.8%–99.7%), and 97.9% (CI: 85.8%–99.7%) for mean PAP of ≤20 mmHg; 100%, 97.3% (CI: 82.3%–99.6%), and 83.8% (CI: 61.5%–93.8%) for mean PAP of 21–26 mmHg; and 80.6% (CI: 76.3%–84.3%), 64.6% (CI: 59.4%–69.3%), and 52.7% (CI: 47.2%–57.9%) for mean PAP of ≥27 mmHg, respectively ( ; Fig. 3; Table 5). An ROC curve analysis was also used to identify an optimal mean PAP cutoff, and just as in the tree-based procedure, the optimal split was between ≤26 and ≥27 mmHg (Fig. 4A), with the next optimal split at ≤20 versus 21–26 mmHg in the ≤26-mmHg subset (Fig. 4B).
Figure 3.
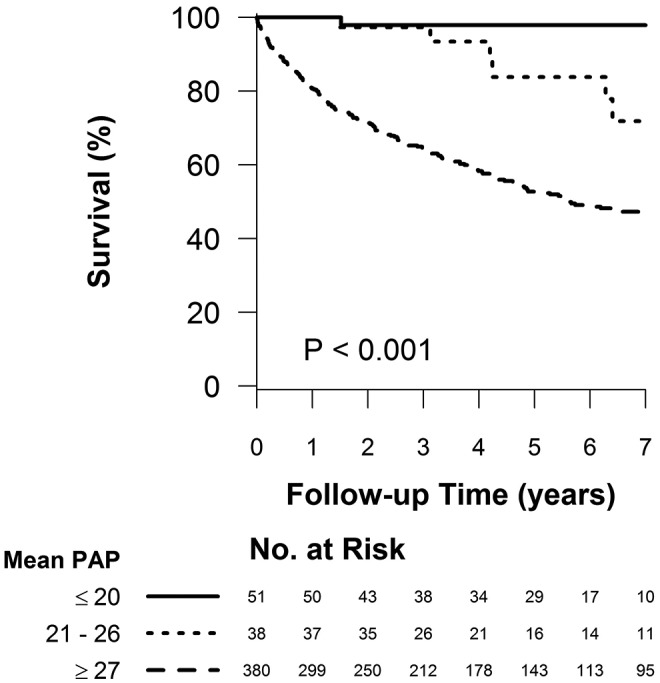
Survival of patients according to the tree-based analysis–identified cut points.  for the pairwise comparison between mean pulmonary artery pressures (PAPs) of ≤20 and 21–26 mmHg;
  for the pairwise comparison between mean PAPs of 21–26 and ≥27 mmHg.
Table 5.
Hazard of death according to tree analysis–identified mPAP cutoffs
| Univariate HR | Adjusted HRa | |||||
|---|---|---|---|---|---|---|
| Variable | Reference | Comparator | HR (95% CI) | P | HR (95% CI) | P |
| mPAP | ≤20 mmHg | 21–26 mmHg | 4.02 (0.81–19.9) | 0.09 | 2.94 (0.59–14.6) | 0.19 |
| mPAP | ≤20 mmHg | ≥27 mmHg | 15.2 (3.77–61.2) | <0.001 | 13.9 (3.44–55.9) | <0.001 |
| mPAP | 21–26 mmHg | ≥27 mmHg | 3.78 (1.68–8.52) | 0.001 | 4.73 (2.09–10.7) | <0.001 |
| Age | Per 5 years | … | … | 1.16 (1.10–1.22) | <0.001 | |
| Sex | Female | Male | … | … | 1.16 (0.83–1.62) | 0.37 |
mPAP: mean pulmonary artery pressure; HR: hazard ratio; CI: confidence interval; PAH: pulmonary arterial hypertension.
Adjusted for age and sex.
Figure 4.
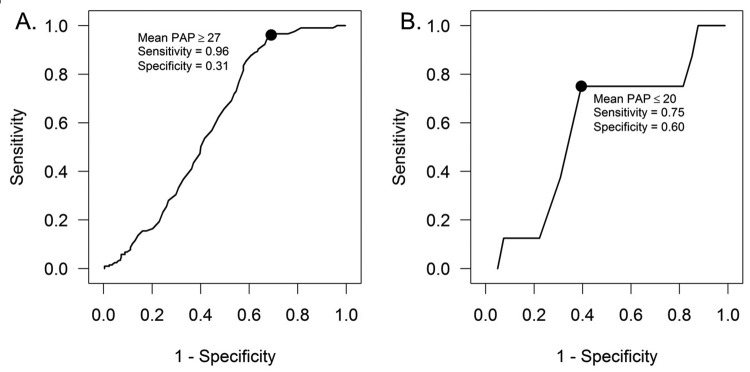
Receiver operating characteristic (ROC) curves showing that the optimal split in mean pulmonary artery pressure (PAP) associated with survival was between ≤26 and ≥27 mmHg (A), with the next optimal split at ≤20 versus 21–26 mmHg in the subset of patients with mean PAP ≤26 mmHg (B).
Predictors of survival in borderline-PAP patients
When borderline PAP elevation was associated with connective-tissue disease, the prognosis was worse than that for other associated conditions or none (5-year survival: 67.1% [CI: 33.1%–86.6%] vs. 100%,  ; see Fig. 5A). An elevated transpulmonary gradient (TPG) was also associated with worse survival (Fig. 5B; HR for a 1-unit increase in TPG: 1.75 [95% CI: 1.10–2.76],
  ). Similarly, higher pulmonary vascular resistance (PVR) also carried a worse prognosis (HR for 1–Wood unit increase: 3.41 [95% CI: 1.25–9.34],
  ). A limited 6-minute walk distance and the presence of right atrial dilation on echocardiography were also predictors of worse survival (Fig. 5C and 5D, respectively), as well as higher B-type natriuretic peptide levels (HR for every 50-pg/mL increase: 1.25 [95% CI: 1.00–1.55],
  ).
).
Figure 5.

Predictors of mortality in the borderline–pulmonary artery pressure (PAP) population. Underlying connective-tissue disease (CTD), compared to any other or no associated (Assoc.) condition (A), elevated transpulmonary gradient (TPG; the cutoff of 15 mmHg was selected by recursive partitioning, with an imposed minimum group size of 5 after splitting; B), a lower 6-minute walk distance (6MWD in meters; C), and the presence of right atrial (RA) dilation (D) were associated with decreased survival.
Follow-up RHC
Six subjects of the 31 with borderline PAP underwent a second RHC after a median of 16 months (range: 1–39 months). Three patients had associated connective-tissue disease, 1 had chronic pulmonary embolism, and 2 had no underlying conditions. Indications for the repeat RHC were as follows: persistently elevated right ventricular systolic pressure on echocardiography in 4 patients and the need to obtain hemodynamic measurements during exercise in 2. Three patients (2 with connective-tissue disease and 1 with chronic pulmonary embolism) had a mean PAP greater than 25 mmHg, while the other 3 remained without pulmonary hypertension. There was 1 death in each of these groups. On average, there was a trend toward hemodynamic deterioration. The diastolic PAP increased by a median of 4 mmHg (95% CI: 0–10 mmHg), cardiac index decreased by a median of 0.34 L/min/m2 (95% CI: 0.18–1.40), and PVR increased by a median of 1.27 Wood units (95% CI: 0.07–2.68).
Six of the 85 subjects with normal PAP underwent a second RHC after a median of 23 months (range: 5–123 months). Two of them had a mean PAP of >25 mmHg with a PAWP of >20 mmHg in the context of underlying left ventricular diastolic dysfunction, suggestive of decompensated heart failure with preserved ejection fraction. Two additional subjects had mild pulmonary hypertension in the second RHC due to interstitial lung disease associated with scleroderma.
Discussion
The recent Pulmonary Hypertension World Symposium7 and a systematic review of the literature on PAP in healthy dults8 led to a more evidence-based definition of pulmonary hypertension (mean PAP ≥25 mmHg) while highlighting an area of borderline elevated mean PAP, between 21 and 24 mmHg, of unclear significance. Our study represents the first report of subjects evaluated at a referral pulmonary hypertension center who, on RHC, had such borderline elevated pulmonary pressures. The main finding of this study is that in our cohort, borderline elevation in mean PAP was associated with levels of hemodynamic compromise and survival between those for normal-PAP subjects and those for patients with overt group 1 PAH.
We show that, similar to patients with overt PAH, patients with borderline elevated PAP are a highly heterogeneous group. The majority of patients had an underlying condition known to be associated with pulmonary vascular disease. Half of the patients had either left heart disease or respiratory disease. Another common associated condition was connective-tissue disease, especially scleroderma. Mean PAP levels between 21 and 24 mmHg have been described in patients with severe chronic obstructive pulmonary disease,13 obstructive sleep apnea,14 and scleroderma.15 Pulmonary hypertension is also thought to be common in patients with heart failure due to left ventricular diastolic dysfunction.16 Taken together, these data emphasize the importance of a careful diagnostic assessment in patients found to have borderline elevation in PAP, similar to that suggested for overt pulmonary hypertension,5,7 to understand the pathophysiology behind it and ideally target the underlying medical condition. Interestingly, a sizable minority of patients in our cohort (16%) had no associated underlying condition. This may be suggestive of a group with a possible phenotype of idiopathic pre–pulmonary hypertension that may be at an increased risk of subsequent development of PAH. This, however, remains a hypothesis that requires further testing with larger cohorts and repeated hemodynamic evaluation.
Our findings suggest that borderline elevation in PAP is associated with hemodynamic impairment levels between those of subjects with normal PAP and those of patients with overt PAH, with an impact on functional capacity and long-term survival. Borderline elevation in PAP has been reported to be associated with higher mortality in chronic obstructive pulmonary disease17 and idiopathic pulmonary fibrosis.18 However, in our patients with preserved lung function we also found an association between borderline PAP and mortality. Furthermore, the tree-based analysis arrived at almost the same splits in mean PAP as cut points associated with different survival outcomes. This type of classification and regression tree analysis uses the data to estimate which cut points of mean PAP might be best for discriminating survival, rather than assessing previously established cut points, while taking into account the timing of the mortality events and the varying length of follow-up. Thus, it is quite compelling that, using this technique, we arrived at mean PAP cut points that correspond almost exactly to the current definition of normal PAP (≤20 mmHg), borderline PAP (21–26 mmHg), and overt PAH (≥27 mmHg). Of note, the tree-based procedure is an improvement over ROC analysis with respect to mortality, since the latter accounts for neither the timing of the mortality events nor the varying length of follow-up. Nonetheless, the fact that both arrived at the same cutoffs strengthens our conclusions. Whether a mean PAP cutoff of 27 mmHg may be more appropriate for overt PAH is of doubtful clinical significance, but it is suggested by our data (Table 5). This requires further exploration in other cohorts.
Furthermore, our findings suggest that borderline elevation in resting PAP has a negative impact on long-term survival, particularly in the context of underlying connective-tissue disease, and that it may constitute a “pre-PAH” state or an intermediate stage of pulmonary vascular disease. Notably, all 5 deaths observed in the borderline-PAP cohort occurred in patients with connective-tissue disease, mostly scleroderma. The fact that half of the patients in whom a repeat RHC was obtained had mean PAP greater than 25 mmHg, a finding also reported in scleroderma,15 also supports this notion. An elevated TPG has been recently shown to predict the onset of overt pulmonary hypertension in scleroderma.19 We now report that an elevated TPG predicts worse survival in patients with borderline PAP. Borderline PAP elevation has also been noted to be associated with decreased exercise capacity in scleroderma.20 Resting mean PAP of 21–24 mmHg is also frequently seen in patients who develop significant elevations in pulmonary pressures during exercise.21-23 These data should not be interpreted to suggest that treatment with PAH-targeted therapies is indicated in patients with borderline elevation in PAP. However, on the basis of these data we suggest that randomized controlled trials of PAH-targeted therapies in patients with borderline PAP elevation may be warranted, particularly in those with the highest chance of an adverse outcome, such as those with scleroderma or an elevated TPG.
It should be noted that in the Cox models, the difference in survival between the normal-PAP and borderline-PAP cohorts was of borderline statistical significance. As this is a retrospective, exploratory analysis, it is possible that this trend may become statistically significant with a larger number of patients. As the borderline cohort was older than the normal cohort, older age may have contributed to the worse outcome. Another limitation is that we were unable to determine the cause of death in 3 subjects with borderline PAP. One patient developed PAH 1 year after the baseline RHC and then died of aspiration pneumonia 2 years later. Another subject died of sepsis due to hospital-acquired pneumonia.
In conclusion, our study shows that the context of the clinical situation, i.e., the underlying medical condition, is important for interpreting the significance of borderline elevation in PAP. In the absence of heart or lung disease, borderline elevation in PAP is associated with levels of hemodynamic compromise and survival between those of patients with normal PAP and those of patients with overt PAH. Underlying connective-tissue disease and an elevated TPG confer a worse prognosis on patients with borderline PAP.
Acknowledgments
We are grateful to Ms. Jennie Newman, LPN, for her invaluable help in data collection and maintenance of the Cleveland Clinic Pulmonary Hypertension Registry. The abstract was presented at the 5th World Symposium on Pulmonary Hypertension, Nice, France, February 27–March 1, 2013.
Source of Support: RAD is supported by grants HL107147, HL081064, HL103453, HL109250, and RR026231 from the National Institutes of Health (NIH) and a BRCP 08-049 Tech 09-003 Third Frontier Program grant from the Ohio Department of Development. ART is supported by a Clinical and Translational Science Award KL2 grant (RR024990) from the National Center for Research Resources, a component of the NIH, and by the NIH Roadmap for Medical Research.
Conflict of Interest: GAH has received board fees from Lung Rx United Therapeutics and Genentech; his institution has received grants from Gilead Sciences Research Scholars Program and Bayer HealthCare Pharmaceuticals. OAM has received consultant fees from Actelion, Gilead, United Therapeutics, Pfizer, and Bayer and speaker fees from Actelion, United Therapeutics, Gilead, and Pfizer. RAD’s institution has received grants from Novartis, Gilead, and Actelion. ART, JPH, SF, and JGP declare no conflicts of interest.
References
- 1.Batal O, Khatib OF, Bair N, Aboussouan LS, Minai OA. Sleep quality, depression, and quality of life in patients with pulmonary hypertension. Lung 2011;189(2):141–149. [DOI] [PubMed]
- 2.Copher R, Cerulli A, Watkins A, Monsalvo ML. Treatment patterns and healthcare system burden of managed care patients with suspected pulmonary arterial hypertension in the United States. J Med Econ 2012;15(5):947–955. [DOI] [PubMed]
- 3.D’Alonzo GE, Barst RJ, Ayres SM, Bergofsky EH, Brundage BH, Detre KM, Fishman AP, et al. Survival in patients with primary pulmonary hypertension: results from a national prospective registry. Ann Intern Med 1991;115(5):343–349. [DOI] [PubMed]
- 4.Humbert M, Sitbon O, Chaouat A, Bertocchi M, Habib G, Gressin V, Yaïci A, et al. Survival in patients with idiopathic, familial, and anorexigen-associated pulmonary arterial hypertension in the modern management era. Circulation 2010;122(2):156–163. [DOI] [PubMed]
- 5.Galiè N, Palazzini M, Manes A. Pulmonary hypertension and pulmonary arterial hypertension: a clarification is needed. Eur Respir J 2010;36(5):986–990. [DOI] [PubMed]
- 6.Hatano S, Strasser T. Primary pulmonary hypertension: report on a WHO Meeting, Geneva, 15–17 October 1973. Geneva: World Health Organization, 1975.
- 7.Badesch DB, Champion HC, Sanchez MA, Hoeper MM, Loyd JE, Manes A, McGoon M, et al. Diagnosis and assessment of pulmonary arterial hypertension. J Am Coll Cardiol 2009;54(suppl. 1):S55–S66. [DOI] [PubMed]
- 8.Kovacs G, Berghold A, Scheidl S, Olschewski H. Pulmonary arterial pressure during rest and exercise in healthy subjects: a systematic review. Eur Respir J 2009;34(4):888–894. [DOI] [PubMed]
- 9.Simonneau G, Robbins IM, Beghetti M, Channick RN, Delcroix M, Denton CP, Elliott CG, et al. Updated clinical classification of pulmonary hypertension. J Am Coll Cardiol 2009;54(suppl. 1):S43–S54. [DOI] [PubMed]
- 10.Campo A, Mathai SC, Le Pavec J, Zaiman AL, Hummers LK, Boyce D, Housten T, et al. Hemodynamic predictors of survival in scleroderma-related pulmonary arterial hypertension. Am J Respir Crit Care Med 2010;182(2):252–260. [DOI] [PMC free article] [PubMed]
- 11.R Development Core Team. R: a language and environment for statistical computing. R Foundation for Statistical Computing, Vienna, Austria. http://www.R-project.org/.
- 12.Therneau TM, Atkinson EJ. An introduction to recursive partitioning using the RPART routines. http://www.mayo.edu/hsr/techrpt/61.pdf. Published September 3, 1997.
- 13.Scharf SM, Iqbal M, Keller C, Criner G, Lee S, Fessler HE. Hemodynamic characterization of patients with severe emphysema. Am J Respir Crit Care Med 2002;166(3):314–322. [DOI] [PubMed]
- 14.Chaouat A, Weitzenblum E, Krieger J, Oswald M, Kessler R. Pulmonary hemodynamics in the obstructive sleep apnea syndrome: results in 220 consecutive patients. Chest 1996;109(2):380–386. [DOI] [PubMed]
- 15.Bae S, Saggar R, Bolster MB, Chung L, Csuka ME, Derk C, Domsic R, et al. Baseline characteristics and follow-up in patients with normal haemodynamics versus borderline mean pulmonary arterial pressure in systemic sclerosis: results from the PHAROS registry. Ann Rheum Dis 2012;71(8):1335–1342. [DOI] [PMC free article] [PubMed]
- 16.Lam CS, Roger VL, Rodeheffer RJ, Borlaug BA, Enders FT, Redfield MM. Pulmonary hypertension in heart failure with preserved ejection fraction: a community-based study. J Am Coll Cardiol 2009;53(13):1119–1126. [DOI] [PMC free article] [PubMed]
- 17.Weitzenblum E, Hirth C, Ducolone A, Mirhom R, Rasaholinjanahary J, Ehrhart M. Prognostic value of pulmonary artery pressure in chronic obstructive pulmonary disease. Thorax 1981;36(10):752–758. [DOI] [PMC free article] [PubMed]
- 18.Hamada K, Nagai S, Tanaka S, Handa T, Shigematsu M, Nagao T, Mishima M, Kitaichi M, Izumi T. Significance of pulmonary arterial pressure and diffusion capacity of the lung as prognosticator in patients with idiopathic pulmonary fibrosis. Chest 2007;131(3):650–656. [DOI] [PubMed]
- 19.Valerio CJ, Schreiber BE, Handler CE, Denton CP, Coghlan JG. Borderline mean pulmonary artery pressure in systemic sclerosis patients: trans-pulmonary gradient predicts risk of developing pulmonary hypertension. Arthritis Rheum 2013;65 (4):1074–1084. [DOI] [PubMed]
- 20.Kovacs G, Maier R, Aberer E, Brodmann M, Scheidl S, Troster N, Hesse C, et al. Borderline pulmonary arterial pressure is associated with decreased exercise capacity in scleroderma. Am J Respir Crit Care Med 2009;180(9):881–886. [DOI] [PubMed]
- 21.Tolle JJ, Waxman AB, Van Horn TL, Pappagianopoulos PP, Systrom DM. Exercise-induced pulmonary arterial hypertension. Circulation 2008;118(21):2183–2189. [DOI] [PMC free article] [PubMed]
- 22.Whyte K, Hoette S, Herve P, Montani D, Jais X, Parent F, Savale L, et al. The association between resting and mild-to-moderate exercise pulmonary artery pressure. Eur Respir J 2012;39(2):313–318. [DOI] [PubMed]
- 23.Saggar R, Khanna D, Furst DE, Shapiro S, Maranian P, Belperio JA, Chauhan N, et al. Exercise-induced pulmonary hypertension associated with systemic sclerosis: four distinct entities. Arthritis Rheum 2010;62(12):3741–3750. [DOI] [PMC free article] [PubMed]