

Abstract
The increased manufacture and use of nanomaterials raises concerns about the long-term effects of chronic exposure on human health. However, nanoparticle exposure remains difficult to measure. Here we show that mice intravenously administered with high doses of gold nanoparticles have visibly blue skin while quantum dot-treated mice emit green, yellow, or red fluorescence after ultraviolet excitation. More importantly, elemental analysis of excised skin correlates with the injected dose and nanoparticle accumulation in the liver and spleen. We propose that the analysis of skin may be a strategy to quantify systemic nanoparticle exposure and can potentially predict the fate of nanoparticles in vivo. Our results further suggest that dermal accumulation may represent an additional route of nanoparticle toxicity and may be a future strategy to exploit ultra-violet and visible light-triggered therapeutics that are normally not useful in vivo because of the limited light penetration depth of these wavelengths.
Introduction
Although the specific mechanisms are debated, most researchers agree that continuous intentional or unintentional exposure to nanomaterials can lead to chronic nanoparticle toxicity1. However, measurement of nanoparticle exposure has been difficult as current quantification techniques require the isolation or sampling of internal organs2–4. These invasive and endpoint measurement methods are inappropriate for assessing nanoparticle accumulation in humans. Techniques using fluorescent and radio imaging modalities such as whole-animal imaging5,6, raman spectroscopy7, multi-photon spectroscopy8 and confocal microscopy9 have been employed in academic research for non-invasive measurement of nanoparticles in the skin. Unfortunately, such methods only provide a semi-quantitative measure of the pharmacokinetic distribution of nanoparticles in organs and are limited to particles with specialized labelling or properties that allow for detection (Supplementary Table 1). Furthermore, detecting nanoparticles with such techniques has been difficult clinically due to the physical limitations of the required optical equipment.
Quantitative and endpoint invasive techniques such as elemental analysis are capable of measuring nanoparticle biodistribution in small animals. However, application of such modalities to humans has been limited3,10,11. To date, biodistribution analysis has been used to identify specific organs that are heavily exposed to nanoparticles. Such studies have shown that nanoparticles have a high propensity for accumulation in the liver and spleen. Despite being the largest vascularized organ of the body and an important component of the immune system, non-specific skin accumulation of blood-circulating nanoparticles has only been mentioned in a handful of biodistribution studies6,12,13. Rather, skin-nanomaterial research has been focused on assessing skin penetration and accumulation of topically-applied nanoparticles composed of titanium oxide8,14, zinc oxide15 and quantum dots16 (figure 1a). In these studies, nanoparticles were applied to the skin and monitored by dermal microscopy6. This body of work has clearly shown that nanoparticles can permeate through hair follicles17,18 and transiently extravasate from dermal blood vessels in vitro19. However, a thorough examination of the visual appearance and accumulation kinetics of blood-circulating nanoparticles in the skin after systemic injection (figure 1b) has yet to be conducted.
Figure 1. Illustration of the routes of nanoparticle entry into the skin.

(a) Nanoparticles applied topically to the outer surface of the mouse have been shown in previous studies to diffuse through the epidermis to reach the dermal (De) and subcutaneous (Sc) layers of the skin. (b) Systemic administration of nanoparticles by tail-vein injection were found in this study to enter the skin from blood vessels and diffuse into the De and Sc layers of the skin. Our study is focused on the systemic administration and not on the topical application as systemic administration is the most common method for introducing nanoparticle-based drugs and contrast agents into the body.
Here, we show that intravenously administered inorganic nanoparticles at high doses are visible on the skin of mice under ambient light or through the use of inexpensive handheld devices such as ultra-violet (UV) lamps or dermatoscopes. We further show that elemental analysis of small skin biopsies can be used as a generalized approach to quantify the accumulation of poly(ethylene) glycol coated gold nanoparticles and quantum dots within the body without the need of fluorescent or radioactive labels.
RESULTS
Detection of gold nanoparticles in mouse skin
Gold nanoparticles are commonly used in molecular diagnostics and drug delivery applications. These nanomaterials were selected for our initial studies as they are easily synthesized, have a distinct ruby color, and can be quantified by inductively coupled plasma atomic emission spectroscopy (ICP-AES). CD1 nude athymic mice were tail-vein injected 15 nm gold nanoparticles functionalized with the anti-fouling polymer - methoxy-terminated polyethylene glycol (mPEG) and monitored for 21 days post-injection (DPI). Coatings of mPEG were selected to lengthen plasma retention of injected nanoparticles by minimizing the adsorption of serum proteins and for its ubiquitous use in nanomedicine. Table 1 and Supplementary Fig. 1 summarize the characteristics of the functionalized nanoparticles used in our study. We observed that the complexion of mice injected with a minimum of 6.64 pmol of gold nanoparticles per gram body weight (gBW) turned from pink to blue after 24 hours and persisted for 21 days (figure 2a, Supplementary Fig. 2, and Supplementary Movie 1). A similar change in skin color was seen for nanoparticles coated with transferrin (figure 2b) as well as for 100 nm nanoparticles (figure 2c) indicating that the accumulation was not a size or mPEG-specific phenomenon. Repeated dosing with 0.07 pmol gBW−1 of nanoparticles every other day also led to a change in skin color 5 DPI (Supplementary Fig. 3). This further insinuates that the nanoparticle-related changes in complexion were associated with retention of nanoparticles within the skin and not a byproduct of an excessively large bolus injection.
Table 1.
A summary of the physical properties of mPEG-functionalized nanoparticles
| Gold Nanoparticle | Quantum Dot | |
|---|---|---|
| Core Diameter [nm] | 15.2 ± 5.4 | 6.5 ± 2.6 |
| Hydrodynamic Diameter [nm] | 37.2 ± 3.3 | 11.8 ± 1.7 |
| Zeta-Potential [mV] | −11.3 ± 1.6 | −4.6 ± 1.2 |
| Blood Half-life [hours] | 35.4 ± 5.0 | 1.9 ± 0.6 |
Figure 2. Mice injected with gold nanoparticles.

(a) Mice have a visible blue-purple complexion after tail-vein injection with 6.64 pmol of 15 nm gold nanoparticles functionalized with mPEG after 24 and 504 hours post-injection (HPI). (b) and (c) show the same skin discoloration when injected with 6.64 pmol of 15 nm gold nanoparticles functionalized with transferrin and 100 nm gold nanoparticles functionalized with mPEG respectively. ICP-AES was also used to measure the concentration of the gold nanoparticles. (d) A comparison of gold nanoparticle concentration in small skin biopsies (5 cm2) versus injection dose shows a direct correlation while kinetic plots tracking gold nanoparticle concentration in the skin and lymph nodes (e) demonstrates that nanoparticle clearance from the skin (solid) coincides with an increase in nanoparticle concentration in the axillary lymph nodes (dotted). This suggests that the nanoparticles are cleared from the skin through the lymphatic system. Nanoparticle clearance from the skin levels off at 1.7% dose per gram tissue. (f) Isolated axillary lymph nodes show the gradual accumulation of gold nanoparticles (purple) in the lymph node over time. All error bars denote standard error of the mean values for measurements (n > 3).
Complementing our qualitative observation of nanoparticle accumulation, ICP-AES measurements seen in figure 2d of excised skin 24 hours post-injection (HPI) indicate that nanoparticle accumulation is linearly related to injection dose for concentrations between 0.07–6.64 pmol gBW−1. Measurements of nanoparticle content in blood (Supplementary Fig. 4) also confirmed that the nanoparticles measured in skin samples were representative of skin accumulation and not nanoparticles circulating in superficial blood vessels. The kinetics for our highest injection dose revealed that skin retention of our blood circulating nanoparticles peaked at 24 HPI and decreased to a plateau concentration of 1.7 ± 0.6% dose g−1 skin over 21 days (figure 2e). This decrease coincided with a cumulative increase of nanoparticles in the axillary, brachial, and inguinal lymph nodes at 72 HPI (figure 2f). As dendritic cells are replaced from the dermis every 72 hours20, our findings imply that skin-accumulating nanoparticles are partially cleared by transport to the lymphatic system and affirm that the observed skin color change was directly associated with nanoparticles rather than the permanent hyperpigmentation caused by elemental ions21,22 which are known to chelate with melanin23 and accumulate dermally in patients afflicted with argyria24 and chrysiasis25. The fate of gold nanoparticles within the lymphatic system remains unclear and will be investigated in future studies.
Identification of skin layers that retain nanoparticles
To further understand how gold nanoparticles became visible in the skin, histopathology was employed to visualize the location of nanoparticle accumulation. As illustrated in figure 3, the skin is a stratified tissue that consists of an outer epidermal layer, a vascularized dermal layer, and an insulating subcutaneous layer. Skin samples were harvested from mice at different time points between 4 and 504 HPI, histologically sectioned, and silver stained for visualization of nanoparticles. Using immunohistochemical stains for the F4/80 membrane marker for phagocytic cells26 (figure 3a), we confirmed that nanoparticles accumulated in dermal macrophages and dendritic cells at low administration doses (0.07 pmol gBW−1). At higher treatments (0.67–6.67 pmol gBW−1), nanoparticles were seen in the pericellular space of the dermis and subcutaneous tissue (figure 3b). Figures 3c–3e provide consecutive illustrations of the dose-dependent accumulation of nanoparticles within the skin. The visualization of nanoparticles in phagocytic cells and the pericellular space helps to explain the blue skin color seen in mice as the high packing density of gold nanoparticles in such regions and macrophage vesicles27 can cause gold nanoparticle absorbance to visibly shift from red to blue28. Our histology also suggests that nanoparticle accumulation in the pericellular space occurs after cellular uptake of nanoparticles becomes saturated. Using both bright field microscopy (figure 3b) and transmission electron microscopy (Supplementary Fig. 5) of skin sections, we determined and confirmed that the nanoparticles accumulating in the skin were not degraded in the dermis and did not penetrate into the epidermis of this skin. Nanoparticles are known to cross from the epidermis to the dermis when topically applied to the skin. Our results suggest that nanoparticle transport across the basal membrane is unidirectional whereby systemically administered nanoparticles do not cross the stratum basale for shedding during epidermal turnover29,30 in the absence of physical damage to the skin or inflammation after skin accumulation31,32.
Figure 3. Histology of skin samples post-injection of gold nanoparticles at 20x magnification.

(a) Immunohistochemistry stained skin section shows that macrophages (seen in brown) co-localize with nanoparticles (seen in black). Magnified inset clearly shows that nanoparticles can be found in the cytosolic region of macrophages. (b) Microscopy images demonstrate that as injected dose increases, nanoparticles (seen in black) appear to first localize in phagocytic cells (red arrow) then gradually begin spill into the pericellular space of the dermis and finally distribute throughout the dermis (De) and subcutaneous tissue (Sc). Orange dotted lines highlight areas of nanoparticle accumulation. Nanoparticles were not detected in the epidermis (Ep) of the skin. Illustration panel (c–e) shows a pictorial diagram of nanoparticle infiltration into the skin over time. Post-injection, nanoparticles begin to diffuse out of dermal blood vessels (BV) (c) and become taken up by dermal macrophages and dendritic cells (d). Once phagocytic cells become saturated (e) nanoparticles begin to distribute into the pericellular space of the subcutaneous tissue and dermis. Scale bars denote 50 and 200 μm for panels (a) and (b) respectively.
Effect of gold nanoparticles on animal toxicity
We next sought to determine whether the doses required for visible detection of gold nanoparticles in mouse skin were associated with animal toxicity. The health of mice injected with gold nanoparticles at a dose of 6.67 pmol gBW−1 was monitored at 7 and 21 days post-injection (DPI) to assess the upper threshold of nanoparticle toxicity for our study. Mouse health was closely monitored for signs of distress and changes to body weight. By appearance, mice administered with gold nanoparticles were normal and did not significantly drop in body weight compared to control animals injected with phosphate buffered saline, PBS (Supplementary Fig. 6). Blood biochemistry and hematological analysis was also performed to assess systemic toxicity in our mice. A brief description of the parameters used for blood biochemistry and hematological analysis is summarized in Supplementary Tables 2 and 3 respectively. White blood cell count, monocyte, neutrophil, and lymphocytes were universally below the health range specified by the breeder, Charles River laboratories (Supplementary Fig. 7)33. However, the similarity between nanoparticle-treated and untreated mice suggests that the sub-standard readings were likely related to mouse age and stress versus nanoparticle exposure34. Acute liver toxicity was estimated by quantification of hematological enzyme levels (Supplementary Fig. 8). Once again, our values were below those reported by the breeder specifications but not-statistically different from control groups. Acute liver toxicity is typically associated with significant elevation in bilirubin35, alkaline phosphatase34, alanine aminotransferase36, and aspartate aminotransferase36. These enzyme levels can fluctuate due to an animal’s level of physical activity as well as the time of the day in which blood was sampled34. Hence, we concluded that the universally lower values for both treatment and control groups were likely not associated with nanoparticle toxicity. We however would like to note that although gold nanoparticle toxicity was not observed at the reported doses, our toxicology results may not predict the long-term impact of nanoparticle exposure on healthy animals and may not be generalizable to other nanoparticle types as particle composition and surface chemistry may yield different biological effects.
Influence of quantum dots on mouse skin
Building on our gold nanoparticle observations, we explored whether skin accumulation occurred for other nanoparticle types. To test, we injected mice with mPEG-functionalized quantum dots at doses similar to gold nanoparticles by normalizing to total nanoparticle surface area (4.4 to 80 pmol gBW−1). Three alloyed quantum dots (ZnS-capped, CdSeS) with distinct fluorescent emissions (525, 575 and 667 nm) were chosen to demonstrate the range of visually detectable colors. The injection of quantum dots did not adversely impact mice (Supplementary Movies 1 & 2) at all administered doses. However, unlike gold nanoparticles, the skin color of quantum dot administered animals did not change under white-light illumination. This is likely related to the quantum dot’s lower extinction coefficient in comparison to gold nanoparticles37,38. We alternatively observed that the animals fluoresced green, yellow, and red under UV-lamp illumination corresponding to the spectral properties of the injected quantum dots (figure 4a). These UV-dependent changes further validated that the nanoparticles and not their free metal ions accumulated in the skin as quantum dots lose their fluorescence with particle degradation39. We observed that the quantum dots that fluoresced green and yellow were more pronounced in the mouse skin than red-emitting formulations. This was likely related to the higher quantum yield of green and yellow quantum dots that allowed them to be visible over the absorption and scattering properties of the dermis40,41.
Figure 4. Mice injected with quantum dots.
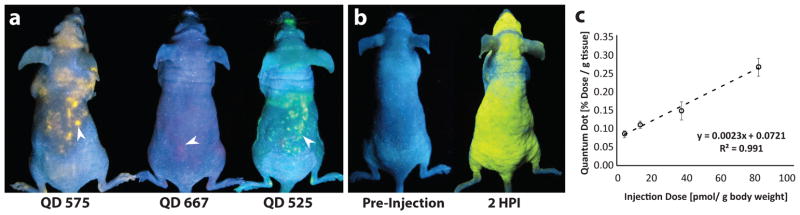
(a) Mice injected with quantum dots of different emission wavelengths (575, 667 and 525 nm) were simultaneously imaged at 2 HPI under a handheld ultra-violet light illumination. White arrows delineate points of quantum dot accumulation. (b) An example of a mouse pre- (left) and post- (right) injection of quantum dots where fluorescence covers the entire the skin. (c) ICP-AES quantification of quantum dots in the skin is also linearly related to injection dose at 72 HPI. Error bars denote standard error of the mean values for measurements (n > 3).
Interestingly, the distribution of fluorescence in the mouse skin was dose-dependent. Mice uniformly fluoresced at an injection concentration of 240 pmol gBW−1 (figure 4b) but were patchy at lower quantum dot doses. In some animals, fluorescence was observed in one ear and not the other or in varied regions of the body (Supplementary Movies 1 & 2). The cause for the non-uniform distribution of fluorescence is unclear, but may be related to the location of phagocytic cells, differences in the superficial vasculature or depth of accumulation. Nevertheless, skin fluorescence was detectable as early as 2 HPI in all cases but gradually faded over 24–36 hours (Supplementary Fig. 9). UVB light (290–320 nm) fails to penetrate beyond the epidermis and UVA light (320–400 nm) is limited to dermal permeation. Particles residing deeper in the dermis and subcutaneous tissue would be more difficult to detect visually40. We suspect that the fluorescent fading is related to particle movement from more superficial regions to deeper layers over clearance. This was further validated by ICP-AES measurement (figure 4c) and histological analysis (Supplementary Fig. 9) of skin biopsies, which demonstrated that quantum dots remained present in the skin at a higher concentration than in blood 72 HPI (Supplementary Fig. 4). Despite their complete loss of visual fluorescence, presence of quantum dots in the skin remained linearly correlated to the injection dose similar to the results for gold nanoparticles (figure 4c). This reinforces the idea that nanoparticle accumulation in the skin is independent of particle-type and intimates that nanoparticles with an optical or magnetic emission (most inorganic nanoparticles) may be detected by visual changes in skin tone.
Correlation of skin-accumulation to the liver and spleen
Since skin retention of nanoparticles was seen to be dose-dependent, we explored whether such dermal measurements could be used to predict nanoparticle accumulation in other organs of the body. High quantities of nanoparticles are known to sequester in the liver and spleen27,42. This high retention makes these organs particularly susceptible to toxicity caused by nanoparticles. Unfortunately, the only strategy to assess nanoparticle exposure in these tissues is organ sampling. This technique can be undesirable as it can expose the body to infection and may lead to decreased organ function. We opted to test whether minimally invasive skin punctures - a common clinical technique43 - taken from the central region on the dorsal side of mice, could be used to measure internal organ exposure to nanoparticles. The limit of detection of nanoparticles in the skin by ICP-AES was evaluated by spiking standard dilutions of gold nanoparticles and quantum dots with mouse skin. We identified that gold nanoparticles and quantum dots could be detected down to 0.04 and 0.028 pmol respectively (Supplementary Fig. 10). Interestingly, liver and spleen accumulation of gold nanoparticles (figure 5a & 5b) at 24 HPI and quantum dots (figure 5c & 5d) at 72 HPI were linearly related to the injected dose. We further noticed that nanoparticle content in these organs could be predicted by multiplying the measured nanoparticle content in the skin by a constant for all administered doses (figure 5e & 5f). This relationship between the skin, liver and spleen implies that skin biopsies can be used as an easily accessible and minimally invasive surrogate measure of reticuloendothelial organ exposure to nanoparticles. This may conceivably be useful for clinical identification of the type and degree of nanoparticle exposure in the future.
Figure 5. ICP-AES analysis of organs post-nanoparticle administration.

(a & b) Accumulation of gold nanoparticles in the liver and spleen are linearly related to injection dose. (c & d) Accumulation of quantum dots in the liver and spleen are also linearly related to injection dose. (e & f) As the injection dose decreases, we observed a corresponding decrease in the amount of nanoparticles in the liver, spleen, and skin. Interestingly, the quantity of the gold nanoparticles and quantum dots in the liver and spleen is directly related to the skin. This suggests that we can estimate the amount of nanoparticles in the other reticuloendothelial organs by multiplying skin measurements by a numeric factor. For example, the concentration of gold nanoparticles in the liver for an injection dose of 6.64 pmol/g body weight can be obtained by multiplying the measured skin quantity by 2.3. We confirmed that the ratios are statistically similar, using the student’s t-test (p > 0.05). Injection doses for gold nanoparticle and quantum dots were normalized to total surface area to compare between particle types. Error bars denote standard error of the mean values for measurements (n > 3).
Effect of tissue origin on nanoparticle quantification
As a final task, we validated whether nanoparticle quantification of the skin by ICP-AES was consistent across different regions of the body and independent of species. Nanoparticle content in skin samples were taken dorsally from gold nanoparticle-treated mice at the cranial, central, and caudal regions and compared by ICP-AES. Despite the visual inhomogeneity of skin accumulation, nanoparticle content was statistically uniform (Supplementary Fig. 11). This both indicated that (i) the patchy pigmentation was likely caused by nanoparticle accumulation at non-optically pervasive layers of the skin and (ii) skin biopsies can be taken from anywhere on the body for ICP-AES measurement. Measurement of nanoparticle content in the skin versus blood (Supplementary Fig. 4) further confirmed that the concentration of nanoparticles in the skin was reflective of tissue accumulation and not nanoparticle presence within superficial blood vessels of the skin. We further examined whether the measurements of excised skin were biased by the animal species to ensure that ICP-AES measurement of skin samples could be translated for use with non-mouse tissues. Standard dilutions of gold nanoparticles and quantum dots were spiked with samples of porcine, rabbit and mouse skin were compared. Our results demonstrated that nanoparticle measurement was unaffected by the presence of skin from any animal (Supplementary Fig. 10) and further confirmed that ICP-AES analysis of skin biopsies could potentially be used for assessment of nanoparticle exposure in human tissues.
Discussion
In light of the growing interest in nanomedicine, the observation of nanoparticle accumulation in the skin is significant from a number of perspectives. First, it demonstrates that systemic exposure to inorganic nanoparticles can be detected by visual and elemental-analysis of the skin. The ability to use skin to determine exposure provides a non-invasive and rapid determination of nanoparticle exposure that can be further quantified by ICP-AES after skin biopsy. This quantification method addresses the need for an absolute nanoparticle quantification method that is unencumbered by interference from biological tissues that commonly limit non-invasive optical detection techniques such as two-photon or raman microscopy (see Supplementary Table 1 for comparison). Second, our observations allude to the need for further study of the toxicological impact of nanomaterials on the skin. Skin accumulation of nanoparticles post-systemic administration may result in the adverse generation of reactive oxygen species or heat through low tissue-penetrating UV or visible light excitation. This will become increasingly important as nanomaterials become incorporated into commercial products and industrial processes. On the bright side, our findings also suggest that nanoparticle accumulation in the skin may also be exploited to develop novel strategies for engineering photo-responsive nanomaterials for diagnosing diseases or for controlling drug release via systemic injection (unpublished data).
Although our work demonstrates that nanoparticles accumulate in the skin, the observed differences in the kinetics of skin accumulation between the gold nanoparticles and quantum dots suggests that additional investigation into different nanoparticle sizes, shapes, surface chemistries and routes of administration are required to identify how the physico-chemical properties of a nanoparticle and modes of exposure may affect their skin accumulation. This will provide a better understanding of the biodistribution behavior of nanoparticles in vivo and will allow for the exploitation of dermal accumulation for practical use. Despite the need for future studies, our current findings shed new light in the accumulation patterns of nanomaterials in vivo and also provide a wealth of new opportunities for engineering novel diagnostics and therapeutics using optical wavelengths with low tissue penetration.
Methods
Nanoparticle synthesis and functionalization
15 nm gold nanoparticles were synthesized by methods described previously by Frens et al44. In short, 100 mL of double distilled water was set to boil with 0.3 mg/mL of sodium citrate tribasic (Sigma S4641), followed by the addition of 9.85 mg of gold(III) chloride trihydrate (Sigma G4022) under rapid stirring and reflux for 7 minutes. Citrate-stabilized gold nanoparticles were concentrated and surface functionalized with 5 kDa sulfhydryl-mPEG (Laysan Bio MPEG-SH-5000) at an excess reaction ratio of 4 mPEG nm−2 under heated conditions (60°C) for 30 minutes. Trilite Quantum dots with fluorescent emissions of 525, 575, and 667 nm were purchased from CytoDiagnostics, Burlington, Canada and functionalized with 5 kDa sulfhydryl-mPEG groups using a two-step ligand exchange. Briefly, chloroform solubilized quantum dots were mixed with thioglycolic acid (Sigma T3758) under stirring conditions for 5 hours at room temperature and washed in acetone containing 1.85% wt v−1 tetramethylammonium hydroxide pentahydrate (Sigma T7505). Quantum dots were then reacted with sulfhydryl-mPEG in 50 mM borate buffer at a 1:11250 ratio at 60°C for 60 minutes followed by Amicon ultracentrifuge tube (Millipore UFC5030) purification. Hydrodynamic diameter and zeta potential of nanoparticles were determined by dynamic light scattering using a Malvern Nano ZS in 10 mM HEPES buffer spiked with 3 mM sodium hydroxide and 1 mL sodium chloride. Nanoparticle core-diameters were measured by transmission microscopy while functionalization was validated by gel-shift in 0.7% wt v−1 agarose gels at 135 mV for 15 minutes.
Dose preparation and animal injection
4 week-old female CD-1 nude athymic mice were purchased from Charles River and maintained in the Division of Comparative Medicine, University of Toronto. For dose preparation, mPEG-functionalized gold nanoparticles (0.2, 0.02 and 0.002 nmol) and quantum dots (0.11, 0.31, 0.91, and 2 nmol) were buffered to physiological pH in 1x PBS with a final volume of 200 μL. Doses were warmed to room temperature prior to gradual intravenous injection into 5–6 week old mice over 1 minute to minimize shock to the animals. Mice were monitored over the period of study for health complications and changes to body weight. All procedures were conducted in compliance with the ethical regulations set out by the Faculty of Medicine and Pharmacy Animal Care Committee, University of Toronto.
Organ and blood collection
Mice were warmed under heat lamp illumination for 30 minutes prior to blood collection. For blood half-life analysis, 10 μL of blood was collected by tail-vein puncture into ethylene-diamine-tetra-acetic (EDTA) acid coated capillary tubes (Drummond Microcap 1-000-2000-E) at 2, 4, 8, 24, 48, and 72 HPI. Hematological samples were collected from mice via cardiac puncture at an extraction rate of 0.3 mL s−1 while anesthetized with isofluorane-enriched oxygen. Blood biochemistry and hematology were processed by the Samuel Lunenfeld Research Institute to assess nanoparticle-related toxicity. Mice were then sacrificed by cervical dislocation for organ and lymph node collection. Animal handling was performed in accordance with methods approved by the Faculty of Medicine and Pharmacy Animal Care Committee, University of Toronto.
Tissue histology preparation
Tissue samples were harvested from mice and immediately fixed in 10% buffered-formalin for 7 days. Tissues were then paraffin embedded and stained by the Department of Pathology at Toronto General Hospital. Haematoxylin and eosin were used for tissue contrast while silver and F4/80 antibody (Serotec MCA497GA) were used to visualize nanoparticles and macrophages/dendritic cells respectively. Briefly, tissues were stained with antibodies at a 1/20000 dilution for 1 hour while silver stain was allowed to develop over 30 minutes. Following staining, slides were thoroughly washed in double distilled water and imaged using an Olympus IX-70 inverted light microscope mounted with an Amscope MU500 camera at 10x and 20x magnification.
Biodistribution analysis
Tissues were digested in yttrium (1 μg mL−1) supplemented aqua regia (75% hydrochloric acid, 25% nitric acid) at 70°C for 2 hours. Digested organs were diluted in double distilled water and filtered through Millipore 0.22 μm PVDF filters (Millex GV) to remove debris. Gold and cadmium content was quantified via ICP-AES (Perkin-Elmer Optima 3000) to determine organ-concentration of gold nanoparticles and quantum dots respectively. Yttrium was used as a reference to account for sample loss during tissue processing. All measurements were normalized to injection dose and wet tissue mass.
Optical imaging of mice
Whole animal images were acquired while mice were anesthetized with isofluorane-enriched oxygen using a Canon Powershot S95 camera. Gold nanoparticles were imaged under normal white light conditions while quantum dot fluorescence was achieved through illumination with a handheld ultraviolet lamp. Images were acquired at 0.17, 2, 4, 8, 24, 48, 72, 168, 336 and 504 hours post-nanoparticle injection.
Supplementary Material
Acknowledgments
We would like to acknowledge the Canadian Institute of Health Research (MOP-93532; RMF-111623), Natural Sciences and Engineering Research Council (NETGP35015; RGPIN-288231; CRDPJ424710), Collaborative Health Research Program (10002109), Canadian Foundation for Innovation, and Ontario Ministry of Research and Innovation for funding support. E.A.S. and K.M.T. acknowledge NSERC for fellowship. We would also like to acknowledge technical discussion with Dr. Gang Zheng, Peter Tang for aid in ICP-AES measurements, the Samuel Lunenfeld Research Institute’s, CMHD Mouse Physiology Facility (Toronto, Ontario) for their hematology and blood biochemistry testing services, and Toronto Centre for Phenogenomics (Toronto, Ontario) for histopathology analysis.
Footnotes
Author Contributions
E.A.S., W.C.W.C conceived the idea and wrote the paper. E.A.S., Q.D., K. M. T. designed and performed experiments. D.M.H. aided in histological section preparation and expert pathological analysis. All authors analyzed data.
No competing financial interests exist.
References
- 1.Elsaesser A, Howard CV. Toxicology of nanoparticles. Adv Drug Deliv Rev. 2012;64:129–137. doi: 10.1016/j.addr.2011.09.001. [DOI] [PubMed] [Google Scholar]
- 2.Lasagna-Reeves C, et al. Bioaccumulation and toxicity of gold nanoparticles after repeated administration in mice. Biochem Biophys Res Commun. 2010;393:649–655. doi: 10.1016/j.bbrc.2010.02.046. [DOI] [PubMed] [Google Scholar]
- 3.Sonavane G, Tomoda K, Makino K. Biodistribution of colloidal gold nanoparticles after intravenous administration: effect of particle size. Colloids Surf B Biointerfaces. 2008;66:274–80. doi: 10.1016/j.colsurfb.2008.07.004. [DOI] [PubMed] [Google Scholar]
- 4.Hahn MA, Singh AK, Sharma P, Brown SC, Moudgil BM. Nanoparticles as contrast agents for in-vivo bioimaging: current status and future perspectives. Anal Bioanal Chem. 2011;399:3–27. doi: 10.1007/s00216-010-4207-5. [DOI] [PubMed] [Google Scholar]
- 5.Ballou B, Lagerholm BC, Ernst LA, Bruchez MP, Waggoner AS. Noninvasive imaging of quantum dots in mice. Bioconjug Chem. 2004;15:79–86. doi: 10.1021/bc034153y. [DOI] [PubMed] [Google Scholar]
- 6.Kumar R, et al. In vivo biodistribution and clearance studies using multimodal organically modified silica nanoparticles. ACS Nano. 2010;4:699–708. doi: 10.1021/nn901146y. [DOI] [PMC free article] [PubMed] [Google Scholar]
- 7.Keren S, et al. Noninvasive molecular imaging of small living subjects using Raman spectroscopy. Proc Natl Acad Sci U S A. 2008;105:5844–9. doi: 10.1073/pnas.0710575105. [DOI] [PMC free article] [PubMed] [Google Scholar]
- 8.Zvyagin AV, et al. Imaging of zinc oxide nanoparticle penetration in human skin in vitro and in vivo. J Biomed Opt. 2013;13:064031. doi: 10.1117/1.3041492. [DOI] [PubMed] [Google Scholar]
- 9.Sokolov K, et al. Real-time vital optical imaging of precancer using anti-epidermal growth factor receptor antibodies conjugated to gold nanoparticles. Cancer Res. 2003;63:1999–2004. [PubMed] [Google Scholar]
- 10.Khlebtsov N, Dykman L. Biodistribution and toxicity of engineered gold nanoparticles: a review of in vitro and in vivo studies. Chem Soc Rev. 2011;40:1647–71. doi: 10.1039/c0cs00018c. [DOI] [PubMed] [Google Scholar]
- 11.De Jong WH, et al. Particle size-dependent organ distribution of gold nanoparticles after intravenous administration. Biomaterials. 2008;29:1912–1919. doi: 10.1016/j.biomaterials.2007.12.037. [DOI] [PubMed] [Google Scholar]
- 12.Akiyama Y, Mori T, Katayama Y, Niidome T. The effects of PEG grafting level and injection dose on gold nanorod biodistribution in the tumor-bearing mice. J Control Release. 2009;139:81–84. doi: 10.1016/j.jconrel.2009.06.006. [DOI] [PubMed] [Google Scholar]
- 13.Yang RSH, et al. Persistent tissue kinetics and redistribution of nanoparticles, quantum dot 705, in mice: ICP-MS quantitative assessment. Environ Health Perspect. 2007;115:1339–43. doi: 10.1289/ehp.10290. [DOI] [PMC free article] [PubMed] [Google Scholar]
- 14.Schneider M, Stracke F, Hansen S, Schaefer UF. Nanoparticles and their interactions with the dermal barrier. Dermatoendocrinol. 2009;1:197–206. doi: 10.4161/derm.1.4.9501. [DOI] [PMC free article] [PubMed] [Google Scholar]
- 15.Gulson B, et al. Small amounts of zinc from zinc oxide particles in sunscreens applied outdoors are absorbed through human skin. Toxicol Sci. 2010;118:140–9. doi: 10.1093/toxsci/kfq243. [DOI] [PubMed] [Google Scholar]
- 16.Zhang LW, Yu WW, Colvin VL, Monteiro-Riviere NA. Biological interactions of quantum dot nanoparticles in skin and in human epidermal keratinocytes. Toxicol Appl Pharmacol. 2008;228:200–11. doi: 10.1016/j.taap.2007.12.022. [DOI] [PubMed] [Google Scholar]
- 17.Mittal A, et al. Non-invasive delivery of nanoparticles to hair follicles: A perspective for transcutaneous immunization. Vaccine. 2013;31:3442–51. doi: 10.1016/j.vaccine.2012.12.048. [DOI] [PubMed] [Google Scholar]
- 18.Adachi K, Yamada N, Yoshida Y, Yamamoto O. Subchronic exposure of titanium dioxide nanoparticles to hairless rat skin. Exp Dermatol. 2013;22:278–83. doi: 10.1111/exd.12121. [DOI] [PubMed] [Google Scholar]
- 19.Leavens TL, et al. In vitro biodistribution of silver nanoparticles in isolated perfused porcine skin flaps. J Appl Toxicol. 2012;32:913–9. doi: 10.1002/jat.2750. [DOI] [PMC free article] [PubMed] [Google Scholar]
- 20.Haniffa M, et al. Differential rates of replacement of human dermal dendritic cells and macrophages during hematopoietic stem cell transplantation. J Exp Med. 2009;206:371–85. doi: 10.1084/jem.20081633. [DOI] [PMC free article] [PubMed] [Google Scholar]
- 21.Guy Richard H, Hinz RS. Metals and the Skin: Topical Effects and Systemic Absorption. Vol. 440. Marcel Dekker; 1999. [Google Scholar]
- 22.Smoller BR, Rongioletti F. Clinical and Pathological Aspects of Skin Diseases in Endocrine, Metabolic, Nutritional and Deposition Disease. Springer; New York: 2010. [DOI] [Google Scholar]
- 23.Meredith P, Sarna T. The physical and chemical properties of eumelanin. Pigment cell Res. 2006;19:572–94. doi: 10.1111/j.1600-0749.2006.00345.x. [DOI] [PubMed] [Google Scholar]
- 24.Aaseth J, Olsen A, Halse J, Hovig T. Argyria-tissue deposition of silver as selenide. Scand J Clin Lab Invest. 1981;41:247–51. doi: 10.3109/00365518109092041. [DOI] [PubMed] [Google Scholar]
- 25.Smith RW, et al. Chrysiasis revisited: a clinical and pathological study. Br J Dermatol. 1995;133:671–8. doi: 10.1111/j.1365-2133.1995.tb02737.x. [DOI] [PubMed] [Google Scholar]
- 26.Dupasquier M, Stoitzner P, Van Oudenaren A, Romani N, Leenen PJM. Macrophages and dendritic cells constitute a major subpopulation of cells in the mouse dermis. J Invest Dermatol. 2004;123:876–9. doi: 10.1111/j.0022-202X.2004.23427.x. [DOI] [PubMed] [Google Scholar]
- 27.Choi CHJ, Alabi CA, Webster P, Davis ME. Mechanism of active targeting in solid tumors with transferrin-containing gold nanoparticles. Proc Natl Acad Sci U S A. 2010;107:1235–1240. doi: 10.1073/pnas.0914140107. [DOI] [PMC free article] [PubMed] [Google Scholar]
- 28.Kreibig U, Genzel L. Optical absorption of small metallic particles. Surf Sci. 1985;156:678–700. [Google Scholar]
- 29.Brodell LA, Rosenthal KS. Skin Structure and Function. Infect Dis Clin Pract. 2008;16:113–117. [Google Scholar]
- 30.Blanpain C, Fuchs E. Epidermal homeostasis: a balancing act of stem cells in the skin. Nat Rev Mol Cell Biol. 2009;10:207–17. doi: 10.1038/nrm2636. [DOI] [PMC free article] [PubMed] [Google Scholar]
- 31.Scheuplein RJ, Blank IH. Permeability of the skin. Physiol Rev. 1971;51:702–47. doi: 10.1152/physrev.1971.51.4.702. [DOI] [PubMed] [Google Scholar]
- 32.Lee HA, et al. Biodistribution of quantum dot nanoparticles in perfused skin: evidence of coating dependency and periodicity in arterial extraction. Nano Lett. 2007;7:2865–70. doi: 10.1021/nl071563c. [DOI] [PubMed] [Google Scholar]
- 33.Laboratories International. C R CD-1 Nude Mouse Clinical Pathology. 2012 at < http://www.criver.com/SiteCollectionDocuments/rm_rm_r_CD-1_Nude_Mouse_clinical_pathology_data.pdf>.
- 34.Bolliger AP, Everds N. In: Lab Mice. Hedrich HJ, editor. Elsevier Inc; 2012. pp. 330–346. [Google Scholar]
- 35.King PD, Perry MC. Hepatotoxicity of chemotherapy. Oncologist. 2001;6:162–76. doi: 10.1634/theoncologist.6-2-162. [DOI] [PubMed] [Google Scholar]
- 36.Johnston DE. Special Considerations in Interpreting Liver Function Tests. Am Fam Physician. 1999;59:2223–2230. [PubMed] [Google Scholar]
- 37.Liu X, Atwater M, Wang J, Huo Q. Extinction coefficient of gold nanoparticles with different sizes and different capping ligands. Colloids Surf B Biointerfaces. 2007;58:3–7. doi: 10.1016/j.colsurfb.2006.08.005. [DOI] [PubMed] [Google Scholar]
- 38.Jasieniak J, Smith L, Embden J, Van Mulvaney P, Califano M. Re-examination of the Size-Dependent Absorption Properties of CdSe Quantum Dots. J Phys Chem C. 2009;113:19468–19474. [Google Scholar]
- 39.Mancini MC, Kairdolf Ba, Smith AM, Nie S. Oxidative quenching and degradation of polymer-encapsulated quantum dots: new insights into the long-term fate and toxicity of nanocrystals in vivo. J Am Chem Soc. 2008;130:10836–7. doi: 10.1021/ja8040477. [DOI] [PMC free article] [PubMed] [Google Scholar]
- 40.Van Gemert MJ, Jacques SL, Sterenborg HJ, Star WM. Skin optics. IEEE Trans Biomed Eng. 1989;36:1146–54. doi: 10.1109/10.42108. [DOI] [PubMed] [Google Scholar]
- 41.Cheong WWF, Prahl SAS, Welch AJA. A review of the optical properties of biological tissues. IEEE J Quantum Electron. 1990;26:2166–2185. [Google Scholar]
- 42.Walkey CD, Chan WCW. Understanding and controlling the interaction of nanomaterials with proteins in a physiological environment. Chem Soc Rev. 2012;41:2780–99. doi: 10.1039/c1cs15233e. [DOI] [PubMed] [Google Scholar]
- 43.Alguire PC, Mathes BM. Skin biopsy techniques for the internist. J Gen Intern Med. 1998;13:46–54. doi: 10.1046/j.1525-1497.1998.00009.x. [DOI] [PMC free article] [PubMed] [Google Scholar]
- 44.Frens G. Controlled nucleation for the regulation of the particle size in monodisperse gold suspensions. Nature. 1973;241:20–22. [Google Scholar]
Associated Data
This section collects any data citations, data availability statements, or supplementary materials included in this article.