Abstract
Clinicopathological paradox has significantly hampered the effective assessment of the efficacy of therapeutic intervention of multiple sclerosis. The neuroimaging biomarkers of tissue injury could guide a more effective treatment by accurately reflecting the underlying subclinical pathologies. Diffusion tensor imaging-derived directional diffusivity and anisotropy indices have been applied to characterize white matter disorders. However, these biomarkers are sometimes confounded by complex pathologies seen in multiple sclerosis and its animal models. Recently, a novel diffusion basis spectrum imaging has been developed to quantitatively assess axonal injury, demyelination, and inflammation in a mouse model of inflammatory demyelination. Lenaldekar, which inhibits T-cell expansion in a non-cytolytic manner, has been shown to suppress relapses and preserve white matter integrity in mice with experimental autoimmune encephalomyelitis. In this study, relapsing-remitting experimental autoimmune encephalomyelitis was induced through active immunization of SJL/J mice with a myelin proteolipid protein peptide. We evaluated the therapeutic efficacy of Lenaldekar treatment via daily clinical score, cross-sectional ex vivo diffusion basis spectrum imaging examination, and histological analysis. Lenaldekar greatly reduced relapse severity and protected white matter integrity in these experimental autoimmune encephalomyelitis mice. Diffusion basis spectrum imaging-derived axial diffusivity, radial diffusivity and restricted diffusion tensor fraction accurately reflected axon, myelin integrity and inflammation associated cellularity change, respectively. These results support the potential use of diffusion basis spectrum imaging as an effective outcome measure for preclinical drug evaluation.
Keywords: Multiple sclerosis, diffusion MRI, axon injury, inflammation, demyelination, DBSI, Lenaldekar, EAE
Introduction
Multiple sclerosis is an inflammatory demyelinating disorder of the central nervous system (CNS) characterized by lymphocytic infiltration and axon and myelin injury (1). Although inflammatory demyelination is the hallmark of the white matter pathology, axonal injury is now widely accepted to play a significant role in irreversible neurological disability (1,2). Currently, an efficacious therapy to stop the progressive neurodegeneration in multiple sclerosis is still not yet available.
Myelin-specific autoreactive T cells mediate the early lesion formation (3) and correlate with the extent of acute axonal injury in multiple sclerosis (4). Thus, autoreactive T cell modulation can be a potential therapeutic approach for human multiple sclerosis. Lenaldekar (LDK), 1H-indole-3-carbaldehyde quinolin-8-yl-hydrazone, is an anti-leukemia agent proven to effectively eliminate immature T cells (5). It was found to inhibit relapses and reduce demyelination in mice with experimental autoimmune encephalomyelitis (EAE) (6).
With promising new therapies for multiple sclerosis on the horizon, novel neuroimaging modalities providing quantitative assessment of CNS axonal integrity are needed to noninvasively assess the treatment efficacy. Conventional MRI has revolutionized the diagnosis of multiple sclerosis. Nevertheless, they are hardly quantitative and lack specificity differentiating complicated pathologies. Advanced MR methods such as myelin water imaging (7) and magnetization transfer ratio (8) have emerged to reflect myelin integrity in multiple sclerosis. Diffusion tensor imaging (DTI), has shown promise to differentiate axon from myelin pathologies through changes in axial diffusivity (λ‖, describing water diffusion parallel to axons) and radial diffusivity (λ⊥, describing water diffusion perpendicular to axons) (9,10). However, interpretation of these DTI findings is confounded by the presence of inflammation (11,12), tissue loss (13), crossing fibers (14), and cerebrospinal fluid contamination (15,16). A novel diffusion basis spectrum imaging (DBSI) has been developed to resolve crossing fiber tracts, remove cerebrospinal fluid partial volume effects, and quantitatively assess axonal injury, demyelination, and inflammation in a mouse model of cuprizone induced inflammatory demyelination (17).
In this study, the therapeutic efficacy of LDK treatment was assessed by treating EAE mice at the first relapse. Spinal cords from EAE and control mice were examined using diffusion MRI and immunohistochemistry (IHC). Significant preservation of myelin and axon integrity was observed by DBSI derived λ‖ and λ⊥ in LDK-treated mice. The extent of inflammation was also accurately reflected by DBSI derived cellularity. DBSI derived λ‖, λ⊥, and cellularity correlated with IHC findings. In contrast, the DTI findings did not accurately reflect treatment effect. Our studies indicate that DBSI has major advantages over DTI.
Materials and Methods
DBSI
The diffusion MRI signals were analyzed according to Eq. [1] (17):
| [1] |
In Eq. [1], Sk and are the diffusion-weighted MR signal and b-value of the kth diffusion gradient, NAniso is the number of anisotropic tensors (reflecting fibers), Ψik is the angle between the kth diffusion gradient and the principal direction of the ith anisotropic tensor, λ‖_i and λ⊥_i are the axial and radial diffusivities of the ith anisotropic tensor, fi is the signal intensity fraction for the ith anisotropic tensor, and a and b are the low and high diffusivity limits for the isotropic diffusion spectrum (reflecting cellularity and edema) f(D). In the present study, a single anisotropic tensor (i.e., NAniso = 1) fit the spinal cord white matter well. Thus, the derived λ‖ and λ⊥ were interpreted similarly to those derived by DTI but without extra-axon isotropic tensor components confounding the measurements. The isotropic diffusion spectrum was tentatively divided based on ADC values to 3 components representing cellularity (restricted diffusion), vasogenic edema (hindered diffusion), and cerebrospinal fluid or tissue loss (free diffusion).
Animal preparation
To induce EAE, 15 female SJL/J mice (Jackson Laboratory, Bar Harbor, ME, USA) were injected subcutaneously with 200 µg/mL of myelin proteolipid protein (PLP) peptide (PLP139–151) in complete Freund’s adjuvant (CFA) consisting of incomplete Freund's adjuvant (Pierce Biotechnology, Rockford, IL, USA) containing Mycobacterium tuberculosis H37 Ra (2 mg/mL) (Difco Laboratories, Detroit, MI, USA). On days 0 and 2 following immunization, mice were intravenously injected with 100 µL of Bordetella pertussis with an initial concentration of 1.0 × 10¹¹ organisms/ml (Michigan Department of Public Health, Lansing, MI, USA). Five additional mice which received only CFA in the absence of PLP139–151 served as age and sex matched controls (sham group). Mice were scored daily for clinical signs using a standard 0 – 5 scoring system: 1 = limp tail; 2 = hind limb weakness sufficient to impair righting; 3 = one limb paralyzed; 4 = two limbs paralyzed; 5 = three or more limbs paralyzed or the animal is moribund (mice were euthanized if they reached grade 5). At the first remission [clinical score (CS) = 0], 5 mice were euthanized and subjected to intra-cardiac perfusion fixation using 0.01 M PBS followed by 4% paraformaldehyde in 0.01 M PBS. Vertebral columns were excised and post-fixed in the same fixative overnight then transferred to 0.01 M PBS. Upon first relapse (CS ≥ 0.5), the remaining ten EAE mice were injected intraperitoneally with 40 mg/kg per day of LDK (n = 5) or vehicle [dimethyl sulfoxide (DMSO), n = 5] till the study end point when all EAE mice were at the second remission (CS = 0). All LDK- and vehicle-treated EAE and sham control mice were euthanized and perfusion fixed at the end point of the study.
MRI
For ex vivo MRI scans, excised vertebral columns were put in 1ml syringes filled with 0.01 M PBS. A solenoid coil of 8 mm in diameter and 25 mm in length was used for data acquisition. Ex vivo diffusion MRI examinations were performed on a 4.7 T Agilent DirectDrive small animal MRI system (Agilent technologies, Santa Clara, CA, USA), equipped with Magnex/Agilent HD imaging gradients (Magnex/Agilent, Oxford, UK). The magnet, gradient coil and gradient power supply were interfaced with an Agilent DirectDrive console (Agilent Technologies) controlled by a Linux workstation.
A sagittal image of the mouse vertebral column was acquired using a gradient echo sequence to visualize vertebral discs, as references to plan the target axial images. A diffusion weighted, multi-echo spin echo imaging sequence (18) was employed to acquire diffusion weighted images of eight contiguous transverse slices covering T12 through L2 vertebrae. Acquisition parameters were: Field-of-View 9 × 9 mm2, data matrix 128 × 128 (resulting in voxel dimension of 70 µm × 70 µm, zero-filled to 35 µm × 35 µm), TR 1.0 sec, TE 38 ms, Δ 20 ms, δ 5 ms, slice thickness 1.0 mm, and 99 diffusion-encoding directions prescribed by placing the position vectors at the grid points (qx, qy, qz) in the 3-D q-space under the relationship that (qx2+qy2+qz2) ≤ r2, where r = 3 (17). The max b-value = 3000 s/mm2. Total data acquisition time was 3 hours and 31 minutes.
Histological Analysis
Following ex vivo imaging, mouse vertebral columns were decalcified for 48 hours and then embedded in paraffin. The embedded tissues were sectioned using a sliding microtome set at 5-µm thickness. Then, the slides were deparaffinized, rehydrated and blocked using 1% bovine serum albumin and 5% goat serum in 0.01 M PBS for 30 minutes at room temperature. Myelin and axon integrity were assessed by incubating the processed slides with polyclonal anti-myelin basic protein (MBP; 1:500 dilution; Sigma Chemical Company, St. Louis, MO, USA), and monoclonal anti-phosphorylated neurofilaments (SMI31; 1:1000 dilution; Convance, Emeryville, CA, USA) antibodies, respectively, at 4°C overnight. After rinsing in 0.01 M PBS for 30 minutes, the slides were incubated with Alexa Fluor 488 conjugated goat-anti-mouse IgG (H+L) (1:400 dilution; Invitrogen Co. Camarillo, CA. USA) antibody for 1 hour at room temperature to visualize immunoreactive materials. After washing in 0.01 M PBS for 30 minutes, the slides were mounted in Vectashield Medium with DAPI (4',6-diamidino-2-phenylindole; Vector Laboratory, Burlingame, CA, USA). DAPI stains cell nuclei. DAPI stains cell nuclei. It was used to validate the reliability of DBSI-derived restricted isotropic diffusion component as a cellularity marker. Increased cellularity reflects the extent of inflammation as it is commonly seen in CNS inflammation. Images were acquired with a Hamamatsu NanoZoomer 2.0-HT System (Hamamatsu, Japan).
The whole field of each staining (SMI31, MBP, or DAPI) image at 40 × magnification was captured with the same fluorescence light intensity and exposure time. Using ImageJ (http://rsbweb.nih.gov/ij/), all captured images were converted to 8-bit gray scale and subjected to background subtraction followed by Gaussian blurring (DAPI images) or edge preservation (SMI31 and MBP images). Then, the DAPI and SMI31 images were segmented using gray-scale watershed algorithm, quantified using the “analyze particles” function following threshold. The MBP images, on the other hand, were directly quantified using the “analyze particles” function following automatic threshold without segmentation.
Data analysis
The diffusion weighted MR data were analyzed via a DTI/DBSI analysis package developed in-house using MatLab® (MathWorks, Natick, MA, USA). The ventral-lateral white matter (VLWM) area was manually delineated as the region of interest (ROI) on the b0 (non-diffusion weighted) image using ImageJ with customized tools. DTI-derived λ‖, λ⊥ and relative anisotropy (RA) maps were used as references while defining VLWM ROIs. Group-averaged DTI- and DBSI-derived parameters, SMI31-positive axon density, DAPI-stained cell density and MBP-positive region fraction were compared for the VLWM region between sham control, EAE at 1st remission, EAE at 2nd remission with LDK and vehicle treatment. Wilcoxon rank-sum test was used to determine whether any differences existed among these groups and a significant level of 0.05 was used for all tests. The P values were adjusted using false discovery rate (FDR) to account for the large number of tests. Spearman’s rank correlation was used to test for the presence of monotone increasing or decreasing associated between IHC results and DTI or DBSI parameters. All data are expressed as mean ± standard deviation (SD).
Results
LDK prevented EAE relapse
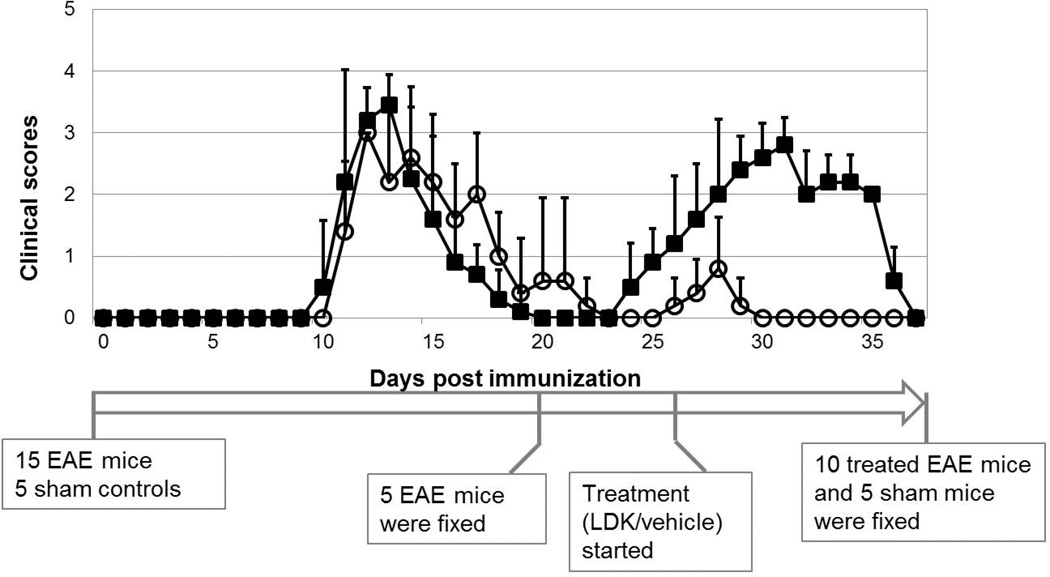
The initial neurological disability associated with an acute attack of EAE in SJL/J mice was observed between days 10 to 12 post immunization with PLP139–151, the first relapse occurred at days 25 to 29, and remitted at days 36 to 37 in vehicle-treated EAE mice (Fig. 1, filled squares). Five EAE mice were euthanized after the 1st remission (at day 21). LDK or vehicle treatment was initiated on the day of observed EAE relapse (CS ≥ 0.5, day 26) and was continued daily thereafter. The treatment continued until the 2nd remission of all EAE mice (day 37). LDK effectively ameliorated EAE relapse. The mean peak CS during the relapse of the LDK-treated group was 0.8 ± 0.8, while that of the vehicle-treated group was 2.8 ± 0.4. At day 30 post immunization and beyond, none of the LDK-treated mice showed any clinical signs of disease (Fig. 1, open circles) while the vehicle-treated mice still showed significant clinical signs of disease (Fig. 1, filled squares).
Figure 1. Clinical score time course of LDK- and vehicle-treated EAE mice.
Female SJL/J mice were immunized with PLP139–151 peptide in CFA. Upon EAE relapse at day 26, the mice were injected with LDK (40 mg/kg/day, open circle) or vehicle (DMSO, filled square) once a day for days 26–37. The mean clinical score was less in the LDK-treated group during the EAE-relapse. Data represent mean clinical scores ± standard derivation (STD), for groups of 5 mice.
DTI detected axon and myelin injury at remissions
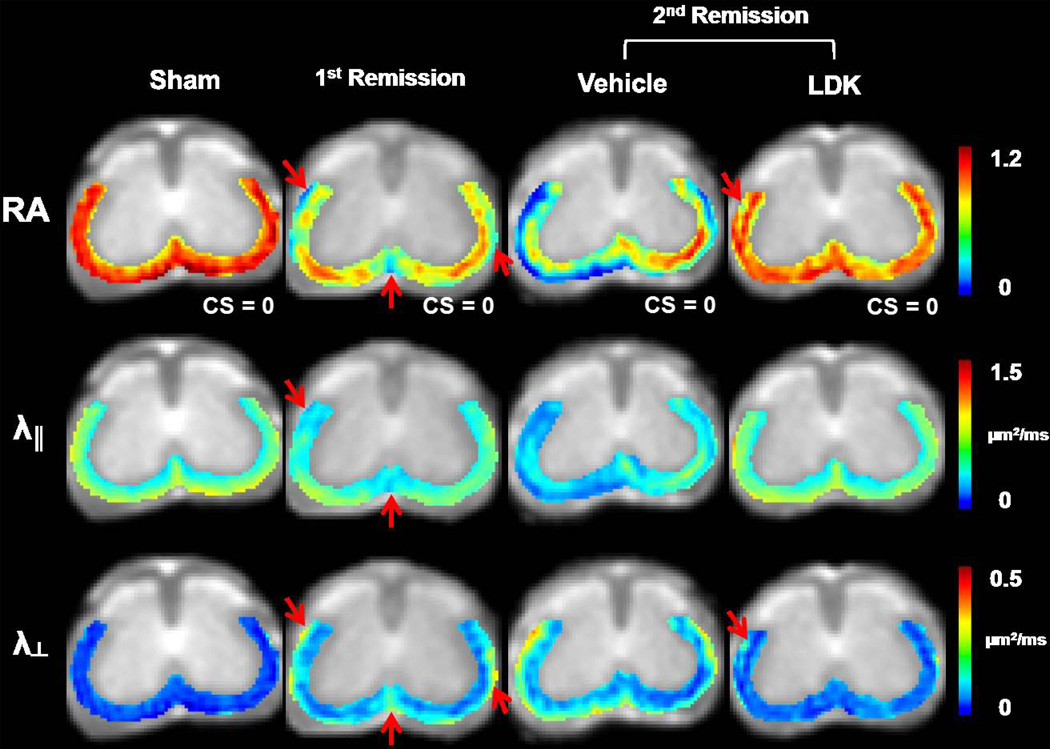
Color-coded DTI maps of the VLWM region were overlaid on T2 weighted images (Fig. 2). White matter tract lesions were detected on representative DTI parameter maps at the T13 vertebral level of the spinal cord from EAE mice at the 1st and 2nd remission (Fig. 2). At the 1st remission, before treatment, decreased λ‖ and RA, as well as increased λ⊥, were visible in the VLWM regions (arrows, 2nd column, Fig. 2). At the 2nd remission, RA and λ‖ showed a further decrease, and λ⊥ increased more in the VLWM of vehicle-treated spinal cords (3rd column, Fig. 2). At the 2nd remission following LDK treatment, normal appearing VLWM λ‖ was seen (4th column, Fig. 2). A slight increase in VLWM λ⊥ of the LDK-treated mouse resulted in an apparent RA decrease in the same region (arrows, 4th column, Fig. 2).
Figure 2. Representative DTI maps.
Color-coded RA, λ‖, and λ⊥ maps of the VLWM region were overlaid on gray-scale T2 weighted images. One set of DTI maps are shown for one representative mouse spinal cord at the T13 level from each of the 4 groups. At the 1st remission, a decrease in RA was detected at the VLWM, especially at perivascular regions (arrows). Decreased λ‖ and increased λ⊥ were also detected in the same areas. At the 2nd remission, the vehicle-treated mouse exhibited markedly decreased RA and λ‖ as well as increased λ⊥. The perivascular and meningeal white matter areas were most severely injured, which formed a “hypointense border” lining the RA and λ‖ maps. In contrast, the LDK-treated mouse exhibited normalized λ‖ at the 2nd remission. However, slightly increased λ⊥ was still seen at the VLWM, resulting in decreased RA (arrows).
DBSI detected axon/myelin injury and inflammation at emissions
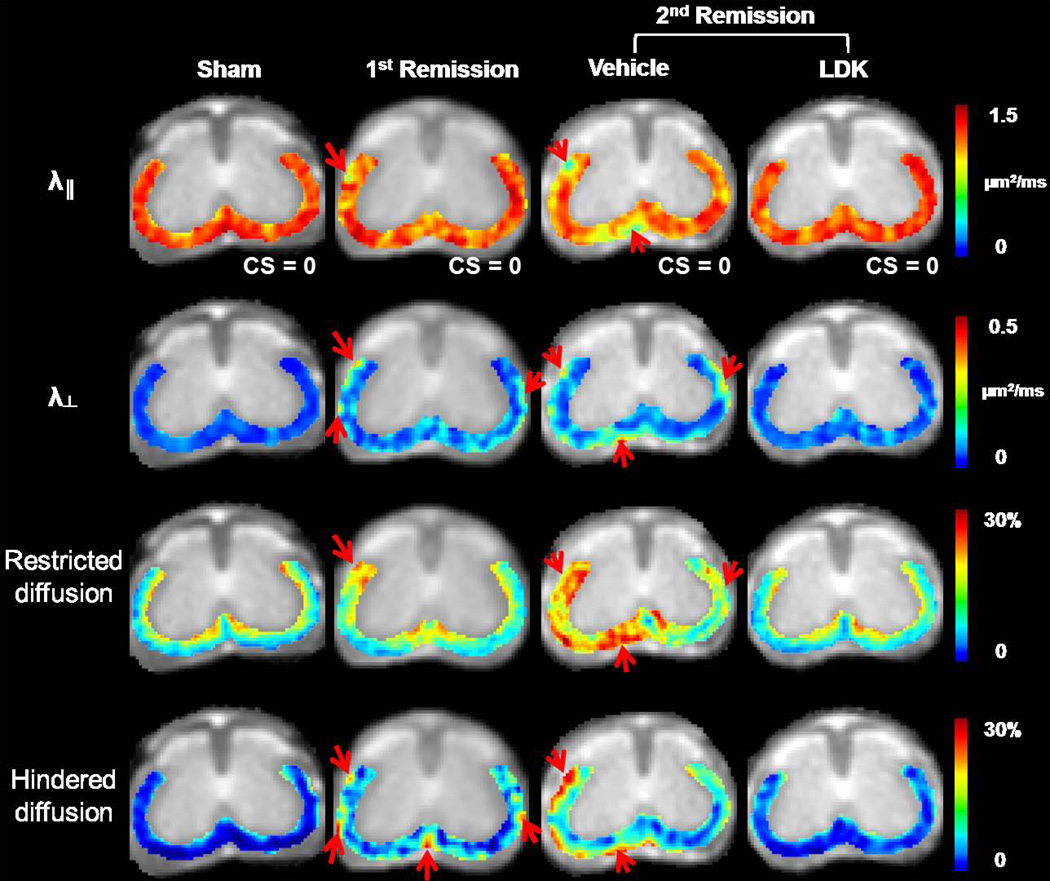
The VLWM of spinal cords from the same representative mice as seen in Fig. 2 were examined using DBSI. Compared to the sham control spinal cord (1st column, Fig. 3), the EAE spinal cord exhibited moderately decreased λ‖ in the VLWM at the 1st remission (arrow, 2nd column, Fig. 3). Increased λ⊥ was also observed in the same representative spinal cord (arrows, 2nd column, Fig. 3). At the 2nd remission, increased patchy lesions can be seen in the VLWM of the vehicle-treated mouse, marked by significantly decreased λ‖ and increased λ⊥ (arrows, 3rd column, Fig. 3). In addition, a substantial increase in restricted and hindered diffusion fraction can be seen in the vehicle-treated mouse spinal cord at the 2nd remission (arrows, 3rd column, Fig. 3). With therapeutic LDK treatment (4th column, Fig. 3), all DBSI parameters of the representative mouse spinal cord exhibited an overall improvement comparing with those of the vehicle treated. Residual patches of lesions remained visible in the λ⊥ map.
Figure 3. Representative DBSI maps.
Color maps of λ‖, λ⊥, and restricted and hindered diffusion fractions are shown at the T13 level for the same representative mouse spinal cords as shown in Figure 2. Compared to the sham mouse, the EAE mouse showed moderately decreased λ‖ in the VLWM at the 1st remission. An observed increase in λ⊥ was detected in the representative spinal cord at this time point (arrows). At the 2nd remission, a further decrease in λ‖ and increase in λ⊥ are readily detected in the representative vehicle-treated mouse. Patchy lesions were seen at the periphery of the VLWM, marked by significantly decreased λ‖ and increased λ⊥ (arrows). A substantially increased fraction of restricted isotropic diffusion was overwhelmingly seen in the left VLWM. The fraction of hindered isotropic diffusion increased in the peripheral VLWM. With therapeutic LDK treatment, all DBSI parameters were improved compared to the vehicle-treated group. The λ‖, and restricted and hindered water ratios of LDK-treated mouse spinal cord were comparable to those of the sham control spinal cord, yet the λ⊥ was still elevated.
LDK preserved axons, reduced inflammation, and prevented demyelination
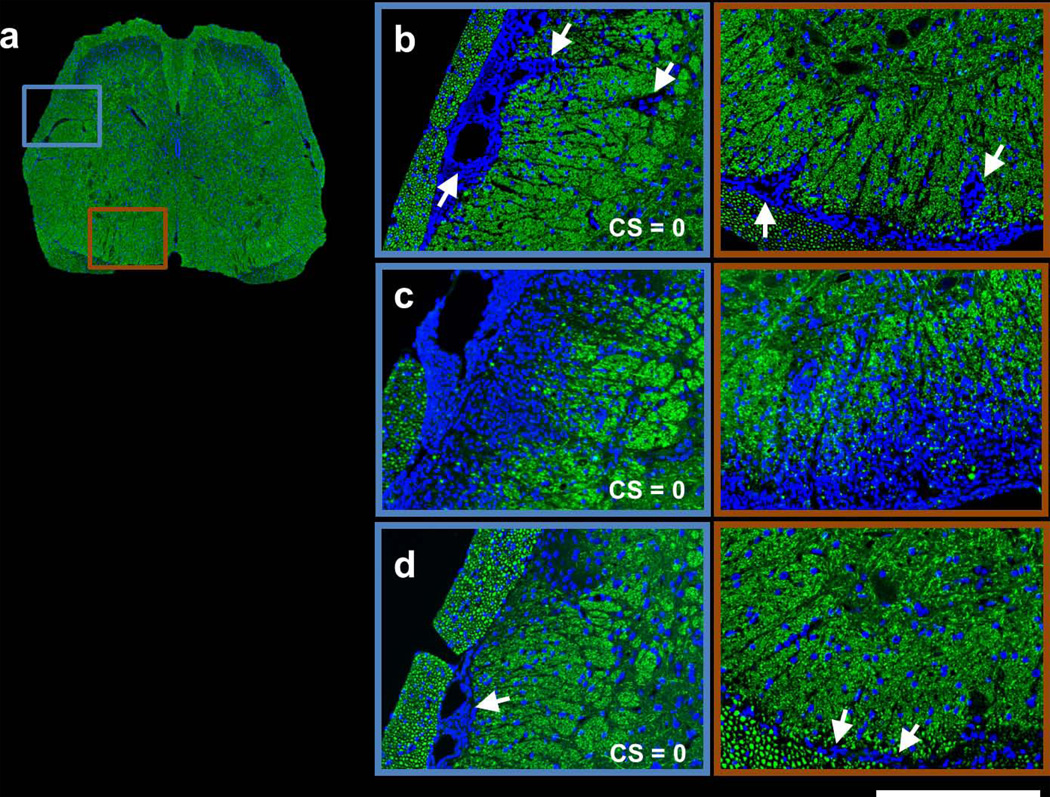
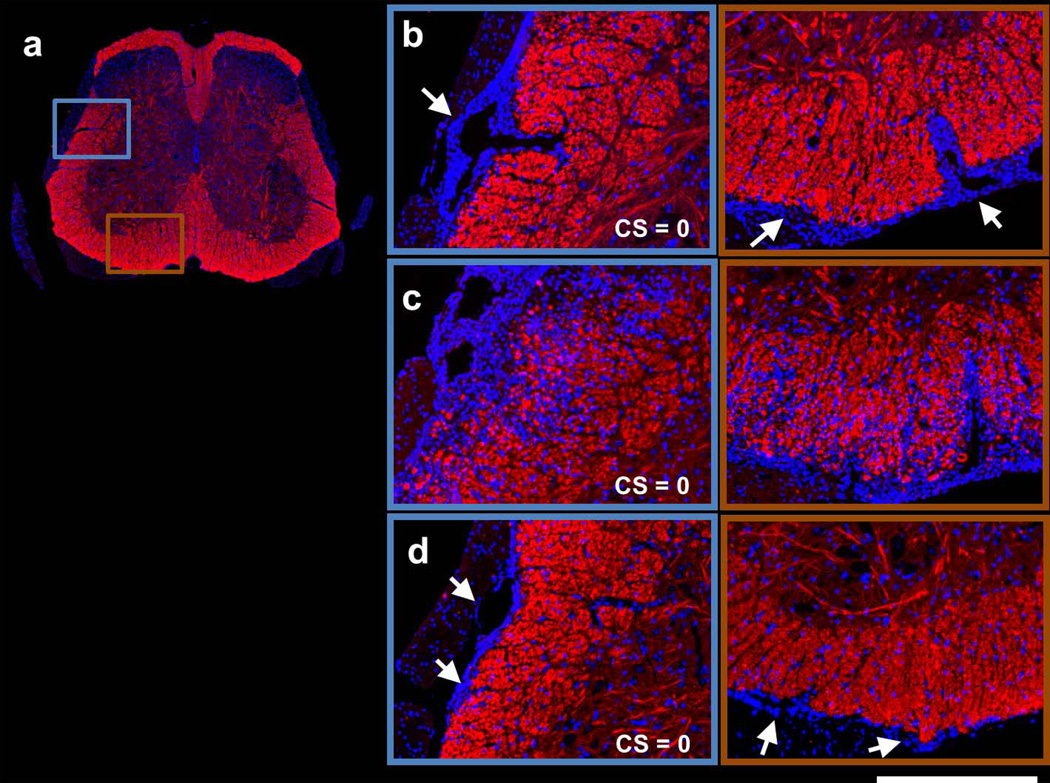
In Figure 4, SMI31 and DAPI double-stained images are shown for the same representative spinal cord from each group at the T13 vertebral level. At the 1st remission, massive meningeal and perivascular (arrows) cell infiltration was seen in the VLWM (Fig. 4b). At the 2nd remission, a markedly increased and diffuse cell population was observed in the representative vehicle-treated spinal cord, coinciding with substantial loss of SMI31-positive axons (Fig. 4c). In contrast, the representative LDK-treated spinal cord at the 2nd remission exhibited significantly decreased cellularity and increased SMI31-positive axon staining (Fig. 4d). Nevertheless, meningeal cell aggregation (arrows) was still seen in the LDK-treated spinal cord (Fig. 4d). MBP and DAPI double-stained images (Fig. 5) revealed moderate demyelination at the proximity of the meninges with massive cell aggregation at the 1st remission (Fig. 5b). At the 2nd remission, progression of myelin damage was apparent in the vehicle-treated spinal cord (Fig. 5c). Myelin staining of the spinal cord appeared normal in the representative LDK-treated EAE mouse at the 2nd remission while perivascular and meningeal cell infiltration were still visible (arrows, Fig. 5d).
Figure 4. SMI31 and DAPI double-stained spinal cord images of representative sham control (a), 1st remission (b), 2nd remission vehicle-treated (c), and 2nd remission LDK-treated (d) mice.
Images are shown for the same representative spinal cord as in Figures 2 and 3 from each group at the T13 level. For the representative sham control mouse, the entire spinal cord is displayed (a). For the other 3 groups, magnified views of the highlighted boxes in (a) are displayed (b–d). At the 1st remission, massive meningeal cell infiltration (arrows) is readily visible in the VLWM region (b). At the 2nd remission, a markedly increased and diffuse cell population can be seen in the representative vehicle-treated mouse spinal cord, coinciding with substantial loss of SMI31-positive axons (c). In contrast, the representative LDK-treated spinal cord at the 2nd remission exhibited significantly decreased cellularity and increased SMI31-positive axon staining. Nevertheless, meningeal cell aggregation (arrows) was still seen in the LDK-treated spinal cord (d). Scale bar: 250µm.
Figure 5. MBP and DAPI double-stained spinal cord images of representative sham control (a), 1st remission (b), 2nd remission vehicle-treated (c), and 2nd remission LDK-treated (d) mice.
Images are shown for the same representative spinal cord as in Figures 2, 3, and 4 from each group at the T13 level. For the representative sham control mouse, the entire spinal cord is displayed (a). For the other 3 groups, magnified views of the highlighted boxes in (a) are displayed (b–d). The MBP and DAPI double-stained images revealed moderate demyelination at the proximity of the meninges with massive meningeal cell aggregation (arrows) at the 1st remission (b). At the 2nd remission, progression of myelin damage was apparent in the vehicle-treated spinal cord (c). Myelin staining of the spinal cord appeared normal in the representative LDK-treated EAE mouse while perivascular and meningeal cell aggregation was still visible (arrows, d). Scale bar: 250µm.
Group Analysis: axonal injury
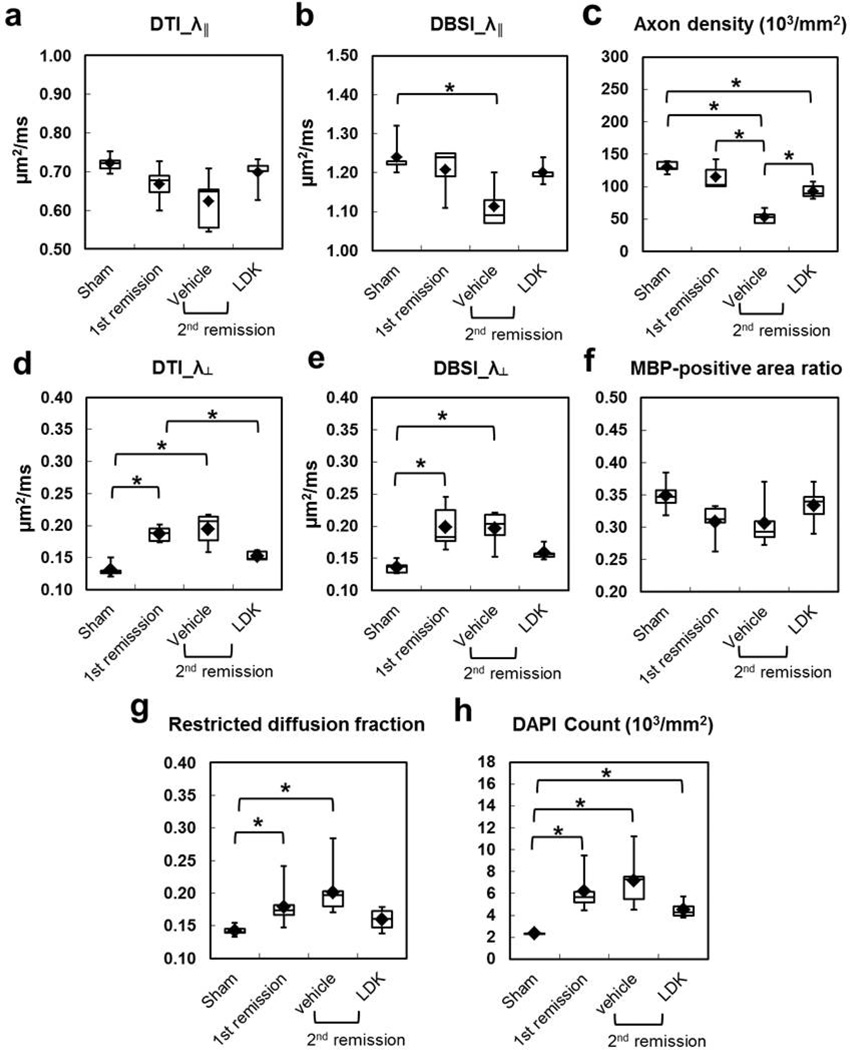
Because of the exclusion of isotropic restricted diffusion tensor component with lower ADC, the DBSI derived λ‖ was systematically higher than that derived by conventional DTI (Fig. 6a and b). Axonal injury at the 1st remission was evidenced by the decreased λ‖ derived by DTI (Fig. 6a) and DBSI (Fig. 6b), as well as the reduction in the SMI31-positive axon density (Fig. 6c) in mice with EAE. However, none of these differences reached a statistical significance, compared to control (sham). At the 2nd remission, DTI/DBSI-derived λ‖ and SMI31-positive axon density decreased further in the vehicle-treated EAE mice. The difference between the 1st remission and 2nd remission-vehicle treated group was statistically significant for SMI31-positive axon density. Neither DTI- or DBSI-derived λ‖ in the LDK-treated group at the 2nd remission decreased as seen in the vehicle-treated group. Higher DTI- and DBSI-derived λ‖ was seen in the LDK-treated group than in the vehicle-treated group at the 2nd remission without reaching statistical significance. This is consistent with a significantly higher SMI31-positive axon density in the LDK-treated group compared to the vehicle-treated group at the 2nd remission.
Figure 6. Group analysis of diffusion MR-derived metrics and histology quantifications at VLWM.
Group-averaged DTI- (a) and DBSI- (b) derive λ‖, DTI-(d) and DBSI-(e) derived λ⊥, DBSI-derived fraction of restricted diffusion as well as SMI31-positive axon density (c), MBP-positive area (f), and DAPI-stained cell density (h) were compared for the VLWM region between sham control, EAE at 1st remission, and EAE at 2nd remission with LDK and vehicle treatment (5 mice per group) as described in the Methods. DBSI-derive λ‖ (b) was systematically higher than DTI-derive λ‖ (a). LDK-treated mice showed higher DBSI-derive λ‖ (b) and SMI31-positive axon density (c), consistent with the preservation of axons, compared to vehicle-treated mice at the 2nd remission time point. LDK-treated mice showed lower DTI- (a) and DBSI- (without statistical significance) (b) derive λ⊥ compared to vehicle-treated mice at the 2nd remission time point and compared to mice at the 1st remission time point. LDK treatment also resulted in higher MBP staining, consistent with improved myelin integrity, compared to vehicle-treated mice at the 2nd remission time point and mice at the 1st remission time point. Meanwhile, LDK-treated mice showed reduced restriction diffusion and cell density compared to vehicle-treated mice at the 2nd remission time point and compared to mice at the 1st remission time point.
Group Analysis: demyelination
Significantly increased λ⊥ derived by both DTI and DBSI was seen in EAE mice at the 1st remission compared to the sham group (Fig. 6d, e). At the 2nd remission, the vehicle-treated EAE mice showed comparable λ⊥ relative to the mice in the 1st remission (Fig. 6d, e). However, mice treated with LDK showed a lower λ⊥ at the 2nd remission than non-treated EAE mice at the 1st remission and vehicle-treated EAE mice at the 2nd remission. In line with these DTI- and DBSI-derived λ⊥ findings, reduced MBP staining was seen in EAE groups at the 1st and 2nd remission (Fig. 6f). LDK treatment improved the myelin integrity at the 2nd remission compared with vehicle treatment, but this improvement did not reach statistical significance.
Group Analysis: Inflammation
The DBSI-derived fraction of the restricted isotropic diffusion tensor component was significantly increased in EAE mice without treatment at the 1st remission and in the vehicle-treated group at the 2nd remission, compared to the sham group (Fig. 6g). In the LDK-treated EAE mice, the restricted isotropic diffusion tensor component fraction was lowered compared to that of the 1st remission and the 2nd remission vehicle-treated group, even though no statistical significance was detected. This is consistent with the DAPI-positive nuclear staining results (Fig. 6h).
Group Analysis: Correlating diffusion MRI findings with histology
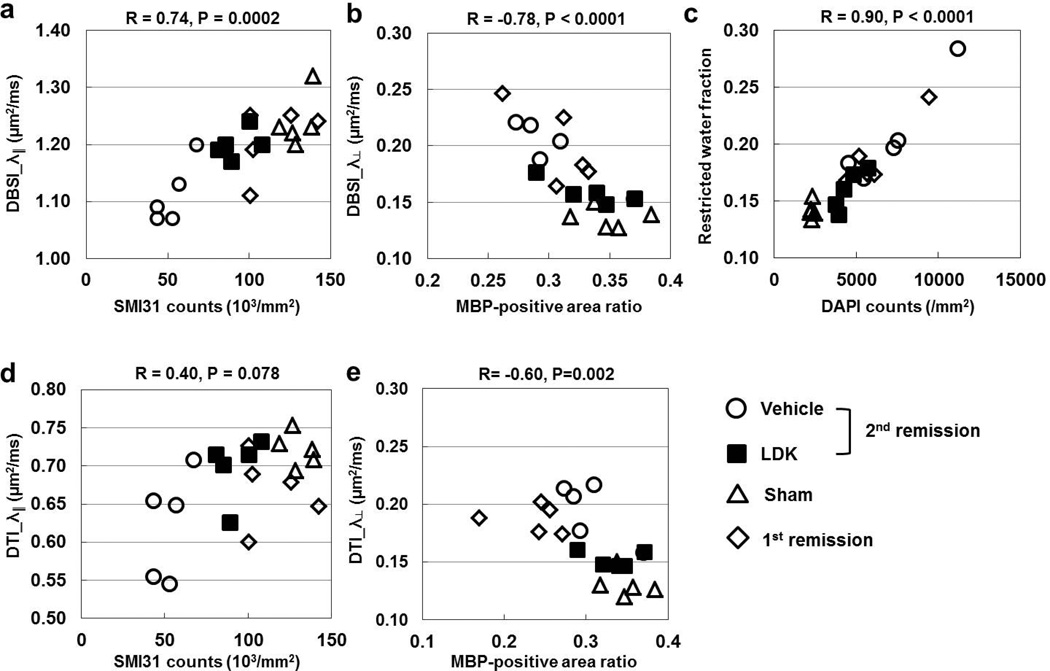
DBSI-derived λ‖ and λ⊥ showed strong correlation with SMI31-positive axon density and MBP-positive myelin area, respectively (Fig. 7a, b). The DBSI-derived restricted isotropic diffusion tensor component fraction correlated with the DAPI density (Fig. 7c). The DTI-derived λ‖ did not correlate with SMI31-positive axon counts (Fig. 7d). The DTI-derived λ⊥, on the other hand, demonstrated correlation to MBP-positive myelin area with lesser significance than that of DBSI.
Figure 7. Correlations between DTI/DBSI-derived biomarkers and histological quantifications.
Correlations between DBSI/DTI-derived λ‖ (a, d) and λ⊥ (b, e) and SMI31-positive axon density (a, d) and MBP-positive area (b, e), respectively, and between DBSI-derive fraction of restricted diffusion and DAPI-stained cell density (c) are plotted for individual mice as determined from the VLWM region of sham control, EAE at 1st remission, and EAE at 2nd remission with LDK and vehicle treatment (5 mice per group). As demonstrated by the R and P values above each graph, correlation is significant in all cases except the DTI-derived λ‖ vs. SMI31-positive axon counts.
Discussion
In this study, we verified the previously reported therapeutic efficacy of LDK on relapsing-remitting EAE in mice (6) by performing a cross-sectional examination of white matter integrity of the spinal cord using both ex vivo diffusion MRI and IHC. Diffusion MRI findings supported the utility of the newly developed DBSI to not only more accurately reflect axonal and myelin integrity but also assess the extent of inflammation. All animals at the time of examination exhibited no hindlimb disabilities (CS = 0, Fig. 1) with various degrees of white matter pathologies reflected by diffusion MRI (Fig. 2 and 3) and IHC (Fig. 4 and 5), suggesting the need for a biomarker to assess disease progression and treatment efficacy overcoming the clinicopathological paradox.
The sensitivity of in vivo DTI-derived λ‖ and λ⊥ to reflect IHC-detected axonal and myelin injury in EAE mouse spinal cord white matter has been reported (19–22). Consistent with previous reports, current ex vivo DTI derived λ‖ and λ⊥ correctly reflected lesions detected by SMI31 and MBP staining (Figs. 2, 4, and 5). Perivascular and meningeal lesions were seen in SMI31/MBP images as well as in DTI-derived λ‖ and λ⊥ maps reflecting the hallmark EAE pathologies. The loss of SMI31 and MBP staining largely appeared at the regions with increased DAPI staining, yet not all SMI31/MBP lesions co-localized with positive DAPI staining. Similar to DTI, DBSI-derived λ‖ and λ⊥ also reflected SMI31 and MBP detected lesions in EAE mice (Figs. 3, 4, and 5), suggesting a potential role for diffusion MRI as an outcome measure for assessing EAE spinal cord pathologies.
It has been reported that the presence of high cellularity decreases the DTI-derived λ‖ (23). Thus, an exaggerated decrease in DTI-derived λ‖ might result from the region where axonal injury occurred with increased DAPI staining (i.e., increased cellularity associated with inflammation). This could explain the over-estimated axon injury by DTI in the 1st remission group compared to the sham group (Fig. 6a). To take this confound into account, DBSI models diffusion MRI signals as a linear combination of anisotropic (discrete axonal fiber tracts) and isotropic (various inter-axonal components reflecting vasogenic edema and cellularity) diffusion tensors. By removing the confounding effect from isotropic diffusion associated with inflammation or tissue loss, DBSI-derived fiber directional diffusivity more accurately reflects the diffusion characters of axonal tracts. Thus, there was a closer trend between DBSI-derived λ‖ and SMI31-positive axon density (Fig. 6b, c) than between DTI-derived λ‖ and SMI31-positive axon density (Fig. 6a, c). In addition, DBSI enables the estimation of increased cellularity (restricted diffusion) and vasogenic edema (hindered isotropic diffusion) associated with inflammation. Although there is not an IHC equivalent of vasogenic edema reflected by hindered isotropic diffusion, the restricted diffusion component offers a putative surrogate marker reflecting the extent of increased DAPI-positive nuclear counting (Fig. 3, 4, and 5).
It is thought that relapse-remitting EAE is initiated via perivascular and meningeal lymphocyte and neutrophil infiltration, followed by resolution of the inflammatory infiltrate and progression of axon and myelin damage (24). At the 1st remission, a significant increase in DBSI-estimated restricted isotropic diffusion tensor fraction (Fig. 6g) and cell density (Fig. 6h) was observed. Meanwhile, we saw a decreased λ‖ and increased λ⊥ derived by DBSI in the EAE mice at 1st remission relative to the sham control (Fig. 6b, e). These changes in directional diffusivity were consistent with the observed decrease in SMI31-positive axon density (Fig. 6c) and MBP-positive area fraction (Fig. 6f), respectively. Thus, pathologically, both DBSI and IHC results suggest that moderate axon/myelin damage and only partial resolution of inflammation occurred at the 1st remission, although full functional recovery was suggested by clinical signs (CS = 0, Fig. 1).
The underlying mechanisms of remission following the acute paralytic attack are not well understood. However, it has been demonstrated that the EAE relapse is mediated predominantly by T cells, specific for endogenous myelin epitopes, which are activated as a result of myelin debris generated from acute inflammatory demyelination, a phenomenon known as epitope spreading (25,26). At the 2nd remission, further damage to the axons was detected in the spinal cord from vehicle-treated EAE mice using both DBSI (significantly decreased λ‖ comparing to that of the sham group) and histology assessment (significantly decreased SMI31-positive axon density comparing to that of the 1st remission) (Fig. 6b, c). Interestingly, the extent of myelin injury seen in the spinal cord from vehicle-treated EAE mice at the 2nd remission was comparable to that in the 1st remission (Fig. 6e, f). This might be due to a potential remyelination process occurring in these EAE mice. Meanwhile, further increased cellularity was also observed in the vehicle-treated EAE mouse spinal cord at the 2nd remission (Fig. 6h). Both DBSI and histology results suggested an increased mean cellularity in the VLWM region relative to the 1st remission without a statistical significance (Fig. 6g, h).
LDK was first found to be a potent inhibitor of immature leukemic T cells, and it both dephosphorylated members of the phosphatidylinositol 3 kinase (PI3K)/AKT/mammalian target of rapamycin (mTOR) pathway and delayed sensitive cells in late mitosis (5). Later, LDK’s efficacy in treating relapsing-remitting EAE in mice was demonstrated, and the mechanism was thought to possibly involve modulation of highly active T cells in a non-cytolytic manner (6). Here, the treatment efficacy of LDK in the same EAE model was reproduced (Fig. 1). Current findings further demonstrated that cellularity in the LDK-treated group decreased at the 2nd remission comparing to the vehicle-treated group (Figs. 6g, h). Thus, an overall inflammation suppression effect can be reasonably inferred. In addition, remyelination was also suggested by the improved myelin integrity detected by diffusion MRI and IHC after LDK treatment at the onset of EAE relapse (Fig. 7d – f). The improvement in DBSI-derived λ‖ and SMI31-positive axon density in the LDK-treated group compared to the vehicle-treated group at the 2nd remission indicated the potential for axonal protection by LDK through either anti-inflammatory or potentially direct action (Fig. 6b, c).
In summary, DBSI offered more accurate estimation of white matter integrity relative to DTI in this EAE model reflected by significantly higher correlation to IHC results. Meanwhile, DBSI-derived cellularity marker successfully characterized the inflammatory feature of this model and reflected the anti-inflammatory effect of LDK. The excellent linear correlation between restricted diffusion fraction and DAPI counts supports its use as a surrogate marker for cellularity in EAE, multiple sclerosis or other neuroinflammatory disease.
Acknowledgements
We would like to thank Daniel J. Doty for technical assistance. This work was supported in part by the Emma Mary Deland Foundation (R.S.F.), the National Institute of Health T32AI055434 (M.F.C.), R01-NS082102 (R.S.F.), R01-NS047592 (S.-K.S.), P01-NS059560 (S.-K.S.), National Multiple Sclerosis Society (NMSS) RG 4549A4/1 (S.-K.S.), and Department of Defense Ideal Award W81XWH-12-1-0457 (S.-K.S.).
Abbreviations
- CFA
complete Freund’s adjuvant
- CS
clinical score
- DBSI
diffusion basis spectrum imaging
- DTI
Diffusion tensor imaging
- EAE
experimental autoimmune encephalomyelitis
- IHC
imunohistochemistry
- LDK
Lenaldekar
- RA
relative anisotropy
- ROI
region of interest
- VLWM
ventral-lateral white matter
References
- 1.Trapp BD, Nave KA. Multiple sclerosis: An immune or neurodegenerative disorder? Annual Review of Neuroscience. 2008;31:247–269. doi: 10.1146/annurev.neuro.30.051606.094313. [DOI] [PubMed] [Google Scholar]
- 2.Bitsch A, Schuchardt J, Bunkowski S, Kuhlmann T, Bruck W. Acute axonal injury in multiple sclerosis. Correlation with demyelination and inflammation. Brain. 2000;123(Pt 6):1174–1183. doi: 10.1093/brain/123.6.1174. [DOI] [PubMed] [Google Scholar]
- 3.McFarland HF, Martin R. Multiple sclerosis: a complicated picture of autoimmunity. Nat Immunol. 2007;8(9):913–919. doi: 10.1038/ni1507. [DOI] [PubMed] [Google Scholar]
- 4.Frischer JM, Bramow S, Dal-Bianco A, Lucchinetti CF, Rauschka H, Schmidbauer M, Laursen H, Sorensen PS, Lassmann H. The relation between inflammation and neurodegeneration in multiple sclerosis brains. Brain : a journal of neurology. 2009;132(Pt 5):1175–1189. doi: 10.1093/brain/awp070. [DOI] [PMC free article] [PubMed] [Google Scholar]
- 5.Ridges S, Heaton WL, Joshi D, Choi H, Eiring A, Batchelor L, Choudhry P, Manos EJ, Sofla H, Sanati A, Welborn S, Agarwal A, Spangrude GJ, Miles RR, Cox JE, Frazer JK, Deininger M, Balan K, Sigman M, Muschen M, Perova T, Johnson R, Montpellier B, Guidos CJ, Jones DA, Trede NS. Zebrafish screen identifies novel compound with selective toxicity against leukemia. Blood. 2012;119(24):5621–5631. doi: 10.1182/blood-2011-12-398818. [DOI] [PMC free article] [PubMed] [Google Scholar]
- 6.Cusick MF, Libbey JE, Trede NS, Eckels DD, Fujinami RS. Human T cell expansion and experimental autoimmune encephalomyelitis inhibited by Lenaldekar, a small molecule discovered in a zebrafish screen. Journal of neuroimmunology. 2012;244(1–2):35–44. doi: 10.1016/j.jneuroim.2011.12.024. [DOI] [PubMed] [Google Scholar]
- 7.MacKay A, Whittall K, Adler J, Li D, Paty D, Graeb D. In vivo visualization of myelin water in brain by magnetic resonance. Magnetic resonance in medicine : official journal of the Society of Magnetic Resonance in Medicine / Society of Magnetic Resonance in Medicine. 1994;31(6):673–677. doi: 10.1002/mrm.1910310614. [DOI] [PubMed] [Google Scholar]
- 8.Chen JT, Kuhlmann T, Jansen GH, Collins DL, Atkins HL, Freedman MS, O'Connor PW, Arnold DL, Canadian MSBMTSG. Voxel-based analysis of the evolution of magnetization transfer ratio to quantify remyelination and demyelination with histopathological validation in a multiple sclerosis lesion. NeuroImage. 2007;36(4):1152–1158. doi: 10.1016/j.neuroimage.2007.03.073. [DOI] [PubMed] [Google Scholar]
- 9.Song S-K, Sun S-W, Ju W-K, Lin S-J, Cross AH, Neufeld AH. Diffusion tensor imaging detects and differentiates axon and myelin degeneration in mouse optic nerve after retinal ischemia. NeuroImage. 2003;20(3):1714–1722. doi: 10.1016/j.neuroimage.2003.07.005. [DOI] [PubMed] [Google Scholar]
- 10.Song SK, Sun SW, Ramsbottom MJ, Chang C, Russell J, Cross AH. Dysmyelination revealed through MRI as increased radial (but unchanged axial) diffusion of water. NeuroImage. 2002;17(3):1429–1436. doi: 10.1006/nimg.2002.1267. [DOI] [PubMed] [Google Scholar]
- 11.Sun SW, Liang HF, Trinkaus K, Cross AH, Armstrong RC, Song SK. Noninvasive detection of cuprizone induced axonal damage and demyelination in the mouse corpus callosum. Magnetic resonance in medicine : official journal of the Society of Magnetic Resonance in Medicine / Society of Magnetic Resonance in Medicine. 2006;55(2):302–308. doi: 10.1002/mrm.20774. [DOI] [PubMed] [Google Scholar]
- 12.Xie M, Tobin JE, Budde MD, Chen CI, Trinkaus K, Cross AH, McDaniel DP, Song SK, Armstrong RC. Rostrocaudal analysis of corpus callosum demyelination and axon damage across disease stages refines diffusion tensor imaging correlations with pathological features. J Neuropathol Exp Neurol. 2010;69(7):704–716. doi: 10.1097/NEN.0b013e3181e3de90. [DOI] [PMC free article] [PubMed] [Google Scholar]
- 13.Kim JH, Loy DN, Liang HF, Trinkaus K, Schmidt RE, Song SK. Noninvasive diffusion tensor imaging of evolving white matter pathology in a mouse model of acute spinal cord injury. Magnetic resonance in medicine : official journal of the Society of Magnetic Resonance in Medicine / Society of Magnetic Resonance in Medicine. 2007;58(2):253–260. doi: 10.1002/mrm.21316. [DOI] [PubMed] [Google Scholar]
- 14.Wheeler-Kingshott CA, Cercignani M. About "axial" and "radial" diffusivities. Magnetic resonance in medicine : official journal of the Society of Magnetic Resonance in Medicine / Society of Magnetic Resonance in Medicine. 2009;61(5):1255–1260. doi: 10.1002/mrm.21965. [DOI] [PubMed] [Google Scholar]
- 15.Karampinos DC, Van AT, Olivero WC, Georgiadis JG, Sutton BP. High resolution reduced-FOV diffusion tensor imaging of the human pons with multi-shot variable density spiral at 3T. Conf Proc IEEE Eng Med Biol Soc. 2008;2008:5761–5764. doi: 10.1109/IEMBS.2008.4650523. [DOI] [PubMed] [Google Scholar]
- 16.Cheng YW, Chung HW, Chen CY, Chou MC. Diffusion tensor imaging with cerebrospinal fluid suppression and signal-to-noise preservation using acquisition combining fluid-attenuated inversion recovery and conventional imaging: Comparison of fiber tracking. Eur J Radiol. 2010 doi: 10.1016/j.ejrad.2009.12.032. [DOI] [PubMed] [Google Scholar]
- 17.Wang Y, Wang Q, Haldar JP, Yeh FC, Xie M, Sun P, Trinkaus K, Klein RS, Cross A, Song S. Quantification of increased cellularity during inflammatory demyelination. Brain. 2011;134:3587–3598. doi: 10.1093/brain/awr307. [DOI] [PMC free article] [PubMed] [Google Scholar]
- 18.Tu TW, Budde MD, Quirk JD, Song SK. Using absorption-mode images to improve in vivo DTI quanlity. Proc Intl Soc Mag Reson Med. 2010;18:4001. [Google Scholar]
- 19.Kim JH, Budde MD, Liang HF, Klein RS, Russell JH, Cross AH, Song SK. Detecting axon damage in spinal cord from a mouse model of multiple sclerosis. Neurobiol Dis. 2006;21(3):626–632. doi: 10.1016/j.nbd.2005.09.009. [DOI] [PubMed] [Google Scholar]
- 20.Budde MD, Kim JH, Liang HF, Russell JH, Cross AH, Song SK. Axonal injury detected by in vivo diffusion tensor imaging correlates with neurological disability in a mouse model of multiple sclerosis. NMR Biomed. 2008;21(6):589–597. doi: 10.1002/nbm.1229. [DOI] [PMC free article] [PubMed] [Google Scholar]
- 21.Cruz-Orengo L, Chen YJ, Kim JH, Dorsey D, Song SK, Klein RS. CXCR7 antagonism prevents axonal injury during experimental autoimmune encephalomyelitis as revealed by in vivo axial diffusivity. Journal of neuroinflammation. 2011;8:170. doi: 10.1186/1742-2094-8-170. [DOI] [PMC free article] [PubMed] [Google Scholar]
- 22.Wang X, Brieland JK, Kim JH, Chen YJ, O'Neal J, O'Neil SP, Tu TW, Trinkaus K, Song SK. Diffusion tensor imaging detects treatment effects of FTY720 in experimental autoimmune encephalomyelitis mice. NMR Biomed. 2013 doi: 10.1002/nbm.3012. [DOI] [PMC free article] [PubMed] [Google Scholar]
- 23.Wang Y, Wang Q, Haldar JP, Yeh FC, Xie M, Sun P, Tu TW, Trinkaus K, Klein RS, Cross AH, Song SK. Quantification of increased cellularity during inflammatory demyelination. Brain : a journal of neurology. 2011;134(Pt 12):3590–3601. doi: 10.1093/brain/awr307. [DOI] [PMC free article] [PubMed] [Google Scholar]
- 24.Constantinescu CS, Farooqi N, O'Brien K, Gran B. Experimental autoimmune encephalomyelitis (EAE) as a model for multiple sclerosis (MS) British journal of pharmacology. 2011;164(4):1079–1106. doi: 10.1111/j.1476-5381.2011.01302.x. [DOI] [PMC free article] [PubMed] [Google Scholar]
- 25.McRae BL, Vanderlugt CL, Dal Canto MC, Miller SD. Functional evidence for epitope spreading in the relapsing pathology of experimental autoimmune encephalomyelitis. The Journal of experimental medicine. 1995;182(1):75–85. doi: 10.1084/jem.182.1.75. [DOI] [PMC free article] [PubMed] [Google Scholar]
- 26.McMahon EJ, Bailey SL, Castenada CV, Waldner H, Miller SD. Epitope spreading initiates in the CNS in two mouse models of multiple sclerosis. Nature medicine. 2005;11(3):335–339. doi: 10.1038/nm1202. [DOI] [PubMed] [Google Scholar]


