

Abstract
Background and Aims
Plants in open, uncrowded habitats typically have relatively short stems with many branches, whereas plants in crowded habitats grow taller and more slender at the expense of mechanical stability. There seems to be a trade-off between height growth and mechanical stability, and this study addresses how stand density influences stem extension and consequently plant safety margins against mechanical failure.
Methods
Xanthium canadense plants were grown either solitarily (S-plants) or in a dense stand (D-plants) until flowering. Internode dimensions and mechanical properties were measured at the metamer level, and the critical buckling height beyond which the plant elastically buckles under its own weight and the maximum lateral wind force the plant can withstand were calculated.
Key Results
Internodes were longer in D- than S-plants, but basal diameter did not differ significantly. Relative growth rates of internode length and diameter were negatively correlated to the volumetric solid fraction of the internode. Internode dry mass density was higher in S- than D-plants. Young's modulus of elasticity and the breaking stress were higher in lower metamers, and in D- than in S-plants. Within a stand, however, both moduli were positively related to dry mass density. The buckling safety factor, a ratio of critical buckling height to actual height, was higher in S- than in D-plants. D-plants were found to be approaching the limiting value 1. Lateral wind force resistance was higher in S- than in D-plants, and increased with growth in S-plants.
Conclusions
Critical buckling height increased with height growth due mainly to an increase in stem stiffness and diameter and a reduction in crown/stem mass ratio. Lateral wind force resistance was enhanced due to increased tissue strength and diameter. The increase in tissue stiffness and strength with height growth plays a crucial role in maintaining a safety margin against mechanical failure in herbaceous species that lack the capacity for secondary growth.
Keywords: Allometry, biomechanics, breaking stress, buckling safety factor, cocklebur, internode, metamer, plant height, stand density, stem extension, wind force resistance, Xanthium canadense, Young's modulus of elasticity
INTRODUCTION
Many plant species change their architecture in response to the given environment. Light has a particularly strong influence on plant size and form (Bazzaz and Harper, 1977; Weiner et al., 1990). This is because light is not only an energy source for photosynthesis but has several photomorphogenetic effects (Kendrick and Kronenberg, 1993; Lambers et al., 1998). Plants growing in an open uncrowded habitat typically have a shorter erect stem developing many branches. By contrast, plants growing in crowded stands increase height growth with less branching (Weiner and Thomas, 1992; Weiner and Fishman, 1994; Nishimura et al., 2010). Growing tall has been considered advantageous in surviving under crowded conditions because the plant can intercept high irradiance up in the canopy and at the same time shade shorter neighbouring plants (Givnish, 1982, 1995). Wind is another factor that may induce changes in plant architecture (Grace, 1977; Ennos, 1997). Plants in an open habitat are exposed to stronger winds as compared with plants in crowded stands where wind speeds are greatly attenuated due to mutual protection from wind (Jones, 1992). It is well documented that thigmomorphogenesis is involved in the reduction in stem extension by strong winds (Holbrook and Putz, 1989; Henry and Thomas, 2002; Anten et al., 2005, 2009; Nagashima and Hikosaka, 2012). When saplings of Lyquidambar styraciflua were prevented from swaying by staking the stem to poles, their height growth was accelerated to such an extent that they were not able to sustain their own weight and fell down when the poles were removed (Holbrook and Putz, 1989). Stem extension in crowded stands, whether it is in response to a light gradient or to protection from wind, makes plants mechanically less stable. Even when plants sustain their own weight, they must withstand additional external forces resulting, for example, from rain, snowfall or strong winds.
As plants grow taller, they have to invest disproportionate amounts of resources in stem diameter in order to maintain mechanical stability: the stress similarity model predicts that diameter should increase with a 2nd power of plant height and the elastic similarity model that diameter should increase with a 3/2 power of plant height (McMahon, 1973; McMahon and Kronauer, 1976; Niklas, 1993a). However, many species, particularly herbaceous ones that lack the capacity for secondary growth, increase height more than proportionately to diameter growth. This suggests that such plants increase height at the expense of mechanical stability, indicating a trade-off between height growth and mechanical stability. Shorter plants in an open habitat may have a greater mechanical stability, which is advantageous in growing in windy, hazardous, but well-lit environments. Taller plants in a dense stand with a lower mechanical stability may be an adaptation for growing in a light-limited, less windy environment. Growing tall is indispensable for the plants in such environments, as they will otherwise be outcompeted.
Plants grow by successively producing new metamers at the tip. A metamer derives from the meristem activity and is composed of an internode and the upper node with its attached leaf or leaves and subtended axillary buds (White, 1979, 1984; Barlow, 1989). The main axis of the plant is produced by the activity of the apical meristem, and branches come out from the activity of axillary meristems. Different size and number of metamers and the position and length of branches confer different architectures on plants (Geber, 1990; McSteen and Leyser, 2005; Barthélémy and Caraglio, 2007). In this paper, we first describe the growth of plants at the metamer level. A trade-off between growth and mechanical stability may be found at this level: young metamers near the tip grow faster but may be less stiff and mechanically weaker than lower older metamers that have ceased extension. A greater flexibility of the top part of the plant, however, may reduce mechanical stress on the stem base, as it allows for easier reconfiguration under wind loading. Relating mechanical properties to the growth of internode length and diameter, we investigate the factors involved in the trade-off. Second, we determine critical buckling height of the plant from Young's modulus of elasticity and the diameter of the basal stem to calculate safety margins against elastic buckling under its own weight. The maximum lateral wind force the plant withstands before breaking was calculated from the breaking stress (modulus of rupture) of the basal stem and distribution of leaf area along the stem. We assess the extent to which measures of mechanical stability of plants (i.e. their buckling safety factor and resistance against lateral wind forces) change with increasing stature and analyse how these effects are associated with changes in stem allometry and stem tissue strength and stiffness.
MATERIALS AND METHODS
Experimental set-up
Xanthium canadense (cocklebur) was used for the experiment. This annual species originated from North America, but it is now naturalized widely in Japan. Relatively large seed size allows the species to grow rapidly to make a dense monospecific stands that out-compete other species in disturbed areas with nutrient-rich soil (Shitaka and Hirose, 1993). Fruits (burs) were collected from a large population at the shore of Lake Kamahusa, Sendai. The experimental set-up was the same as described by Watari et al. (2012). Briefly, the experiment was conducted in a house (5 × 10 × 2·5 m) made of frames covered with a sheet of white fine mesh, set in the experimental garden of Tokyo University of Agriculture, Tokyo (35°38′N, 139°38′E). The light level in the house was approx. 85 % of full sunlight. Monthly mean daily screen air temperature in the experimental period (2007) was 18·8 °C in May, 22·5 °C in June, 23·8 °C in July and 28·3 °C in August. Seeds were sown on 1 May 2007 in 170 pots (each 100 mm in diameter and 250 mm in depth) filled with washed river sand. Germination was completed on 5 May. On 17 May, 50 pots were used to raise solitary plants (hereafter, S-plants): pots were placed with a wide spacing from each other to make an open stand (5 × 5 m, 4 plants m–2). The other 120 pots were used to raise plants at high density (hereafter, D-plants): pots were arranged tightly to make a dense stand (1·2 × 1·0 m, 100 plants m–2). Seedlings were thinned to leave one plant per pot. One hundred millilitres of nutrient solution (Otsuka-I and II, Otsuka Co. Inc., Osaka, Japan) containing 26 mg nitrogen and other nutrients proportionately was added per pot every week from 1 June until the end of the growth experiment (9 August). The experiment was finished just before flowering to exclude confounding effects of flowering on plant growth. Plants were watered with tap water as needed. The dense stand was enclosed with shade-cloth of 50 % light transmission to reduce radiation penetrating through sides of the stand. The top of the shade-cloth was shifted with the increase in plant stature. Pots were rotated every week to remove position effects within stands. When pots were removed for harvest (see below), remaining pots were rearranged to maintain the same plant density as before.
Measurements of plant growth
Five focal plants were randomly selected from the open and the dense stands and marked by a waterproof pen for subsequent censuses on emergence and growth of metamers. Emergence was defined when the metamer reached 5 mm in length. Metamers were numbered upwards from the metamer just above cotyledons (referred to as MN1, 2, etc.). Internode length and diameter and leaf lamina length were recorded every 7 d from 17 May (date of stand establishment, day 0). Internode length was measured with a ruler to the nearest 1 mm. Diameter of the internode was determined as the geometric mean of two measurements taken in perpendicular directions to 0·1 mm with digital calipers at the midpoint of the internode. For branches, only total length, basal diameter (diameter of the first internode of the branch) and lamina length of attached leaves were recorded. To estimate the leaf area and dry mass of focal plants at 0, 28 and 56 d after stand establishment, five other plants were randomly selected from each stand for harvest on the day when focal plants were measured. At the final census (84 d) focal plants were harvested. Harvested plants were brought to the laboratory, where internode length and diameter and lamina length were determined in the same manner as in the non-destructive measurements. Plants were then separated individually into leaf, stem and root. Root was defined at the cotyledon level and was carefully removed of sand particles in running water. The stem was separated into internodes. Leaves and stems were placed in plastic bags lined with wet tissue paper to prevent desiccation before determination of fresh mass. Internode volumes were determined from a change in meniscus before and after submerging a fresh internode in water in a measuring cylinder. Leaf area was measured with image-processing software (LIA 32, http://www.agr.nagoya-u.ac.jp%7Eshinkan/LIA32/index-e.html) after scanning (GT-9300UF; Epson, Nagano, Japan). All harvested materials were dried in an oven at 60 °C for 5 d to determine their dry mass.
Fresh and dry mass density of internodes (i.e. fresh and dry mass per unit internode volume) were calculated for every metamer of harvested plants and the value was used to estimate internode fresh and dry mass of focal plants on the first three census dates. Similarly, leaf fresh and dry mass per unit leaf area of harvested plants were used to estimate leaf fresh and dry mass and leaf area of focal plants on the first three census dates. Relative growth rates (RGRs) of internode length and diameter were calculated for focal plants assuming an exponential growth between successive censuses: RGR = (ln xi+1 – ln xi)/(ti+1 – ti), where xi is either internode length or internode diameter at census date ti.
Volumetric fractions of solid, water and gas
We determined volumetric fractions of solid, water and gas in the internode because these fractions may play an important role in determination of the growth and mechanical stability of the stem (Gartner et al., 2004; Poorter, 2008). The fraction of internode volume in solid material was determined as dry mass density (dry mass per fresh volume) divided by the density of the solid fraction. We assumed the density of the solid fraction to have the constant value 1500 kg m–3 as determined for pure wood material (Dinwoodie, 2000) because cell walls are the principal components in the solid fraction in both wood and herb stems (Niklas, 1992) and no data were available for the solid fraction in herbaceous plants. The fraction of internode volume occupied by water was calculated as (fresh mass – dry mass)/fresh internode volume = (fresh mass density) – (dry mass density). The fraction of gas was determined by subtracting the solid and water fractions from 1·0.
Measurements of mechanical properties
Two mechanical properties were measured for stem sections: the Young's modulus of elasticity (E) and breaking stress (modulus of rupture, σb). E is the rate of change of stress with strain, indicating tissue stiffness; σb is the minimum stress at which the tissue breaks, indicating tissue strength (Niklas, 1992). Measurements were made on 8 and 9 August 2007 for ten replicate plants each from open and dense stands. Plants were brought to the laboratory in the evening 1 d before measurement, watered and placed in the dark until measurement. Leaves were removed beforehand from the plant with a razor blade. Stem segments 100 mm long were cut from the plant to avoid nodes at the middle. The central 80-mm section of the segment was used for the measurement and calculation of mechanical properties. One section included 3–5 internodes in S-plants and 1–3 internodes in D-plants. Up to two segments per plant were taken from S-plants and 2–6 segments per plant from D-plants. Stem segments were placed horizontally across two metal bars placed in parallel, separated by 80 mm from each other. Weights (W) were loaded at the midpoint (40 mm from both ends) of the stem section and vertical displacement (δ) was measured to 0·1 mm using digital calipers. After checking whether the segment restored the original form when weights were removed, weights were increased in small steps. Weights were increased until the stem section permanently broke. Diameter, fresh and dry mass and fresh volume of stem sections used for mechanical measurements were determined in the same manner as above.
E (N m–2) was calculated from a linear portion of the regression of δ (m) against W (N) with the equation for a beam supported by two points (i.e. three-point bending, Gere and Timoshenko, 1999):
 |
(1) |
where L is the length of the stem section ( = 0·08 m) and I the second moment of area. Assuming the stem cross-section to be circular with diameter D (m), I can be calculated as
 |
(2) |
The breaking stress (σb, N m–2) was determined from the weight at the breaking point as
 |
(3) |
with
 |
(4) |
where M is the bending moment and W* the load that is supported just before failure occurred (Gere and Timoshenko, 1999).
Mechanical stability
Two measures for mechanical stability were calculated: the buckling safety factor (BSF) and the maximum lateral wind force a plant resists before breaking (Fmax). Buckling is a failure of the structure that is subject to high compressive or tensile stresses, where the actual compressive or tensile stresses are smaller than the maximum compressive or tensile stresses the material is able to withstand (Niklas, 1992). BSF is calculated as the critical buckling height (Hcr) divided by its actual height (H):
 |
(5) |
Hcr was calculated using the formula of Greenhill (1881) for a uniform column:
 |
(6) |
where g is a constant for the acceleration due to Earth's gravity ( = 9·8 m s–2), ρ (g m–3) the ratio of above-ground plant fresh mass to stem volume and D the basal stem diameter (internode diameter of MN1). The value 0·792 presumes that the force inducing elastic buckling is distributed equally over the full length of each vertical stem (Niklas, 1994). This formula treats stems as idealized columns, ignoring tapering and uneven loading. However, its results are comparable to those of more complicated models (Holbrook and Putz, 1989; Henry and Thomas, 2002; Anten et al., 2005). In X. canadense we found that plant fresh mass (main stem + crown mass) was more or less evenly distributed along the main axis. Here ‘crown’ indicates the whole structure supported by the main stem, i.e. foliage leaves (and inflorescences, if any) including branch stems. ρ may be given by
 |
(7) |
where ρs (g m–3) is the main-stem fresh mass density and R is the ratio of crown fresh mass to main-stem fresh mass.
Fmax (N) was calculated according to Anten et al. (2005):
 |
(8) |
where Hlf (m) is the weighted average height of leaves on the plant and calculated as
 |
(9) |
where hi and Ai are, respectively, the height and leaf area of metamer number i, and AT is the total leaf area of the entire plant.
We determined E and σb on 8 and 9 August (84 d after stand establishment), as described above. E and σb of the basal stem (internode for MN1) at 28 and 54 d were estimated by assuming that the distribution of internode E and σb along metamer numbers did not change through plant growth when metamer numbers were counted from the uppermost metamer downward. For example, S-plants had eight metamers at 28 d and 21 metamers at 84 d. Then E for the internode of MN1 at 28 d was obtained as the value for MN14 ( = 21–8 + 1) at 84 d. The latter was estimated from the regression line determined between metamer number and E at 84 d (see below).
Statistics
The effects of stand (open or dense) and age on volume fractions of solid, water and gas and on mechanical stability (BSF and Fmax) and variables that determined BSF and Fmax (ρ, ρs, σb, D, E, H, Hcr, Hlf and R) were tested using a Tukey–Kramer test. Pearson's correlation coefficients were calculated between volume fractions and between dry mass density and RGR in length or diameter of internodes. Polynomial equations were applied for the relationship between metamer number (independent variable) and E or σb (dependent variables). For the effects of internode dry mass density on E and σb, allometric power equations were used, where dry mass density was an independent variable and E and σb were dependent variables. Regression coefficients were determined by the least squares method. The effects of stand and metamer number on E or σb and effects of stand and internode dry mass density were tested by the generalized linear model analysis with a normal distribution and an identity link, where both metamer number and dry mass density were regarded as continuous variables. Significance was defined at P < 0·05.
The relationships between H and D and between Hcr and D were determined with the reduced major axis regression analysis because none of these parameters was an independent variable, i.e. each was subject to natural variation (Niklas, 1994). The functional relationships among these variables took the form of the allometric power equation. Regression analyses and comparison among regression lines were done with SMATR (Warton et al., 2006). All other analyses were performed with JMP statistical software (version 9.0.3, SAS Institute Inc., Cary, NC, USA) and figures were prepared with KaleidaGraph (Synergy Software, Maxwell Inc., Reading, PA, USA).
RESULTS
Plant growth
Xanthium canadense plants from the dense stand (D-plants) grew faster in height than plants from the open stand (S-plants) (Fig. 1; for dry mass growth see Watari et al., 2012). D-plants reached approx. 1·05 m in height at 84 d after stand establishment, when S-plants reached approx. 0·38 m. Difference in plant height between S- and D-plants was small until 34 d, indicating that interference among individuals intensified after 34 d in the dense stand. The basal stem diameter (internode diameter of MN1) continued to increase although the rate slowed down later in the experimental period. Over the course of the experiment, 21 and 22 metamers were produced in S- and D-plants, respectively. The rate of metamer production was 0·22 and 0·23 d–1 in S- and D-plants (4·5 and 4·3 d per metamer, respectively).
Fig. 1.
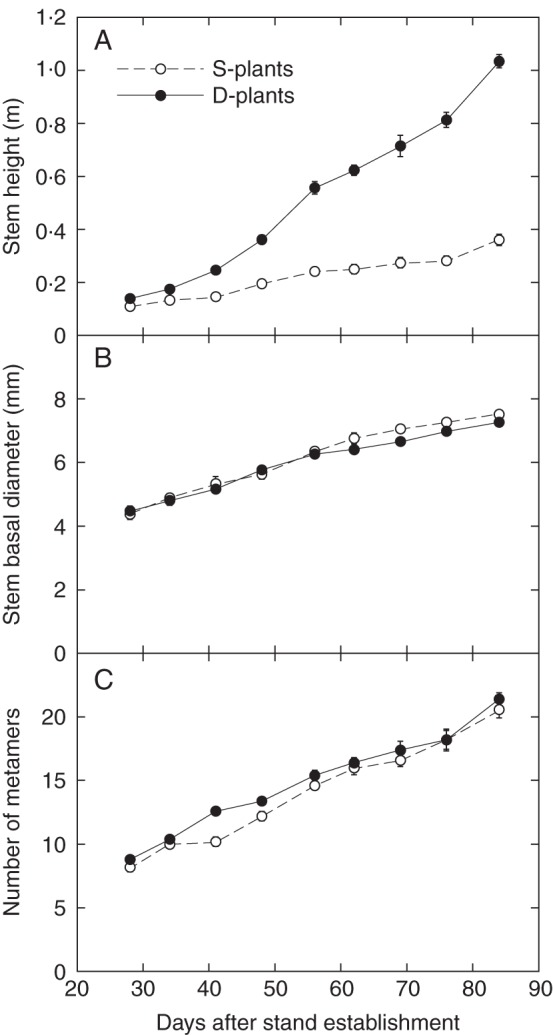
Changes in stem height (A), basal stem diameter (B) and the number of metamers in the main stem (C) of Xanthium canadense plants grown in an open stand (S-plants) or in a dense stand (D-plants). Values are mean ± s.e. (n = 5).
Internode length and diameter
As the number of metamers did not differ between S- and D-plants, greater stem height of D-plants was attributable to their longer internodes (Fig. 2). Internode length of lower metamers did not differ between S- and D-plants; large differences were observed in intermediate and upper metamers. The internode length of MN2 was short (<1 mm) so that the first two leaves looked like opposite leaves. Internode length showed a sigmoid growth curve: the growth rate was slow at first, then accelerated and slowed down to reach a ceiling length. The ceiling length was fairly constant in S-plants (around 2 cm, at least < MN13, except MN2), whereas it varied in D-plants, with mid metamers (MN10 and 11) having the highest ceiling length of ∼10 cm.
Fig. 2.

Length (A,B) and diameter (C,D) of internodes, plotted against metamer in Xanthium canadense plants grown in an open stand (S-plants; A,C) or in a dense stand (D-plants; B,D). Metamers are numbered upwards from the stem base. Measurement dates are indicated in A. Values are mean ± s.e. (n = 5).
In both S- and D-plants, internode diameter was fairly constant in lower half metamers but tapered to the tip in upper metamers (Fig. 2C, D). Upper internodes were thinner in D- than in S-plants, but lower ones were not. All internodes continued to increase in diameter throughout the experimental period although the growth rate gradually lowered. While RGR of internode length reached zero in lower metamers, RGR of diameter did not (Fig. 3).
Fig. 3.

Relative growth rate (RGR) of internode length (A,B) and diameter (C,D) in the main stem of Xanthium canadense plants grown in an open stand (S-plants; A,C) or in a dense stand (D-plants; B,D), plotted against metamer number. Metamers are numbered upwards from the stem base. Calculated for the period indicated in A. Values are mean ± s.e. (n = 5).
Internode volume and its fractions in solid, water and gas
The solid fraction increased with plant age (up to 27 %) and decreased toward upper internodes (down to approx. 8 %; Fig. 4). Average solid fractions were higher in S- than in D-plants at 56 and 84 d (Table 1, where no difference in fractions was assumed at 28 d when interferences among plants were low). Water occupied the largest fraction of the internode volume. It decreased with plant age and increased toward upper internodes (reaching up to 90 %). As the three fractions add up to 1·0, negative correlations are expected between them: the correlation was strongest between solid and water (r = −0·764), less strong between water and gas (r = −0·462), and weakest between gas and solid (r = −0·218). All were significant at P < 0·001. The stronger correlation of solid to water than gas indicates that reduction in solid fraction was due to the increase in water rather than gas fractions.
Fig. 4.

Internode volume (A,B) and its fraction in solid (C,D), water (E,F) and gas (G,H). Internode dry mass density is plotted on the right-hand ordinate of C and D. The main stem of Xanthium canadense plants grown in an open stand (S-plants; A,C,E,G) or in a dense stand (D-plants; B,D,F,H), determined 28, 44 and 84 d after stand establishment, plotted against metamer number. Metamers are numbered upwards from the stem base. Values are mean ± s.e. (n = 5).
Table 1.
Volumetric fractions of solid, water and gas in the stem of X. canadense plants grown in an open stand (S-plants) or in a dense stand (D-plants) 28, 56 and 84 d after stand establishment
| Solid | Water | Gas | |
|---|---|---|---|
| Day 28 | |||
| S- and D-plants | 0·09 ± 0·00ab | 0·84 ± 0·03a | 0·07 ± 0·03a |
| Day 56 | |||
| S-plants | 0·16 ± 0·01c | 0·78 ± 0·02ab | 0·06 ± 0·02a |
| D-plants | 0·07 ± 0·00b | 0·86 ± 0·01a | 0·07 ± 0·01a |
| Day 84 | |||
| S-plants | 0·23 ± 0·01d | 0·74 ± 0·00b | 0·03 ± 0·01a |
| D-plants | 0·11 ± 0·01a | 0·79 ± 0·02ab | 0·10 ± 0·02a |
Values are mean ± s.e. (n = 5). Different letters within a column denote significant differences among means at P < 0·05 (Tukey–Kramer test).
Mechanical properties
Young's modulus of elasticity (E), a measure of tissue stiffness, was higher in D- than in S-plants when compared at the same metamer number (Fig. 5A, Table 2). It decreased with increasing metamer numbers in both S- and D-plants, but the difference between the lowest and the uppermost metamers was smaller in S-plants. Younger tissues had lower E than older tissues, and E of the youngest tissue did not differ between S- and D-plants. Within stands there was a positive correlation between dry mass density and E (Fig. 5B). However, this relationship was uncoupled and reversed when compared between stands; D-plants exhibited lower mass density but higher E than S-plants.
Fig. 5.

Young's modulus of elasticity (A,B) and breaking stress (C,D) as functions of metamer number (A,C) and of internode dry mass density (B,D). Xanthium canadense grown in an open stand (S-plants, open circle with dashed line) or in a dense stand (D-plants, closed circle with solid line). Regression lines: A, y = 0·792 + 0·0395x–0·00807x2 + 0·000270x3 (r2 = 0·25, P > 0·1; S-plants), y = 2·08–0·355x + 0·0414x2–0·00161x3 (r2 = 0·70, P < 0·001; D-plants); B, y = 4·94x2·00 (r2 = 0·37, P < 0·001; S-plants), y = 4·53x0·946 (r2 = 0·53, P < 0·001; D-plants); C, y = 19·3–0·178x–0·0341x2 (r2 = 0·37, P < 0·001; S-plants), y = 29·6–1·74x + 0·0152x2 (r2 = 0·78, P < 0·001; D-plants); D, y = 117x2·08 (r2 = 0·88, P < 0·001; S-plants), y = 107x1·30 (r2 = 0·87, P < 0·001; D-plants).
Table 2.
Generalized linear model analysis for the effects of stand and metamer number and the effects of stand and internode dry mass density on Young's modulus and breaking stress
| Factor | d.f. | χ2 | P |
|---|---|---|---|
| Young's modulus | |||
| Stand | 1 | 16·0 | < 0·001 |
| Metamer | 1 | 18·7 | < 0·001 |
| Stand × metamer | 1 | 2·5 | 0·117 |
| Model | 3 | 28·7 | < 0·001 |
| Stand | 1 | 33·0 | < 0·001 |
| Dry mass density | 1 | 29·2 | < 0·001 |
| Stand × dry mass density | 1 | 5·1 | 0·024 |
| Model | 3 | 43·2 | < 0·001 |
| Breaking stress | |||
| Stand | 1 | 0·0 | 0·970 |
| Metamer | 1 | 38·4 | < 0·001 |
| Stand × metamer | 1 | 8·1 | 0·004 |
| Model | 3 | 48·2 | < 0·001 |
| Stand | 1 | 29·8 | < 0·001 |
| Dry mass density | 1 | 48·4 | < 0·001 |
| Stand × dry mass density | 1 | 4·6 | 0·031 |
| Model | 3 | 67·2 | < 0·001 |
Young's modulus, breaking stress and dry mass density were log-transformed. Significant effects are highlighted in bold (P < 0·05).
The breaking stress (σb), a measure of tissue strength, decreased with increasing metamer numbers in both plants. It did not differ significantly between S- and D-plants when scaled on metamer number (Fig. 5C, Table 2). However, σb in lower metamers tended to be higher in D-plants, as indicated by a significant interaction term between stand and metamer number. Within stands there was a positive correlation between dry mass density and σb (Fig. 5D). This relationship was uncoupled when compared between stands. This was mainly because S-plants had a higher dry mass density than D-plants, and less because S-plants had a lower σb.
Critical buckling height (Hcr)
The critical buckling height (eqns 6–8) is the height beyond which a stem elastically buckles under its own plus crown weight. In the following analysis, we assumed the same mechanical properties for S- and D-plants at 28 d, when no significant difference was observed in size between them (see above). E of the basal stem at 28, 56 and 84 d was calculated from the regression equation:
 |
 |
where x is the metamer number and y is E (Fig. 5A). E increased two-fold in S-plants and 3·7-fold in D-plants (Table 3; E at 28 d is a mean of the values derived from the two regression lines). In 28–84 d, the plant fresh mass to main-stem volume ratio (ρ, eqn 7) decreased by 38 and 64 % in S- and D-plants, respectively. As main-stem fresh mass density (ρs) remained fairly constant across stands and ages, different ρ was due to the crown to main-stem fresh mass ratio (R), which had a six-fold difference between the highest (28 d) and the lowest value (D-plants, 84 d). Basal stem diameter did not differ between S- and D-plants, and increased 1·6-fold in 28–84 d in both plants. Hcr calculated from these values increased with age by a factor of 2·0 in S-plants and 2·8 in D-plants. D-plants thus had a greater critical buckling height than S-plants at 56 and 84 d.
Table 3.
Buckling safety factor (BSF = Hcr/H) and its component variables: E, Young's modulus of elasticity; ρs, stem fresh mass density; R, crown to stem fresh mass ratio; ρ, plant fresh mass to stem volume ratio; D, basal stem diameter; H, stem height; Hcr, critical buckling height, for Xanthium canadense plants grown in an open stand (S-plants) or in a dense stand (D-plants) 28, 56 and 84 d after stand establishment
| E (GN m–2) | ρs (Mg m–3) | R (–) | ρ (Mg m–3) | D (mm) | H (m) | Hcr (m) | Hcr/H | |
|---|---|---|---|---|---|---|---|---|
| Day 28 | ||||||||
| S- and D-plants | 0·4 ± 0·1a | 0·98 ± 0·03a | 3·0 ± 0·4a | 3·9 ± 0·4a | 4·6 ± 0·4a | 0·16 ± 0·02a | 0·49 ± 0·06a | 3·2 ± 0·2a |
| Day 56 | ||||||||
| S-plants | 0·8 ± 0·0b | 1·02 ± 0·02a | 2·2 ± 0·2a | 3·3 ± 0·1ab | 5·9 ± 0·2b | 0·25 ± 0·02b | 0·75 ± 0·01b | 3·0 ± 0·2a |
| D-plants | 1·2 ± 0·0c | 1·03 ± 0·05a | 0·8 ± 0·0b | 1·9 ± 0·1cd | 6·3 ± 0·1b | 0·52 ± 0·02c | 1·09 ± 0·02c | 2·1 ± 0·1b |
| Day 84 | ||||||||
| S-plants | 0·8 ± 0·0b | 1·08 ± 0·01a | 1·3 ± 0·1b | 2·5 ± 0·1bc | 7·5 ± 0·1c | 0·36 ± 0·02d | 0·99 ± 0·03c | 2·8 ± 0·1a |
| D-plants | 1·5 ± 0·1d | 0·96 ± 0·03a | 0·5 ± 0·0b | 1·4 ± 0·1d | 7·3 ± 0·1c | 1·03 ± 0·02e | 1·40 ± 0·03d | 1·4 ± 0·0c |
Values are mean ± s.e. (n = 5). Different letters within a column denote significant differences among means at P < 0·05 (Tukey–Kramer test).
Reduced major axis regressions of actual stem height (H) and critical buckling height (Hcr) against basal stem diameter (D) gave the following allometric equations:
 |
 |
 |
 |
These regressions are presented in Fig. 6 with a distribution of actual stem heights. SMATR (Warton et al., 2006) indicated significant differences in slope among four regressions (P < 0·001). Post-hoc multiple comparisons showed significant differences in slope (P < 0·001) among regressions except between H of S-plants and Hcr of D-plants.
Fig. 6.
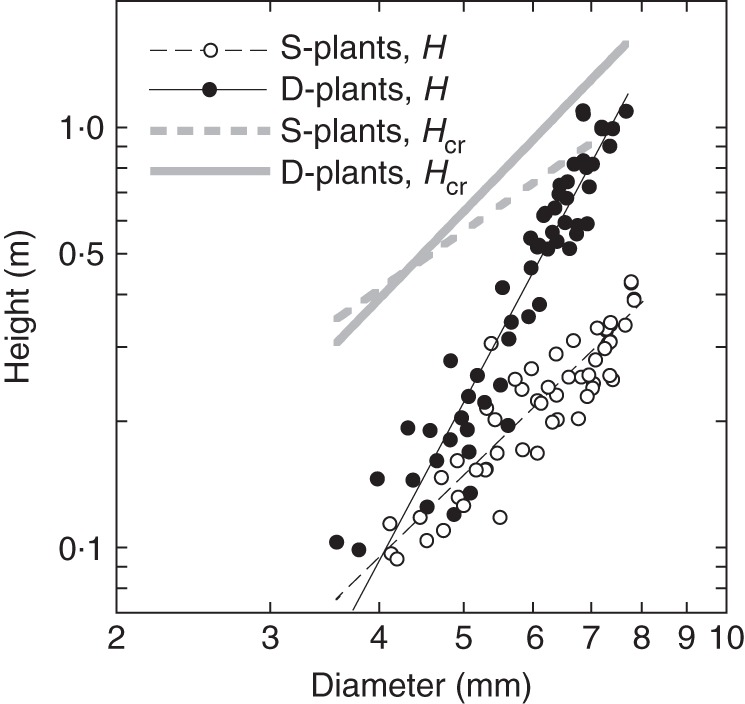
Actual plant height (H) and critical plant height (Hcr) as functions of stem basal diameter. Xanthium canadense grown in an open stand (S-plants) or in a dense stand (D-plants). Reduced major axis regression lines are shown, as indicated in the key.
Actual height and critical height increased with a steeper slope against diameter in D- than S-plants. In both S- and D-plants, the slope for actual height was steeper than the slope for critical height. Note that actual height of D-plants was approaching the critical buckling height, whereas S-plants were still far from the critical line at large diameters. BSF was defined as a ratio of Hcr to H. While S-plants maintained a high BSF, D-plants reduced BSF to 1·4 at 84 d; only a small safety margin was left before buckling under their own weight in D-plants (Fig. 7). BSF declined because the increase in actual height was greater than the increase in critical height. Note that from the above equations for H and Hcr of S-plants, BSF of S-plants is calculated as Hcr/H = 9·8D−0 57. Likewise, BSF of D-plants is calculated as Hcr/H = 48D−1
 75. BSF was thus size-dependent; it declined with increasing D in both plants, but with a steeper slope in D- than in S-plants when BSF and D are plotted logarithmically (−1·75 vs. −0·57).
Fig. 7.

Changes in (A) buckling safety factor (BSF) and (B) maximum lateral wind force (Fmax). Xanthium canadense grown in an open stand (S-plants) or in a dense stand stand (D-plants). Values are mean ± s.e. (n = 5).
Maximum lateral wind force (Fmax)
Fmax was calculated with eqns (8) and (9). It indicates the maximal lateral wind force the plant would be able to withstand and is also called ‘lateral wind force resistance’ (Anten et al., 2005). As plants are exposed to strong winds in the field, a higher Fmax implies greater stability against wind force. Variables that determined Fmax (eqn 8) are given in Table 4. The breaking stress (σb) of the basal stem at 28, 56 and 84 d was estimated from the regression equation:
 |
 |
where x is the metamer number and y is σb (Fig. 5C). σb increased two-fold in S-plants and three-fold in D-plants from 28 to 84 d, basal diameter increased 1·6-fold in S- and D-plants, and average leaf height increased 2·2-fold in S-plants and 6·7-fold in D-plants. As a consequence, Fmax increased 3·6-fold in S-plants and 1·6-fold in D-plants (Table 4, Fig. 7B). Lower Hlf in S- than D-plants ruled out the lower σb to have a higher Fmax in shorter S-plants.
Table 4.
Maximum lateral wind force (Fmax) and its component variables: σb, breaking stress; D, basal stem diameter; Hlf, weighted average height of leaves, for Xanthium canadense plants grown in an open stand (S-plants) or in a dense stand (D-plants) 28, 56 and 84 d after stand establishment
| σb (MN m–2) | D (mm) | Hlf (m) | Fmax (N) | |
|---|---|---|---|---|
| Day 28 | ||||
| S-and D-plants | 9 ± 1a | 4·6 ± 0·4a | 0·12 ± 0·02a | 0·8 ± 0·2a |
| Day 56 | ||||
| S-plants | 16 ± 1b | 5·9 ± 0·2b | 0·19 ± 0·01b | 1·8 ± 0·3b |
| D-plants | 19 ± 1b | 6·3 ± 0·1b | 0·36 ± 0·01c | 1·3 ± 0·1ab |
| Day 84 | ||||
| S-plants | 19 ± 0b | 7·5 ± 0·1c | 0·27 ± 0·02d | 2·9 ± 0·1c |
| D-plants | 28 ± 1c | 7·3 ± 0·1c | 0·81 ± 0·02e | 1·3 ± 0·1ab |
Values are mean ± s.e. (n = 5). Different letters within a column denote significant differences among means at P < 0·05 (Tukey-Kramer test).
DISCUSSION
Plant height growth and stem diameter
Xanthium canadense plants grew taller in the dense stand than in the open stand but no significant difference was observed in basal stem diameter between the two. This result is somewhat different from other studies that compared growth of annuals in crowded and uncrowded stands: e.g. Impatiens pallida, Tagetes patula and Polygonum pensylvanicum in Weiner and Thomas (1992), and Chenopodium album in Nagashima and Terashima (1995), where diameter growth was lower in crowded than uncrowded stands. In a similar experimental set-up to ours, Nishimura et al. (2010) also showed that C. album had a thinner stem in a dense stand than in an open stand. Whether diameter growth was affected by stand density or not, plants became more slender in dense stands, which would make the plants mechanically less stable. In the present study, the allometry between plant height and stem diameter was different between S- and D-plants. Several authors have suggested that competition for light induces allometric shifts in growth of individuals in crowded plant populations (Weiner and Thomas, 1992; Weiner and Fishman, 1994; Nagashima and Terashima, 1995). However, wind shielding by neighbouring plants may also have induced allometric shifts (Henry and Thomas, 2002; Anten et al., 2005, 2009).
Differences in plant height and stem diameter between S- and D-plants were analysed at the metamer level. As the rate of metamer production did not differ, the greater height growth in D-plants was due to their longer internodes, as was observed in Helianthus annuus (Kobayashi, 1975) and C. album (Nishimura et al., 2010). Lower, older internodes stopped extension and height growth was supported by extension of younger internodes and production of new internodes at the tip. Internode diameter continued to increase, although the rate of increase declined gradually with age. In species that lack the capacity for secondary growth, the continued increase in diameter after stem extension would be possible by cell expansion and wall thickening (Rich, 1987b; Niklas, 1995).
We determined the volumetric fractions of solid, water and gas to investigate their possible involvement in stem growth and contribution to mechanical stability of the stem. The solid fraction may contribute to stability by increasing E and σb, whereas water and gas may contribute by increasing I (∝ D4; eqn 3). Water and gas have been considered a cheap filler of the space not occupied by solid material (Gartner et al., 2004; Poorter, 2008). Water occupied the largest fraction (up to 90 %), which was higher than that in woody species (around 50 %; Suzuki, 1999; Poorter, 2008). Herbaceous species such as X. canadense seem to predominantly use water as a filler to increase stem volume. Water may also contribute to mechanical stability by increasing hydrostatic pressure (Niklas and Paolillo, 1997). The solid fraction occupied 9–23 % in X. canadense, lower than the value in wood, mostly 20–60 %. Negative correlations between three fractions were expected. However, if the negative correlation indicated a trade-off for increasing stem volume (Poorter, 2008), then the trade-off would be strongest between the solid and water fractions, to a lower extent between water and gas, and least between gas and solid, which was similar to adult wood but different from sapling wood where the strongest trade-off was observed between solid and gas (Poorter, 2008).
The solid fraction multiplied by 1500 kg m–3 gives dry mass density. Amongst tropical tree species, a negative correlation has been reported between (relative) growth rate and wood dry mass density (King et al., 2006; Poorter et al., 2008). Fast-growing pioneers had a stem of lower dry mass density, whereas slow-growing, more shade-tolerant species had a stem of higher density (van Gelder et al., 2006). In five herbaceous (grass) species, fast-growing species have lower tissue density than slow-growing species (Ryser, 1996). Across 80 temperate woody species, RGR of seedlings was negatively correlated with wood density (Castro-Diez et al., 1998). Is such a negative correlation found between growth rate and dry mass density at the metamer level in X. canadense? The correlation was actually stronger within a plant: Pearson's correlation coefficient between RGR and dry mass density was in the range –0·42 to –0·90 (P < 0·001), depending on age and stand. In the present experiment, the negative correlation was expected because a low dry mass density implies a greater volume per unit dry mass, i.e. a greater volume increment per unit dry mass investment. Thus, taller D-plants had a lower dry mass density (and hence a higher water fraction) than shorter S-plants.
Mechanical properties of the stem
Internode E and σb decreased toward the tip of the stem, which was associated with a reduction in dry mass density of the internode. There were strong positive correlations between internode dry mass density versus E and σb. Across woody species several authors have reported strong correlations of E and σb with wood dry mass density (van Gelder et al., 2006; Chave et al., 2009; Anten and Schieving, 2010). We found that the regression was different between plants in the open and in the dense stand: D-plants had a higher E and σb than S-plants when compared at common dry mass densities. Different qualities of the dry mass between S- and D-plants should be responsible for the different stem stiffness and strength; the amount and arrangement of fibre tissues in the stem cross-section have been suggested to influence stem stiffness and strength (Niklas, 1993b, 1995). Turgor pressure may also contribute to tissue stiffness (E). Young stems of herbaceous plants derive their stiffness to a large extent from the balance between an inflated core held in a state of compression by a stiff skin that is in tension (Niklas and Paolillo, 1997). Plants use solutes in their vacuoles to further inflate cells, and this response could be further triggered by shading.
Longer internodes of plants grown in the dense stand were composed of stiffer and stronger tissues than the shorter internodes of plants in the open stand. Such relationships between stem extension and mechanical properties have been observed in other herbaceous species. Huber et al. (2008) reported that plants of the clonal species Trifolium repens grown in the canopy shade had longer and stiffer petioles than plants of the same species grown without shade. They suggested that a greater cell number, not cell size, was involved in the increase in stiffness under the canopy shade. Impatiens capensis, with increased internode E and σb with canopy shading, did not change cell number and area but produced longer, narrower cells along internodes (Huber et al., 2014). In Potentilla reptans, longer petioles due to growth either with canopy shade or without mechanical stress had a higher tissue stiffness compared with shorter petioles grown without shade or with mechanical stress (Liu et al., 2007). By contrast, Nicotianum tabacum showed no significant difference in tissue stiffness between shorter stems of isolated plants and longer stems in a dense stand but showed a lower stiffness in mechanically stressed shorter plants (Anten et al., 2005). A small difference in growth height (their figure 1a) might have been responsible for similar stiffness between isolated and dense-stand plants. Mechanical stress produced a larger difference in stem length, where longer stems without stress had a higher tissue stiffness. In a similar experimental set-up, Anten et al. (2009) showed that genotypes of Impatiens capensis had a higher tissue stiffness in longer stems due either to canopy shade or to protection from mechanical stress. Higher tissue stiffness and strength would contribute to making the slender, otherwise weak stems of plants in the dense stand mechanically more stable.
Mechanical stability of the plant
BSF decreased with growth both in the open and in the dense stand. BSF below 1·0 implies elastic instability, i.e. stems would not be able to support the combination of their own weight and that of the crown and buckle unless they lean on their neighbours. In D-plants, BSF was 1·4 at 84 d, implying that with 80 d to go before seed maturation only a small margin of safety against mechanical failure was left. McMahon (1973) showed that record-sized trees increased height with diameter increment as predicted by the elastic similarity model (Greenhill, 1881), with BSF being around 4. The constant BSF in these trees was realized with a disproportionate increase in stem girth by producing secondary xylem (Niklas, 1993b). Niklas (1993a), extending the allometry between height and diameter to cover all clades and grades of terrestrial plants, has shown that BSF is size-dependent in herbaceous species including palms that lack the capacity for secondary growth, where BSF sometimes falls below the limiting 1·0 with increasing size. Because palms had little capacity to increase girth, their BSF decreased to such an extent that the tallest ones exceeded the critical height defined for tree species (Rich et al., 1986). In reality, however, palms increased stem tissue stiffness with height growth to minimize the reduction in BSF (Rich, 1987a). Reduction in BSF with height growth is commonly observed in herbaceous species. For example, Anten et al. (2005) showed in N. tabacum that BSF decreased with growth more strongly in plants grown in a dense stand than in those from open stands. Most herbaceous species avoid elastic instability by having determinate growth in length, i.e. they cease growth before reaching the critical height (Niklas, 1993a). Even in tropical rain forests, where light is the environmental factor that most frequently limits plant growth, canopy-tree species tended to increase their height close to the liming BSF value of 1·0 when they were pole-sized, i.e. at the stage when competition for light was presumably most intense in their lives (Sterck and Bongers, 1998; King et al., 2009).
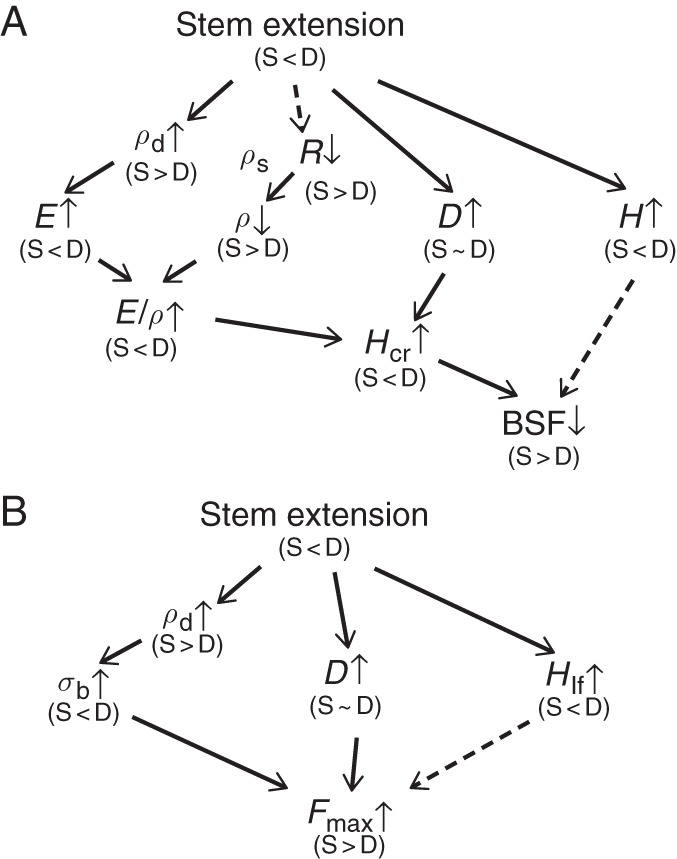
We found that tissue stiffness (E) and strength (σb) of internode increased in the direction from younger (higher) to older (lower) metamers in the plant, and showed that BSF decreased and Fmax increased in the vegetative growth period. Here, we summarize how stem extension in S- and D-plants influenced BSF and Fmax of the plant via component variables that determined BSF and Fmax (Fig. 8). Stem extension was greater in D- than in S-plants. In each stand, stem dry mass density (ρd), D and H increased, and R decreased with plant growth, while stem fresh mass density (ρs) did not change (see eqns 5–7). Tissue stiffness (E) increased with an increase in ρd. Because ρs remained constant, ρ decreased with R. As E increased and ρ decreased, the ratio between the two, E/ρ, increased greatly with stem extension. Thus, the increase in critical buckling height with growth was due to the increase in E and D and the reduction in R. The increase in E and the reduction in R contributed more to increasing Hcr than the increase in D even when taking into account that E contributes to Hcr to the power 1/3, R through 1/(1 + R) to the power 1/3, and D to the power 2/3. Greater Hcr in D- than in S-plants was the result of the higher E and the lower R in D-plants. In herbaceous species such as X. canadense that have a limited capacity to increase stem diameter, the increment in tissue stiffness (E) plays a crucial role in increasing Hcr, as was found in palms (see above). This is different from tree species that have a high capacity to increase stem girth by producing secondary xylem every year, with little change in stem stiffness (E), where an increase in diameter contributed more to increasing Hcr (Rich et al., 1986; Niklas, 1994; van Gelder et al., 2006). [However, Hietz et al. (2013) showed that pioneers in tropical forests tended to increase wood density and thus E in growth from a juvenile to canopy tree.] Herbaceous species take the E-strategy (sensu Niklas, 1994) to maintain mechanical stability or not to fall below the limiting BSF, in contrast to trees that take the I-strategy (I implies the second moment of area that scales with D4; plants increasing stem girth to maintain mechanical stability).
Fig. 8.
Effects of stem extension on (A) the buckling safety factor (BSF) and (B) the lateral wind force resistance (Fmax) with their determinant variables. Xanthium canadense plants grown in an open stand (S-plants) or in a dense stand (D-plants). BSF = Hcr/H; Hcr
 (E/ρ)1/3D2/3; ρ = (1 + R)ρs; Fmax
 σbD3/Hlf. ρ, plant fresh mass to stem volume ratio; ρd, stem dry mass density; ρs, stem fresh mass density; σb, breaking stress (modulus of rupture); D, stem basal diameter; E, Young's modulus of elasticity; H, actual plant height; Hcr, critical buckling height; Hlf, average leaf height; R, crown to stem fresh mass ratio. Thick arrows between variables, positive effects; dashed arrows, negative effects. Small upward arrow, the value increased with height growth; small downward arrow, the value decreased with height growth. (S < D), the value is smaller in S- than D-plants; (S > D), the value is greater in S- than D-plants; (S∼D), no difference in the value between S- and D-plants.
Lateral wind force resistance (Fmax) increased with growth, and was higher in S- than in D-plants (Fig. 8B). The increase in σb and D contributed to increasing Fmax, whereas the increase in Hlf lowered Fmax (see eqn 8). Here, the contribution of D was great even though the increase in D was small, because Fmax scales with the third power of D. Three component variables contributed with a nearly equal importance to the determination of Fmax, although σb and D contributed positively and Hlf negatively. Higher Fmax in S- than in D-plants, by contrast, was due mostly to the lower Hlf in S-plants, which more than offset the effect of lower σb.
In a tropical rain forest, van Gelder et al. (2006) showed that across tree species BSF was positively related to wood density and stiffness, but that tree architecture (plant height to stem diameter ratio) was a stronger determinant of mechanical stability. Our results are generally consistent with theirs, except that the increase in tissue stiffness was more important as a determinant of BSF in our herbaceous species. Crown to stem mass ratio (R), another architectural trait, also strongly influenced BSF. However, our results originate from a completely different experimental set-up: from an intraspecific comparison between plant growth in an open and in a dense stand, with measurements at the metamer level, emphasizing phenotypic response to different light climates, whereas their results were from interspecific comparisons of trees growing in a tropical rain forest, emphasizing different growth strategies among species in a community. We believe our approach to trade-offs between stem extension and mechanical stability from measurements at the metamer level is new, but promising, although many assumptions are involved at present. Those assumptions should be tested experimentally in future to elucidate the factors involved in the trade-off.
ACKNOWLEDGEMENTS
This work was supported by Grants-in-Aid from the Japan Society for the Promotion of Science to T.H. (grant numbers KAKENHI-17370008, 20370015, 25440230). We thank Niels Anten and an anonymous referee for critical but constructive comments. Our thanks are due also to the staff members and students of the Laboratory for Agricultural Environmental Studies, Tokyo University of Agriculture, for technical support.
LITERATURE CITED
- Anten NPR, Schieving F. The role of wood mass density and mechanical constraints in the economy of tree architecture. American Naturalist. 2010;175:250–260. doi: 10.1086/649581. [DOI] [PubMed] [Google Scholar]
- Anten NPR, Casado-Garcia R, Nagashima H. Effects of mechanical stress and plant density on mechanical characteristics, growth and lifetime reproduction of tobacco plants. American Naturalist. 2005;166:650–660. doi: 10.1086/497442. [DOI] [PubMed] [Google Scholar]
- Anten NPR, Pawlowski M, von Wettberg E, Huber H. Interactive effects of spectral shading and mechanical stress on the expression and costs of shade avoidance. American Naturalist. 2009;173:241–255. doi: 10.1086/595761. [DOI] [PubMed] [Google Scholar]
- Barlow PW. Meristems, metamers and modulus and the development of shoot and root systems. Biological Journal of the Linnean Society. 1989;100:255–279. [Google Scholar]
- Barthélémy D, Caraglio Y. Plant architecture: a dynamic, multilevel, and comprehensive approach to plant form, structure and ontogeny. Annals of Botany. 2007;99:375–407. doi: 10.1093/aob/mcl260. [DOI] [PMC free article] [PubMed] [Google Scholar]
- Bazzaz FA, Harper JL. Demographic analysis of the growth of Linum usitatissimum. New Phytologist. 1977;78:193–208. [Google Scholar]
- Castro-Diez P, Puyravaud JP, Cornelissen JHC, Villar-Salvador P. Stem anatomy and relative growth rate in seedlings of a wide range of woody plant species and types. Oecologia. 1998;116:57–66. doi: 10.1007/s004420050563. [DOI] [PubMed] [Google Scholar]
- Chave J, Coomes D, Jansen S, Lewis SL, Swenson NG, Zanne AE. Towards a worldwide wood economics spectrum. Ecology Letters. 2009;12:351–366. doi: 10.1111/j.1461-0248.2009.01285.x. [DOI] [PubMed] [Google Scholar]
- Dinwoodie JM. Timber: its nature and behavior, 2nd edn. London: E & FN Spon; 2000. [Google Scholar]
- Ennos AR. Wind as an ecological factor. Trends in Ecology and Evolution. 1997;12:108–111. doi: 10.1016/s0169-5347(96)10066-5. [DOI] [PubMed] [Google Scholar]
- Gartner BL, Moore JR, Gardiner BA. Gas in stems: abundance and potential consequences for tree biomechanics. Tree Physiology. 2004;24:1239–1250. doi: 10.1093/treephys/24.11.1239. [DOI] [PubMed] [Google Scholar]
- Geber MA. The cost of meristem limitation in Polygonum arenastrum: negative genetic correlations between fecundity and growth. Evolution. 1990;44:799–819. doi: 10.1111/j.1558-5646.1990.tb03806.x. [DOI] [PubMed] [Google Scholar]
- van Gelder HA, Poorter L, Sterck FJ. Wood mechanics, allometry, and life-history variation in a tropical rain forest tree community. New Phytologist. 2006;171:367–378. doi: 10.1111/j.1469-8137.2006.01757.x. [DOI] [PubMed] [Google Scholar]
- Gere JM, Timoshenko SP. Mechanics of materials. Cheltenham: Stanley Thornton; 1999. [Google Scholar]
- Givnish TJ. On the adaptive significance of leaf height in forest herbs. American Naturalist. 1982;120:353–381. [Google Scholar]
- Givnish TJ. Plant stems: biomechanical adaptation for energy capture and influence on species distributions. In: Gartner BL, editor. Plant stems. San Diego: Academic Press; 1995. pp. 3–49. [Google Scholar]
- Grace J. Plant response to wind. London: Academic Press; 1977. [Google Scholar]
- Greenhill G. Determination of greatest height consistent with stability that a vertical pole or mast can be made, and the greatest height to which a tree of given proportions can grow. Proceedings of the Cambridge Philosophical Society. 1881;4:65–73. [Google Scholar]
- Henry HAL, Thomas SC. Interactive effects of lateral shade and wind on stem allometry, biomass allocation, and mechanical stability in Abutilon theophrastii (Malvaceae) American Journal of Botany. 2002;89:1609–1615. doi: 10.3732/ajb.89.10.1609. [DOI] [PubMed] [Google Scholar]
- Hietz P, Valencia R, Wright SJ. Strong radial variation in wood density follows a uniform pattern in two neotropical rain forests. Functional Ecology. 2013;27:684–692. [Google Scholar]
- Holbrook NM, Putz FE. Influence of neighbors on tree form: effects of lateral shade and prevention of sway on the allometry of Lyquidambar styraciflua. American Journal of Botany. 1989;76:1740–1749. [Google Scholar]
- Huber H, de Brouwer J, de Caluwe H, Wijshedé J, Anten NPR. Shade induced changes in biomechanical petiole properties in the stoloniferous herb Trifolium repens. Evolutionary Ecology. 2008;22:399–416. [Google Scholar]
- Huber H, de Brouwer J, von Wettberg EJ, During HJ, Anten NPR. More cells, bigger cells or simply reorganization? Alternative mechanisms leading to changed internode architecture under contrasting stress regimes. New Phytologist. 2014;201:193–204. doi: 10.1111/nph.12474. [DOI] [PubMed] [Google Scholar]
- Jones HG. Plants and microclimate, 2nd edn. Cambridge: Cambridge University Press; 1992. [Google Scholar]
- Kendrick RE, Kronenberg GHM. Photomorphogenesis in plants. Dordrecht: Kluwer Academic Publishers; 1993. [Google Scholar]
- King DA, Davies SJ, Tan S, Noor NSM. The role of wood density and stem support costs in the growth and mortality of tropical trees. Journal of Ecology. 2006;94:670–680. [Google Scholar]
- King DA, Davies SJ, Tan S, Noor NSM. Trees approach gravitational limits to height in tall lowland forests of Malaysia. Functional Ecology. 2009;23:284–291. [Google Scholar]
- Kobayashi S. Growth analysis of plant as an assemblage of internodal segments. Japanese Journal of Ecology. 1975;25:61–70. [Google Scholar]
- Lambers H, Chapin FS, III, Pons TL. Plant physiological ecology, 2nd edn. New York: Springer; 1998. [Google Scholar]
- Liu Y, Schieving F, Stuefer JF, Anten NPR. The effects of mechanical stress and spectral shading on the growth and allocation of ten genotypes of a stoloniferous plant. Annals of Botany. 2007;99:121–130. doi: 10.1093/aob/mcl230. [DOI] [PMC free article] [PubMed] [Google Scholar]
- McMahon TA. Size and shape in biology. Science. 1973;179:1201–1204. doi: 10.1126/science.179.4079.1201. [DOI] [PubMed] [Google Scholar]
- McMahon TA, Kronauer RE. Tree structure: deducing the principle of mechanical design. Journal of Theoretical Biology. 1976;59:443–466. doi: 10.1016/0022-5193(76)90182-x. [DOI] [PubMed] [Google Scholar]
- McSteen P, Leyser O. Shoot branching. Annual Review of Plant Biology. 2005;56:353–374. doi: 10.1146/annurev.arplant.56.032604.144122. [DOI] [PubMed] [Google Scholar]
- Nagashima H, Hikosaka K. Not only light quality but also mechanical stimuli are involved in height convergence in crowded Chenopodium album stands. New Phytologist. 2012;195:803–811. doi: 10.1111/j.1469-8137.2012.04218.x. [DOI] [PubMed] [Google Scholar]
- Nagashima H, Terashima I. Relationships between height, diameter and weight distributions of Chenopodium album plants in stands: effects of dimension and allometry. Annals of Botany. 1995;75:181–188. [Google Scholar]
- Niklas KJ. Plant biomechanics: an engineering approach to plant form and function. Chicago: The University of Chicago Press; 1992. [Google Scholar]
- Niklas KJ. The scaling of plant height: a comparison among major plant clades and anatomical grades. Annals of Botany. 1993a;72:165–172. [Google Scholar]
- Niklas KJ. Influence of tissue density-specific mechanical properties on the scaling of plant height. Annals of Botany. 1993b;72:173–179. [Google Scholar]
- Niklas KJ. The allometry of safety-factors for plant height. American Journal of Botany. 1994;81:345–351. [Google Scholar]
- Niklas KJ. Plant height and the properties of some herbaceous stems. Annals of Botany. 1995;75:133–142. [Google Scholar]
- Niklas KJ, Paolillo DJ., Jr The role of the epidermis as a stiffening agent in Tulipa (Lilliaceae) stems. American Journal of Botany. 1997;84:735–744. [PubMed] [Google Scholar]
- Nishimura E, Suzaki E, Irie M, Nagashima H, Hirose T. Architecture and growth of an annual plant Chenopodium album in different light climates. Ecological Research. 2010;25:383–393. [Google Scholar]
- Poorter L. The relationships of wood-, gas- and water fractions of tree stems to performance and life history variation in tropical trees. Annals of Botany. 2008;102:367–375. doi: 10.1093/aob/mcn103. [DOI] [PMC free article] [PubMed] [Google Scholar]
- Poorter L, Wright SJ, Ackerly DD, et al. Are functional traits good predictors of demographic rates? Evidence from five neotropical forests. Ecology. 2008;89:1908–1920. doi: 10.1890/07-0207.1. [DOI] [PubMed] [Google Scholar]
- Rich PM. Mechanical structure of the stem of arborescent palms. Botanical Gazette. 1987a;148:42–50. [Google Scholar]
- Rich PM. Developmental anatomy of the stem of Welfia georgii, Iriartea gigantean, and other arborescent palms: implications for mechanical support. American Journal of Botany. 1987b;74:792–802. [Google Scholar]
- Rich PM, Helenurm K, Kearns D, Morse SR, Palmer MW, Short L. Height and stem diameter relationships for dicotyledonous trees and arborescent palms of Costa Rican tropical wet forest. Bulletin of the Torrey Botanical Club. 1986;113:241–246. [Google Scholar]
- Ryser P. The importance of tissue density for growth and life span of leaves and roots: a comparison of five ecologically contrasting grasses. Functional Ecology. 1996;10:717–723. [Google Scholar]
- Shitaka Y, Hirose T. Timing of seed germination and the reproductive effort in Xanthium canadense. Oecologia. 1993;95:334–339. doi: 10.1007/BF00320985. [DOI] [PubMed] [Google Scholar]
- Sterck FJ, Bongers F. Ontogenetic changes in size, allometry, and mechanical design of tropical rain forest trees. American Journal of Botany. 1998;85:266–272. [PubMed] [Google Scholar]
- Suzuki E. Diversity in specific gravity and water content of wood among Bornean lowland rainforest trees. Ecological Research. 1999;14:211–224. [Google Scholar]
- Warton DI, Wright IJ, Falster DS, Westoby N. Bivariate line-fitting methods for allometry. Biological Reviews. 2006;81:259–291. doi: 10.1017/S1464793106007007. [DOI] [PubMed] [Google Scholar]
- Watari R, Nagashima H, Hirose T. Growth and nitrogen use in Xanthium canadense grown in an open or in a dense stand. Physiologia Plantarum. 2012;144:335–345. doi: 10.1111/j.1399-3054.2011.01563.x. [DOI] [PubMed] [Google Scholar]
- Weiner J, Fishman L. Competition and allometry in Kochia scoparia. Annals of Botany. 1994;73:263–271. [Google Scholar]
- Weiner J, Thomas SC. Competition and allometry in three species of annual plants. Ecology. 1992;73:648–656. [Google Scholar]
- Weiner J, Berntson GM, Thomas SC. Competition and growth form in a woodland annual. Journal of Ecology. 1990;78:459–469. [Google Scholar]
- White J. The plant as a metapopulation. Annual Review of Ecology and Systematics. 1979;10:109–145. [Google Scholar]
- White J. Plant metamerism. In: Dirzo R, Sarukhán J, editors. Perspectives on plant population ecology. Sunderland, MA: Sinauer Associates; 1984. pp. 15–47. [Google Scholar]