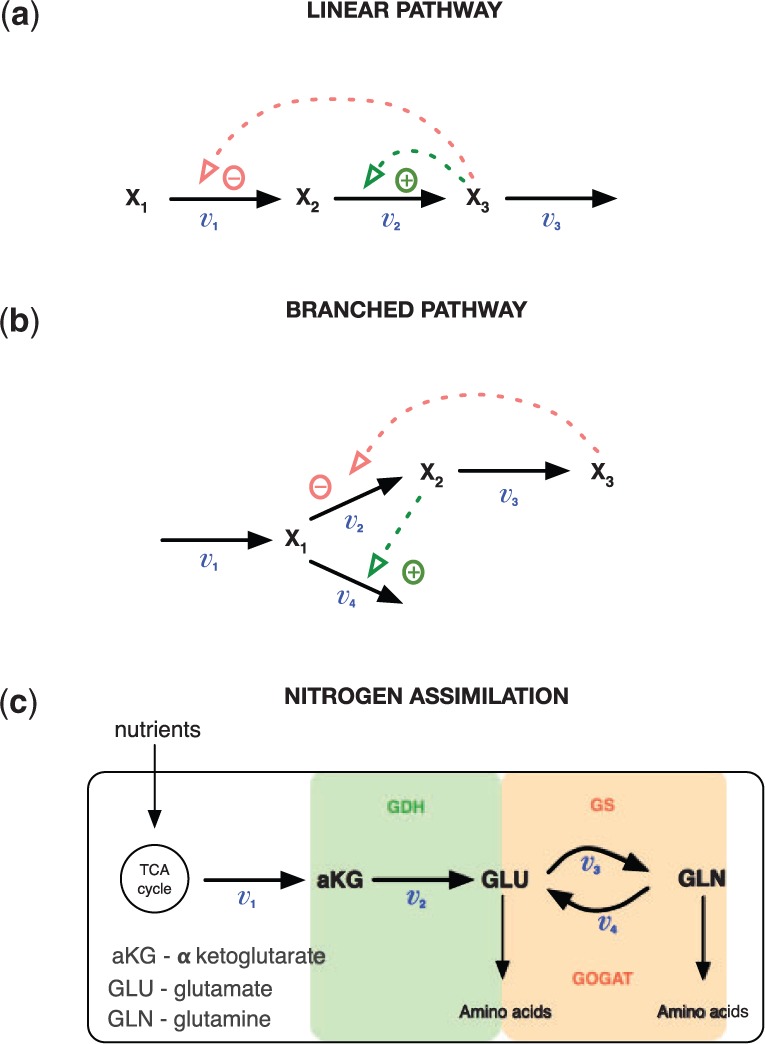
Fig. 3.

Pathway information. (a) A simple linear metabolic pathway; red and green dashed lines correspond to the inhibition and activation signals. (b) Illustrates a branched pathway with positive (green) and negative (red) regulatory signals. (c) Illustrates a metabolic pathway in E.coli, here vi,  denote the fluxes;
  , GLU and GLN correspond to the metabolites; TCA is a short notation for the citrate cycle in E.coli
