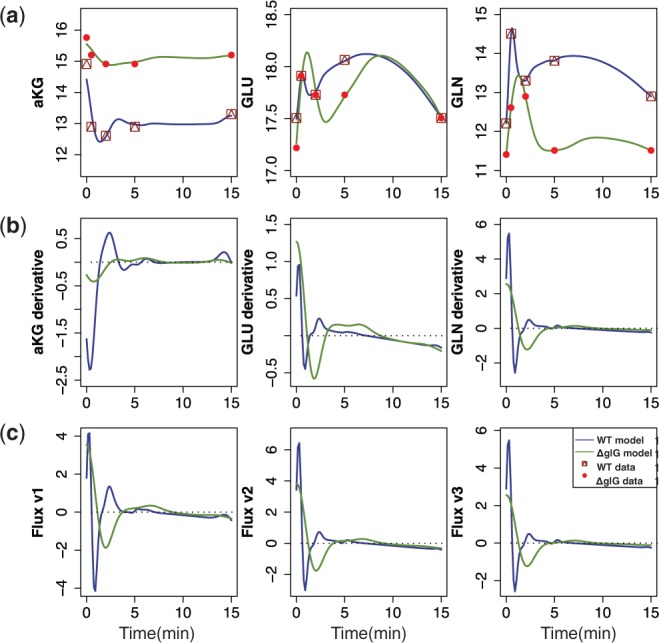
Fig. 5.

Predictions with MGPs model for E. coli (WT and ΔglnG). (a) The symbols indicate experimentally measured concentrations of  , GLU and GLN metabolites (dots for WT, squares for ΔglnG). Solid lines correspond to the mean behaviour of dependent GPs model. (b) Predicted derivative behaviour for
  , GLU and GLN metabolites, where solid lines correspond to the mean behaviour of dependent derivative processes. (c) Predicted fluxes v1, v2 and v3 for convenience, dotted line illustrates horizontal 0-axis
