

Abstract
Motivation: p38 mitogen-activated protein kinase activation plays an important role in resistance to chemotherapeutic cytotoxic drugs in treating multiple myeloma (MM). However, how the p38 mitogen-activated protein kinase signaling pathway is involved in drug resistance, in particular the roles that the various p38 isoforms play, remains largely unknown.
Method: To explore the underlying mechanisms, we developed a novel systems biology approach by integrating liquid chromatography–mass spectrometry and reverse phase protein array data from human MM cell lines with computational pathway models in which the unknown parameters were inferred using a proposed novel algorithm called modularized factor graph.
Results: New mechanisms predicted by our models suggest that combined activation of various p38 isoforms may result in drug resistance in MM via regulating the related pathways including extracellular signal-regulated kinase (ERK) pathway and NFкB pathway. ERK pathway regulating cell growth is synergistically regulated by p38δ isoform, whereas nuclear factor kappa B (NFкB) pathway regulating cell apoptosis is synergistically regulated by p38α isoform. This finding that p38δ isoform promotes the phosphorylation of ERK1/2 in MM cells treated with bortezomib was validated by western blotting. Based on the predicted mechanisms, we further screened drug combinations in silico and found that a promising drug combination targeting ERK1/2 and NFκB might reduce the effects of drug resistance in MM cells. This study provides a framework of a systems biology approach to studying drug resistance and drug combination selection.
Availability and implementation: RPPA experimental Data and Matlab source codes of modularized factor graph for parameter estimation are freely available online at http://ctsb.is.wfubmc.edu/publications/modularized-factor-graph.php
Contact: xizhou@wakehealth.edu or zhanglcq@swu.edu.cn
Supplementary information: Supplementary data are available at Bioinformatics online.
1 INTRODUCTION
Multiple myeloma (MM), as the second most common hematologic malignancy with ∼15 ,000 new cases per year in the USA, remains incurable with a median survival of 4–7 years (Younes et al., 2007). The relapse of this disease and resistance to treatment cannot be avoided, while recent advances in novel therapeutics keep producing promising clinical responses (Hideshima et al., 2007).
The p38 mitogen-activated protein kinase (p38 MAPK) signaling pathway is known to play a key role in many cellular responses, including apoptosis, cell cycle regulation, induction of expression of cytokine genes and cellular differentiation (Marderosian et al., 2006). More recently, p38 MAPK has been shown to have a central role in resistance to chemotherapeutic agents (Guo et al., 2008; Hideshima et al., 2003). To date, four isoforms of the p38 MAPK family have been identified: p38 , p38
, p38 , p38
, p38 and p38
 . Activation of various p38 isoforms may determine cell fate after drug treatment. Previous research has shown that the activation of particular p38 isoforms can be specifically controlled through different upstream regulators and co-activated by various combinations of such regulators (Enslen et al., 1998). Enhanced cell death resulting from p38 MAPK inhibition when cells are treated with arsenic trioxide (ATO) and/or bortezomib (BZM) is thought to be due to the suppression of c-Jun N-terminal kinase (JNK) activation by p38 MAPK (Wen et al., 2010). In MM cells, increased killing by dexamethasone and BZM as a result of p38 MAPK inhibition was associated with reduced phosphorylation and activation of the anti-apoptotic protein heat shock protein 27 (Hideshima et al., 2004). In addition, the p38 MAPK inhibitor SB203580 has been shown to suppress the function of P-glycoprotein in drug-resistant cell lines leading to the increased efficacy of cytotoxic drugs (Barancik et al., 2001). Together, these studies suggest that p38 MAPK activation may mediate drug resistance via multiple mechanisms. However, how the p38 MAPK signaling pathway is involved in drug resistance, in particular the roles that the various p38 isoforms play, remains largely unknown.
To discover the mechanism that p38 MAPK activation may induce drug resistance, we undertook a combined proteomic analysis and mathematical modeling approach to analyzing the signaling pathways in which p38 MAPK is involved. First, a quantitative comparison of the global protein expression level profile differences existing between the individual p38 MAPK MM cell lines was accomplished by a proteomic analysis approach called liquid chromatography–mass spectrometry (LC-MS) (Silva et al., 2006). This resulted in a detailed quantitative analysis of the parental cell line and a quantitative comparison of this parental protein expression profile against each of the individual p38 isoform knockdown MM cell lines for all the proteins isolated from the MM cell lysates. Second, we performed reverse phase protein array (RPPA) (Peng et al., 2012) analysis on the MM cell lines with phospho-specific antibodies to a selected set of signaling proteins that could be present in the various p38 MAPK signaling pathways. Combining the results from these direct experimental proteomic analyses with subsequent pathway analysis, our methodology led to the generation of a set of presumptive protein networks that are probably altered by differential expressions of various p38 isoforms.
Although both LC-MS and RPPA proteomic technologies have their respective strengths and weaknesses, the combined use of both allows us to get a more accurate picture of how molecular pathways are affected by the individual p38 isoform knockdown in MM cell lines. However, even though both of these proteomic technologies have recently been used effectively in many cancer studies, it is still extremely challenging to extrapolate temporal experimental proteomic data to the dynamic conditions inherent to cancer cell physiology and response to chemotherapy. Given the complexity of such cell signaling networks and their diverse responses to their extracellular environment (Manning and Cantley, 2007), modeling such response has proven to be difficult. Therefore, we developed a novel modeling approach to attack this problem.
It is common to use ordinary differential equations (ODEs) to model the dynamics of signaling networks and generate a testable hypothesis. Obtaining parameters in ODE models is rather challenging. One way is to search these parameters from the literature (Peng et al., 2011). The other way is to minimize the error between quantitative values from model and observations from biological experiments (Peng et al., 2012). The parameters often vary in different experimental conditions, so it is not good to directly use the values of those parameters reported in the literature. Therefore, it is important to estimate the parameters in each study. In our study, we developed a novel algorithm called modularized factor graph (MFG) for the parameter estimation.
Furthermore, we also investigated the optimization of drug combinations for improving targetable therapies. Currently, although combinatorial drug intervention has already become a common therapeutic strategy for complex diseases such as cancer (Calzolari et al., 2008), it is time-consuming to screen the promising combinatorial candidates from a great number of drugs and select the available combinations experimentally. Hence, many algorithms were developed to direct the experiments, such as drug feature-related combination prediction (Zhao et al., 2011), synergistic combination screening (Lehar et al., 2009), genetic algorithm (GA) (Zinner et al., 2009) and floating forward selection (Calzolari et al., 2008). However, all of these methods did not consider the drug effects on comprehensive signaling pathways. Thus, we proposed to use the signaling pathways to search the potential combinations for combinatorial drug intervention after establishing the ODE system from experimental data. In general, this study integrates the mass action modeling of the signaling pathway, screens all drug combinations in this model and determines the promising drug combination to reduce the effects of drug resistance.
2 MATERIALS AND METHODS
2.1 Summary of the computational approach
Figure 1A shows the workflow of the systematic procedure to discover the mechanism of drug resistance for MM cells and to explore the effects of drug combination selections. The detail is illustrated as follows.
Fig. 1.

Depiction of the systematic procedure to study drug resistance in MM. (A) The developed systems biology approach consisting of four steps. (B) The generic signaling pathway obtained from LC-MS. Arrows represent stimulation and hammerheads represent inhibition. (C) The refined signaling pathway obtained from the generic signaling pathway and used to build the ODE model. The boxes highlighted in gray show the concentrations of phosphorylated/active proteins were measured
In Step 1, to study which pathways are significantly altered in MM cells after knockdown of p38 isoforms, we first identified the proteins significantly altered in their expression pattern among five conditions (knockdown of four individual p38 isoforms relative to the non-knockdown/control condition) in 2D LC-MS experimental data. Then we selected the enriched signaling pathways from the canonical pathway database of Ingenuity Pathway Analysis (IPA) based on the differentially and significantly expressed proteins. The generic signaling pathway (Fig. 1B) was obtained by merging the enriched signaling pathways together. In Step 2, we first refined the generic signaling pathway with specific rules. Then we modeled the refined signaling pathways (Fig. 1C) using ODEs and developed a novel algorithm called MFG to estimate the parameters in the ODE system by fitting RPPA data to our model. In this algorithm, we first decomposed the signaling pathway into smaller components and estimated the parameters in each component as initial values (or initial ranges of the parameters) of the system. The model was then trained systematically using the algorithm of belief propagation (BP) on factor graph (Kschischang et al., 2001; Nam et al., 2011), and a set of smaller parameter ranges was obtained. Then the parameters were refined through the smaller parameter ranges using the algorithm of particle swarm optimization (PSO) (Iadevaia et al., 2010; Kennedy and Eberhart, 1995). In Step 3, we analyzed the parameters obtained from the previous step and discovered some new mechanisms and explored the novel drug combinations that reduce the drug resistance. Finally, we validated our model’s predictions of altered MM signaling interactions and responses to various drug combinations via western blotting.
2.2 Experimental procedures
2.2.1 Cell cultures and reagents
Human MM cell line Roswell Park Memorial Institute (RPMI) 8226 was purchased from the American Type Culture Collection (Rockville, MD, USA) and cultured as previously described (Wen et al., 2011). IκB kinase (IKK) inhibitor Bay 11-7082 (BIOMOL Research Labs, Plymouth Meeting, PA, USA) and Mitogen-activated protein kinase (MEK) inhibitor PD 184352 (Enzo Life Sciences, Exeter, UK) were prepared according to manufacturer’s manuals. ATO (Sigma-Aldrich, St. Louis, MO, USA) and BZM (Millennium Pharmaceuticals, Cambridge, MA, USA) were prepared as previously described (Wen et al., 2010).
2.2.2 p38 isoforms knockdown
Short hairpin RNA recombinant vectors to knock down p38 , p38
, p38 , p38
, p38 and p38
 were constructed using BLOCK-iTTM Pol II miR RNAi Expression Vector Kits and BLOCK-iTTM Lentiviral Pol II miR RNAi Expression System according to manufacturer’s manual (Invitrogen, Carlsbad, CA, USA). After transduction with high-titer lentivirus in RPMI 8226 cells and following blasticidin selection, the knockdown efficiency was monitored by western blotting. For each isoform, 4–8 vectors were constructed, and, finally, the one with the highest knockdown efficiency was chosen for further experiments.
2.2.3 Liquid chromatography–mass spectrometry
RPMI 8226 cells with individual p38 isoform (p38 , p38
, p38 , p38
, p38 and p38
 ) knockdown cells and control (RPMI 8226 cells stably transfected with empty vector) cells were obtained as described above, and then LC-MS experiments were performed for all these cell lines by using well-established LC-MS methodology (Silva et al., 2006; Zinner et al., 2009) following enhanced up-front separation of tryptic peptides derived from the cell line proteomes by 2D RP/RP-nano LC (Gilar et al., 2005).
2.2.4 Reverse phase protein array
RPMI 8226 cells with individual p38 isoform knockdown cells and control cells were cultured in 96-well plate and treated with ATO (1 μm) or BZM (10 nm) or their combination. Samples with 0, 5, 10, 30, 60 or 90 min of treatment were collected for RPPA performed at the RPPA Core Facility of MD Anderson Cancer Center (Houston, TX, USA) as previously described (Peng et al., 2012).
2.2.5 Cell growth assay
RPMI 8226 cells with individual p38 isoform knockdown cells and control cells were cultured in 96-well plate and treated with ATO (1 μm) or BZM (10 nm) or vehicle (no-drug). The cell growth after 24, 48 or 72 h of treatment was then assessed by using the 3-[4,5-dimethylthiazol-2-yl]-2,5 diphenyl tetrazolium bromide (MTT) assay (Chemicon International, Temecula, CA, USA) as previously described (Wen et al., 2008). All samples were assayed in triplicate.
2.2.6 Cell apoptosis assay
RPMI 8226 cells were cultured and treated with MEK1/2 inhibitor PD 184352 (1 μm) or IKK inhibitor Bay 11-7082 (2.5 μm) or BZM (10 nm) or their combinations. The cell apoptosis after 24 h of treatment was then assessed by using the Annexin V assay (BD Pharmingen) as previously described (Wen et al., 2008). All samples were assayed in triplicate.
2.2.7 Western blotting
RPMI 8226 cells with p38 knockdown cells and control cells were cultured and treated with BZM (10 nm). Whole cell lysates were prepared, and lysate proteins were size fractionated by SDS-PAGE (Invitrogen, Carlsbad, CA, USA) and then electroblotted onto polyvinylidene difluoride membranes. The blots were probed with the following antibodies: anti-phospho-extracellular signal-regulated kinase (ERK1/2) and anti-ERK1/2 (Cell Signaling Technology, Danvers, MA, USA).
3 RESULTS
3.1 LC-MS dataset analysis
A quantitative LC-MS approach to characterize the MM proteome was initially undertaken to profile the global proteome differences observed in MM cell lines following knockdown of each of the individual p38 isoforms relative to the parental MM phenotype.
Using the microRNA methodology as described in Section 2, we first established four different RPMI 8226 MM cell sublines with stably silenced expression of p38 , p38
, p38 , p38
, p38 and p38
 , respectively, as well as an RPMI 8226 MM cell subline stably transfected with empty vector as the negative control. Then we performed the LC-MS experiments for all cell lines, as described in Section 2. The LC-MS data were then processed, normalized and compared across the various cell lines using IdentityE and ExpressionE proteome analysis algorithms in Protein Lynx Global Server v2.4 software (Waters, Milford, MA, USA). For the purpose of protein identification, data-independent analysis (MSE) was performed against the Uniprot human database (release 2010_08; comprising 20 280 protein entries) with a minimum criterion of three high scoring (confidence interval >95%) peptide matches per unique protein identification, and a database search false discovery rate of <1% using both a reversed and randomized Uniprot human database as the decoy target database. Using this approach, we were able to unambiguously identify and quantify 1744 unique proteins (from 36 254 unique peptides) across the MM cell lines, from which 310 were identified as statistically significant alterations (with P-value < 0.05) in their expression level patterns relative to the parental control cell line across all of the individual p38 isoform knockdown conditions. To simplify the discussion, we denoted
  ,
,  ,
,  and
and  knockdown conditions as knockdown conditions 1, 2, 3 and 4, respectively. Then for each detected protein, we calculated a relative ratio defined by
  , where
  and
and  represent the relative abundance of protein
  from knockdown condition
  and control condition, respectively. Such an analysis resulted in
  or
or  that were finally used to get the upregulated or downregulated proteins, respectively. The results from the LC-MS dataset analysis are provided in Supplementary Material S1.
3.2 Constructing the generic signaling pathway
In Mitsos’s paper (Mitsos et al., 2009), the generic signaling pathway was built in the neighborhood of 5 stimuli and 13 measurements and then created from canonical pathways found in IPA with subsequently manual curation. In addition, Iadevaia’s paper (Iadevaia et al., 2010) obtained the generic signaling pathway involving ∼23 proteins related to pathways stimulated by the ligand insulin-like growth factor 1 (IGF-1) in the MDA-MB231 breast cancer cell line without giving the detailed criteria. However, in our article, we present a new strategy to get the generic signaling pathway.
We first picked out four significantly changed protein sets (shown in Supplementary Material S1) corresponding to the four conditions that were then fed into IPA to find out the important pathways related to each condition. The selected pathways were ranked by P-value [the P-value associated with a biological process is a measure of its statistical significance with respect to the pathways eligible molecules for the dataset, which are the overlapped proteins between our selected proteins and proteins in the pathway candidate and a reference set of molecules (molecules in the pathway candidates). The P-value was calculated with the right-tailed Fisher’s exact test]. Then we obtained 54 pathways with P-values of <0.05 and selected 20 pathways as the most important pathways according to the literature about MM (Mitsiades et al., 2002; Podar et al., 2001). The total 54 pathways and the selected 20 pathways are provided in Supplementary Material S2.
These selected 20 pathways include the phosphatidylinositol-3-kinase/AKT/mammalian target of rapamycin (PI3K/AKT/mTOR) pathway, MAPK/ERK pathway and vascular endothelial growth factor (VEGF) pathway. The descriptions of the pathways are provided in Supplementary Material S3. Because these 20 pathways share a lot of proteins with others, we finally merged these pathways together through shared proteins and obtained the generic signaling pathway (Fig. 1B).
3.3 Refining the generic signaling pathway
Limited to the inadequate experimental data, it is almost impossible to optimize the parameters of the generic signaling pathway described by ODEs. Hence, we refined the generic signaling pathway by the following rules. First, the refined signaling pathway keeps those pathways closely related with p38 MAPK protein, including the PI3K/AKT pathway, nuclear factor kappa B (NFкB) pathway and ERK pathway. The p38 is the most important protein in this study because our focus herein is to explore the underlying mechanisms of drug resistance in MM closely related with p38 (especially the p38 isoforms). Second, we compressed the cascades in which a series of proteins impinge on one protein to that central protein. This rule will help keep the structure of the signaling pathway and largely simplify the complexity of the signaling pathway, and this rule was originally proposed in the literature (Saez-Rodriguez et al., 2009). Third, we retained the pathways containing P70S6 kinase (P70S6K) and poly (ADP-ribose) polymerase (PARP), as these two genes regulate the cell growth and cell apoptosis, which are two important phenotypes for studying the effects of drugs in our specific study.
3.4 RPPA data
The purpose of this article is to study drug resistance using RPPA data. Because we have only 153 proteins in RPPA chips and some important proteins may be missed in RPPA chips because of no antibodies of those proteins in the current market, we first used LC-MS to determine the generic signaling pathway related to MM, and then RPPA was used to explore new mechanisms in the MM cell line based on the aforementioned refined generic signaling pathway and to determine the promising drug combination at the end.
Using microRNAs methodology, as described in Section 2, we first established four different RPMI 8226 MM cell sublines with stably silenced expression of p38α, p38β, p38γ and p38δ, respectively, as well as an RPMI 8226 MM cell subline stably transfected with empty vector as the negative control. Then we treated all cell lines with ATO (1 μm) or BZM (10 nm) or their combination with the time course: 0, 5, 10, 30, 60 and 90 min and performed the RPPA experiments for total 80 samples (only five samples needed for the initial time point), as described in Section 2. Finally, we got dynamic concentration data of total 153 proteins in RPPA chips including phosphorylation levels of 16 proteins in our pathway, as shown in Figure 1C. Supplementary Material S4 provides the heat map and clustering result for the whole dataset, as well as an example of the information flow of the dataset used in our pathway modeling study.
3.5 Modeling the pathway
According to the description of the pathway shown in Figure 1C, we can build the whole ODEs system using the law of mass action. Generally, there are total 40 ODEs and 53 parameters in the model. In addition, we have RPPA data on 16 proteins with five time points for each to be used to train our model for each condition of total 15 conditions. Using the law of mass action equations to describe signaling pathway has been widely used in the previous research (Chen et al., 2009; Iadevaia et al., 2010). Here we take the reaction of phosphorylated AKT (pAKT) as an example to explain how to build the ODEs by modeling the dynamic of concentration of pAKT. Figure 1C shows that three proteins, i.e. an active guanosine triphosphate-bound form of Ras (Ras GTP), phosphorylated PI3K (pPI3K) and phoshorylated PDK1 (pPDK1), can activate AKT, which means that there are three producing terms in the model. Here is the ODE to describe this reaction:
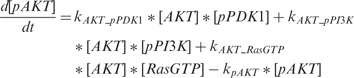 |
where [Name] denotes the concentration of protein ‘Name’;  ,
,  and
and  denote the phosphorylation rates of AKT activated by pPDK1, pPI3K and Ras-GTP, respectively;
  denotes the dephosphorylation rate of pAKT. The first three terms in positive form on the right side of the equation describe three producing terms, and the last term in negative form describes consuming term. The detailed equations of the whole signaling pathway are provided in Supplementary Material S5.
3.6 Model training
The measured time course data of proteins from RPPA experiment contain relevant information about the regulatory loops and cross-talks comprising the signaling pathway. In this article, we developed a new algorithm to fit the model to the time course data of 16 proteins and infer 53 unknown parameters for each condition. The new algorithm is described as follows.
3.6.1 Parameter estimation
Along with development of biology science, signaling pathways and their models are becoming more and more important and complicated. For example, Chen’s model (Chen et al., 2009) consisted of 499 ODEs, which tracked the dynamics of 828 reactions and 229 parameters. It is impossible to optimize so many parameters in such a large signaling pathway by classical gradient algorithms or evolution algorithms such as GA. For this reason, our novel optimization algorithm decomposed the large signaling pathway into small components and estimated the parameters in each component. And then, we can relieve the heavy and complicated computation requests to obtain better results with lesser error between simulated data and experimental data.
Most works on pathway model decomposition focus on identification of small functional subnetworks or network motifs using structural features of the signaling pathways (Rahat et al., 2009; Shoval and Alon, 2010). However, our decomposition approach considers the forms of the phosphorylation reactions that drive the flow of bimolecular signals. Our approach is briefly summarized in the following steps (Fig. 2A). First, we constructed the mathematical model of the signaling pathway by mass action equations (see previous section of ‘modeling the pathway’ for detail) and meanwhile represented the signaling pathway using hybrid functional Petri net (HFPN) (Tang and Wang, 2012). Second, guided by some heuristic rules, HFPN was decomposed into small components (Fig. 2B–C) in which the parameters can be efficiently estimated. Third, we estimated the parameters of each component via PSO algorithm (Iadevaia et al., 2010; Kennedy and Eberhart, 1995). Fourth, we decomposed the signaling pathway into subpathways and then used factor graph (Kschischang et al., 2001; Nam et al., 2011) to represent the subpathways. Fifth, we reconciled the parameters of different subpathways via BP algorithm (Kschischang et al., 2001; Nam et al., 2011) based on the results from the third step as the initial values and get the best set of parameter ranges. Finally, the ultimate parameters of the whole signaling pathway were obtained using PSO algorithm from the ranges of these parameters obtained from the fifth step.
Fig. 2.

The description of the proposed MFG algorithm. (A) The flowchart of the algorithm consisting of four steps: ODE modeling, initialization, MFG and refinement. (B) HFPN of the MM-specific signaling pathway. (C) The decomposed signaling pathway consisting of 16 components (or modules) labeled with Arabic numbers. (D)-(E) The decomposed two subpathways. (F) An example of Petri net transformed to factor graph presented in (G)
From aforementioned procedures, there are three levels (Fig. 2A) in our algorithm: initialization, MFG and refinement. In the first level, PSO is used to estimate the parameters in each component. Because the number of parameters in each component is rather small, we can get the results effectively and efficiently. However, the results are obtained component by component, so it is necessary to estimate the parameters systematically. In the second level, we construct factor graph of signaling pathway and apply BP algorithm to estimate the parameters systematically and get the best set of parameter ranges. In the last level, we refine the parameters within the best set of parameter ranges using PSO algorithm. We describe more details about the procedures as follows:
Hybrid Functional Petri Net: An HFPN is a directed bipartite graph consisting of two types of nodes: places and transitions (Fig. 2B). In our case, places and transitions represent proteins and reactions, respectively, and they are connected by arcs to indicate the flow of reactants (input) and products (output). Finally, HFPN and ODE system can represent the signaling pathway map equivalently. The details are provided in Supplementary Material S6.
Pathway Decomposition: Guided by specific rules, we obtained the decomposed signaling pathway shown in Figure 2C, where there are 16 components marked by numbers 1–16. The detailed rules of decomposition are provided in Supplementary Material S7.
-
Parameter Estimation of Components: Parameter estimation can be formulated as an optimization problem with ODE constrains with the values of state variables at the selected discrete time points as the output of the system. We denote the time-series measurements of protein concentration levels as
 and the theoretical results obtained from ODEs model as
  , where
  is the index of protein,
  is the time point and
  is the parameter vector, which can be obtained by the following formula:
where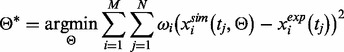
 ,
,  and
and  denote the number of proteins and the number of time points in the component, respectively. The PSO algorithm was used to optimize the aforementioned problem.
To guarantee the stability of our algorithm, we repeated the PSO algorithms 10 times to get the best result for each component. To improve the efficiency of computation, we used the following strategy to estimate the parameters component by component. In principle, calculating the parameters in Component
 needs the estimated parameters in Component 1 to Component
  because there could be one or a few more proteins in the previous components linked to the proteins in current component. This step is a local optimization.
 -
Constructing Factor Graph of Signaling Pathway: After local optimization (estimating parameters component by component), we were to do global optimization. In the beginning, we decomposed the pathway into two subpathways (Fig. 2D and E). Each has about half of proteins in the whole pathway. This decomposition method can reduce the complexity of computation and improve performance of optimization by reducing the dimension of search space. The decomposition method includes the following steps.
First, we labeled the protein nodes connecting with one of the phenotypes using different Arabic numbers. The phenotypes defined here are the outputs of the signaling pathway, i.e. cell growth and cell apoptosis. Second, the upstream proteins activating or inhibiting the protein labeled with Arabic number
 were also marked with Arabic number
  . In that way, we tagged all proteins in the whole pathway with different Arabic numbers and then defined the pathway as one subpathway in which the proteins were tagged by the same number. Third, if two sub-pathways share 90% proteins, we merged these two sub-pathways together as one sub-pathway. Fourth, if one sub-pathway has twice as many proteins as in other sub-pathways, we further decomposed this big sub-pathway by repeating the aforementioned three steps.
Figure 2D and E shows the results of decomposition. In principle, we can estimate the parameters in each sub-pathway using PSO. However, conflict exists for some parameters related to the shared proteins in Components 1–4 (Fig. 2C) if we estimate these parameters from different sub-pathways. BP algorithm is regarded as an approach to reconcile this kind of conflict and presented as messages updating equations on factor graph. Hence, we need to represent our signaling pathway as factor graph. A factor graph is an undirected bipartite graph consisting of factor nodes and variable nodes. In our present setting, the signaling pathway is represented as Petri net composed of places, transitions and arcs (Fig. 2B). We transformed the Petri net to factor graph by substituting places with factor nodes, substituting transitions with variable nodes and reserving all arcs. Figure 2F and G shows an example of constructing factor graph. As we can see, when one protein is shared by two different sub-pathways, we set two factor nodes for this protein. Finally, we constructed the factor graph for our signaling pathway, which combined together two factor graphs corresponding to two sub-pathways decomposed above.
Reconciling the Parameters via BP Algorithm: To reconcile the conflicts among the parameters of the shared species, we first defined individual compatibility function for each factor node in the context of individual factor graph and then combined all the compatibility functions across two factor graphs (or the combined factor graph) in one objective function through which the shared parameters can be optimized by applying BP algorithm (see Supplementary Material S8 for details). Note that the initial values (or the initial ranges) of the parameters used in BP algorithm were obtained from the step of initialization of our MFG algorithm. Finally, the best set of ranges of the model parameters with smaller lengths of intervals can be obtained through BP algorithm from the initial ranges with larger lengths of intervals.
Refining the Estimated Parameters: Through aforementioned steps, we obtained the best set of ranges of the parameters. Finally, the ultimate estimates of the parameters were obtained using PSO algorithm from those ranges. This step was repeated 10 times to get the best result by improving the stability of our algorithm.
3.6.2 Implementation of the MFG system
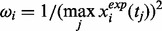
To make the proposed MFG algorithm clearer, we provide an example model in Supplementary Material S9 (along with performance evaluation and theoretic exploration), and we further make all the related source codes and the RPPA experimental data publicly available (http://ctsb.is.wfubmc.edu/publications/modularized-factor-graph.php). For MM pathway model, we used the concentration levels of proteins at 0 min as the control to normalize the protein profiles, i.e. the normalized protein profile at any time t is the ratio of the raw protein profile at time t over the one at time 0. That means the initial values of phosphoproteins in our ODEs systems are all set as 1.
First, from the RPPA data, we got the timescale of producing reactions and consuming reactions and then roughly calculated the original ranges of all parameters as [10−7, 103] via response time of reactions. When we picked up 1000 sets of parameters randomly from this range, the values of Pearson’s correlations between simulation results and experimental data were nearly zero (data not shown). Second, we went through the level of initialization of our MFG algorithm to get the initial estimates of the parameters and then used them to narrow the original ranges of the parameters to the ranges with all the lengths of intervals as only 1 and with the centers at the initial estimates. Note that the corresponding new range was set as [0, 1] if the initial estimate of a certain parameter was <0.5. When we picked out 1000 sets of parameters randomly from those ranges, the values of Pearson’s correlation for the phosphorylated proteins were improved but still generally low, and some were roughly located between 0.5 and 0.6 except for phosphorylated Shc (data are provided in Supplementary Material S10). Finally, they were significantly improved after running the level of MFG, for the Pearson’s correlations for many proteins have been between 0.8 and 0.93 (Supplementary Material S10). Therefore, these results suggest that the proposed MFG approach is efficient in training big ODE systems given the initial parameter range setting.
For each condition, we estimated the parameters using the aforementioned algorithm, and the 42-thread parallel computation took ∼8 h on the high-performance computational server (Dell PowerEdge R815, AMD OperonTM 6172, 2.1 GHz, 64 GB Memory, Linux 2.6.32, Debian 2.6.32-31). The fitting results are provided in Supplementary Material S11. These results again show that the proposed MFG works well in modeling complex signaling pathways with limited phosphoproteomics information. In addition, we performed the parameter identifiability and sensitivity analysis for all the final ODE models in all conditions (see Supplementary Material S12 for details). The results show that ∼80% parameters are identifiable in the models and the models are considerably stable as well.
3.7 Drug resistance shown by experimental results
To assess whether each p38 isoform has distinctive function in mediating drug resistance, we performed MTT cell growth assay, as described in Section 2. Figure 3 shows the effects of the drugs on the growth of p38 isoform knockdown MM cells. Results show that, in vehicle condition, p38 knockdown cells proliferated to ∼2-folds after 48 h and ∼3.5-folds after 72 h compared with starting point. In contrast, the control and p38
 knockdown cells proliferated to 5–7-folds after 72 h. Both ATO and BZM can inhibit cell growth in all cases. However, these cell lines showed different resistance to ATO and BZM. For example, 72 h ATO treatment inhibited 80% of cell growth in p38
 knockdown cells but only 60% in p38
 knockdown cells compared with vehicle. Also, 72 h BZM treatment inhibited 60% of cell growth in p38
 knockdown cells but only 15% in p38
 knockdown cells compared with vehicle. These results manifested that the functions of p38 isoforms are not redundant, at least not always. The p38
 knockdown cells are more sensitive to ATO or BZM treatment, which is consistent with our previously reported finding that SB203580, a specific inhibitor to p38
 , can synergistically enhance ATO-induced or ATO/BZM combination-induced cytotoxicity in MM cells (Wen et al., 2008). To our surprise, p38
 knockdown cells exhibited distinct outcome after ATO/BZM treatment, which has not been reported to our knowledge. The p38
 knock down kept MM cells in a more inactive status in a non-drug condition and conferred MM cells’ higher resistance to ATO and BZM.
Fig. 3.

Effects of ATO or BZM on growth of p38 isoform knockdown MM cells. (A–E) The cell growth profiles in different culture conditions from cell growth assay. (F) Summary of the fold changes of cell growth compared with initial time point. Data are mean ± SD of three independent experiments. The results show the strong drug resistance in condition of p38 knockdown cell line treated with BZM
3.8 Identifying new mechanisms and experimental validation
To determine the mechanisms of drug resistance in MM triggered by p38 isoforms using proposed MFG approach, we trained the pathway models separately based on RPPA data from three different MM cell lines, i.e. control cell line, p38 knockdown cell line and p38
 knockdown cell line, all treated with BZM. Figure 4A illustrates the result of an important part of the estimated parameters of models in three conditions considered, from which some new mechanisms related to drug resistance may be predicted. First, Figure 4A interestingly shows that four parameters are rather small (<10−6) for all three conditions, which are related to four reactions including p_mTOR phosphorylating P70S6K, pJNK activating BAX, p_p38 activating BAX and p_c-Jun activating PARP. In our models, the parameter values mean specific reaction rates in signaling pathway. When a parameter is rather small, we regard the corresponding reaction may not exist in the signaling pathway. From the results of parameter estimation, therefore, the four reactions identified above may not exist in the signaling pathway, which are illustrated as dash lines with crosses in Figure 4B. Secondly, Figure 4A shows that the reaction rate of p38 phosphorylating ERK1/2 in p38
 knockdown condition is much smaller than that in both control condition and p38
 knockdown condition, which predicts that p38
 isoform may synergistically promote the phosphorylation of ERK1/2. This result is illustrated as brown bold line (p38 to ERK1/2) in Figure 4B and was validated by western blotting in Figure 4C. In addition, Figure 4A shows that the reaction rate of pAKT phosphorylating IKK in p38
 knockdown condition is much smaller than that in both control condition and p38
 knockdown condition, which predicts that p38
 isoform may synergistically promote the phosphorylation of IKK by pAKT. This result is illustrated as green bold line (AKT to IKK) in Figure 4B. Finally, from the illustration of Figure 4B we summarize that p38 isoforms result in drug resistance in MM via regulating the related pathways including ERK pathway and NFкB pathway. ERK pathway regulating cell growth is synergistically regulated by p38
 isoform, whereas NFкB pathway regulating cell apoptosis is synergistically regulated by p38
 isoform.
Fig. 4.

The predicted mechanisms of drug resistance and experimental validation. (A) Illustration of an important part of the estimated parameters of models in three conditions, i.e. control cell line treated with BZM (blue bar, the first one), p38 knockdown cell line treated with BZM (green bar, the second one) and p38
 knockdown cell line treated with BZM (brown bar, the third one). (B) Illustration of the predicted mechanisms of drug resistance based on the results shown in (A), where the dash lines with crosses highlight the reactions that may not exist, and the brown bold line (p38 to ERK1/2) and green bold line (AKT to IKK) highlight the reactions related to drug resistance specifically through p38
 isoform and p38
 isoform, respectively. (C) Experimental validation for the existence of the reaction of p38 phosphorylating ERK1/2 through p38
 isoform from western blotting results of ERK1/2 in two conditions, i.e. negative/control cell line treated with BZM and p38
 knockdown cell line treated with BZM
3.9 Screening drug combinations
To find out the optimal drug treatment to BZM-resistant MM cells, we screened drug treatments in silico based on our constructed pathway model in condition of MM control cell line treated with BZM, as shown in Figure 4B. In the procedure of simulation, if we want to simulate the inhibition of a certain protein by a certain drug, we let the corresponding reaction rates related to this protein equal to 10−6 (a rather small number) for the purpose of simplification; on the other hand, the effects of drug treatment, i.e. cell growth and cell apoptosis, were simulated by the concentration levels of two protein marks p_P70S6K and cPARP, respectively. Then, we first screened one drug treatments throughout all the proteins in the pathway except for GFR. The simulation results showed that it was unable to significantly inhibit cell growth and promote cell apoptosis simultaneously to reach good therapeutic effect (data not shown). Next, we screened two-drug combinations and finally found out the promising drug combination, i.e. ERK1/2 and NFкB, which is illustrated using red (bold) hammerheads in the pathway in Figure 5A. Figure 5B shows the simulation result of the promising drug combination treatment effects, which demonstrates that the predicted treatment enhances cell apoptosis and inhibits cell growth simultaneously and significantly. Finally, the prediction of drug combinations from computational screening was partially validated from cell apoptosis analysis. As shown in Figure 5C, after 24 h treatment, MEK1/2 inhibitor PD 184352 combined with IKK inhibitor Bay 11-7082 induced 60% apoptosis in the presence of BZM.
Fig. 5.

Promising drug combination treatment on BZM-resistant MM cells from model prediction and experimental validation. (A) The demonstration of screening of drug combinations from model prediction. The predicted promising combination is highlighted with red (bold) hammerheads in the pathway. (B) Simulation result of the promising drug combination treatment effects. The cell growth (lower curve) and cell apoptosis (upper curve) are measured from two model outputs, i.e. p_P70S6K and cPARP, respectively. (C) Experimental validation from cell apoptosis assay. Data are mean ± SD of three independent experiments
4 DISCUSSION
In this article, the generic signaling pathway was first built from LC-MS data. Then we developed a novel computational procedure involving the mass action modeling with a new optimization algorithm called MFG to train the models against the experimental data (RPPA) and estimate the unknown parameters in the models. The trained models were then used to analyze the new mechanisms triggered by different p38 isoforms in the MM cell lines treated with ATO or BZM. The new mechanisms were partially validated via western blotting. Based on the predicted results, we then screened drug combinations and found the promising drug combination to reduce the effects of drug resistance.
We compared the proposed MGF algorithm with pure PSO and GA. The computational cost of pure PSO was huge and the accuracy was not good. The classical GA was inefficient compared with MFG because the dimensions of searching space were big. However, in MFG, the level of initialization was used to decrease the dimensions of searching spacing, and the level of MFG was designed to optimize the objective function systematically based on the smaller searching space. Accordingly, the consuming time was less and it cost ∼8 h to estimate 53 parameters in ODE model, whereas it took almost 5 days to get the results using GA or PSO. However, there is still room to further improve the efficiency of MFG algorithm. First, we could replace PSO in the refinement level of MFG algorithm with gradient algorithm such as Levenberg–Marquardt or Gaussian–Newton because convergent speed of gradient algorithm is faster than heuristic optimization algorithm such as PSO and GA when it searches the optimal solutions locally (Marquardt, 1963). Second, the optimization process guided by PSO in the step of parameter estimation of components cost almost half of the whole running time. Therefore, more efficient optimization algorithm is expected in future work. In addition, some further discussions from the biological point of view are provided in Supplementary Material S13.
Supplementary Material
ACKNOWLEDGEMENTS
The authors would like to thank the anonymous reviewers for their valuable comments and suggestions to improve the quality of the article. They would also like to thank the members in Bioinformatics group in their laboratory for their valuable discussions.
Funding: This work was supported by National Institutes of Health (1U01CA166886, 1R01LM010185, and 1U01HL111560) (to X.Z.). This work was also partially supported by Natural Science Foundation of China (61373105, to X.Z., and 61372138, to L.Z.).
Conflict of Interest: none declared.
REFERENCES
- Barancik M, et al. SB203580, a specific inhibitor of p38-MAPK pathway, is a new reversal agent of P-glycoprotein-mediated multidrug resistance. Eur. J. Pharm Sci. 2001;14:29–36. doi: 10.1016/s0928-0987(01)00139-7. [DOI] [PubMed] [Google Scholar]
- Calzolari D, et al. Search algorithms as a framework for the optimization of drug combinations. PLoS Comput. Biol. 2008;4:e1000249. doi: 10.1371/journal.pcbi.1000249. [DOI] [PMC free article] [PubMed] [Google Scholar]
- Chen WW, et al. Input-output behavior of ErbB signaling pathways as revealed by a mass action model trained against dynamic data. Mol. Syst. Biol. 2009;5:239. doi: 10.1038/msb.2008.74. [DOI] [PMC free article] [PubMed] [Google Scholar]
- Enslen H, et al. Selective activation of p38 mitogen-activated protein (MAP) kinase isoforms by the MAP kinase kinases MKK3 and MKK6. J. Biol. Chem. 1998;273:1741–1748. doi: 10.1074/jbc.273.3.1741. [DOI] [PubMed] [Google Scholar]
- Gilar M, et al. Orthogonality of separation in two-dimensional liquid chromatography. Anal. Chem. 2005;77:6426–6434. doi: 10.1021/ac050923i. [DOI] [PubMed] [Google Scholar]
- Guo X, et al. Increased p38-MAPK is responsible for chemotherapy resistance in human gastric cancer cells. BMC Cancer. 2008;8:375. doi: 10.1186/1471-2407-8-375. [DOI] [PMC free article] [PubMed] [Google Scholar]
- Hideshima T, et al. Targeting p38 MAPK inhibits multiple myeloma cell growth in the bone marrow milieu. Blood. 2003;101:703–705. doi: 10.1182/blood-2002-06-1874. [DOI] [PubMed] [Google Scholar]
- Hideshima T, et al. Understanding multiple myeloma pathogenesis in the bone marrow to identify new therapeutic targets. Nat. Rev. Cancer. 2007;7:585–598. doi: 10.1038/nrc2189. [DOI] [PubMed] [Google Scholar]
- Hideshima T, et al. p38 MAPK inhibition enhances PS-341 (bortezomib)-induced cytotoxicity against multiple myeloma cells. Oncogene. 2004;23:8766–8776. doi: 10.1038/sj.onc.1208118. [DOI] [PubMed] [Google Scholar]
- Iadevaia S, et al. Identification of optimal drug combinations targeting cellular networks: integrating phospho-proteomics and computational network analysis. Cancer Res. 2010;70:6704–6714. doi: 10.1158/0008-5472.CAN-10-0460. [DOI] [PMC free article] [PubMed] [Google Scholar]
- Kennedy J, Eberhart R. Particle swarm optimization. Proceedings of IEEE International Conference on Neural Networks. 1995;4:1942–1948. The IEEE, New York. [Google Scholar]
- Kschischang FR, et al. Factor graphs and the sum-product algorithm. IEEE Transactions on Information Theory. 2001;47:498–519. [Google Scholar]
- Lehar J, et al. Synergistic drug combinations tend to improve therapeutically relevant selectivity. Nat. Biotechnol. 2009;27:659–666. doi: 10.1038/nbt.1549. [DOI] [PMC free article] [PubMed] [Google Scholar]
- Manning BD, Cantley LC. AKT/PKB signaling: navigating downstream. Cell. 2007;129:1261–1274. doi: 10.1016/j.cell.2007.06.009. [DOI] [PMC free article] [PubMed] [Google Scholar]
- Marderosian M, et al. Tristetraprolin regulates Cyclin D1 and c-Myc mRNA stability in response to rapamycin in an Akt-dependent manner via p38 MAPK signaling. Oncogene. 2006;25:6277–6290. doi: 10.1038/sj.onc.1209645. [DOI] [PubMed] [Google Scholar]
- Marquardt DW. An algorithm for least-squares estimation of nonlinear parameters. Journal of the Society for Industrial and Applied Mathematics. 1963;11:11. [Google Scholar]
- Mitsiades CS, et al. Activation of NF-kappaB and upregulation of intracellular anti-apoptotic proteins via the IGF-1/Akt signaling in human multiple myeloma cells: therapeutic implications. Oncogene. 2002;21:5673–5683. doi: 10.1038/sj.onc.1205664. [DOI] [PubMed] [Google Scholar]
- Mitsos A, et al. Identifying drug effects via pathway alterations using an integer linear programming optimization formulation on phosphoproteomic data. PLoS Comput. Biol. 2009;5:e1000591. doi: 10.1371/journal.pcbi.1000591. [DOI] [PMC free article] [PubMed] [Google Scholar]
- Nam M, et al. 2011. Data Parallelism for Belief Propagation in Factor Graphs. 2011 Proceedings of 23rd International Symposium on Computer Architecture and High Performance Computing (SBAC-PAD 2011) [Google Scholar]
- Peng H, et al. Drug inhibition profile prediction for NFkappaB pathway in multiple myeloma. PLoS One. 2011;6:e14750. doi: 10.1371/journal.pone.0014750. [DOI] [PMC free article] [PubMed] [Google Scholar]
- Peng H, et al. A systematic modeling study on the pathogenic role of p38 MAPK activation in myelodysplastic syndromes. Mol. Biosyst. 2012;8:1366–1374. doi: 10.1039/c2mb05184b. [DOI] [PubMed] [Google Scholar]
- Podar K, et al. Vascular endothelial growth factor triggers signaling cascades mediating multiple myeloma cell growth and migration. Blood. 2001;98:428–435. doi: 10.1182/blood.v98.2.428. [DOI] [PubMed] [Google Scholar]
- Rahat O, et al. Understanding hydrogen-bond patterns in proteins using network motifs. Bioinformatics. 2009;25:2921–2928. doi: 10.1093/bioinformatics/btp541. [DOI] [PubMed] [Google Scholar]
- Saez-Rodriguez J, et al. Discrete logic modelling as a means to link protein signalling networks with functional analysis of mammalian signal transduction. Mol. Syst. Biol. 2009;5:331. doi: 10.1038/msb.2009.87. [DOI] [PMC free article] [PubMed] [Google Scholar]
- Shoval O, Alon U. SnapShot: network motifs. Cell. 2010;143:326–e321. doi: 10.1016/j.cell.2010.09.050. [DOI] [PubMed] [Google Scholar]
- Silva JC, et al. Absolute quantification of proteins by LCMSE: a virtue of parallel MS acquisition. Mol. Cell Proteomics. 2006;5:144–156. doi: 10.1074/mcp.M500230-MCP200. [DOI] [PubMed] [Google Scholar]
- Tang Y, Wang F. Neural system modeling and simulation using hybrid functional petri net. J. Bioinform. Comput. Biol. 2012;10:17. doi: 10.1142/S0219720012400069. [DOI] [PubMed] [Google Scholar]
- Wen J, et al. P38 MAPK inhibition enhancing ATO-induced cytotoxicity against multiple myeloma cells. Br. J. Haematol. 2008;140:169–180. doi: 10.1111/j.1365-2141.2007.06895.x. [DOI] [PubMed] [Google Scholar]
- Wen J, et al. Enhanced antimyeloma cytotoxicity by the combination of arsenic trioxide and bortezomib is further potentiated by p38 MAPK inhibition. Leuk. Res. 2010;34:85–92. doi: 10.1016/j.leukres.2009.05.024. [DOI] [PubMed] [Google Scholar]
- Wen J, et al. Luteinizing Hormone-Releasing Hormone (LHRH)-I antagonist cetrorelix inhibits myeloma cell growth in vitro and in vivo. Mol. Cancer Ther. 2011;10:148–158. doi: 10.1158/1535-7163.MCT-10-0829. [DOI] [PubMed] [Google Scholar]
- Younes H, et al. Targeting the phosphatidylinositol 3-kinase pathway in multiple myeloma. Clinical Cancer Res. 2007;13 doi: 10.1158/1078-0432.CCR-06-2921. [DOI] [PubMed] [Google Scholar]
- Zhao XM, et al. Prediction of drug combinations by integrating molecular and pharmacological data. PLoS Comput. Biol. 2011;7:e1002323. doi: 10.1371/journal.pcbi.1002323. [DOI] [PMC free article] [PubMed] [Google Scholar]
- Zinner RG, et al. Algorithmic guided screening of drug combinations of arbitrary size for activity against cancer cells. Mol. Cancer Ther. 2009;8:521–532. doi: 10.1158/1535-7163.MCT-08-0937. [DOI] [PubMed] [Google Scholar]
Associated Data
This section collects any data citations, data availability statements, or supplementary materials included in this article.