

Abstract
Summary: Current tools for liquid chromatography and mass spectrometry for metabolomic data cover a limited number of processing steps, whereas online tools are hard to use in a programmable fashion. This article introduces the Metabolite Automatic Identification Toolkit (MAIT) package, which makes it possible for users to perform metabolomic end-to-end liquid chromatography and mass spectrometry data analysis. MAIT is focused on improving the peak annotation stage and provides essential tools to validate statistical analysis results. MAIT generates output files with the statistical results, peak annotation and metabolite identification.
Availability and implementation: http://b2slab.upc.edu/software-and-downloads/metabolite-automatic-identification-toolkit/.
Contact: francesc.fernandez.albert@upc.edu
Supplementary information: Supplementary data are available at Bioinformatics online
1 INTRODUCTION
Liquid chromatography and mass spectrometry (LC/MS) is an analytical technique used widely in metabolomics to detect molecules in biological samples (Theodoridis et al., 2012). A wide array of software tools is available for LC/MS profiling data analysis, including commercial, programmatic and online tools. A commercial example is Analyst®, whereas some open-source packages permit programmatic processing, such as the R package XCMS (Smith et al., 2006) to detect peaks or CAMERA (Kuhl et al., 2012) and AStream (Alonso et al., 2011) for peak annotations. There have been efforts on just peak annotation using JAVA (Brown et al., 2011). MZmine and mzMatch are modularized tools coded in JAVA that are focused on LC/MS data preprocessing and visualization (Katajamaa et al., 2006; Pluskal et al., 2010; Scheltema et al., 2011). Online tools permit sample processing through a web Graphical User Interface, such as XCMSOnline (http://xcmsonline.scripps.edu) or MetaboAnalyst (Xia et al., 2009). Refer to Supplementary Table S1 for a comparative between the capabilities for some of the main available tools. In this context, we introduce a new R package called Metabolite Automatic Identification Toolkit (MAIT) for automatic LC/MS analysis. The goal of the MAIT package is to provide an array of tools that makes programmable metabolomic end-to-end statistical analysis possible (see Section 3 of the Supplementary Material for details about the MAIT modularity). MAIT includes functions to improve peak annotation through the process called biotransformations and to assess the predictive power of statistically significant metabolites that quantify class separability.
2 METHODS
MAIT includes the stages peak detection, peak annotation, statistical analysis and table and plots creation (Fig. 1). The peak detection stage detects the peaks in the LC/MS sample files. The peak annotation stage improves the identification of the metabolites in the metabolomic samples by increasing the chemical and biological information in the dataset. A statistical analysis reveals the significant sample features and measures their predictive power. MAIT uses the R package XCMS to detect and align peaks. For the peak annotation step, MAIT uses three steps:
First, MAIT uses the CAMERA package to perform the first annotation step (Kuhl et al., 2012). In this stage, MAIT uses a peak correlation distance and a retention time window to find which peaks came from the same source metabolite based. The peaks within each peak group are annotated following a reference adduct/fragment table and a mass allowance window.
Biotransformations could be related to specific in-source mass losses. Therefore, in the second annotation step, they are detected using a mass allowance window inside the peak groups (Breitling et al., 2006). For this search, MAIT already includes a biotransformations table (here Human biotransformations). User-defined biotransformation tables can be set as input, following the procedure defined in Supplementary Text (Section 6.6).
Finally, a predefined metabolite database is mined for significant masses. This identifies metabolites with the help of the Human Metabolome Database (Wishart et al., 2009), 2009/07 version.
Fig. 1.
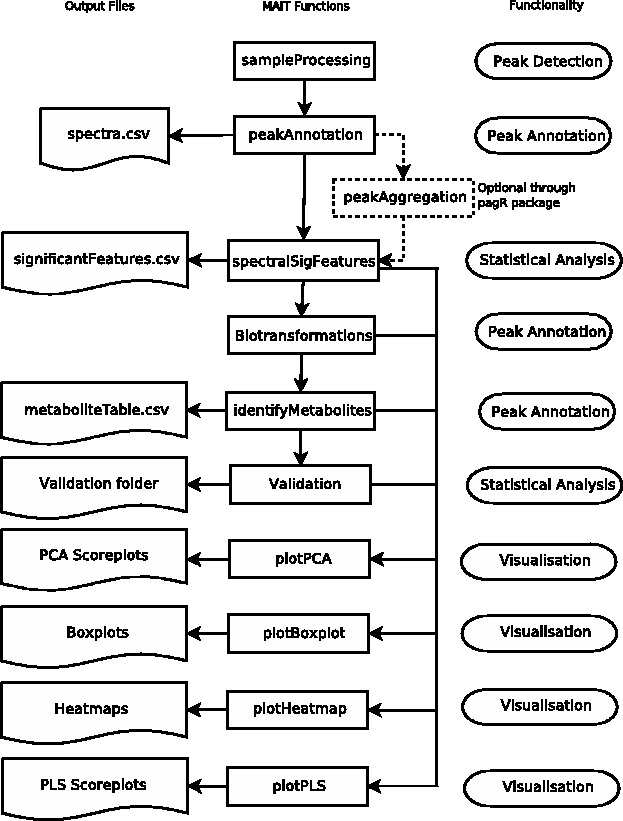
Correspondence between MAIT functions (centre column), generated output files (left column) and their functionality (right column)
The objective of analysing the metabolomic profiling data is to obtain the statistically significant features (SSF) that contain the highest amount of class-related information. To gather these features, MAIT can apply statistical tests such as ANOVA or Student’s t-test to every feature, selecting the significant set of features given a threshold P-value. A validation test is included to quantify SSF class separability by a repeated random subsampling cross-validation using three methods: partial least squares and discriminant analysis, support vector machines and K-nearest neighbours (Hastie et al., 2009). MAIT computes overall and class-related classification ratios to evaluate the SSF class-related information.
3 RESULTS
The example data files are a subset of the data used in the reference (Saghatelian et al., 2004), which are distributed freely through the faahKO package (Smith, 2012). MAIT was used to read and analyse these samples using the functions depicted in Figure 1 (see the tutorial in the Supplementary Information). The significant features for each class are found using statistical tests and analysed through the different plots that MAIT produces. Using the following function call, 2640 peaks were detected:
R> MAIT <- sampleProcessing(dataDir = “Dataxcms”, project = “MAIT_Demo”, snThres = 2, rtStep = 0.03)
At this point, the first annotation stage is launched:
R> MAIT <- peakAnnotation(MAIT.object = MAIT)
Next, we gather the significant features from the peaks detected. After the Welch’s tests, 106 of these features were found to be significant through the spectralSigFeatures function. Statistical plots such as heat maps, boxplots and principal component analysis score plots can be generated (Supplementary Figs S3 and S4). Significant features are annotated after checking for certain neutral losses (biotransformations).
R> MAIT <- spectralSigFeatures(MAIT, P = 0.05)
R> MAIT <- Biotransformations(MAIT, peakPrecision = 0.005)
By using only the SSF, a validation stage is launched, obtaining a classification ratio of 100% with three training samples for all classifiers. These results suggest that the significant variables separate both classes completely.
R> MAIT <- Validation(MAIT, Iterations = 20, trainSamples = 3)
Finally, the database is mined to identify the significant features.
R> MAIT <- identifyMetabolites(MAIT, peakTolerance = 0.005)
4 CONCLUSIONS
MAIT provides a set of tools and functions to perform an automatic end-to-end analysis of LC/MS metabolomic data, putting special emphasis on peak annotation and metabolite identification. In addition, MAIT validation functions make it possible to estimate predictive power for significant variables.
Funding: Spanish national (grants AGL2009-13906-C02-01/ALI and AGL2010-10084-E), the CONSOLIDER INGENIO 2010 Programme, FUN-C-FOOD (CSD2007-063) from the MICINN and Merck Serono 2010 Research Grants (Fundación Salud 2000). Spanish Ministerio de Ciencia y Tecnología through TEC2010-20886-C02-02 and TEC2010-20886-C02-01 (in part) A.P. is part of the 2009SGR-1395 consolidated research group of the Generalitat de Catalunya, Spain. CIBER-BBN is an initiative of the Spanish ISCIII. R.L. thanks the MICINN and the European Social Funds for their financial contribution to the R. L. Ramón y Cajal contract (Ramon y Cajal Programme, MICINN-RYC). F.F.-A. thanks EVALXARTA-UB and Agència de Gestió d’Ajuts Universitaris I de Recerca, AGAUR (Generalitat de Catalunya), for their financial support.
Conflict of Interest: none declared.
Supplementary Material
REFERENCES
- Alonso A, et al. AStream: an R package for annotating LC/MS metabolomic data. Bioinformatics. 2011;27:1339–1340. doi: 10.1093/bioinformatics/btr138. [DOI] [PubMed] [Google Scholar]
- Breitling R, et al. Ab initio prediction of metabolic networks using Fourier transform mass spectrometry data. Metabolomics. 2006;2:155–164. doi: 10.1007/s11306-006-0029-z. [DOI] [PMC free article] [PubMed] [Google Scholar]
- Brown M, et al. Automated workflows for accurate mass-based putative metabolite identification in lc/ms-derived metabolomic datasets. Bioinformatics. 2011;27:1108–1112. doi: 10.1093/bioinformatics/btr079. [DOI] [PMC free article] [PubMed] [Google Scholar]
- Hastie T, et al. The Elements of Statistical Learning. 2 edn. New York: Springer; 2009. [Google Scholar]
- Katajamaa M, et al. MZmine: toolbox for processing and visualization of mass spectrometry based molecular profile data. Bioinformatics. 2006;22:634–636. doi: 10.1093/bioinformatics/btk039. [DOI] [PubMed] [Google Scholar]
- Kuhl C, et al. CAMERA: An Integrated Strategy for Compound Spectra Extraction and Annotation of Liquid Chromatography/Mass Spectrometry Data Sets. Analytical Chemistry. 2012;84:283–289. doi: 10.1021/ac202450g. [DOI] [PMC free article] [PubMed] [Google Scholar]
- Pluskal T, et al. MZmine 2: modular framework for processing, visualizing, and analyzing mass spectrometry-based molecular profile data. BMC Bioinformatics. 2010;11:395. doi: 10.1186/1471-2105-11-395. [DOI] [PMC free article] [PubMed] [Google Scholar]
- Saghatelian A, et al. Assignment of endogenous substrates to enzymes by global metabolite profiling. Biochemistry. 2004;43:14332–14339. doi: 10.1021/bi0480335. [DOI] [PubMed] [Google Scholar]
- Scheltema RA, et al. PeakML/mzMatch: a file format, Java library, R library, and tool-chain for mass spectrometry data analysis. Anal. Chem. 2011;83:2786–2793. doi: 10.1021/ac2000994. [DOI] [PubMed] [Google Scholar]
- Smith CA. faahKO: Saghatelian et al. (2004) FAAH knockout LC/MS data. 2012. R package version 1.2.15. http://dx.doi.org/10.1021/bi0480335. [Google Scholar]
- Smith CA, et al. XCMS: processing mass spectrometry data for metabolite profiling using nonlinear peak alignment, matching, and identification. Anal. Chem. 2006;78:779–787. doi: 10.1021/ac051437y. [DOI] [PubMed] [Google Scholar]
- Theodoridis GA, et al. Liquid chromatography-mass spectrometry based global metabolite profiling: a review. Anal. Chim. Acta. 2012;711:7–16. doi: 10.1016/j.aca.2011.09.042. [DOI] [PubMed] [Google Scholar]
- Wishart DS, et al. Hmdb: a knowledgebase for the human metabolome. Nucleic Acids Res. 2009;37:D603–D610. doi: 10.1093/nar/gkn810. [DOI] [PMC free article] [PubMed] [Google Scholar]
- Xia J, et al. Metaboanalyst: a web server for metabolomic data analysis and interpretation. Nucleic Acids Res. 2009;37(Suppl. 2):W652–W660. doi: 10.1093/nar/gkp356. [DOI] [PMC free article] [PubMed] [Google Scholar]
Associated Data
This section collects any data citations, data availability statements, or supplementary materials included in this article.