

Abstract
Trade-offs between different components of a pathogen's replication and transmission cycle are thought to be common. A number of studies have identified trade-offs that emerge across scales, reflecting the tension between strategies that optimize within-host proliferation and large-scale population spread. Most of these studies are theoretical in nature, with direct experimental tests of such cross-scale trade-offs still rare. Here, we report an analysis of avian influenza A viruses across scales, focusing on the phenotype of temperature-dependent viral persistence. Taking advantage of a unique dataset that reports both environmental virus decay rates and strain-specific viral kinetics from duck challenge experiments, we show that the temperature-dependent environmental decay rate of a strain does not impact within-host virus load. Hence, for this phenotype, the scales of within-host infection dynamics and between-host environmental persistence do not seem to interact: viral fitness may be optimized on each scale without cross-scale trade-offs. Instead, we confirm the existence of a temperature-dependent persistence trade-off on a single scale, with some strains favouring environmental persistence in water at low temperatures while others reduce sensitivity to increasing temperatures. We show that this temperature-dependent trade-off is a robust phenomenon and does not depend on the details of data analysis. Our findings suggest that viruses might employ different environmental persistence strategies, which facilitates the coexistence of diverse strains in ecological niches. We conclude that a better understanding of the transmission and evolutionary dynamics of influenza A viruses probably requires empirical information regarding both within-host dynamics and environmental traits, integrated within a combined ecological and within-host framework.
Keywords: environmental persistence, avian influenza, mathematical model, multi-scale analysis
1. Introduction
Aquatic birds are the definitive host of influenza A viruses [1,2]. While this fact has long been known, studies of avian influenza viruses (AIVs) in wild birds were limited [3] until the emergence of H5N1 and more recently H7N9 viruses [4,5]. These spill-over events have highlighted the importance of understanding the ecology and evolution of influenza viruses in their avian hosts as a pre-requisite to better surveillance and preparedness for pandemic threats [6].
While influenza in humans is thought to involve a relatively short environmental transmission stage (though this is still an area of active investigation [7–9]), accumulating evidence suggests that transmission of influenza in aquatic birds involves a potentially long-lasting environmental stage. In aquatic birds, the main route of transmission is thought to be faecal–oral [2]. While the proximity of many birds in large flocks can lead to rapid transmission and large-scale outbreaks, it has recently been appreciated that prolonged persistence of influenza virus in the aquatic environment is possible [10–13]. This might lead to additional, indirect chains of transmission [14–18].
Influenza virus circulation and long-term maintenance in avian populations is probably determined by a combination of explosive, essentially direct transmission and episodic contributions from the environmental reservoir [19]. The precise impact of environmental transmission is thought to be determined by virus-specific durability under different abiotic conditions. Specifically, temperature appears to be a particularly important determinant of AIV persistence, as quantified via laboratory incubations [10,20,21].
The importance of both environmental persistence and within-host replication for the overall fitness of avian influenza makes it a prime target to study the existence of potential trade-offs across scales. Within an infected host, efficient replication and immune evasion are central. At the population level, efficient transmission between hosts, potentially with good environmental persistence as an intermediate stage, is a critical component of overall pathogen fitness [22–26]. It is plausible, then, that different constraints act at different parts of this cycle and that potential conflicts between optimizing fitness for one component versus another may lead to trade-offs.
In recent years, several mainly theoretical studies (often going by the name of multi-scale studies) have considered aspects of pathogen replication and transmission cycles and have shown that trade-offs can arise under straightforward assumptions (e.g. [27–29] for recent reviews). While these studies provide useful insights regarding the general features of such trade-offs and the circumstances under which they should be expected, direct experimental tests of multi-scale trade-offs are less common. One notable exception is a study on environmental survival and growth in phages, where a trade-off between the environmental persistence of coliphages with replication efficiency in the bacterial host was demonstrated [30].
To our knowledge, while multi-scale trade-offs in influenza A viruses have been postulated [31], no direct evidence of their existence has been presented. Here, we combine mathematical models with a unique dataset of viral load dynamics following influenza infections in ducks and viral persistence in water to analyse the temperature-dependent persistence phenotype and to study whether this phenotype encounters any trade-offs. We find—perhaps surprisingly—little evidence for a trade-off of this phenotype between the environmental and the within-host scales. Instead, confirming findings from a previous study [31], we find that a temperature-dependent trade-off exists on a single scale, namely the environmental stage.
2. Material and methods
(a). Experimental data
The data we analysed quantified virus persistence as a function of temperature from in vitro experiments, together with virus load estimates from influenza infections in ducks. The seven virus isolates were obtained from an ongoing long-term surveillance of AIV circulation in wild birds in Minnesota, USA [32,33].
Five viruses were isolated from dabbling ducks between 14 and 16 September 2007 at Roseau River Wildlife Management Area, Minnesota, USA. For these viruses, we previously provided evidence that they arose from a limited gene pool, probably resulting from genetic reassortment between circulating viruses in the sampled duck population [34]. Two additional viruses were isolated from surface lake water [20]. These two strains, which are genetically more different, are marked with an asterisk (*) throughout the paper.
For all isolates, virus persistence in water as a function of temperature as well as virus shedding pattern in mallards (Anas platyrhynchos) were assessed. Virus persistence (i.e. virus infectivity over time) was measured based on the median tissue culture infectious dose in Madin-Darby canine kidney cells. Virus load was quantified based on the Matrix gene copy number in cloacal and oropharyngeal samples estimated by real-time PCR. Note that we performed all analyses described below for both the cloacal and the oropharyngeal data. Results and conclusions were the same for both the cloacal and oropharyngeal data. We therefore present here only results for the cloacal data owing to its greater importance as a route of potential environmental transmission. Further details related to the experimental design and methodology are available from the previously published studies [20,34].
(b). Temperature-dependent decay equation
We fitted the rate of virus decay c(T) as a function of temperature T (in degrees Celsius) using the simple exponential equation c(T) = αeγT. For each virus strain, we estimated two parameters, α and γ, which represent the rate of virus decay at 0°C (α) and the sensitivity of viral decay to increasing temperature (γ). Assuming a normal distribution for the error structure, for each strain we minimized the sum of squared residuals (SSR) given by SSRn = ∑T(dT − mT)2, where dT and mT are model and data values at temperature T. We also performed parameter fits under the assumption that errors are lognormally distributed. Specifically, we minimized SSRi = ∑T(log(dT)−log(mT))2.
(c). Within-host models
We used two different models to fit the virus load data obtained from infection experiments. The first was a simple mechanistic model we used previously to fit similar data [31]. This simple model and variants have been used in several recent analyses of influenza A virus within-host infection dynamics (e.g. [35,36] for reviews). The model tracks uninfected cells, U; infected cells, I; and free infectious virus, V. Cells become infected at rate k, infected cells produce virus at rate p and die at rate δ. Free virus is cleared at rate d. The equations for uninfected cells, infected cells and free virus are given by dU/dt = −kUV, dI/dt = −kUV−δI and dV/dt = pI−dV. In addition to this mechanistic model, we also considered a simple phenomenological model that has been shown to provide a good fit to virus load curves for influenza infections [37]. The equation is given by V(t) = 2Vp/(exp[−λg(t−tp)] + exp[−λd(t−tp)]). Here, t is the time post infection, V(t) the virus load at time t, and Vp, tp, λg and λd are the four model parameters to be estimated. We refer the reader to [38] for a more detailed explanation and rationale for this model. As the focus of our study was not on model comparison or parameter estimation, the important consideration was that both the mechanistic model and the phenomenological model provided a good and robust fit to the virus load data and allowed us to easily compute the area under virus load curve, which we used to quantify fitness (see §2d). The within-host models were fit to the data by minimizing the sum of squared errors for the logarithm of the virus load. Data at the limit of detection (i.e. left-censored data) were handled as described previously [39]. The limit of detection for the virus load was 2.07 EID50 (EID50 = median embryo infectious dose). For the mechanistic model, we set the initial number of uninfected target cells to 2.5 × 10⁷ as done previously [31,40].
(d). Defining fitness
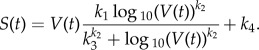
The fitness of a pathogen is largely determined by its ability to transmit from host to host. There are several plausible ways one can map within-host dynamics to some measure of transmission fitness [31,41–48]. Given that our data provides information on viral load, we focus on this quantity and define a measure of fitness that provides a mapping between viral load and the potential for transmission. The first important component is to estimate the total amount of virus shed by an infected host. For our study, the within-host infection data provide cloacal virus concentration. While no information is available on the total viral shedding in these experiments, elsewhere we have shown that the relationship between virus load and nasal shedding in human influenza A infections can be described by a sigmoid function connecting the logarithm of the virus load to nasal discharge [42], given by the expression
 |
2.1 |
A similar sigmoid relation is plausible for avian hosts. The parameters ki define the shape of the sigmoidal function. For our numerical analysis below, we set k1 = 6, k2 = 5, k3 = 2.5 and k4 = 1.5, which are values close to those previously determined by fit of this sigmoid curve to shedding data for humans [42]. To quantify fitness, a second component is important, namely the infection probability of a contact host for a given amount of virus exposure. The ability to infect new hosts is probably a better measure of transmission fitness than the amount of shedding alone. A simple relationship for the probability of infection as a function of pathogen dose is given by q(t) = 1 − e−wS(t), where w is a constant describing the infectiousness of a specific pathogen [43,49–51]. Such a relationship seems to hold for influenza, as suggested by a recent dose-response analysis for human influenza [51] and evidence from avian hosts [52]. Using this expression provides a measure of fitness, given by  , where D denotes the duration of infectiousness and is defined as the time from the start of the infection until the end, which we defined as the time free virus levels drop below a threshold (assumed to be one virion for our numerical simulations below). Based on [51], we set w = 10−2.
(e). Model implementation
All analyses were carried out in the R programming environment [53]. The code is available from the corresponding author upon request.
3. Results
(a). Quantifying temperature-dependent environmental persistence
The environmental component of our data consists of the rate of virus decay for varying temperatures. Visual inspection showed a simple exponential relationship between temperature and virus decay rate. To quantify this relationship for each strain, we parametrized virus durability as a function of temperature, c(T) = αeγT (see Material and methods). Figure 1a,b shows the data and best-fit exponential curves assuming normally distributed errors. While on a linear scale, the fits appear in good agreement with the data (panel (a)), plotted on a logarithmic scale, the fit looks poor for low temperatures (panel (b)). This is not surprising, as data points with higher values have higher absolute error and the discrepancy between model and data for those values influences the best fit more compared with lower temperature values. We also carried out a fit assuming lognormally distributed errors. Figure 1c,d shows the best-fit exponential curves for this scenario. With this approach, the fits look better when viewed on a log-scale (panel (d)). However, on a linear scale most of the high-temperature values are poorly fitted (panel (c)). We are not aware of a compelling a priori reason why one assumption with regards to error structure is biologically more justified. Hence, we carried out the following analyses for both error assumptions. Table 1 lists estimated values for α and γ for each strain for both fitting approaches.
Figure 1.

Virus decay rate for different influenza strains as function of temperature. Symbols show data, and lines show best fit. Panels (a,b) show fits plotted with linear and logarithmic y-axes of the exponential decay equation to the data assuming normally distributed errors. Panels (c,d) shows fits assuming lognormally distributed errors. Among the seven virus strains, five were isolated from dabbling ducks and two from surface lake water (marked with an asterisk (*)). See Material and methods for more details. (Online version in colour.)
Table 1.
Best-fit values for the decay function parameters under the normal and lognormal error assumptions.
| normal errors |
lognormal errors |
|||
|---|---|---|---|---|
| strain | α | γ | α | γ |
| H3N8 | 4.37 × 10⁻³ | 1.18 × 10⁻¹ | 4.37 × 10⁻³ | 1.18 × 10⁻¹ |
| H3N8* | 5.23 × 10⁻³ | 1.14 × 10⁻¹ | 5.23 × 10⁻³ | 1.14 × 10⁻¹ |
| H4N6* | 4.02 × 10⁻³ | 1.21 × 10⁻¹ | 4.02 × 10⁻³ | 1.21 × 10⁻¹ |
| H4N8 | 3.06 × 10⁻³ | 1.31 × 10⁻¹ | 3.06 × 10⁻³ | 1.31 × 10⁻¹ |
| H6N1 | 3.15 × 10⁻³ | 1.32 × 10⁻¹ | 3.15 × 10⁻³ | 1.32 × 10⁻¹ |
| H6N2 | 4.68 × 10⁻³ | 1.20 × 10⁻¹ | 4.68 × 10⁻³ | 1.20 × 10⁻¹ |
| H6N8 | 2.93 × 10⁻³ | 1.42 × 10⁻¹ | 2.93 × 10⁻³ | 1.42 × 10⁻¹ |
(b). Environmental persistence at high temperatures does not affect within-host fitness
As figure 1 and table 1 show, strains differ in their ability to persist at low and high temperatures. A strain with relatively poor persistence at high temperatures could be assumed [31] to fare poorly during infection within a host, where internal temperatures can be high (e.g. 40°C inside a duck [54,55]). As we have viral load data following infections in ducks for each strain, we can directly test the hypothesis that increased high-temperature decay rate affects virus load and therefore within-host fitness. We determined total virus load (area under the curve) by fitting both the mechanistic model and the phenomenological model to virus load data. Best-fit curves for the two models for each strain and duck are shown in figure 2.
Figure 2.

Best fits of the two within-host models to the virus load data for each infected duck. (For one strain data for only four animals is available.) Solid and dashed lines are best fits to the ordinary differential equation (ODE) model and phenomenological model, respectively. Note that the two alternative models produce results for most hosts that are almost indistinguishable. (Online version in colour.)
Using the best-fit viral load curves, we can compute the fitness measure described in the Material and methods. This allows us to test the hypothesis that higher virus decay at within-host temperatures (cw = c(T = 40) = αeγ40) leads to lower virus fitness. Figure 3 shows this not to be the case. While a slight negative correlation between reduced persistence (i.e. higher decay rate) and reduced shedding was notable, the confidence intervals for the regression line include a line with zero slope, i.e. no correlation. In addition, there is substantial variability in fitness for any given strain, which would also make any conclusion about a correlation across strains suspicious. We therefore conclude that the assumption in our previous study [31], namely that faster virus decay at a high within-host temperature correlates with lower within-host fitness, does not seem hold—at least for the dataset and fitness measure we investigate here.
Figure 3.

Fitness as a function of within-host virus decay rate, cw, at a temperature of 40°C. Panel (a) shows fitness determined using the non-mechanistic within-host model and decay rate determined using a normal error assumption. Panel (b) uses the same within-host model as (a) and a lognormal error assumption for the decay rate fits. Panels (c,d) are as (a,b) only the within-host fitness being determined using the mechanistic ODE model. Colours and symbols for the different virus strains are as shown in the previous figures. (Online version in colour.)
(c). No multi-scale trade-off between direct transmission fitness and environmental persistence
While §3b showed that the decay rate at within-host temperature does not affect within-host fitness, it is still plausible that there are general trade-offs between the virus persistence phenotype and other phenotypes that affect within-host fitness. For instance, viruses that persist well at low temperatures may pay a fitness cost that impacts another trait (e.g. lower replication rate at high within-host temperatures). If such a phenomenon were to occur, we would expect a trade-off between within-host fitness and environmental persistence, i.e. clearance rates at low temperatures. Figure 4 shows that such a trade-off is not present in our dataset. If anything, there is a slight positive correlation between increased environmental decay rate and increased within host fitness. However, again all results include the no-correlation, zero-slope line within their confidence intervals. Therefore, these results suggest that there is no evidence in these data for a trade-off between environmental persistence and within-host fitness. The two scales do not seem to be linked for this phenotype.
Figure 4.

Fitness as a function of environmental virus decay rate, ce, at a temperature of 5°C. Everything as explained in figure 3 caption. (Online version in colour.)
(d). Avian influenza shows a single-scale temperature-dependent persistence trade-off
We previously reported a trade-off for the temperature-dependent persistence phenotype on the environmental scale. Specifically, we found for a panel of 12 different influenza strains a trade-off between low α (good persistence at low temperature) and low γ (insensitivity to high temperature). As figure 5 shows, analysis of this new dataset confirms this trade-off. As previously found, there is a negative linear correlation for both log(α) versus log(γ) and the relative ranks of α and γ. The trade-off exists independent of the assumption about the error structure made when fitting the data. The combination of results in figure 5 and those previously reported in [31] suggests strongly that there is indeed a trade-off for virus decay at different temperatures, with some strains optimizing persistence at low temperatures, while others fare relatively better at high temperatures.
Figure 5.

Correlation between low- (α) and high- (γ) temperature persistence. Panels (a,c) show correlation between absolute values, (b,d) between ranks of the parameters. Panels (a,b) show results for fits assuming normally distributed errors, panels (c,d) assume lognormally distributed errors. Also shown are linear regression lines with 95% confidence intervals. (Online version in colour.)
4. Discussion
Improving our understanding of the ecology and evolution of influenza viruses specifically, and pathogens in general, remains a high priority to ensure animal and human health. The full replication and transmission cycle of most pathogens consists of many distinct processes, and it should be expected that fitness trade-offs between those different aspects exist. This has been an intense area of investigation in recent years, mainly with the help of theoretical models. Here, taking advantage of a unique dataset, we analysed the potential of trade-offs for the persistence phenotype of avian influenza A virus. Perhaps surprisingly, we found no convincing evidence for a trade-off between environmental and within-host scales for this phenotype.
Several potential explanations could account for this finding. One reason for the absence of differences in within-host fitness between strains might be the fact that the viruses were genetically too similar, which is especially true given that the five strains were isolated from the same location [34]. While the strains showed differences in decay rates despite their genetic similarity, the within-host viral kinetics were similar between strains. In fact, variation among hosts for a given strain was the dominant source of fitness differences. It might be of interest to obtain within-host shedding data for a broader and more diverse array of virus strains isolated from different aquatic bird species. This might provide some indication as to the host adaptations and restrictions for specific viruses.
A related reason might be that we simply do not have enough data. It is conceivable that additional data would narrow the confidence intervals to a level where statistical significance is achieved. Even then, given that the slope we found in all best-fit estimates is rather close to zero, such statistical significance might not be of much practical relevance.
Another possible explanation for the lack of a robust correlation is that the trade-off between the persistence phenotype is not with fitness as defined by our fitness measure, but some other aspect of within-host infection dynamics. One additional quantity we investigated was the duration of the infection. We found no correlation between infection duration and decay rates, independent of error assumption for the decay rate estimates or the choice of within-host model. Other measures, such as strength of immune response and disease severity would be interesting to explore in the future, but data for those were not available for this study.
Lastly, what we consider the most likely explanation is that there is simply no cross-scale interaction for the temperature-dependent persistence phenotype. Natural decay rate is probably not an important determinant of the within-host infection process. It seems that mechanisms other than virus decay rate dominate the within-host dynamics and therefore dominate any potential effect of a higher within-host virus decay rate. Other aspects, such as immune evasion ability, replication speed, ability of virus to bind to and be released from cells [41], and other features are probably more important drivers of within-host fitness. In contrast to a previous elegant study for phages [30], we did not see a trade-off between persistence and any of these probably important within-host phenotypes—at least not detectable through our fitness measure.
While no across-scale trade-off was detectable, we confirmed our previous finding of a constraint at the environmental scale, with some strains favouring persistence in water at low temperatures while others fare comparatively better at higher temperatures [31]. This suggests that different temperature-dependent environmental persistence strategies might facilitate viral coexistence in distinct ecological niches. Such trade-offs within a specific phenotype have been shown previously for different systems and phenotypes (see [56] for some pertinent work). We are currently unaware of any mechanisms that could explain this observed trade-off. Figuring out this mechanism, and understanding if it applies to human influenza strains and other pathogens seems a worthwhile venue for future investigation.
To summarize, we found no evidence for a constraint in the virus persistence phenotype at the within- and between-host scales. This trait, therefore, may evolve independently across each level of organization. We did find evidence for a trade-off on a single—the environmental—scale. We conclude that to fully understand the transmission and evolutionary dynamics of influenza A viruses, it is important to integrate data and models at both the infection dynamics and the persistence of the virus in the environment, within a combined ecological and within-host framework.
Acknowledgements
We thank the reviewers for useful and constructive feedback, which helped to improve this article.
Funding statement
P.R. was supported by the James S. McDonnell Foundation, the National Science Foundation (DEB-0917853) and the RAPIDD programme of the Science and Technology Directorate, Department of Homeland Security and the Fogarty International Center, National Institutes of Health. The opinions expressed herein are those of the author(s) and do not necessarily reflect the views of any of the funding agencies.
References
- 1.Nicholson KG, Wood JM, Zambon M. 2003. Influenza. The Lancet 362, 1733–1745. ( 10.1016/S0140-6736(03)14854-4) [DOI] [PMC free article] [PubMed] [Google Scholar]
- 2.Webster RG, Bean WJ, Gorman OT, Chambers TM, Kawaoka Y. 1992. Evolution and ecology of influenza A viruses. Microbiol. Rev. 56, 152–179. [DOI] [PMC free article] [PubMed] [Google Scholar]
- 3.Webster RG, Yakhno M, Hinshaw VS, Bean WJ, Murti KG. 1978. Intestinal influenza: replication and characterization of influenza viruses in ducks. Virology 84, 268–278. ( 10.1016/0042-6822(78)90247-7) [DOI] [PMC free article] [PubMed] [Google Scholar]
- 4.Uyeki TM, Cox NJ. 2013. Global concerns regarding novel influenza A (H7N9) virus infections. N Engl. J. Med. 368, 1862–1864. ( 10.1056/NEJMp1304661) [DOI] [PMC free article] [PubMed] [Google Scholar]
- 5.Watanabe Y, Ibrahim MS, Suzuki Y, Ikuta K. 2012. The changing nature of avian influenza A virus (H5N1). Trends Microbiol. 20, 11–20. ( 10.1016/j.tim.2011.10.003) [DOI] [PubMed] [Google Scholar]
- 6.Perdue ML, Swayne DE. 2005. Public health risk from avian influenza viruses. Avian Dis. 49, 317–327. ( 10.1637/7390-060305R.1) [DOI] [PubMed] [Google Scholar]
- 7.Brankston G, Gitterman L, Hirji Z, Lemieux C, Gardam M. 2007. Transmission of influenza A in human beings. Lancet Infect. Dis. 7, 257–265. ( 10.1016/S1473-3099(07)70029-4) [DOI] [PubMed] [Google Scholar]
- 8.Lakdawala SS, Subbarao K. 2012. The ongoing battle against influenza: the challenge of flu transmission. Nat. Med. 18, 1468–1470. ( 10.1038/nm.2953) [DOI] [PubMed] [Google Scholar]
- 9.Weber TP, Stilianakis NI. 2008. Inactivation of influenza A viruses in the environment and modes of transmission: a critical review. J. Infect. 57, 361–373. ( 10.1016/j.jinf.2008.08.013) [DOI] [PMC free article] [PubMed] [Google Scholar]
- 10.Brown JD, Goekjian G, Poulson R, Valeika S, Stallknecht DE. 2009. Avian influenza virus in water: infectivity is dependent on pH, salinity and temperature. Vet. Microbiol. 136, 20–26. ( 10.1016/j.vetmic.2008.10.027) [DOI] [PubMed] [Google Scholar]
- 11.Brown JD, Swayne DE, Cooper RJ, Burns RE, Stallknecht DE. 2007. Persistence of H5 and H7 avian influenza viruses in water. Avian Dis. 51(Suppl. 1), 285–289. ( 10.1637/7636-042806R.1) [DOI] [PubMed] [Google Scholar]
- 12.Keeler SP, Lebarbenchon C, Stallknecht DE. 2013. Strain-related variation in the persistence of influenza A virus in three types of water: distilled water, filtered surface water, and intact surface water. Virol. J. 10, 13 ( 10.1186/1743-422X-10-13) [DOI] [PMC free article] [PubMed] [Google Scholar]
- 13.Stallknecht DE, Shane SM, Kearney MT, Zwank PJ. 1990. Persistence of avian influenza viruses in water. Avian Dis. 34, 406–411. ( 10.2307/1591428) [DOI] [PubMed] [Google Scholar]
- 14.Breban R, Drake JM, Stallknecht DE, Rohani P. 2009. The role of environmental transmission in recurrent avian influenza epidemics. PLoS Comput. Biol. 5, e1000346 ( 10.1371/journal.pcbi.1000346) [DOI] [PMC free article] [PubMed] [Google Scholar]
- 15.Brown VL, Drake JM, Barton HD, Stallknecht DE, Brown JD, Rohani P. 2014. Neutrality, cross-immunity and subtype dominance in avian influenza viruses. PLoS ONE 9, e88817 ( 10.1371/journal.pone.0088817) [DOI] [PMC free article] [PubMed] [Google Scholar]
- 16.Farnsworth ML, Miller RS, Pedersen K, Lutman MW, Swafford SR, Riggs PD, Webb CT. 2012. Environmental and demographic determinants of avian influenza viruses in waterfowl across the contiguous United States. PLoS ONE 7, e32729 ( 10.1371/journal.pone.0032729) [DOI] [PMC free article] [PubMed] [Google Scholar]
- 17.Roche B, Lebarbenchon C, Gauthier-Clerc M, Chang C-M, Thomas F, Renaud F, van der Werf S, Gugan J-F. 2009. Water-borne transmission drives avian influenza dynamics in wild birds: the case of the 2005–2006 epidemics in the Camargue area. Infect. Genet. Evol. 9, 800–805. ( 10.1016/j.meegid.2009.04.009) [DOI] [PubMed] [Google Scholar]
- 18.Rohani P, Breban R, Stallknecht DE, Drake JM. 2009. Environmental transmission of low pathogenicity avian influenza viruses and its implications for pathogen invasion. Proc. Natl Acad. Sci. USA 106, 10 365–10 369. ( 10.1073/pnas.0809026106) [DOI] [PMC free article] [PubMed] [Google Scholar]
- 19.Brown VL, Drake JM, Stallknecht DE, Brown JD, Pedersen K, Rohani P. 2013. Dissecting a wildlife disease hotspot: the impact of multiple host species, environmental transmission and seasonality in migration, breeding and mortality. J. R. Soc. Interface 10, 20120804 ( 10.1098/rsif.2012.0804) [DOI] [PMC free article] [PubMed] [Google Scholar]
- 20.Lebarbenchon C, Yang M, Keeler SP, Ramakrishnan MA, Brown JD, Stallknecht DE, Sreevatsan S. 2001. Viral replication, persistence in water and genetic characterization of two influenza A viruses isolated from surface lake water. PLoS ONE 6, e26566 ( 10.1371/journal.pone.0026566) [DOI] [PMC free article] [PubMed] [Google Scholar]
- 21.Stallknecht DE, Kearney MT, Shane SM, Zwank PJ. 1990. Effects of pH, temperature, and salinity on persistence of avian influenza viruses in water. Avian Dis. 34, 412–418. ( 10.2307/1591429) [DOI] [PubMed] [Google Scholar]
- 22.Bonhoeffer S, Lenski RE, Ebert D. 1996. The curse of the pharaoh: the evolution of virulence in pathogens with long living propagules. Proc. R. Soc. Lond. B 263, 715–721. ( 10.1098/rspb.1996.0107) [DOI] [PubMed] [Google Scholar]
- 23.Caraco T, Wang I-N. 2008. Free-living pathogens: life-history constraints and strain competition. J. Theor. Biol. 250, 569–579. ( 10.1016/j.jtbi.2007.10.029) [DOI] [PMC free article] [PubMed] [Google Scholar]
- 24.Day T. 2002. Virulence evolution via host exploitation and toxin production in spore producing pathogens. Ecol. Lett. 5, 471–476. ( 10.1046/j.1461-0248.2002.00342.x) [DOI] [Google Scholar]
- 25.Gandon S. 1998. The curse of the pharaoh hypothesis. Proc. R. Soc. Lond. B 265, 1545–1552. ( 10.1098/rspb.1998.0470) [DOI] [PMC free article] [PubMed] [Google Scholar]
- 26.Handel A, Bennett MR. 2008. Surviving the bottleneck: transmission mutants and the evolution of microbial populations. Genetics 180, 2193–2200. ( 10.1534/genetics.108.093013) [DOI] [PMC free article] [PubMed] [Google Scholar]
- 27.Alizon S, Luciani F, Regoes RR. 2011. Epidemiological and clinical consequences of within-host evolution. Trends Microbiol. 19, 24–32. ( 10.1016/j.tim.2010.09.005) [DOI] [PubMed] [Google Scholar]
- 28.King AA, Shrestha S, Harvill ET, Bjørnstad ON. 2009. Evolution of acute infections and the invasion persistence tradeoff. Am. Nat. 173, 446–455. ( 10.1086/597217) [DOI] [PMC free article] [PubMed] [Google Scholar]
- 29.Mideo N, Alizon S, Day T. 2008. Linking within- and between-host dynamics in the evolutionary epidemiology of infectious diseases. Trends Ecol. Evol. 23, 511–517. ( 10.1016/j.tree.2008.05.009) [DOI] [PubMed] [Google Scholar]
- 30.De Paepe M, Taddei F. 2006. Viruses’ life history: towards a mechanistic basis of a trade-off between survival and reproduction among phages. PLoS Biol. 4, e193 ( 10.1371/journal.pbio.0040193) [DOI] [PMC free article] [PubMed] [Google Scholar]
- 31.Handel A, Brown J, Stallknecht D, Rohani P. 2013. A multi-scale analysis of influenza A virus fitness trade-offs due to temperature-dependent virus persistence. PLoS Comput. Biol. 9, e1002989 ( 10.1371/journal.pcbi.1002989) [DOI] [PMC free article] [PubMed] [Google Scholar]
- 32.Stallknecht DE, Goekjian VH, Wilcox BR, Poulson RL, Brown JD. 2010. Avian influenza virus in aquatic habitats: what do we need to learn? Avian Dis. 54(Suppl. 1), 461–465. ( 10.1637/8760-033109-Reg.1) [DOI] [PubMed] [Google Scholar]
- 33.Wilcox BR, et al. 2011. Influenza-A viruses in ducks in northwestern Minnesota: fine scale spatial and temporal variation in prevalence and subtype diversity. PLoS ONE 6, e24010 ( 10.1371/journal.pone.0024010) [DOI] [PMC free article] [PubMed] [Google Scholar]
- 34.Lebarbenchon C, Sreevatsan S, Lefvre T, Yang M, Ramakrishnan MA, Brown JD, Stallknecht DE. 2012. Reassortant influenza A viruses in wild duck populations: effects on viral shedding and persistence in water. Proc. R. Soc. B 279, 3967–3975. ( 10.1098/rspb.2012.1271) [DOI] [PMC free article] [PubMed] [Google Scholar]
- 35.Beauchemin CAA, Handel A. 2011. A review of mathematical models of influenza A infections within a host or cell culture: lessons learned and challenges ahead. BMC Public Health 11(Suppl. 1), S7 ( 10.1186/1471-2458-11-S1-S7) [DOI] [PMC free article] [PubMed] [Google Scholar]
- 36.Smith AM, Perelson AS. 2011. Influenza A virus infection kinetics: quantitative data and models. Wiley Interdiscip. Rev. Syst. Biol. Med. 3, 429–445. ( 10.1002/wsbm.129) [DOI] [PMC free article] [PubMed] [Google Scholar]
- 37.Holder BP, Beauchemin CAA. 2011. Exploring the effect of biological delays in kinetic models of influenza within a host or cell culture. BMC Public Health 11(Suppl. 1), S10 ( 10.1186/1471-2458-11-S1-S10) [DOI] [PMC free article] [PubMed] [Google Scholar]
- 38.Holder BP, Simon P, Liao LE, Abed Y, Bouhy X, Beauchemin CAA, Boivin G. 2011. Assessing the in vitro fitness of an oseltamivir-resistant seasonal A/H1N1 influenza strain using a mathematical model. PLoS ONE 6, e14767 ( 10.1371/journal.pone.0014767) [DOI] [PMC free article] [PubMed] [Google Scholar]
- 39.Handel A, Longini IM, Jr, Antia R. 2010. Towards a quantitative understanding of the within-host dynamics of influenza A infections. J. R. Soc. Interface 7, 35–47. ( 10.1098/rsif.2009.0067) [DOI] [PMC free article] [PubMed] [Google Scholar]
- 40.Uni Z, Ganot S, Sklan D. 1998. Posthatch development of mucosal function in the broiler small intestine. Poult. Sci. 77, 75–82. ( 10.1093/ps/77.1.75) [DOI] [PubMed] [Google Scholar]
- 41.Handel A, Akin V, Pilyugin SS, Zarnitsyna V, Antia R. 2014. How sticky should a virus be? The impact of virus binding and release on transmission fitness using influenza as an example. J. R. Soc. Interface 11, 20131083 ( 10.1098/rsif.2013.1083) [DOI] [PMC free article] [PubMed] [Google Scholar]
- 42.Handel A, Longini IM, Antia R. 2007. Neuraminidase inhibitor resistance in influenza: assessing the danger of its generation and spread. PLoS Comput. Biol. 3, e240 ( 10.1371/journal.pcbi.0030240) [DOI] [PMC free article] [PubMed] [Google Scholar]
- 43.Lange A, Ferguson NM. 2009. Antigenic diversity, transmission mechanisms, and the evolution of pathogens. PLoS Comput. Biol. 5, e1000536 ( 10.1371/journal.pcbi.1000536) [DOI] [PMC free article] [PubMed] [Google Scholar]
- 44.Luciani F, Sisson SA, Jiang H, Francis AR, Tanaka MM. 2009. The epidemiological fitness cost of drug resistance in mycobacterium tuberculosis. Proc. Natl Acad. Sci. USA 106, 14 711–14 715. ( 10.1073/pnas.0902437106) [DOI] [PMC free article] [PubMed] [Google Scholar]
- 45.Pepin KM, Volkov I, Banavar JR, Wilke CO, Grenfell BT. 2010. Phenotypic differences in viral immune escape explained by linking within-host dynamics to host-population immunity. J. Theor. Biol. 265, 501–510. ( 10.1016/j.jtbi.2010.05.036) [DOI] [PMC free article] [PubMed] [Google Scholar]
- 46.Reperant LA, Kuiken T, Grenfell BT, Osterhaus ADME, Dobson AP. 2012. Linking influenza virus tissue tropism to population-level reproductive fitness. PLoS ONE 7, e43115 ( 10.1371/journal.pone.0043115) [DOI] [PMC free article] [PubMed] [Google Scholar]
- 47.Spicknall IH, Koopman JS, Nicas M, Pujol JM, Li S, Eisenberg JNS. 2010. Informing optimal environmental influenza interventions: how the host, agent, and environment alter dominant routes of transmission. PLoS Comput. Biol. 6, e1000969 ( 10.1371/journal.pcbi.1000969) [DOI] [PMC free article] [PubMed] [Google Scholar]
- 48.Steinmeyer SH, Wilke CO, Pepin KM. 2010. Methods of modelling viral disease dynamics across the within- and between-host scales: the impact of virus dose on host population immunity. Phil. Trans. R. Soc. B 365, 1931–1941. ( 10.1098/rstb.2010.0065) [DOI] [PMC free article] [PubMed] [Google Scholar]
- 49.Haas CN. 1983. Estimation of risk due to low doses of microorganisms: a comparison of alternative methodologies. Am. J. Epidemiol. 118, 573–582. [DOI] [PubMed] [Google Scholar]
- 50.Teunis PFM, Havelaar AH. 2000. The beta Poisson dose-response model is not a single-hit model. Risk Anal. 20, 513–520. ( 10.1111/0272-4332.204048) [DOI] [PubMed] [Google Scholar]
- 51.Teunis PFM, Brienen N, Kretzschmar MEE. 2010. High infectivity and pathogenicity of influenza A virus via aerosol and droplet transmission. Epidemics 2, 215–222. ( 10.1016/j.epidem.2010.10.001) [DOI] [PubMed] [Google Scholar]
- 52.Spekreijse D, Bouma A, Stegeman JA, Koch G, de Jong MCM. 2011. The effect of inoculation dose of a highly pathogenic avian influenza virus strain H5N1 on the infectiousness of chickens. Vet. Microbiol. 147, 59–66. ( 10.1016/j.vetmic.2010.06.012) [DOI] [PubMed] [Google Scholar]
- 53.R Core Team 2013. R: a language and environment for statistical computing. Vienna, Austria: R Foundation for Statistical Computing. [Google Scholar]
- 54.Marais M, Gugushe N, Maloney SK, Gray DA. 2011. Body temperature responses of pekin ducks (Anas platyrhynchos domesticus) exposed to different pathogens. Poult. Sci. 90, 1234–1238. ( 10.3382/ps.2011-01389) [DOI] [PubMed] [Google Scholar]
- 55.Scull MA, Gillim-Ross L, Santos C, Roberts KL, Bordonali E, Subbarao K, Barclay WS, Pickles RJ. 2009. Avian influenza virus glycoproteins restrict virus replication and spread through human airway epithelium at temperatures of the proximal airways. PLoS Pathog. 5, e1000424 ( 10.1371/journal.ppat.1000424) [DOI] [PMC free article] [PubMed] [Google Scholar]
- 56.Mideo N, Nelson WA, Reece SE, Bell AS, Read AF, Day T. 2011. Bridging scales in the evolution of infectious disease life histories: application. Evolution 65, 3298–3310. ( 10.1111/j.1558-5646.2011.01382.x) [DOI] [PMC free article] [PubMed] [Google Scholar]