

Abstract
How natural climate cycles, such as past glacial/interglacial patterns, have shaped species distributions at the high-latitude regions of the Southern Hemisphere is still largely unclear. Here, we show how the post-glacial warming following the Last Glacial Maximum (ca 18 000 years ago), allowed the (re)colonization of the fragmented sub-Antarctic habitat by an upper-level marine predator, the king penguin Aptenodytes patagonicus. Using restriction site-associated DNA sequencing and standard mitochondrial data, we tested the behaviour of subsets of anonymous nuclear loci in inferring past demography through coalescent-based and allele frequency spectrum analyses. Our results show that the king penguin population breeding on Crozet archipelago steeply increased in size, closely following the Holocene warming recorded in the Epica Dome C ice core. The following population growth can be explained by a threshold model in which the ecological requirements of this species (year-round ice-free habitat for breeding and access to a major source of food such as the Antarctic Polar Front) were met on Crozet soon after the Pleistocene/Holocene climatic transition.
Keywords: Antarctica, coalescence, restriction site-associated DNA sequencing, Last Glacial Maximum, seabirds
1. Introduction
Environmental variation through time is one of the drivers of the evolutionary process and a key mechanism in shaping biodiversity. Both short- and long-term climate shifts dramatically affect the geographical distribution of species/populations according to their own dispersal abilities and ecological requirements [1,2]. Understanding how past fluctuations impacted the demography of key species in different ecosystems is essential for predicting the response of communities to ongoing and future change, including anthropogenic-induced climate forcing [3,4]. Using genomic data, we investigate the impact of the last glaciation on the past demography of a king penguin (Aptenodytes patagonicus) colony from the most important breeding areas for this species (the Crozet archipelago).
While the biological impacts of recent Quaternary glaciation events on the largely terrestrial Northern Hemisphere have been relatively well documented [3], the oceanic Southern Hemisphere, particularly at higher latitudes, remains poorly described [5] owing to its relative inaccessibility. Recent hypotheses suggested that winter sea ice during the Last Glacial Maximum (LGM) could have extended as far north as South Georgia, Crozet, Kerguelen and Macquarie Islands, while Falkland, Gough and New Zealand Islands may have acted as ice-free refugia (figure 1 [6]). As southern ocean conditions fluctuated between glacial and interglacial periods, local species had to contend with changes in both habitat and resource availability. In particular, the distribution of most seabirds is primarily constrained by the spatial location of suitable breeding sites on land and foraging areas in the ocean [7]. For a population to thrive, productive foraging areas must exist within reach of a suitable breeding site. Climate oscillations affect both these key ecological constraints. On one side, these fluctuations cause glaciers to expand and retreat, thus covering or exposing potential breeding sites, on the other side, they affect the location and intensity of oceanic currents and fronts that in turn determine marine primary production. According to Thatje et al. [8] the large-scale Southern Ocean productivity may have been nearly shut down during the LGM, at least at the latitude where it is currently present. Highly dispersive species negatively affected by glacial conditions could have moved northwards to more suitable ice-free breeding habitats during the LGM, while low-dispersive ones may have been strongly reduced in population size or may even have gone extinct [9]. Therefore, post-glacial warming and the subsequent retreat of glaciers and sea ice, probably favoured the re-colonization of Antarctic and sub-Antarctic territories by dispersive species dependent on ice-free breeding sites [5,6,10].
Figure 1.

Winter sea ice extent today (pale blue solid line) and during the Last Glacial Maximum (LGM; green dashed line), current position of the Antarctic Polar Front (black dashed line), putative refugia during the LGM (solid green line), and current location of king penguin populations (red solid line) and of the colony of ‘La Baie du Marin’ on Possession Island, Crozet archipelago, monitored in this study (red text); adapted from Fraser et al. [5].
Although some marine mammals or seabirds from Antarctic and sub-Antarctic areas have shown dispersal responses to long-term climatic variations (e.g. southern elephant seal Mirounga leonina [11] or Adélie penguin Pygoscelis Adeliae [12]), the future rate of environmental changes induced by a warming climate may outpace the ability of most upper-trophic-level predators to adjust. In this context, projections simulated according to future global warming scenarios given by the latest Intergovernmental Panel on Climate Change Fourth Assessment Report [13] reveal that the genus Aptenodytes may be under serious threat of extinction before the end of the twenty-first century [14,15]. Indeed, an abrupt increase in sea surface temperature (SST) has been demonstrated to be detrimental to king penguin survival and reproductive rates in populations breeding in the Crozet archipelago in the southern Indian Ocean [14,16]. This is caused by the longer distance the individuals have to swim to get to their main foraging ground (the Antarctic Polar Front during the summer season) whose latitudinal location is influenced by SST (the higher the SST, the higher the latitude [17]). However, when SST was lower, and food resources probably closer, the Crozet Islands were probably not suitable for the king penguin to complete their breeding cycle as this species needs year-round ice-free grounds for reproduction.
Although ca half of the global king penguin population is resident in the Crozet basin, and this top predator represents one of the largest components of the sub-Antarctic marine ecosystem as measured by biomass and energy flux [18], the long-term response of this species to the warming period following the LGM remains entirely unknown. Here, we use a genomic-based demographic reconstruction to test whether the king penguin population from the Crozet archipelago (‘La Baie du Marin’ colony, Possession Island) was strongly affected by the colder conditions characterizing the LGM. We tested the applicability of genome-wide data produced by restriction site-associated DNA (RAD) sequencing [19,20] within a multi-locus coalescent-based framework (Extended Bayesian Skyline Plot, EBSP [21]) that aims to average the stochasticity of mutation and drift across tens of genomic loci and to overcome the idiosyncrasy of the results obtained from one or a few molecular markers.
We first demonstrated that genomic regions with different levels of polymorphism consistently show a similar pattern of diversity, and that a consistent demographic signature is recognizable across the entire genome, thus providing evidence that a reduced subset of anonymous genomic loci can be safely employed to estimate past population trends. Historic demography was then inferred by employing a random selection of RAD loci sequenced in multiple individuals and time calibrated according to the mitochondrial substitution rate as estimated in the Adélie penguin Control Region (CR) (in substitutions site−1 Myr−1: median = 0.55, 95% interval = 0.29–0.88 [22]). Our data show that the king penguin population from Crozet was strongly reduced on this potentially ice-covered sub-Antarctic archipelago before the end of the LGM, or king penguins may have been totally absent, but they (re)colonized the island as soon as the ecological conditions required by this species were met during the following Holocene warming.
2. Results
ILLUMINA sequencing of a paired-end RAD library from eight king penguins yielded ca 65 million, 100 bp reads. Front reads only were used in our analyses and are available on GenBank at the Sequence Read Archive (Run Num.: SRR942341). After quality filtering, trimming of the last 5 bp, and barcode sorting, 101 115 anonymous loci (each as a 95 bp nucleotide sequence) with 50× average coverage were aligned in an unreferenced catalogue. GC content of this dataset was estimated as 50.45%. According to our quality criteria, the catalogue was further filtered to 66 172 loci (of which 31 452 were polymorphic) matching all eight individuals without missing data. This dataset was then used in downstream statistical analyses.
First, we tested whether genomic regions with different degrees of polymorphism carried consistent information about the demographic history of the king penguin population from Crozet. Polymorphic RAD loci were sorted into six different classes according to the number of single nucleotide polymorphisms (SNPs) observed (from 1 to 6 SNPs), and separate analyses were performed for each category: 20 458 loci with 1 SNP; 7750 loci with 2 SNPs, 2417 loci with 3 SNPS; 652 loci with 4 SNPs; 154 loci with 5 SNPs; and 21 loci with 6 SNPs. None of the loci with more than 6 SNPs passed our quality criteria. The signature of the past demography in the 1-SNP class was investigated using the allele frequency spectrum (AFS) (figure 2a) in ∂a∂i [23]. A likelihood ratio test strongly supported a 2-epoch sudden demographic expansion model over a constant-size model (χ2 = 8063; p < 0.0001). When scaled by our estimated mutation rate for the 1-SNP class (see below), estimates of the parameters from the best model indicate a demographic expansion from ca 1400 to ca 7000 breeders around 18 500 years ago. The mismatch distribution density was then checked for the loci in the 2- to 6-SNP classes (figure 2b). A unimodal distribution of mismatches, characteristic of a recent population expansion, was typical across loci in all SNP classes, though more evident in those classes with higher number of SNPs. Notably, the number of outlier loci (in this case, loci showing high frequency of mismatch at the highest number of differences) was negligible in all classes, highlighting the consistent mismatch distributions across loci, which is expected in a population that has recently undergone a demographic expansion. The same 2- to 6-SNP classes of loci were then used to reconstruct the demographic function through time by a multi-locus coalescent-based Bayesian approach (EBSP [21]). Highly consistent results were obtained using separate datasets with 2, 3 or 4–6-SNP loci (electronic supplementary material, figure S1a–c). However, loci from 4- to 6-SNP classes were chosen for further analyses because of their higher information content.
Figure 2.
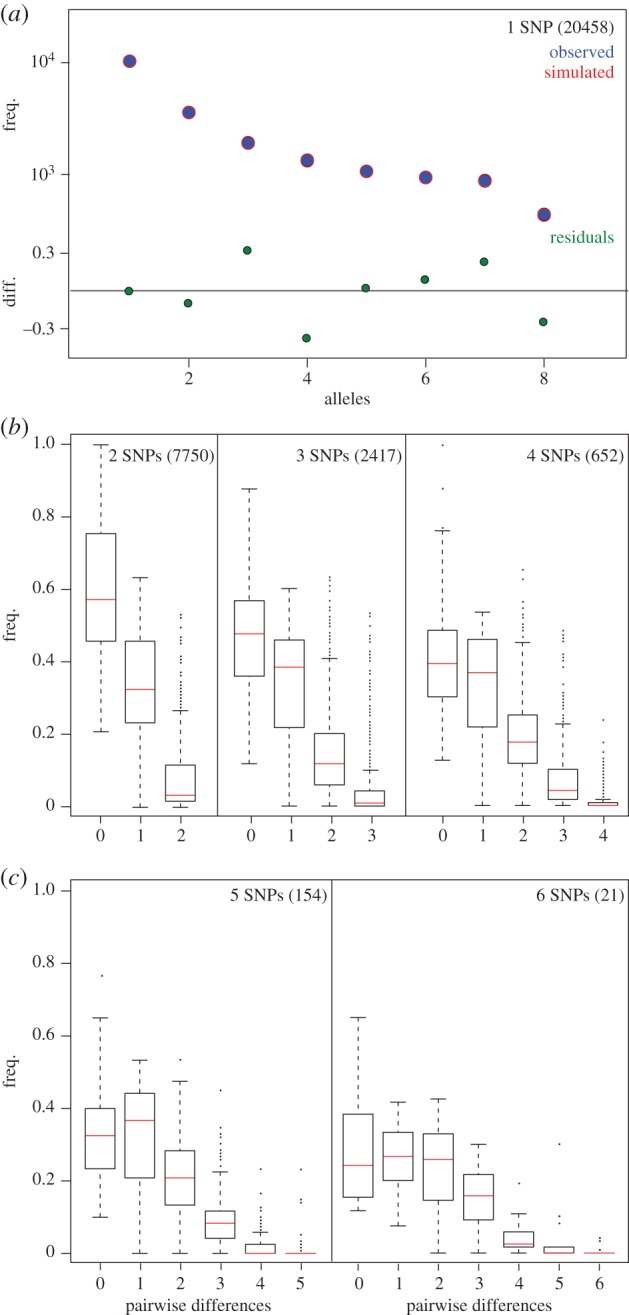
Demographic inference based on the AFS. (a) Minor AFS analysis performed on 1-SNP class loci: observed (blue) and simulated (red) spectra and deviation (green) are given. (b) Mismatch distribution density analysis performed on 2- to 6-SNP class loci: mean values (red) and number of loci in each class (in brackets).
Ten independent datasets including 50 loci selected at random from 4- to 6-SNP classes were compared in order to check the consistency of the results over multiple loci. No significant linkage among the selected loci was detected in any dataset: the minimum p-value in the set of pairwise comparisons analysed in each dataset (0.004–0.006) was about two orders of magnitude higher than the Bonferroni-corrected threshold (0.00004) for a set of 50 loci. The substitution rate for each locus was set as a wide uninformative uniform prior (0.005–0.5 substitutions site−1), without any absolute calibration, and the EBSP reconstructions were thus unscaled. The same pattern of population growth is clearly evident in all runs (electronic supplementary material, figure S1c). Test analyses including subsets of 10, 25, 50 and 100 loci selected at random from the same set of 100 loci were also run. Smaller subsets resulted in broader credibility regions, although the median value of the population size through time was not substantially different (electronic supplementary material, figure S2). All runs showed highly consistent EBSP trends, but the effective sample size of the posterior increased very slowly in chain increments from 50 to 200 million generations, showing a general poor mixing. However, likelihood, substitution model parameters and clock model parameters were adequately sampled in all runs. When analysing 100 loci in the same run, the length of the analysis and the poor mixing of the Markov chain Monte Carlo (MCMC) simulations (meaning that it should run much longer) were the limiting factors making the demographic analysis impractical on our computational resources (see Material and methods).
In order to calibrate our reconstruction, the mitochondrial CR dataset was included in the EBSP analysis together with 50 randomly selected nuclear loci (4- to 6-SNP classes), using the substitution rate (0.55 substitutions site−1 Myr−1) published for the Adélie penguin [22]. When analysed on its own, the mitochondrial locus supported the demographic expansion of the Crozet king penguin population. Sequences of 354 bp fragments of the mitochondrial DNA (mtDNA) CR were produced in 140 samples (number of haplotypes = 112; haplotypes diversity = 0.997; nucleotide diversity = 0.025) and all new haplotypes were uploaded to GenBank (accession no. KF530582–KF530720). Demographic statistics (Tajima's D = −1.75; Ramos-Onsins & Rozas (R2) = 0.039*; Fu Fs = −168.4*; *p < 0.05), unimodal mismatch distribution of pairwise differences (not shown), and the Bayesian Skyride analysis (electronic supplementary material, figure S3), all strongly support the hypothesis of a population expansion, thus providing an independent support to the results obtained from random sets of RAD nuclear loci. The 0.55 substitutions site−1 Myr−1 substitution rate (considering its upper and lower 95% CR boundaries, [22]) was then used to scale the Bayesian Skyride plot to an absolute timescale (electronic supplementary material, figure S3).
Our EBSP reconstruction based on a random set of 50 RAD loci and one mitochondrial fragment indicated that the king penguin population of ‘La Baie du Marin’ had a Ne of ca 2000 individuals during the LGM, and it steeply increased at the onset of the Holocene, around 15 000 years ago. This demographic growth closely matched the trend of temperature anomalies recorded in the Epica Dome C ice core [24], which shows a rapid increase between 18 000 and 10 000 years ago (figure 3). Then, the colony reached an estimated present population size of ca 170 000 individuals. Using the published mtDNA rate as a reference, the average substitution rate of loci in our dataset was estimated at 2.2 × 10⁻⁸ substitutions site−1 yr−1 (2.6 × 10⁻⁷ substitutions site−1 generation−1). To obtain this estimate, we used the substitution rates estimated in BEAST for loci with different numbers of SNPs (mean values of posterior probabilities in substitutions site−1 Myr−1: 0 SNP = 0.007; 1 SNP = 0.028; 2 SNPs = 0.050; 3 SNPs = 0.071; 4 SNPs = 0.092; 5 SNPs = 0.114; 6 SNPs = 0.135). Note that the number of SNPs at each locus is, in the first place, a result of the stochasticity of the mutational and coalescent process. Hence, mutation rates estimated in BEAST for each SNP class should not be regarded as estimates of the actual substitution rates across different genomic fragments, but rather as posterior probabilities conditional to the number of SNPs at each locus. We then estimated the average substitution rate for our RAD dataset as a weighted average accounting for the frequency of each SNP class across the 66 172 loci.
Figure 3.

Past demographic trend of the king penguin colony of ‘La Baie du Marin’ on Possession Island, Crozet archipelago: median value (red) and 95% confidence interval (pale red). Trend of temperature anomalies recorded in the EPICA Dome C ice core (black [25]). The LGM period is given in green.
3. Discussion
(a). Using restriction site-associated DNA sequencing data in a coalescent-based framework
Our analyses empirically supported that RAD sequencing data can be effectively used for inferring past demography in a coalescent-based framework and that a small subset of these data (i.e. 50 loci only) is sufficient to describe the post-glacial history of the king penguin colony breeding on Crozet. This result is particularly important because, though thousands of markers can now be easily and cost-effectively sequenced in any biological system [20], many existing analytical tools for demographic inference are not yet optimized for genome-level data. Recently published methods, like the pairwise sequentially Markovian coalescence [25] or DiCal [26] require phased diploid genomic data over a long fragment of the chromosome that are not readily available for most non-model species. The development of new algorithms to exploit SNP data in coalescent-based frameworks (i.e. ‘SNPs and amplified fragment length polymorphisms phylogenies’ [27]) are paving the way for a full use of genome-scan data in phylogeography and population genetics, although linkage needs to be taken into account for extensive SNP datasets.
We found that EBSP analysis is not really optimized for handling high numbers of loci (very high parametrization) and this may result in slow convergence and poor mixing of the MCMC chains. We estimated that 3–5 billion iterations would be needed to get effective sample size above 200 for all model parameters when analysing our dataset of 50 loci and eight individuals. Nevertheless, our EBSP demographic reconstructions were highly consistent with each other, with those produced by the diffusion approximation of the AFS (figure 2a) and with standard single-locus mtDNA analyses (electronic supplementary material, figure S3). The AFS analysis, based on approximation to the neutral Wright–Fisher diffusion of an allele [23], has been strongly criticized as theoretically unfit to distinguish between competing population histories even if strongly simplified assumptions (panmixia, infinite site mutation model and neutrality) are met in the studied system [28]. In particular, it seems that compensating events in population dynamics are impossible to detect, thus making the analysis of complex histories unreliable. In our test case, the different analytical approaches converged on a quite simple history of sudden population growth making it a likely suitable case for AFS analysis. Both EBSP and AFS analyses, based on independent datasets (1-SNP class versus 4- to 6-SNP classes loci), produced largely similar inferences of the time and trend of the past demography of our king penguin colony. A major difference between results from the two methods was in the estimate of the current effective population size (Ne = 7000 from AFS analysis versus Ne = 170 000 from EBSP). Both estimates are inconsistent with the direct count of breeding birds on ‘La Baie du Marin’ colony, Possession Island (i.e. 32 000 breeding birds [29]). However, it is likely that a certain degree of gene flow exists within the Possession Island, and that ‘La Baie du Marin’ colony is part of a meta-population at the island level. According to the most recent estimate by direct count, the breeding population of Possession Island is ca 150 000 individuals [29]. Therefore, the population size we estimated from genomic data may reflect this larger meta-population, rather than the single colony. A study investigating the level of connectivity and gene flow among the colonies of Possession Island is currently ongoing.
In our test case, the demographic trend inferred from a single mitochondrial locus was consistent with a similar analysis carried out on 50 nuclear loci (figure 3 and electronic supplementary material, figure S3). Nevertheless, analysing a fairly large number of (presumably) unlinked loci should be considered as best practice as it allows to us average the stochasticity of mutation and drift over many independent genealogies, thus avoiding the risk of a biased demographic inference owing to the idiosyncratic history of a single marker. In addition, when a large number of loci are genotyped, many fewer samples are needed to estimate population-level statistics and obtain demographic inferences [30,31].
Thanks to the inclusion of the mitochondrial marker in our genomic analyses, we were also able to propose an average substitution rate for the loci included in our RAD dataset. Our estimated rate is about one order of magnitude faster than previously reckoned in other bird species [32]. However, recent evidence showed that genomic substitution rates can be faster than formerly estimated from pedigree studies [33,34]. Moreover, the RAD sequencing protocol may introduce biases in the genome representation: when using a digestion enzyme like SbfI, whose restriction site is rich in GC, a selection for GC-rich regions occurs. Indeed, the GC content in our dataset was 50.45% that corresponds to the highest estimates for chicken microchromosomes [35]. Hence, our dataset is probably centred on GC-rich regions (e.g. microchromosomes), which are characterized by increased levels of gene density, recombination rate, number of CpG sites, methylation and mutation rate [36]. Excess of hypermutable CpG nucleotides in GC-rich sequences has been identified as one possible explanation of increased mutation rates [37] so that GC-rich microchromosomes can show a 1.2–1.3× faster substitution rate than the average of the genome [38]. This effect probably contributes, at least in part, at explaining the high mutation rate estimated for our dataset. Even if further investigation is clearly necessary, our interpretation sounds like a cautionary tale about the bias in the selection of genomic regions when using sequence-based restriction enzymes.
(b). King penguin population history during the Last Glacial Maximum
Our genomic data from the Crozet king penguin colony contain a consistent signal of demographic expansion at all levels of variability, with very few outliers in the mismatch analysis. Our demographic reconstruction strongly supports a sudden population expansion following the LGM and starting ca 15 000 years ago. Therefore, our results show that even a cold-adapted species, such as the king penguin, was limited by colder glacial conditions, and benefited from post-glacial warming, which offered suitable breeding sites and foraging conditions in the Crozet region.
Like several other top-level predators in the Antarctic and Sub-Antarctic, king penguins depend on marine ecosystems for food and on terrestrial habitats for reproduction. This species needs a combination of two ecological factors that are both influenced by temperature: (i) year-round ice-free breeding grounds, and (ii) access to major feeding grounds (e.g. the Antarctic Polar Front) within swimming distance and compatible with birds’ breeding duties (exchanging the egg with their fasting partner, feeding their chick). The king penguin has the longest breeding cycle of all penguin species, spanning 14–16 months [39]. This implies that the reproductive success depends on both summer and winter conditions. Yet, LGM climate strongly influenced both marine productivity and the availability of suitable breeding grounds from which feeding areas could be exploited. Lower global temperature favoured a northward expansion of both winter and summer sea ice [5,6,40]. In turn, ice-sheet and sea ice extensions profoundly affected the location (shifted northward) and strength of oceanic fronts and circumpolar currents encircling Antarctica [6,40,41], which determine primary productivity in the Southern Ocean [8]. Some polar species tracked favourable ecological niches northwards [5,42,43], and suitable refugia for land-breeding species have been proposed on the Falklands, Gough Island and Southern New Zealand. Genetic evidence showed recent (re)colonizations of the sub-Antarctic islands by several taxa that drifted with the strong eastward flow of the Antarctic Circumpolar Current [6,44]. However, current reconstructions of LGM conditions lack the spatial resolution to unequivocally detect the number and geographical distribution of all glacial refugia [45]. In particular, it is not clear whether ice-free patches existed in the Crozet archipelago during the LGM [7].
EPICA Dome C ice core [24] data show an increase of ca 9°C between 18 000 and 10 000 years ago. In our demographic reconstruction, this interval coincides with a sustained phase of growth for the Crozet king penguin population (figure 3). This growth trajectory is consistent with a threshold model, where a new colony is established as soon as all of the critical ecological requirements are met. We propose that the availability of breeding grounds within feeding-trip distance from foraging areas played the most critical role in the population expansion of Crozet king penguins after the LGM. Even if a major food resource (linked to the presence of the AFP) may have already been available within a king penguin home-range distance from the Crozet islands during the LGM, winter sea ice and possibly land glaciers, did not allow the settlement of a viable king penguin population on the archipelago before the post-LGM warming. As soon as breeding grounds became available, the king penguin could extensively settle on Crozet and exploit the food resource. However, with growing SST temperature owing to the global warming, the AFP can soon be too far from Crozet, thus making the area unsuitable again. Extinction, beginning locally and potentially mitigated by migration events (depending on their ability to follow spatial and temporal changes in food/breeding resource availability, as seen in the Gentoo penguin Pygoscelis papua [46]), is a probable outcome of the ongoing climate warming.
4. Material and methods
(a). Sampling, DNA extraction and quality assessment
Sampling was conducted during the 2010 breeding season in the king penguin colony of ‘La Baie du Marin’ on Possession Island (46°25′ S, 51°45′ E), Crozet Archipelago. Blood (approx. 100 µl) was collected from the brachial vein of chicks hatched in the long-term monitored area ‘ANTAVIA’, transferred to a filter paper (Whatman 113), dried and later frozen at −20°C. Individuals were randomly selected along a 120 m axis at the periphery of the colony, in order to maximize separation distance. A total of 140 individuals were chosen for mtDNA CR analysis, and eight of these were randomly selected for RAD sequencing analysis. Total DNA was extracted from the filter papers using standard methods and controlled for quantity and quality.
(b). Restriction site-associated DNA sequencing
Genomic DNA from eight king penguins was individually barcoded, pooled and genotyped by RAD sequencing [19] in one library sequenced on an ILLUMINA HiSeq2000 at the Norwegian Sequencing Centre, University of Oslo. Raw reads were trimmed, demultiplexed and aligned in an unreferenced catalogue using the Stacks software pipeline [47] running on the server facility on the ABEL cluster, University of Oslo. Further quality filtering using custom bash and python scripts was applied to produce the final dataset used in downstream statistical analyses (detailed protocol in the electronic supplementary material).
(c). Genome-wide demographic analysis and calibration
Genomic RAD fragments (95 bp) were sorted into six different classes according to the number of SNPs observed (from 1 to 6 SNPs) and separate analyses were performed for each category. Minor allele frequency spectra were calculated by functions available in the R package ‘adegenet’ [48] using loci included in the 1-SNP class. The signature of the past demography in this class of polymorphism was investigated using the AFS analysis in ∂a∂i [23]. Using a diffusion approximation of the AFS, this analysis allows demographic inferences to be made from genetic data for testing alternative demographic scenarios in a maximum-likelihood framework. A sudden growth in population size was tested against the null hypothesis of constant population size using the ‘2_epoch’ and the ‘snc’ functions, respectively. The mismatch distribution density (average mismatch distribution of pairwise differences) was then analysed to check for the same demographic pattern in the 2- to 6-SNP classes. Functions included in the R package ‘ape’ [49] and the R standard boxplot function were used to estimate and plot the mismatch distribution density in each SNP class. Random selections of 50–100 loci in the 2- to 6-SNP classes were used to infer the past demography of the king penguin population using the coalescent-based multi-locus analysis implemented in BEAST v. 1.7.4 [50], setting the EBSP [21] as the tree prior model (see the electronic supplementary material for details). The robustness of the approach was tested with respect to: (i) the number of SNPs per locus, (ii) the different random selection of loci, and (iii) the number of loci included in the random selection. All analyses were run on the Bioportal facility (now LifePortal) of the ABEL cluster, University of Oslo. An estimate proposed for the substitution rate of the mitochondrial CR in the Adélie penguins (0.55 substitutions site−1 Myr−1 [22]) was used to calibrate our demographic reconstruction. We then plotted the population trend of the last 35 000 years together with the trend of temperature anomalies (in Δ°C) as inferred by the analysis of the EPICA Dome C ice core [24]. Concerning the calibration of the mean genome-wide substitution rate: first, the mean of the MCMC posterior median values for each SNP class included in the selected EBSP analysis (4- to 6-SNP classes) was calculated; then, a linear regression was used to infer the substitution rate of those SNP classes excluded from the final EBSP analysis (0- to 3-SNP classes); finally, we calculated the mean genomic substitution rate weighting each SNP class according to the frequency (number of loci) of each class.
(d). Mitochondrial DNA control region analysis
Partial sequences of the CR (354 bp) were amplified and sequenced in 140 samples according to the protocol published in Heupink et al. [51]. Summary molecular statistics (Haplotype diversity: Hd; nucleotide diversity: pi), demographic parameters as Tajima's D and Fu's Fs, and the mismatch distribution of pairwise differences were calculated. This dataset was used to infer the king penguin past demography employing the Bayesian Skyride plot [52] reconstruction, which produces estimates of population size through time and its associated credibility intervals, combining both phylogenetic and coalescent uncertainties, as implemented in BEAST v. 1.7.4. The estimate of the CR substitution rate proposed for Adélie penguins (0.55 substitutions site−1 Myr−1 [22]) was used to calibrate our analyses.
Supplementary Material
Acknowledgements
We are very grateful to Hélène Gachot-Neveu and Magali Beaugey for their help in the laboratory. We also thank M. Le Vaillant, O. Prudhomme and M. Ripoche for the sample collection. We are very grateful to Sissel Jentoft and core members of the Centre for Ecological and Evolutionary Synthesis, University of Oslo, for the support in implementing the RAD sequencing platform and to Sanne Boessenkool for helpful comments on early versions of the manuscript. We also thank the editors and two anonymous referees for their very helpful comments.
All animals in this study were handled only once in order to mark them with a plastic tag (Floytag®), to blood-sample them, and to conduct morphological measurements. All procedures employed during this fieldwork were approved by the Ethical Committee of the French Polar Institute (Institut Paul Emile Victor − IPEV) and conducted in accordance with its guidelines, also complying with French laws including those relating to conservation and welfare. Authorizations to enter the breeding site (permits n°2009-57 issued on the 26th of August 2009) and handle birds (permits n°2009-59 issued on the 29th of August 2009) were delivered first by the French “Ministère de l’Aménagement du Territoire et de l’Environnement” and then by the Terres Australes et Antarctiques Françaises (TAAF).
Handled animals were removed from the colony in order to minimize the disturbance to neighbouring birds and taken to a few meters away for manipulation. They were hooded to reduce their stress and manipulations lasted between 5 and 10 minutes. All blood-sampling (quantities adjusted according to the age of the chick) and tagging material was sterilized (either sealed, or through chemical sterilization). Moreover, Vétédine soap and alcoholic antiseptic solutions were used to disinfect the skin before bleeding and tagging. Flesh wounds did not seem infected thereafter (personal observations on a subset of recaptured birds).
Data accessibility
RADseq data: Sequence Read Archive (Run Num.: SRR942341). MtDNA data: GenBank accession nos. KF530582–KF530720.
Funding statement
This study was supported by the Institut Polaire Français Paul-Emile Victor (Programme 137—ECOPHY), the Centre National de la Recherche Scientifique (Programme Zone Atelier de Recherches sur l'Environnement Antarctique et Subantarctique), the Fondation de France/Fondation Ars Cuttoli (to J.D.W.) and Marie Curie Intra European Fellowships (FP7-PEOPLE-IEF-2008, European Commission; project no. 235962 to C.L.B. and FP7-PEOPLE-IEF-2010, European Commission; project no. 252252 to E.T.).
References
- 1.Hewitt G. 2000. The genetic legacy of the Quaternary ice ages. Nature 405, 907–913. ( 10.1038/35016000) [DOI] [PubMed] [Google Scholar]
- 2.Parmesan C, Yohe G. 2003. A globally coherent fingerprint of climate change impacts across natural systems. Nature 421, 37–42. ( 10.1038/nature01286) [DOI] [PubMed] [Google Scholar]
- 3.Bellard C, Bertelsmeier C, Leadley P, Thuiller W, Courchamp F. 2012. Impacts of climate change on the future of biodiversity. Ecol. Lett. 15, 365–377. ( 10.1111/j.1461-0248.2011.01736.x) [DOI] [PMC free article] [PubMed] [Google Scholar]
- 4.Hoffmann AA, Sgrò CM. 2011. Climate change and evolutionary adaptation. Nature 470, 479–485. ( 10.1038/nature09670) [DOI] [PubMed] [Google Scholar]
- 5.Fraser CI, Nikula R, Ruzzante DE, Waters JM. 2012. Poleward bound: biological impacts of Southern Hemisphere glaciation. Trends Ecol. Evol. 27, 462–471. ( 10.1016/j.tree.2012.04.011) [DOI] [PubMed] [Google Scholar]
- 6.Fraser CI, Nikula R, Spencer HG, Waters JM. 2009. Kelp genes reveal effects of subantarctic sea ice during the Last Glacial Maximum. Proc. Natl Acad. Sci. USA 106, 3249–3253. ( 10.1073/pnas.0810635106) [DOI] [PMC free article] [PubMed] [Google Scholar]
- 7.Hunt GL. 1991. Occurrence of polar seabirds at sea in relation to prey concentrations and oceanographic factors. Polar Res. 10, 553–560. ( 10.1111/j.1751-8369.1991.tb00673.x) [DOI] [Google Scholar]
- 8.Thatje S, Hillenbrand C-D, Mackensen A, Larter R. 2008. Life hung by a thread: endurance of antarctic fauna in glacial periods. Ecology 89, 682–692. ( 10.1890/07-0498.1) [DOI] [PubMed] [Google Scholar]
- 9.Baroni C, Orombelli G. 1994. Abandoned penguin rookeries as Holocene paleoclimatic indicators in Antarctica. Geology 22, 23–26. () [DOI] [Google Scholar]
- 10.Van der Putten N, Verbruggen C, Ochyra R, Verleyen E, Frenot Y. 2010. Subantarctic flowering plants: pre-glacial survivors or post-glacial immigrants? J. Biogeogr. 37, 582–592. ( 10.1111/j.1365-2699.2009.02217.x) [DOI] [Google Scholar]
- 11.De Bruyn M, Hall BL, Chauke LF, Baroni C, Koch PL, Hoelzel AR. 2009. Rapid response of a marine mammal species to holocene climate and habitat change. PLoS Genet. 5, e1000554 ( 10.1371/journal.pgen.1000554) [DOI] [PMC free article] [PubMed] [Google Scholar]
- 12.Roeder AD, et al. 2001. Gene flow on the ice: genetic differentiation among Adelie penguin colonies around Antarctica. Mol. Ecol. 10, 1645–1656. ( 10.1046/j.0962-1083.2001.01312.x) [DOI] [PubMed] [Google Scholar]
- 13.IPCC 2007. Climate change, 2007: contribution of working group I to the fourth assessment report of the Intergovernmental Panel on Climate Change. Cambridge, UK: Cambridge University Press. [Google Scholar]
- 14.Le Bohec C, Durant JM, Gauthier-Clerc M, Stenseth NC, Park Y-H, Pradel R, Grémillet D, Gendner J-P, Le Maho YL. 2008. King penguin population threatened by Southern Ocean warming. Proc. Natl Acad. Sci. USA 105, 2493–2497. ( 10.1073/pnas.0712031105) [DOI] [PMC free article] [PubMed] [Google Scholar]
- 15.Jenouvrier S, Holland M, Stroeve J, Barbraud C, Weimerskirch H, Serreze M, Caswell H. 2012. Effects of climate change on an emperor penguin population: analysis of coupled demographic and climate models. Glob. Change Biol. 18, 2756–2770. ( 10.1111/j.1365-2486.2012.02744.x) [DOI] [PubMed] [Google Scholar]
- 16.Saraux C, et al. 2011. Reliability of flipper-banded penguins as indicators of climate change. Nature 469, 203–206. ( 10.1038/nature09630) [DOI] [PubMed] [Google Scholar]
- 17.Péron C, Weimerskirch H, Bost C-A. 2012. Projected poleward shift of king penguins’ (Aptenodytes patagonicus) foraging range at the Crozet Islands, southern Indian Ocean. Proc. R. Soc. B 279, 2515–2523. ( 10.1098/rspb.2011.2705) [DOI] [PMC free article] [PubMed] [Google Scholar]
- 18.Charrassin J-B, Bost C-A. 2001. Utilisation of the oceanic habitat by king penguins over the annual cycle. Mar. Ecol. Prog. Ser. 221, 285–297. ( 10.3354/meps221285) [DOI] [Google Scholar]
- 19.Baird NA, Etter PD, Atwood TS, Currey MC, Shiver AL, Lewis ZA, Selker EU, Cresko WA, Johnson EA. 2008. Rapid SNP discovery and genetic mapping using sequenced RAD markers. PLoS ONE 3, e3376 ( 10.1371/journal.pone.0003376) [DOI] [PMC free article] [PubMed] [Google Scholar]
- 20.Davey JW, Hohenlohe PA, Etter PD, Boone JQ, Catchen JM, Blaxter ML. 2011. Genome-wide genetic marker discovery and genotyping using next-generation sequencing. Nat. Rev. Genet. 12, 499–510. ( 10.1038/nrg3012) [DOI] [PubMed] [Google Scholar]
- 21.Heled J, Drummond AJ. 2008. Bayesian inference of population size history from multiple loci. BMC Evol. Biol. 8, 289 ( 10.1186/1471-2148-8-289) [DOI] [PMC free article] [PubMed] [Google Scholar]
- 22.Millar CD, Dodd A, Anderson J, Gibb GC, Ritchie PA, Baroni C, Woodhams MD, Hendy MD, Lambert DM. 2008. Mutation and evolutionary rates in Adélie penguins from the Antarctic. PLoS Genet. 4, e1000209 ( 10.1371/journal.pgen.1000209) [DOI] [PMC free article] [PubMed] [Google Scholar]
- 23.Gutenkunst RN, Hernandez RD, Williamson SH, Bustamante CD. 2009. Inferring the joint demographic history of multiple populations from multidimensional SNP frequency data. PLoS Genet. 5, e1000695 ( 10.1371/journal.pgen.1000695) [DOI] [PMC free article] [PubMed] [Google Scholar]
- 24.Jouzel J, et al. 2007. Orbital and millennial Antarctic climate variability over the past 800,000 years. Science 317, 793–796. ( 10.1126/science.1141038) [DOI] [PubMed] [Google Scholar]
- 25.Li H, Durbin R. 2011. Inference on human population history from individual whole-genome sequences. Nature 475, 493–496. ( 10.1038/nature10231) [DOI] [PMC free article] [PubMed] [Google Scholar]
- 26.Sheelan S, Harris K, Song YS. 2013. Estimating variable effective population sizes from multiple genomes: a sequentially Markov conditional sampling distribution approach. Genetics 194, 647–662. ( 10.1534/genetics.112.149096) [DOI] [PMC free article] [PubMed] [Google Scholar]
- 27.Bryant D, Bouckaert R, Felsenstein J, Rosenberg NA, RoyChoudhury A. 2012. Inferring species trees directly from biallelic genetic markers: bypassing gene trees in a full coalescent analysis. Mol. Biol. Evol. 29, 1917–1932. ( 10.1093/molbev/mss086) [DOI] [PMC free article] [PubMed] [Google Scholar]
- 28.Myers S, Fefferman C, Patterson N. 2008. Can one learn history from the allelic spectrum? Theor. Popul. Biol. 73, 342–348. ( 10.1016/j.tpb.2008.01.001) [DOI] [PubMed] [Google Scholar]
- 29.Delord K, Barbraud C, Weimerskirch H. 2004. Long-term trends in the population size of king penguins at Crozet archipelago: environmental variability and density dependence? Polar Biol. 27, 793–800. ( 10.1007/s00300-004-0651-z) [DOI] [Google Scholar]
- 30.Felsenstein J. 2006. Accuracy of coalescent likelihood estimates: do we need more sites, more sequences, or more loci? Mol. Biol. Evol. 23, 691–700. ( 10.1093/molbev/msj079) [DOI] [PubMed] [Google Scholar]
- 31.Willing EM, Dreyer C, van Oosterhout C. 2012. Estimates of genetic differentiation measured by FST do not necessarily require large sample sizes when using many SNP markers. PLoS ONE 7, e42649 ( 10.1371/journal.pone.0042649) [DOI] [PMC free article] [PubMed] [Google Scholar]
- 32.Ellegren H. 2013. The evolutionary genomics of birds. Annu. Rev. Ecol. Evol. Syst. 44, 239–259. ( 10.1146/annurev-ecolsys-110411-160327) [DOI] [Google Scholar]
- 33.Gibb GC, Hills SF. 2013. Intergenerational mutation rate does not equal long-term evolutionary substitution rate. Proc. Natl Acad. Sci. USA 110, E611 ( 10.1073/pnas.1217134110) [DOI] [PMC free article] [PubMed] [Google Scholar]
- 34.O'Roak BJ, Vives L, Girirajan S, Karakoc E, Krumm N, Coe BP, Eichler EE. 2012. Sporadic autism exomes reveal a highly interconnected protein network of de novo mutations. Nature 485, 246–250. ( 10.1038/nature10989) [DOI] [PMC free article] [PubMed] [Google Scholar]
- 35.International Chicken Genome Sequencing Consortium (ICGSC) 2004. Sequence and comparative analysis of the chicken genome provide unique perspectives on vertebrate evolution. Nature 432, 695–716. ( 10.1038/nature03154) [DOI] [PubMed] [Google Scholar]
- 36.Axelsson E, Webster MT, Smith NG, Burt DW, Ellegren H. 2005. Comparison of the chicken and turkey genomes reveals a higher rate of nucleotide divergence on microchromosomes than macrochromosomes. Genome Res. 15, 120–125. ( 10.1101/gr.3021305) [DOI] [PMC free article] [PubMed] [Google Scholar]
- 37.Zhao Z, Boerwinkle E. 2002. Neighboring-nucleotide effects on single nucleotide polymorphisms: a study of 2.6 million polymorphisms across the human genome. Genome Res. 12, 1679–1686. ( 10.1101/gr.287302) [DOI] [PMC free article] [PubMed] [Google Scholar]
- 38.Webster MT, Axelsson E, Ellegren H. 2006. Strong regional biases in nucleotide substitution in the chicken genome. Mol. Biol. Evol. 23, 1203–1216. ( 10.1093/molbev/msk008) [DOI] [PubMed] [Google Scholar]
- 39.Barrat A. 1976. Quelques aspects de la biologie et de l’écologie du Manchot Royal (Aptenodytes patagonicus) des îles Crozet. Comité Natl Français Recherche Antarctique 40, 9–51. [Google Scholar]
- 40.Gersonde R, Crosta X, Abelmann A, Armand L. 2005. Sea-surface temperature and sea ice distribution of the Southern Ocean at the EPILOG Last Glacial Maximum: a circum-Antarctic view based on siliceous microfossil records. Quat. Sci. Rev. 24, 869–896. ( 10.1016/j.quascirev.2004.07.015) [DOI] [Google Scholar]
- 41.Charles CD, Froelich PN, Zibello MA, Mortlock RA, Morley JJ. 1991. Biogenic opal in Southern Ocean sediments over the last 450,000 years: implications for surface water chemistry and circulation. Paleoceanography 6, 697–728. ( 10.1029/91PA02477) [DOI] [Google Scholar]
- 42.Burckle LH. 1984. Diatom distribution and paleoceanographic reconstruction in the Southern Ocean: present and last glacial maximum. Mar. Micropaleontol. 9, 241–261. ( 10.1016/0377-8398(84)90015-X) [DOI] [Google Scholar]
- 43.Janko K, Lecointre G, DeVries A, Couloux A, Cruaud C, Marshall C. 2007. Did glacial advances during the Pleistocene influence differently the demographic histories of benthic and pelagic Antarctic shelf fishes? Inferences from intraspecific mitochondrial and nuclear DNA sequence diversity. BMC Evol. Biol. 7, 220 ( 10.1186/1471-2148-7-220) [DOI] [PMC free article] [PubMed] [Google Scholar]
- 44.Waters JM. 2008. Driven by the West Wind Drift? A synthesis of southern temperate marine biogeography, with new directions for dispersalism. J. Biogeogr. 35, 417–427. ( 10.1111/j.1365-2699.2007.01724.x) [DOI] [Google Scholar]
- 45.Convey P, et al. 2009. Exploring biological constraints on the glacial history of Antarctica. Quat. Sci. Rev. 28, 3035–3048. ( 10.1016/j.quascirev.2009.08.015) [DOI] [Google Scholar]
- 46.Ducklow HW, Baker K, Martinson DG, Quetin LB, Ross RM, Smith RC, Stammerjohn SE, Vernet M, Fraser WR. 2007. Marine pelagic ecosystems: the West Antarctic Peninsula. Phil. Trans. R. Soc. B 362, 67–94. ( 10.1098/rstb.2006.1955) [DOI] [PMC free article] [PubMed] [Google Scholar]
- 47.Catchen JM, Amores A, Hohenlohe P, Cresko W, Postlethwait JH. 2011. Stacks: building and genotyping loci de novo from short-read sequences. Genes Genomes Genet. 1, 171–182. ( 10.1534/g3.111.000240) [DOI] [PMC free article] [PubMed] [Google Scholar]
- 48.Jombart T, Ahmed I. 2011. adegenet 1.3–1: new tools for the analysis of genome-wide SNP data. Bioinformatics 27, 3070–3071. ( 10.1093/bioinformatics/btr521) [DOI] [PMC free article] [PubMed] [Google Scholar]
- 49.Paradis E, Claude J, Strimmer K. 2004. APE: analyses of phylogenetics and evolution in R language. Bioinformatics 20, 289–290. ( 10.1093/bioinformatics/btg412) [DOI] [PubMed] [Google Scholar]
- 50.Drummond AJ, Rambaut A. 2007. BEAST: Bayesian evolutionary analysis by sampling trees. BMC Evol. Biol. 7, 214 ( 10.1186/1471-2148-7-214) [DOI] [PMC free article] [PubMed] [Google Scholar]
- 51.Heupink TH, Hoff J, Lambert DM. 2012. King penguin population on Macquarie Island recovers ancient DNA diversity after heavy exploitation in historic times. Biol. Lett. 8, 586–589. ( 10.1098/rsbl.2012.0053) [DOI] [PMC free article] [PubMed] [Google Scholar]
- 52.Minin VN, Bloomquist EW, Suchard MA. 2008. Smooth Skyride through a rough skyline: Bayesian coalescent-based inference of population dynamics. Mol. Biol. Evol. 25, 1459–1471. ( 10.1093/molbev/msn090) [DOI] [PMC free article] [PubMed] [Google Scholar]
Associated Data
This section collects any data citations, data availability statements, or supplementary materials included in this article.
Supplementary Materials
Data Availability Statement
RADseq data: Sequence Read Archive (Run Num.: SRR942341). MtDNA data: GenBank accession nos. KF530582–KF530720.