Abstract
In this paper, we present a novel modification to level set based automatic retinal vasculature segmentation approaches. The method introduces ridge sample extraction for sampling the vasculature centerline and phase map based edge detection for accurate region boundary detection. Segmenting the vasculature in fundus images has been generally challenging for level set methods employing classical edge-detection methodologies. Furthermore, initialization with seed points determined by sampling vessel centerlines using ridge identification makes the method completely automated. The resulting algorithm is able to segment vasculature in fundus imagery accurately and automatically. Quantitative results supplemented with visual ones support this observation. The methodology could be applied to the broader class of vessel segmentation problems encountered in medical image analytics.
Index Terms: Fundus image, retinal vasculature analysis, vessel segmentation, level sets, phase map for edge detection, principal curves as ridges
1. INTRODUCTION
Level set methods have been widely used for image segmentation [1–7]. These methods could be considered to generally fall into two groups: edge-based approaches [1,3,7] and region-based approaches [2,4]. With specific application to retinal vasculature segmentation from fundus images, the literature is rich in examples employing supervised classification of pixels [5,6]. There are studies that employ centerline tracing methods [13]. However, the use of level sets has not been extensively attempted due to challenges presented by the vessel shapes for level set methodologies in general [7]. Classification approaches require manually segmented images and for large-scale clinical applicability where imaging variations will drastically impact feature distributions, generating a comprehensive labeled image set may not be feasible. For level set based smooth region growing methods, major challenges posed by the very thin and elongated structure of retinal vessels are compounded further by the poor contrast of the regions of interest.
In this paper, we present an improved method for automatic level set based vessel segmentation specifically employed in the context of retinal vasculature segmentation in fundus images. Published ophthalmology studies have found that there are often significant discrepancies in clinical diagnosis among human experts [14]. These segmentation methods may become the basis for computer-based image analysis algorithms, which have potential to improve diagnostic accuracy and consistency [15]. The presented method utilizes a robust phase map to determine edges and ridge-based seed points to initialize the level set function. Results on healthy and pathological fundus images demonstrate that the presented method compares favorably to existing level set approaches.
2. THE EDGE-BASED LEVEL SET METHOD
Image segmentation based on level set methods typically consists of two additively combined energy terms: length and area. Li et al introduced a third energy term that they call as regularization [3]. These terms are explained next briefly.
Let I: Ω → ℝ be a grayscale image, defined on domain Ω = ℝ in this study. Let C be a closed subset of Ω bounded by a finite set of smooth curves. The connected regions of Ω\C are represented by Ωi, such that Ω = ∪i Ωi ∪ C. Also, ||C|| stands for the curve length (circumference) of the region [2].
A given curve C = ∂Ω1, boundary of a region Ω1 is represented implicitly, which is the zero level set of a scalar Lipschitz continuous function Φ: Ω → ℝ, namely the level set function with constant c0 and p ∈ Ω [2–4]
| (1) |
Level set iterations are adversely affected by numerical errors and other factors causing irregularities; therefore frequent reinitialization is usually employed using a signed distance function [3]. Li et al proposed a method using the regularization term to solve this difficulty [3,4]. They suggested using E(Φ) = μR(Φ) + λLg(Φ) + αAg(Φ) to segment images based on edge information g, where μ, λ, α > 0 are weighting parameters [3]. External energy terms Lg(·) and Ag(·) are also slightly different from the classical methods [2,7], since they include an edge strength function into the related terms [3]. By using the Heaviside function H(x) (equal to 1 if x ≥ 0 and 0 if x < 0) the length of C and the area of Ω1 can be computed as follows [3]:
| (2) |
The length functional Lg(·) regularizes the zero level contour. The area functional Ag(·) results in accelerating motion of the zero level contour in the level set evolution when the initial contour is located far away from the object boundary. Li et al utilized E(Φ) = μ ∫Ω R(||∇Φ||)dp + λ ∫Ω gδε(Φ)||∇Φ||dp + α ∫Ω gHε(−Φ||)dp [3], which shrinks also due to the functional of Ag(·) returning a positive contribution when the contour is outside the object or expands with a negative value when the contour is inside. Here Hε and are finite-width approximations of the Heaviside function and Dirac-impulse for ε. Gradient descent is used to minimize the energy:
| (3) |
In edge-based level set approaches a smooth edge strength function is generally obtained from the norm of the gradient of the Gaussian-filtered image. One choice is g = (1 + ||∇(Gσ * I)||2)−1. All these properties culminate in the iterative gradient descent procedure Φ(t+1) = Φ(t) + τ∂Φ(t)/(t) with Φ(t=0) = Φinitial, where τ is a time adapting coefficient.
3. THE PROPOSED METHOD
The edge strength function g carries key information to locate the initial contour, which could be set manually or automatically. Although the method described above [3] could segment objects in Magnetic Resonance Images and other common medical image modalities with reasonable success, it may fail to segment retinal vessels successfully due to weak edge strength at places in typical fundus images. Consequently, we employ an alternative edge strength g based on a phase map of the image Fourier transform. Neither the phase congruency based method [8], nor the phase map based approaches [7] generate adequate edge information for segmentation of blood vessels. Therefore we combine these two methods to improve the phase map.
Edge Map
The proposed method accepts as input a fundus image in RGB color space. A simple mask that excludes the exterior of the fundus where the color is between [0,40] in all three channels (i.e. overall very dark) can be employed. A log-Gabor filter is used to generate the phase map [8]. The image is filtered at different scales by at least 3 uniformly distributed directions to grab the poor contrast and variable-width blood vessels [7]. The filter output is complex, where real and imaginary parts consist of line and edge information, respectively. Filter responses in each scale for all directions must be combined to obtain a rotationally invariant phase map, but by taking the absolute value of the imaginary parts to prevent them from eliminating each other [7]. With these in mind, the phase map q is obtained as follows:
| (4) |
where D is number of directions, S is number of scales, q̄k,l is the filter response based on the corrected phase, β is a weighted parameter, and . The following normalization is also used to regularize the phase map: q̂ = q||q||/(||q||2+γ2), where γ stands for a threshold used to reduce noise effect [7]. Since edges align with the zero crossings of the real part of the phase map, we use the function g = Re(q̂) as in [7]. Values of the edge strength function g used in the method in [3] are in the 0–1 interval. In the proposed method, the sign of the coefficient α in the level set energy functional can always remain positive in contrast with the earlier method. Because, the function g obtained from the phase map has negative values outside and positive values inside of the objects; however, λ is initially set to negative if the initial contour is placed outside of the object.
Ridge Sampling for Seeds
Another novel component of the proposed method is seed sampling from the centerlines of vessels through a ridge sampling procedure, which is based on principal curves [10]. Let f(p) be the ridge function where p indicates the position. Let ∇f(p) and H(p) be the local gradient and Hessian of the function f at position p, respectively. For a point q on the principal curve, one of the eigenvectors of H(q) will be parallel to ∇f(q) and the other eigenvector will be orthogonal with a negative eigenvalue, since q is on the ridge of the function.
Assume Z⊥(q) is a matrix whose columns span the linear subspace, which contains the eigenvectors of H(q) that are perpendicular to the gradient ∇f(q). Then following quantity will be 0 for the points on the principal curve:
| (5) |
Basically, for a given point p, we climb to the ridge by iteratively moving one step size in the direction of the orthogonal eigenvector and checking the value of θ(p) at every iteration. As the ridge function, we used the kernel smoothed version of a binary image, which is obtained by the preprocessing procedure in [11]. Hence,
| (6) |
where Γ is the set of white pixel indices and Σi is the variable kernel covariance of the Gaussian kernel for a pixel at coordinate p.
4. EXPERIMENTAL RESULTS
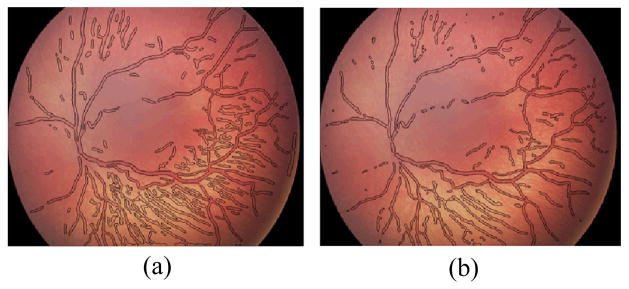
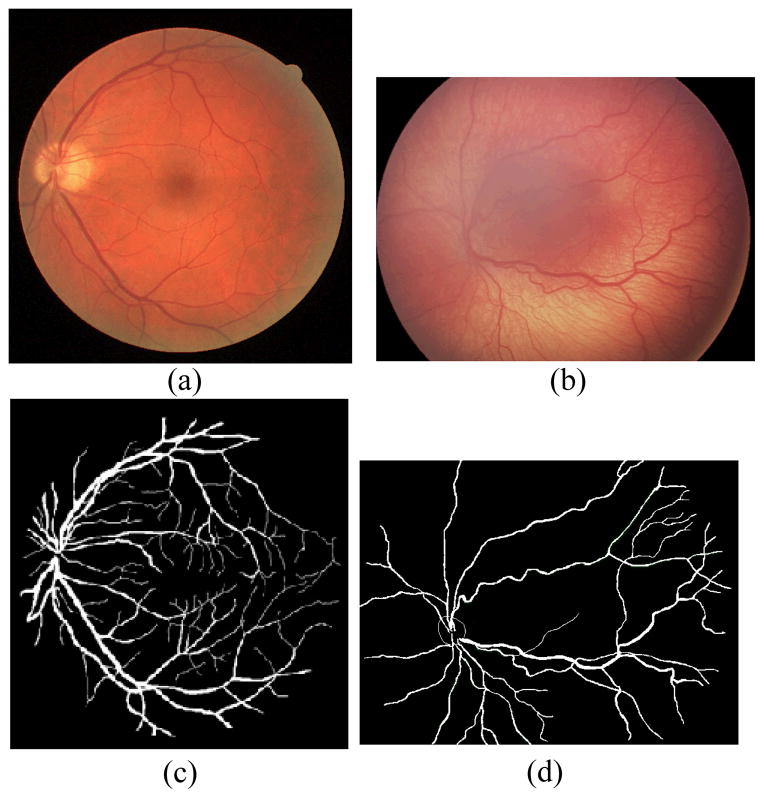
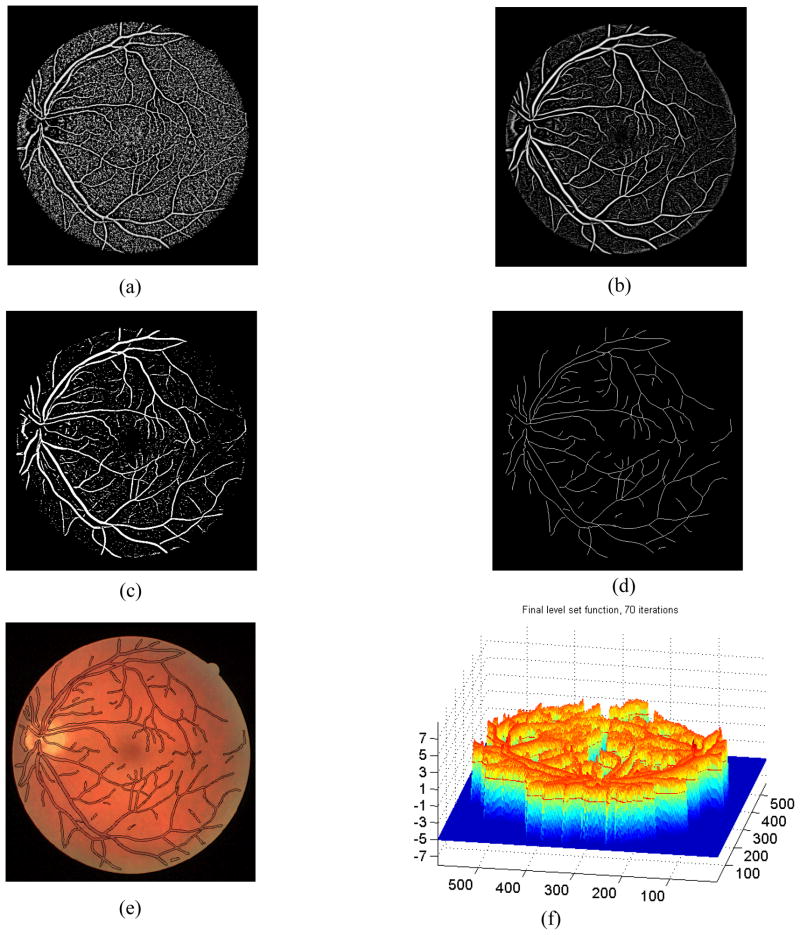
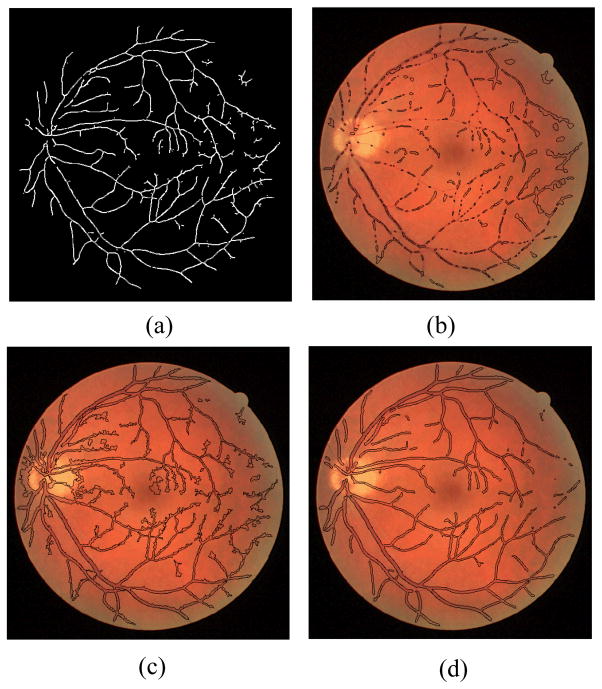
The proposed method is tested on both the DRIVE dataset [12] and our dataset. Our dataset consists of 34 fundus images along with expert delineations for each image. The sample images from both databases and their manual segmentation are shown in Fig. 4. We choose the algorithm parameters c0, τ, μ, λ, α, β and γ as 5, 1, 0.2/τ, 0.0005, −3, 1 and 3 respectively. Maximum number of iterations is experimentally selected as 70 by considering the average radius of vessels. We use 8 uniformly distributed angle directions and 3 image re-sampling scales for log-Gabor filter. Two test images from the DRIVE dataset and our dataset are displayed in Fig. 1 along with the manual segmentation. The results for the first test image from the DRIVE dataset are seen in Fig. 2. While the method produces promising results, there are also occasional artifacts, such as the false vessels shown by the red arrow on the left of Fig. 2e, next to the optical disc. Fig. 3 depicts another example for which both methods described in earlier work [3,7] failed, especially at regions where there is poor contrast. However, the proposed method is able to properly track the vessels in these regions as shown in Fig. 3d. Finally, a sample vessel segmentation result for a pathological fundus image from our dataset is shown in Fig. 4. Here, the results are shown based on two different initialization schemes: skeletonization points, and principal curve projection (PCP) based ridge sampling. The approach using PCP based seed points generates fewer artifacts.
Figure 4.

Segmentation results for a size 640x480 pathological fundus image from our dataset using (a) skeleton-based seed points, (b) projection-based seed points, after 70 iterations.
Figure 1.
Sample images and manual segmentations for (a–c) DRIVE dataset test image 12, and (b–d) an image from our dataset.
Figure 2.
Segmentation processes of non-pathological retinal fundus image with a size of 565x584 pizels from the DRIVE database is illustrated: (a) the phase map using the original method [7], (b) the phase map obtained using the proposed method, (c) binary image obtained from (b) using Otsu thresholding [9], (d) skeletonized version of (c) after eliminating outliers, (e) segmented image using the proposed method, and (f) the level set function after 70 iterations.
Figure 3.
Vessel segmentation results for a non-pathological fundus image: (a) Skeleton image that produces seed points for the proposed algorithm and segmentation results obtained by (b) distance regularized level set evolution method (DRLSE) [3], (c) phase-based method [7], and (d) the proposed method after 70 iterations.
The methods are implemented in MATLAB R2010a. The program is executed on a Laptop PC with Pentium 2.20 GHz processor and 2GB RAM. The segmentation of a fundus image with size 565x584 takes approximately 60 seconds with 70 iterations.
Quantitative results are obtained for both datasets where we have manual vessel segmentation labels performed and verified by human ophthalmology experts. Comparing the results with manual delineations, we obtain overall statistical quality metrics such as sensitivity Se, specificity Sp, positive predictive value Ppv, negative predictive value Npv, and accuracy Acc [5]. These measures are given by
| (7) |
With TP, TN, FP, FN denoting true and false positives and negatives as indicated by the combinations of initial letters. Here TP refers to a pixel labeled as vessel by both the algorithm and the human expert, while TN refers to a pixel that is deemed to be non-vessel by both. In order to compare the proposed method, the same statistical metrics for an alternative supervised method [5] on DRIVE and our datasets are also reported in Table 1. Resulting some Ppv values using our method is comparatively low since the technique also detects thin vessels that are not delineated by human observers as seen in Fig. 4a,b.
Table 1.
Statistical average results for test images 1 to 20 from the datasets (SK: skeleton-based seed points; PCP: principal curve projection based seed points).
| Dataset | Method | Se | Sp | Ppv | Npv | Acc |
|---|---|---|---|---|---|---|
| DRIVE | Proposed (SK) | 0.7181 | 0.9743 | 0.8054 | 0.9589 | 0.9412 |
| Proposed (PCP) | 0.7473 | 0.9687 | 0.7788 | 0.9627 | 0.9339 | |
| DRLSE (SK) [3] | 0.1156 | 0.9960 | 0.8079 | 0.8842 | 0.8829 | |
| DRLSE (PCP) [3] | 0.2505 | 0.9735 | 0.5871 | 0.8980 | 0.8805 | |
| Phase-based (PCP) [7] | 0.7243 | 0.8905 | 0.6133 | 0.9154 | 0.8687 | |
| Supervised [5] | 0.7067 | 0.9801 | 0.8433 | 0.9582 | 0.9452 | |
| Our | Proposed (SK) | 0.6130 | 0.9640 | 0.5145 | 0.9780 | 0.9453 |
| Proposed (PCP) | 0.6491 | 0.9667 | 0.5476 | 0.9800 | 0.9496 | |
| DRLSE (SK) [3] | 0.1620 | 0.9922 | 0.5382 | 0.9561 | 0.9493 | |
| DRLSE (PCP) [3] | 0.3821 | 0.9356 | 0.2534 | 0.9651 | 0.9067 | |
| Phase-based (PCP) [7] | 0.74720 | 0.8560 | 0.3219 | 0.9370 | 0.8497 |
5. CONCLUSION
We presented a phase-based level set method with ridge sampling seed selection for the problem of segmenting retinal vasculature in fundus images. Extensive experiments with the proposed algorithms using two datasets indicate that the algorithm performs well and compares favorably to alternatives already existing in the literature. Developing strategies to improve inconsistency in clinical diagnosis is an important challenge in ophthalmology, and the segmentation methods described in this study may provide the basis for development of computer-based image analysis algorithms. Future work will involve quantitative feature extraction from segmented retinal vessels, followed by implementation of these image analysis algorithms for image-based diagnostic assistance.
Our goal is to extend the study to improve the results especially for pathological regions. Some regions such as macula, which is in the center of the retinal image, the optic disk, which is located towards the nose, and drusen, which are tiny yellow or white accumulations of extracellular material, are able to complicate segmentation process. To overcome this difficulty, we plan to improve our preprocessing step with a technique that corrects the intensity nonuniformity in these regions.
Acknowledgments
This work is partially supported by grants from TUBITAK, NSF, and NIH.
References
- 1.Caselles V, Kimmel R, Sapiro G. Geodesic active contours. Int J Comput Vis. 1997;22(1):61–79. [Google Scholar]
- 2.Vese L, Chan T. A multiphase level set framework for image segmentation using the Mumford and Shah model. Int J Comput Vis. 2002;50(3):271–293. [Google Scholar]
- 3.Li C, Xu C, Gui C, Fox MD. Distance regularized level set evolution and its application to image segmentation. IEEE Trans Image Process. 2010;19(12):3243–3254. doi: 10.1109/TIP.2010.2069690. [DOI] [PubMed] [Google Scholar]
- 4.Li C, Kao C, Gore JC, Ding Z. Minimization of region-scalable fitting energy for image segmentation. IEEE Trans Image Process. 2008;17(10):1940–1949. doi: 10.1109/TIP.2008.2002304. [DOI] [PMC free article] [PubMed] [Google Scholar]
- 5.Marin D, Aquino A, Arias GME, Bravo JM. A New supervised method for blood vessel segmentation in retinal images by using gray-level and moment invariants-based features. IEEE Trans Medical Imaging. 2011;30(1):146–158. doi: 10.1109/TMI.2010.2064333. [DOI] [PubMed] [Google Scholar]
- 6.Soares JVB, Leandro JJG, Cesar RM, Jr, Jelinek HF, Cree MJ. Retinal vessel segmentation using the 2-D Gabor wavelet and supervised classification. IEEE Trans Med Imaging. 2006;25(9):1214–1222. doi: 10.1109/tmi.2006.879967. [DOI] [PubMed] [Google Scholar]
- 7.Lathen G, Jonasson J, Borga M. Blood vessel segmentation using multi-scale quadrature filtering. Pattern Recognition Letters. 2010;31:762–767. [Google Scholar]
- 8.Kovesi P. Phase congruency: A low-level image invariant. Psychological Research. 2000;64(2):136–148. doi: 10.1007/s004260000024. [DOI] [PubMed] [Google Scholar]
- 9.Otsu N. A threshold selection method from gray-level histogram. IEEE Trans System Man Cybernetics. 1979;9(1):62–66. [Google Scholar]
- 10.Erdogmus D, Ozertem U. Self-consistent locally defined principal surfaces. Proceedings of ICASSP. 2007:II.549–II.552. [Google Scholar]
- 11.You S, Bas E, Erdogmus D, Kalpathy-Cramer J. Principal curve based retinal vessel segmentation towards diagnosis of retinal diseases. Proceedings of Healthcare Informatics, Imaging and Systems Biology (HISB) 2011:331–337. [Google Scholar]
- 12.Staal J, Abramoff MD, Niemeijer M, Viergever MA, van Ginneken B. Ridge-based vessel segmentation in color images of the retina. IEEE Trans Medical Imaging. 2004;23:501–509. doi: 10.1109/TMI.2004.825627. [DOI] [PubMed] [Google Scholar]
- 13.Osareh A, Shadgar B. An automated tracking approach for extraction of retinal vasculature in fundus images. Journal of Opthalmic Vision Research. 2010;5:20–26. [PMC free article] [PubMed] [Google Scholar]
- 14.Chiang MF, Jiang L, Gelman R, Du YE, Flynn JT. Interexpert agreement of plus disease diagnosis in retinopathy of prematurity. Arch Ophthalmol. 2007;125:875–880. doi: 10.1001/archopht.125.7.875. [DOI] [PubMed] [Google Scholar]
- 15.Gelman R, Jiang L, Du YE, Martinez-Perez ME, Flynn JT, Chiang MF. Plus disease in retinopathy of prematurity: pilot study of computer-based and expert diagnosis. JAAPOS. 2007:532–540. doi: 10.1016/j.jaapos.2007.09.005. [DOI] [PMC free article] [PubMed] [Google Scholar]


