Abstract
The rapid increase in the availability of RDC data from multiple alignment media in recent years has necessitated the development of more sophisticated analyses that extract the RDC data’s full information content. This article presents an analysis of the distribution of RDCs from two media (2D-RDC data), using the information obtained from a λ-map. This article also introduces an efficient algorithm, which leverages these findings to extract the order tensors for each alignment medium using unassigned RDC data in the absence of any structural information. The results of applying this 2D-RDC analysis method to synthetic and experimental data are reported in this article. The relative order tensor estimates obtained from the 2D-RDC analysis are compared to order tensors obtained from the program REDCAT after using assignment and structural information. The final comparisons indicate that the relative order tensors estimated from the unassigned 2D-RDC method very closely match the results from methods that require assignment and structural information. The presented method is successful even in cases with small datasets. The results of analyzing experimental RDC data for the protein 1P7E are presented to demonstrate the potential of the presented work in accurately estimating the principal order parameters from RDC data that incompletely sample the RDC space. In addition to the new algorithm, a discussion of the uniqueness of the solutions is presented; no more than two clusters of distinct solutions have been shown to satisfy each λ-map.
Keywords: Unassigned NMR data, λ-maps, Hull, Relative order tensor, Residual dipolar coupling, Protein structure
1. Introduction
Recent advances in experimental techniques have made the acquisition and processing of Residual Dipolar Coupling (RDC) data significantly easier and more precise. Consequently, the community of researchers has been motivated to develop the computational and mathematical methods required to fully exploit this new resource. Applications of the RDC data include the study of challenging biomolecules such as membrane proteins [1–4], carbohydrates [5–7], and DNA/RNA [8–11] to name a few. Recent advances include structure determination from multiple alignment media [12–15], reconstruction of the relative order tensors from unassigned RDC data [15,16], and identification of homologous structures [17,18] from unassigned RDC data. These elaborate methods utilize RDC data collected from multiple alignment media, sometimes requiring data from as many as 5 or more alignment media [13,19–21]. Although the utility of RDC data from a large number of alignment media (three or more) is obvious, simultaneous analysis of this pool of RDC data is convoluted and computationally time consuming. In addition to the complexity of data analysis, in many cases it is still not experimentally feasible to find more than two independent alignment media that work to partially align a given molecule.
A central problem in utilizing residual dipolar coupling data is the accurate estimation of the order tensors that dictate the relationship between the orientation of intramolecular vectors and the observed residual dipolar coupling values. Presently, the anisotropy in molecular alignment is calculated either through the availability of a structure and assigned RDC data [22,23] or simultaneously as a part of structure determination [12,24–28]. These contemporary methods of order tensor estimation require resonance assignment, which is costly in both time and money. Under the significantly cheaper assumption of unassigned resonances and no structure, a number of recent approaches have described various methods of estimating order tensors (or relative order tensors) [13,14,17,18,29,30]. These serve either as the final point of analysis or as an intermediate step toward a final point such as structure determination or study of internal dynamics. Collectively, these methods either require RDC data from many alignment media (three or more), or they provide only some components of the anisotropy, such as only the principal order parameters or orientation of the anisotropy.
This report presents an efficient, automated method of extracting the relative order tensors for a protein without the need for assignment or structure. The presented work takes advantage of the previously observed information content of the correlation plot of RDC data acquired from two alignment media [31]. Unlike the previously reported work, our approach is capable of simultaneous estimation of the principal order parameters and orientational components of the anisotropy. The success of the presented work is demonstrated through application to a number of instances of simulated as well as experimental data. This software package has been implemented within the Matlab computational environment and can be obtained from http://ifestos.cse.sc.edu.
2. Background and theory
2.1. Residual dipolar couplings
Residual dipolar couplings arise from the interaction of two magnetically active nuclei and the magnetic field, B0, of an NMR instrument. A detailed explanation of the quantum-physical theory of RDCs and experimental techniques for collecting them is beyond the scope of this paper and only the relevant theory and mathematics is presented here. The curious reader is directed to [32–34] for a more detailed treatment of the residual dipolar coupling phenomena.
The residual dipolar coupling between nuclei i and j with spins ½ is defined in Eq. (1) below:
| (1) |
Here, µ0 is the magnetic permeability of free space, h is Planck’s constant, γi and γj are the gyromagnetic ratios of nuclei i and j, respectively, rij is the effective (time averaged) distance between nuclei i and j, θii is the angle between the magnetic field and the vector joining nuclei i and j, and the angle brackets (〈〉) denote time averaging. Under the condition of isotropic tumbling of the vector between nuclei i and j, this equation averages to 0 and no RDC is observed. However, anisotropy can be induced through a variety of mechanisms [13,34,35].
In common use, the constants in Eq. (1) are usually subsumed into a single variable, Dmax, and after algebraic manipulation, this simplifies to the form in Eq. (2) below:
| (2) |
where (x, y, z) describe the Cartesian coordinates of the normalized vector between nuclei i and j; sxx, syy, szz, sxy, sxz, syz subsume the effects of the time averaging; and Cij is the scaled residual dipolar coupling value. In this formulation, scaled RDC measurements are used so that dipolar couplings from different types of intramolecular vectors can be compared and combined during analysis. This equation can be rewritten as the more convenient matrix product shown in Eq. (3) below:
| (3) |
| (4) |
Here, S is the traceless and symmetric Saupe order tensor matrix (OTM) and νij is the Cartesian coordinates of the vector joining the two interacting nuclei. Jacobi transformation [36] can then be used to decompose S into R × S′ × RT, where R is an Euler rotation matrix and S′ is a traceless diagonal matrix whose diagonal elements are referred to as the principal order parameters (POP) of S [22,23]. Eq. (3) can then be rewritten as Eq. (5) below:
| (5) |
Eq. (5) can be conceptualized as transforming the vector νij from its representation in the arbitrary molecular frame (MF) into the principal alignment frame (PAF) of the order tensor. The simpler Eq. (6) can be obtained as a consequence of this transformation, where x′, y′, and z′ are the coordinates of the normalized vector after being transformed into the PAF and are the diagonal elements of S′.
| (6) |
The Euler rotation matrix R is also often decomposed into three atomic rotations about the z, y, and z axes as shown in Eq. (7) below:
| (7) |
Regardless of the representation or the method of decomposition, any given order tensor requires five independent variables for its full description. Typically these five parameters may be either the 5-tuple (sxx, sxy, sxz, syy, syz) or the 5-tuple . In this report, we will switch between these representations depending on which of these is most sensible in a given context.
2.2. Relative order tensors
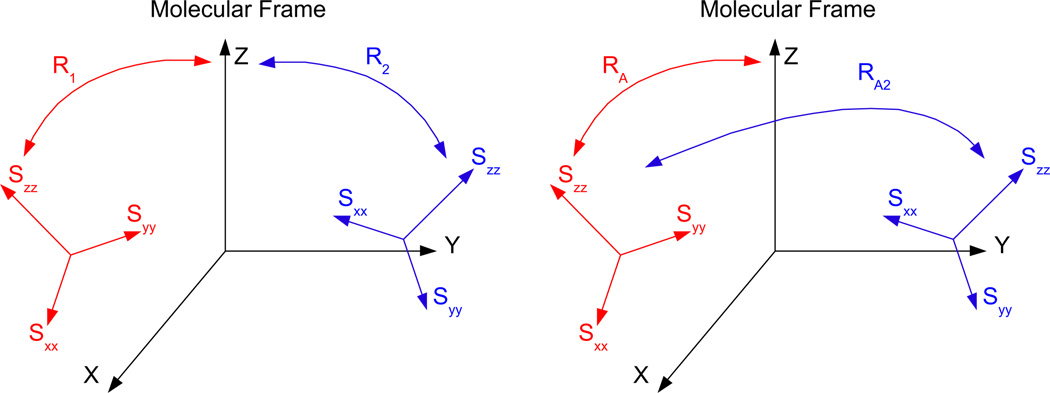
A detailed definition of absolute and relative order tensor matrices has been presented previously [29]. Here we present a brief review of this concept. Analysis of a subject molecule’s RDC data can provide its alignment anisotropy in the form of a Saupe order tensor matrix [37], or order tensor matrix for short. Each of these order tensors encapsulates five parameters, three of which describe the orientational components of the anisotropy and two of which report the strength of alignment. Traditionally, orientational information has been reported with respect to the molecular frame in which the atomic coordinates of the subject molecule are described. Analysis of RDC data acquired from multiple alignment media will then result in multiple descriptions of the alignments with respect to the molecular frame. Here, we denote this convention of describing the order tensors as the absolute order tensor matrix (aOTM). With no loss of generality and no reduction in the dimensionality of the problem, the order tensor of one of the alignment media (referred to as the anchor medium) can be expressed in the form of an aOTM while the orientational component of the anisotropy for all of the remaining media can be expressed relative to the principal alignment frame of the anchor medium. This formulation of the order tensor matrices (illustrated in Fig. 1) is denoted as the relative order tensor matrix in this article (rOTM). R1 and R2 in Fig. 1 are rotation matrices relating the molecular frame to the principal alignment frames of the first and second alignment media, respectively. RA is a rotation matrix relating the molecular frame to the principal alignment frame of the first medium, while RA2 is a rotation matrix relating the principal alignment frame of the first medium to the principal alignment frame of the second medium.
Fig. 1.
An illustration of absolute and relative order tensor formalisms.
2.3. The λ-maps and their relationship to the relative order tensor matrices
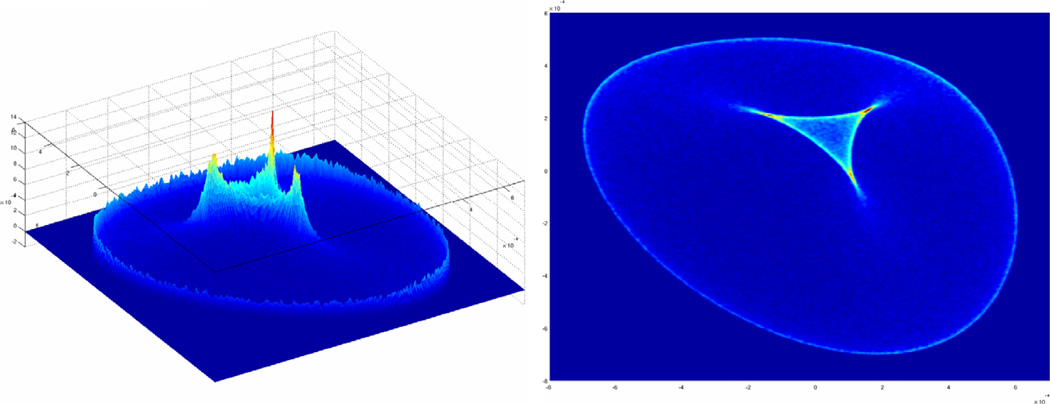
When residual dipolar couplings are collected in multiple alignment media, the RDC data in each medium that corresponds to the same interacting vector can be paired using chemical shift data [18]. As previously observed [14,29,31,38], the information gained by correlating data from two media is much richer than the data that can be gleaned from a separate analysis of each single channel of data. In particular, the scatter plot of RDC data obtained from two alignment media contains a vast amount of information regarding both the structure of the subject protein and the anisotropy of its alignment. Throughout this report, we denote these scatter plots as λ-maps (a sample is shown in Fig. 2) due to the prominent pattern that is present within these plots. The main focus of this report is to present an efficient and effective method of analyzing these maps for the extraction of the rOTM information.
Fig. 2.
An example probability density distribution plot for RDC data measured in two alignment media as viewed from two different angles. The x and y axes correspond to RDCs measured in medium 1 and 2, respectively and the z axis is the likelihood of observing a given pair of RDC data. This plot is referred to as a λ-map.
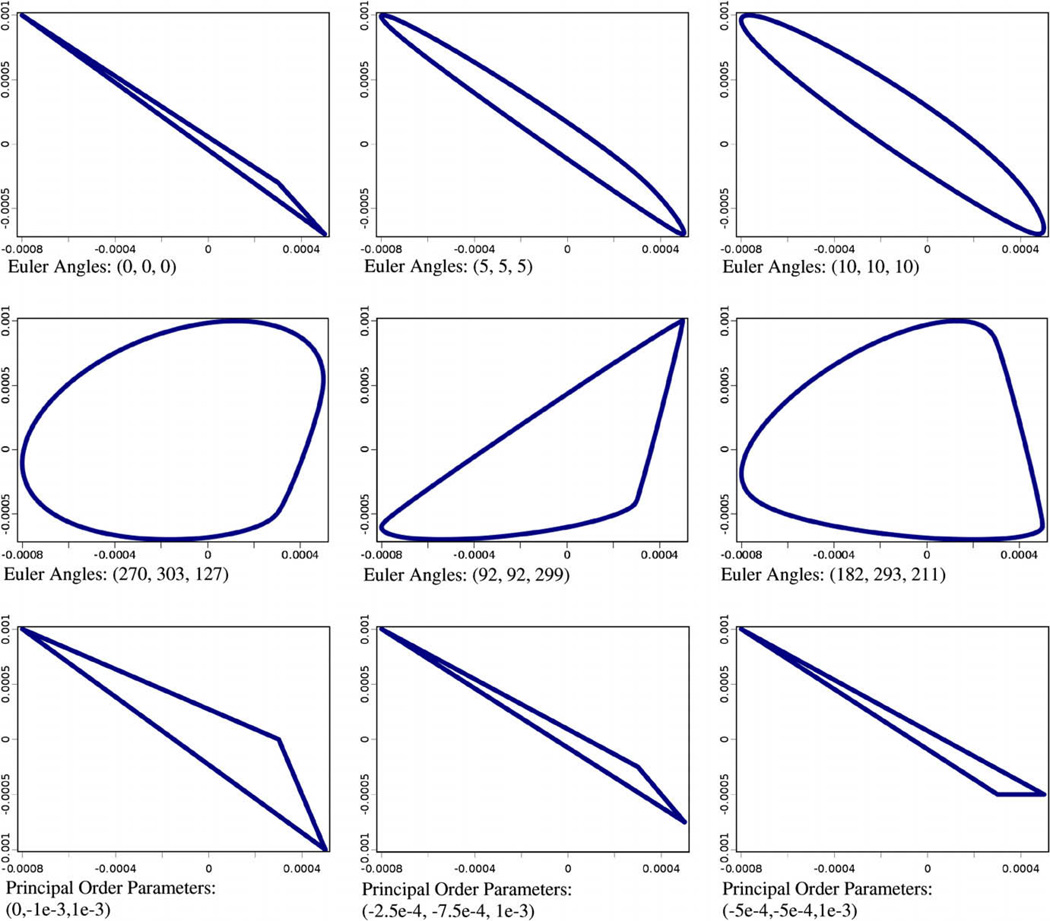
Previously reported methods have demonstrated the successful estimation of relative order tensor matrices using correlated RDC data from three or more alignment media [13–15]. While these approaches provide ample incentives for collection of RDC data from three or more alignment media, successful alignment of a sample protein in a large number of independent alignment media may be a limiting factor in practice. The availability of correlated RDC data from two alignment media is becoming more common, but the development of analysis methods for 2D-RDC data is needed. In developing a method for the estimation of relative order tensors from unassigned 2D-RDC data (where 2D refers to the number of alignment media), we first examined the probability density distributions of 2D-RDC data. A sample λ-map generated by the method of kernel density estimation from the RDCs of 100,000 random vectors is shown in Fig. 2. These two images correspond to the same object viewed from different perspectives. The top-view illustrates the central λ-like pattern more clearly. The important point to note is that the points tend to be most densely located in the central λ-like pattern and on the external hull of the distribution. Our presented method takes advantage of the relatively high probability region on the edge of the distribution, which we define as the external hull (or e-hull) of a λ-map. The span of the λ-map in both dimensions is a function of the principal order parameters of each alignment frame. As previously observed [31], the shape of the e-hull of the λ-map is a function of the Euler angles describing the relative orientation of the alignment media. Section 3.3 presents an efficient algorithm which utilizes this information to extract the relative order tensor matrices that describe the anisotropic alignment of the system of interest in two alignment media. Fig. 3 presents an illustration of various λ-maps with fixed principal order parameters and varying Euler angles for the relative alignment tensor. Note that the range of RDC data in either dimension remains fixed and only the shape of the e-hull is varied. Exhaustive testing has shown that each λ-map corresponds to at most two relative order tensors (discussed in Section 4.2) which have identical principal order parameters for each order tensor, differing only in relative orientations.
Fig. 3.
External hulls for arbitrary relative order tensors of varying relative orientation and principal order parameters for S1 of (3E–4, 5E–4, −8E–4) and S2 of (−3E–4, −7E–4, 1E–3) shown in first two rows. External hulls for S1 with principal order parameters of (3E–4, 5E–4, −8E–4),S2 of varying rhombicity, and Euler angles of (0,0,0) shown in last row.
2.4. Utility of 1D-powder pattern in estimation of principal order parameters
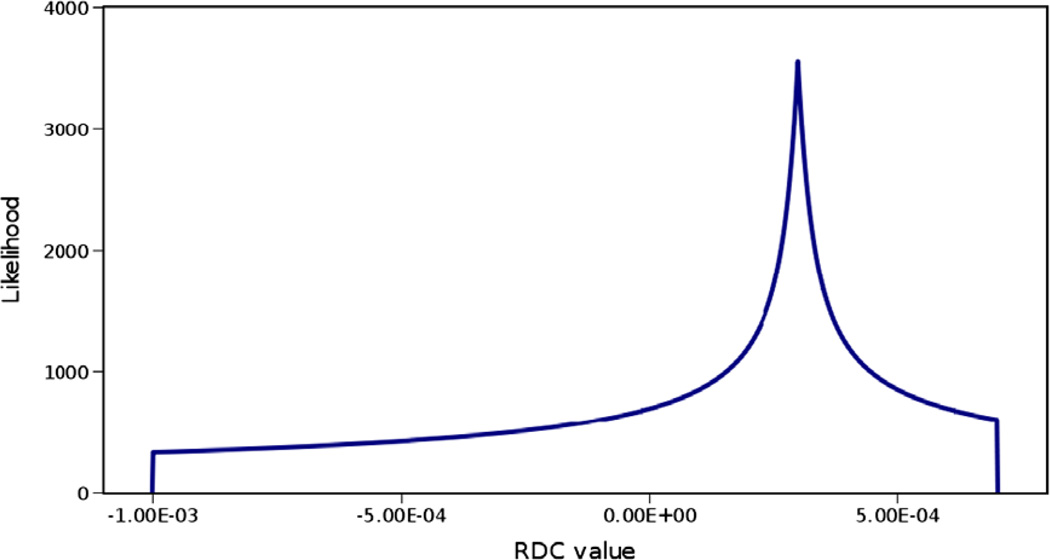
The probability density distribution of RDCs for an infinite number of uniformly distributed unit vectors converges to the powder pattern [39] shown in Fig. 4. A complete powder pattern can be used to estimate the two critical principal order parameters of the order tensor (), which correspond to the two extreme points of this distribution along the horizontal axis. Therefore in theory, observation of a powder pattern allows for estimation of the principal order parameters.
Fig. 4.
Sample powder pattern with principal order parameters of Sxx = 3E–4, Syy = 7E–4 and Szz = −1E–3. The horizontal axis in this figure represents values of RDC data and the vertical axis represents the likelihood of observing a given value of RDC.
This relationship has lead to numerous efforts [30,40] to estimate the values of principal order parameters from a large set of unassigned RDC data in a single alignment medium. In practice, however, due to the small size of the molecules amenable for study by NMR spectroscopy and a non-random distribution of vectors in space (imposed by the secondary structural elements), the results are often unreliable. As such, the powder patterns estimated from unassigned RDC data in a single medium can be quite skewed, as illustrated in Fig. 5. We utilize this form of generating estimates of the principal order parameters in order to prime our more elaborate search of the relative order tensors (discussed in Section 3.3). Due to the robustness of the approach, during the course of relative order tensor matrix estimation, any inaccurate estimates of the principal order parameters are corrected. Section 4.3 provides results that demonstrate the ability of the 2D-RDC analysis method to accurately reconstruct principal order parameters despite a grossly mis-estimated initial guess.
Fig. 5.
Distribution of simulated RDCs from the same protein (PDB code 1SF0) under different orientations and principal order parameters of Sxx = 3E–4, Syy = 7E–4 and Szz = −1E–3. The RDC data was generated using the program REDCAT.
3. Data and methods
3.1. Simulated and experimental data
In order to be able to test the accuracy of our methods, synthetic data was used so that the ground truth could be known for accurate evaluation of the results. N–H RDCs were calculated using the REDCAT program [22] for structures 1SF0, 1A4Y and 110M using the order tensors shown in Table 1. The theoretically generated data were then corrupted by the addition of ±1 Hz uniformly distributed error. Structures 1SF0 (68 residues), 110M (154 residues), and 1A4Y (460 residues) were chosen because they represent a range from small to large proteins.
Table 1.
The five elements needed to construct the order tensors used for simulating data.
| sxx | sxy | sxz | syy | syz | |
|---|---|---|---|---|---|
| S1 | 3.000E–04 | 0.000E+00 | 0.000E+00 | 5.000E–04 | 0.000E+00 |
| S2 | 1.066E–04 | 2.367E–04 | 3.603E–04 | −1.464E–04 | 4.323E–04 |
Artificially generated data can be very helpful during the evaluation and development phases of any computational method. However, the ultimate test of any analytical method should be its application to experimentally acquired data. Here we have utilized RDC data previously acquired for a 56 residue, immunoglobulin-G binding protein (PDB accession 1P7E), which were obtained from BMRB [41,42]. The backbone N–H RDC data from two alignments (Bicelle and PEG) in addition to the assignment of data and atomic coordinates were used to obtain the best order tensor solution using the program REDCAT [22]. During this process the molecular orientation was adjusted such that the molecular frame and the principal alignment frame of the anchor medium (Bicelle) coincided. The resulting best order tensors are listed in Table 2 for each of the two alignment media. Because of the missing data, only the vectors with data present in both alignment media were used (a total of 40 vectors). Order tensor matrices shown in Tables 1 and 2 have been used in Sections 4.1 and 4.3 to evaluate the success of our presented 2D-RDC analysis method.
Table 2.
The five elements of the relative order tensors for the protein 1P7E obtained from REDCAT.
| sxx | sxy | sxz | syy | syz | |
|---|---|---|---|---|---|
| S1 | 4.383E–04 | 0.00 | 0.00 | 8.846E–04 | 0.00 |
| S2 | 1.104E–04 | 7.635E–05 | 3.586E–04 | 4.514E–04 | −7.002E–05 |
3.2. Order tensor matrix distance metric
It is beneficial to develop a meaningful metric for quantifying the similarity between two given order tensor matrices. Development of such a metric becomes even more important within the context of the presented work in order to report the efficacy of our order tensor matrix estimation technique. A desirable metric should report the root-mean-square-deviation between the RDC data calculated from the two order tensors over all possible vectors. This metric can be formulated as shown in Eq. (8). This formulation reports the square root of the integral of the squared difference in RDC values over the surface of the unit sphere, normalized by the surface area of the unit sphere. The entity ν in Eq. (8) denotes any vector on the unit sphere and can be formulated as shown in Eq. (9).
| (8) |
| (9) |
Eq. (8) simplifies to the elegant closed-form shown in Eq. (10) below, where dij denotes the ijth element of the differential order tensor matrix D as defined in Eq. (11) below.
| (10) |
| (11) |
Although not proven here, this defines a metric space on the set of all order tensor matrices, so reflexivity, symmetry and the triangle inequality all hold. It is also important to note that Eq. (10) strongly resembles a previously reported GDO measurement [34,43].
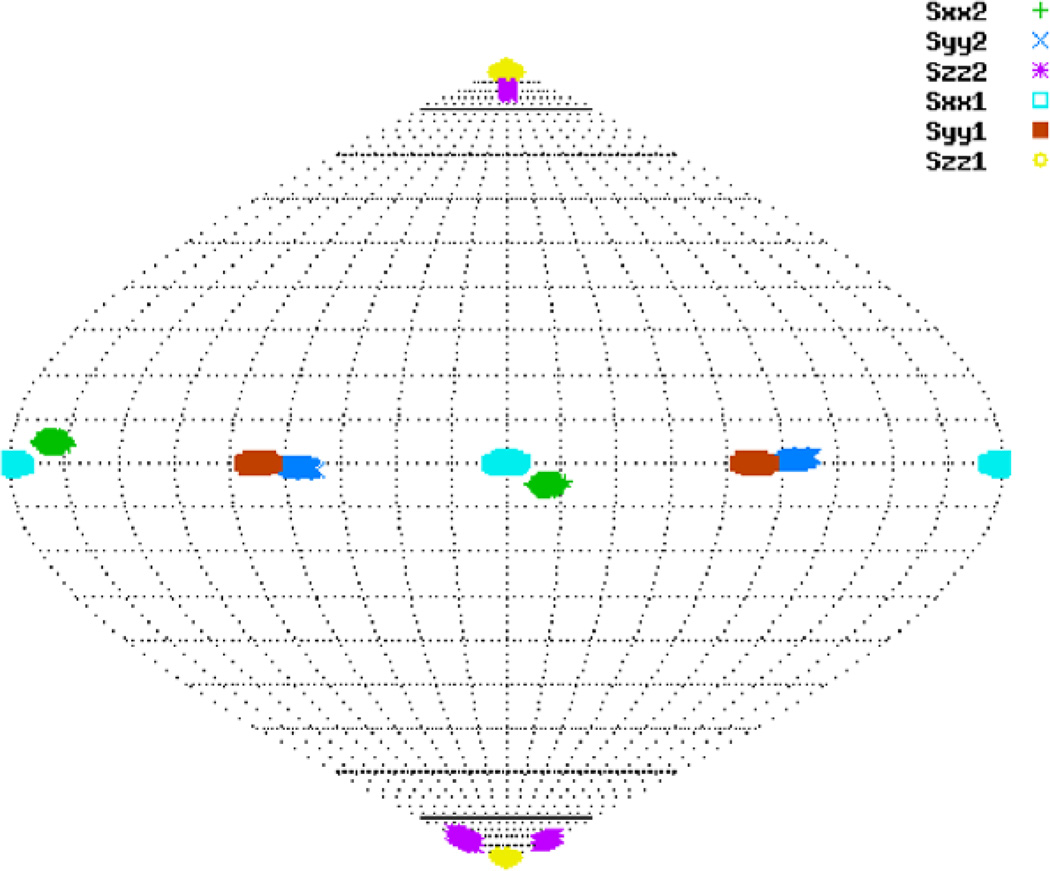
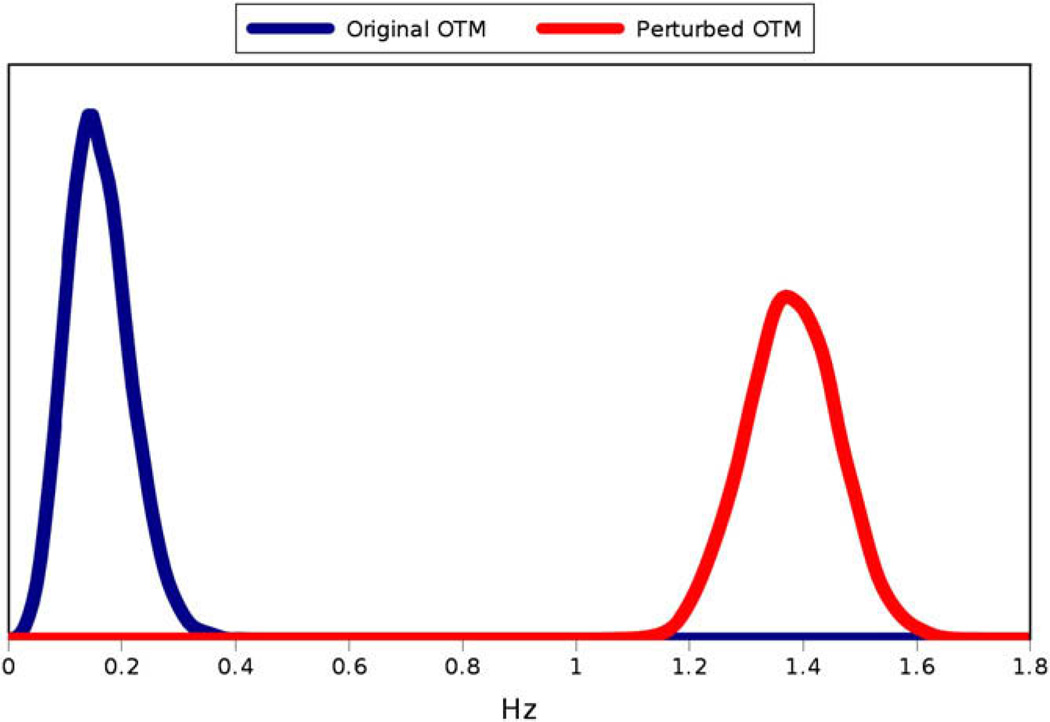
In order to demonstrate the sensitivity of this distance metric, synthetic RDC data with no error were generated for the protein 1SF0 in the program REDCAT [22] using an order tensor with principal order parameters (3E–4, 5E–4, −8E–4) and Euler angles (0,0,0). REDCAT was then used to generate a set of 10,000 order tensor estimates for data within ±1 Hz error of the synthetically generated data. Next, REDCAT was used to synthetically generate a second set of data with 0 Hz error for a slightly different order tensor matrix with the same principal order parameters and Euler angles of (5,5,10). Once again, 10,000 order tensors within ±1 Hz of the data were generated. Solutions are presented in the form of a Sauson-Flamsteed projection that plots the points at which axes of principal alignment frames of various solutions pierce the surface of a globe. The SF-plot of these two order tensor solution sets are shown in Fig. 6. Note that the two solution sets are quite close to one another. The distance between each order tensor in each of these two datasets and the original order tensor was calculated using Eq. (8) above. The distribution of these distances is shown in Fig. 7. Notice that despite the similarity of the two clusters of order tensors, the proposed distance metric is able to sharply discriminate between the two solution sets.
Fig. 6.
SF-plot for the order tensor solution sets for the original order tensor and the perturbed order tensor.
Fig. 7.
Distribution of distances between the original order tensor and the solution sets generated in REDCAT for the original and perturbed order tensor matrices.
Another way to conceptualize this distance metric is to note that D, the difference between S1 and S2, is symmetric and traceless and, therefore, also an order tensor matrix. M, therefore, is the square root of the expected value of the square of the RDCs measured in an alignment medium described by D. Since the expected value of the RDCs measured in any alignment medium is 0 (for an infinite number of vectors), M is equal to the standard deviation of the RDCs measured in an alignment medium described by D. From this point of view, the distance metric, M, is equal to the Generalized Degree of Order of D divided by the square root of five as defined in [43].
Considering D as an order tensor has additional advantages. If instead of being interested in the average error for a given estimate of an order tensor, one were interested in the distribution of errors, decomposing D into a rotation matrix and a principal order parameter matrix and plotting the corresponding powder pattern would provide those elements. Fig. 8 illustrates the powder pattern for the difference between the order tensor for the second alignment medium and its estimate from Section 4.1 for protein 110M. Notice that because the estimate was quite close and because the simulated noise was chosen from a distribution with mean zero, the powder pattern of the difference tensor, D, exhibits a rhombicity value of nearly 0.
Fig. 8.
Powder pattern for the difference tensor which represents the distribution of errors in RDC values predicted by the estimated order tensor.
3.3. Estimation of the relative order tensor matrices from λ-maps
The λ-map is parametrized by seven of the 10 variables needed for a full description of two order tensors. These seven parameters consist of three rotational parameters that relate the two principal alignment frames and four parameters that report the principal order parameters for each of the alignment media. The presented method of 2D order tensor estimation proceeds by a search over all seven parameters that results in the best match between the computed e-hull for those parameters and the e-hull obtained from the experimental data. The search procedure utilizes a minimization method based on the Levenberg–Marquardt Algorithm [44– 46] available with the Matlab optimization toolbox to converge to a solution for the seven variables describing a relative order tensor. Several initial estimates are used to seed the search and at the end the algorithm analyzes the resulting set of solutions to determine the optimal solution. The success of any optimization technique rests primarily on the careful selection of an objective function. In this case, one wishes to minimize the distance between the external hull of the experimental data and the external hull predicted by a given relative order tensor. In particular, we wish to find the relative order tensors that minimize the sum of the squared distance between each point on the external hull of the experimental data and the external hull of the λ-map. In order to do this, first several points on the external hull of the λ-map have to be identified. This set of points can then be treated as a polygon, and for each point on the external hull of the experimental data, the square of the minimum distance between it and the boundary of the polygon describing the exterior of the λ-map is found. The square root of the sum of these squared distances is then reported as the objective function value to be minimized.
The simplest method to generate a theoretical e-hull is to utilize the computed RDCs for a large number of random vectors (100,000) using the two order tensors. This large 2D-RDC data set can then be used as an approximation to the external hull of the λ-map. Although simple, this method for computing the external hull of a λ-map is computationally undesirable because only a small subset of the computed RDCs contribute to the definition of the e-hull. The time spent computing RDC values for the remaining vectors is lost. Alternately, we have developed a procedure that isolates the points on the e-hull of the λ-map precisely using the parameterization shown below. For each point on the external hull of the λ-map, let the parameter θ in Eq. (12) be the angle between the x-axis and the tangent to the external hull of the λ-map at that point. An artificial order tensor Snew is then calculated from S1 and S2 according to Eq. (12).
| (12) |
The eigenvectors of Snew are then calculated, and the eigenvector that corresponds to the smallest eigenvalue is then used to generate two values of RDCs using S1 and S2. This 2D-RDC point is guaranteed to be located on the e-hull of the corresponding λ-map defined by order tensors S1 and S2. If the parameter 0 is allowed to vary between 0 and 2π, then all points on the external hull will have been sampled. A full mathematical support for this parametrization is beyond the scope of this article and will be presented in detail at a later time. However, the important point to note is that the number of computed RDCs reduces by approximately two orders of magnitude from 100,000 to 1000.
Whenever one employs optimization techniques, it is wise to use multiple initialization seeds in order to reduce the algorithm’s susceptibility to entrapment in local minima. Since an initial estimate of the principal order parameters of the two order tensors can be determined by using 1D-RDC estimation techniques, our program was designed only to accept seeds for the three Euler angles dictating the relative orientation of the two alignment media. Although the starting seeds for the Euler angles can be dictated by the user, by default we utilize eight seeds where each of the α, β and γ angles are set to either π/4 or 3π/4. The optimized solutions obtained from each seed are evaluated and the solutions with the lowest final objective function values are clustered. During a significant portion of our trials, two distinct solution sets have been observed that satisfy the objective function equally well. This degeneracy in the solution space is discussed in the next section.
3.4. Degeneracy of relative order tensor representations
There are an infinite number of relative order tensors that describe the anisotropy of the molecular alignment for any pair of aligning media. Any viable pair of order tensors S1 and S2 can be transformed to produce an identical λ-map through any arbitrary rotation applied to both S1 and S2. The main source of this infinite degeneracy is the absence of a molecular frame as a point of reference for description of the anchor alignment frame; it is meaningless to speak of a predefined molecular frame in the absence of a structure. Since selection of the molecular frame is arbitrary and independent of the orientation of each order tensor, we adopt the convention that, without any loss of generality, the molecular frame is coincident with the principal alignment frame of the anchor medium. In addition, the principal axes of the alignment are labeled according to the convention where | Sxx1 |≤| Syy1 |≤| Szz1 [34]. Imposition of the above set of rules reduces the total number of solutions from an infinite to a finite set; this set, however, is not unique. While a rotation of the anchor system by 180° about the x, y or z axes will have no effect on the anchor order tensor, it will alter the value of S2 as illustrated in Eqs. (13)–Eqs. (15) below.
| (13) |
| (14) |
| (15) |
Therefore, any set of viable solutions S1 and S2 can be used to produce three additional sets of solutions through a simple rotation of 180° about the x, y and z axes of the anchor frame. The primary source of this ambiguity is the absence of any structure. Any altered set of S1, (where i indicates the axis about which rotation of 180° was performed) can produce the same indistinguishable e-hull by performing the same rotational operation to the set of vectors in space. This rotational ambiguity can be resolved by establishing the convention of changing the sign of to the product of the signs of and changing to their absolute values. This has the same net effect as applying these 180° rotations until of the second alignment medium are both positive.
Here we define two canonical order tensors as a set of relative order tensors after conformation to the following set of conventions:
The alignment tensor of the anchor medium is diagonalized.
Labeling of the alignment axes adhere to the previously defined convention of | Sxx1 |≤| Syy1 |≤| Szz1 |.
Signs of the terms are positive.
By establishing a canonical orientation of the molecular frame, each 2D-RDC system is ensured to be defined by a unique relative order tensor. After establishing the above set of conventions, we have observed the existence of two sets of different relative order tensors that produce indistinguishable λ-maps (to within the numerical precision of the algorithm). This phenomenon has not been previously reported and here we present evidence of their existence. Our algorithm has been modified to report both sets of solutions when present.
4. Results
4.1. Results of synthetic data
The results of 2D relative order tensor estimation in application to the synthetic data generated for structures 1SF0, 110M and 1A4Y are shown in Table 3. For each protein (1SF0, 110M, 1A4Y), a relative order tensor was estimated between media 1 and 2 with medium 1 treated as the anchor medium. The first entry in Table 3 lists the order tensors used for calculating the synthetic data. Fig. 9 displays these results visually by superimposing the e-hull corresponding to the actual order tensors in red, with the e-hull corresponding to the λ-map of the estimated order tensors in blue. The actual RDC data points calculated for each protein are displayed in green. Table 4 provides the M-scores calculated between the true order tensors and each corresponding estimated order tensor. Finally, Fig. 10 provides SF-plots of the true and estimated relative order tensors of the second alignment medium. These SF-plots are intended to serve as the means of developing a better sense of the sensitivity of the M-score.
Table 3.
Order tensor estimation results for 1SF0. The first two rows display the results of 2D estimation using media 1 and 2. The last two rows display the results of 2D estimation using media 1 and 3.
| Protein name |
Medium number |
sxx | sxy | sxz | syy | syz |
|---|---|---|---|---|---|---|
| Theoretical | S1 | 3.000E–04 | 0.000E+00 | 0.000E+00 | 5.000E–04 | 0.000E+00 |
| S2 | 1.066E–04 | 2.367E–04 | 3.603E–04 | −1.464E–04 | 4.323E–04 | |
| 1SF0 | S1 | 3.273E–04 | 0.000E+00 | 0.000E+00 | 5.324E–04 | 0.000E+00 |
| S2 | 9.407E–05 | 3.248E–04 | 3.407E–04 | −1.497E–04 | 4.588E–04 | |
| 110M | S1 | 2.734E–04 | 0.000E+00 | 0.000E+00 | 5.206E–04 | 0.000E+00 |
| S2 | 1.674E–04 | 2.301E–04 | 3.427E–04 | −1.664E–04 | 3.946E–04 | |
| 1A4Y | S1 | 2.907E–04 | 0.000E+00 | 0.000E+00 | 5.251E–04 | 0.000E+00 |
| S2 | 1.156E–04 | 2.433E–04 | 3.246E–04 | −1.490E–04 | 4.696E–04 |
Fig. 9.
For each relative order tensor estimate, the convex hull corresponding to the estimate is shown in blue, the convex hull corresponding to the true order tensors is shown in red, and the 2D-RDC points are shown in green. (For interpretation of the references to color in this figure legend, the reader is referred to the web version of this paper.)
Table 4.
Root mean squared difference in units of Hertz between the estimated and actual order tensor matrices for media 1 and 2 as defined in Section 3.1.
| 1SF0 | 110M | 1A4Y | |
|---|---|---|---|
| S1 | 0.6510 | 0.3043 | 0.2761 |
| S2 | 1.1960 | 0.8336 | 0.6633 |
Fig. 10.
SF-plots of the true and estimated relative order tensors for the second alignment medium.
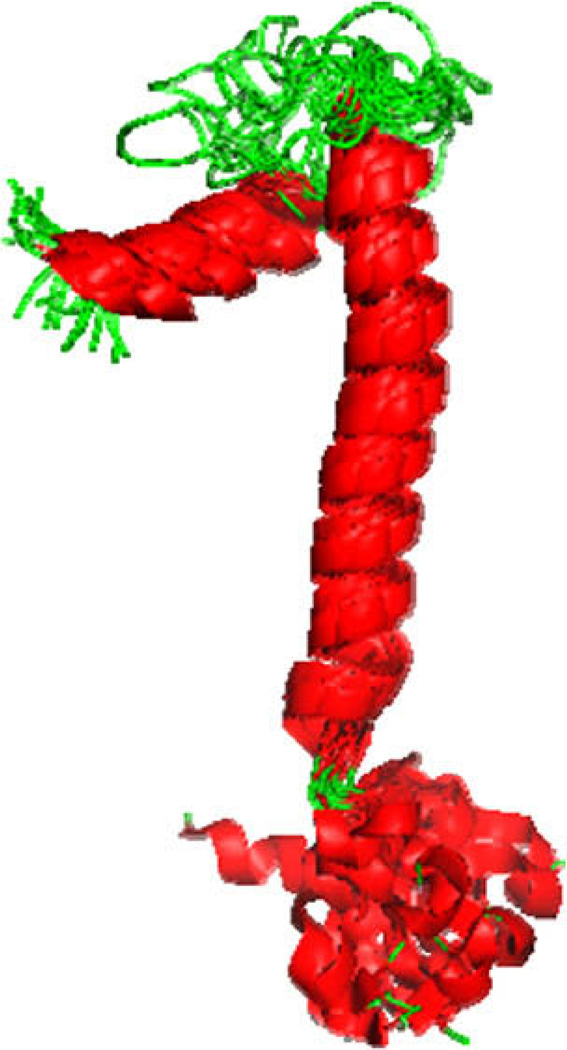
As anticipated, the estimates of the relative order tensors improve as a function of protein size. A larger protein will sample the RDC space more uniformly and provide a much better estimate of the actual λ-map and consequently the e-hull. It is therefore important to establish the efficacy of the methods to simple structural motifs that commonly appear in small membrane proteins. Namely, structures that consist of two helical segments perpendicularly oriented with respect to each other. In addition, we have taken this opportunity to establish the robustness of our method to varying levels of noise. We have utilized the structure of FXYD protein [3] (structure shown in Fig. 11) for this investigation and generated RDC data using the two order tensors defined in Section 3.1 with ±1, ±2 and ±3 Hz of error. An SF-plot illustrating results of the 2D-RDC method are shown in Fig. 12. The axes of the principal alignment frame of S2 are shown as large circles, and the location of the axes for each of these trials is plotted. As expected, although increased noise made the estimates worse, they were all tolerably close to the actual order tensor.
Fig. 11.
A ribbon illustration of the FXYD structure (PDB code 2J01).
Fig. 12.
SF-plot illustrating the orientational components of the estimates of S2 for protein FXYD with ±1 Hz, ±2 Hz and ±3 Hz simulated error. The circles represent the location of the axes of the actual PAF, and the outlier from each cluster corresponds to the estimation from the data with 3 Hz error.
In general, the results of the 2D-RDC based estimation of the relative tensors are nearly as accurate as order tensors obtained from REDCAT using structural information and assigned RDCs. An important feature of these results is the difference in quality between the estimate for the first order tensor and the second. This observation is a manifestation of the problem formulation. More specifically, S1 estimation is a function of only two variables (principal order parameters of the anchor alignment medium) in comparison to the five parameters that describe S2. Consequently, any residual orientational errors originating from S1 are forcibly absorbed by S2.
4.2. Degeneracy of relative order tensor solutions from λ-maps
Degeneracies of relative order tensor estimates related to symmetrical attributes of the RDC equations have been previously reported [31,38]. In Section 3.4, we introduced a number of conventions that collect and represent rotationally related sets of relative order tensors with a unique representative called the canonical relative order tensor. Furthermore, we have established that each relative order tensor that is represented by the same canonical relative order tensor has the same λ-map. However, we have not established that each λ-map corresponds to precisely one canonical relative order tensor. Observation has shown that for a given λ-map, there can be up to two canonical relative order tensor matrices that generate identical distributions. Reformulation of this problem as a constrained optimization problem and utilizing Lagrange multipliers can provide a rigorous mathematical approach to investigate this claim. Such a mathematical approach will be presented at some later time since it falls outside the scope of this report. In the meanwhile, we confirm this observation through an exhaustive search over all possible alpha, beta and gamma to ensure that there are indeed only two canonical relative order tensor estimates corresponding to a given λ-map.
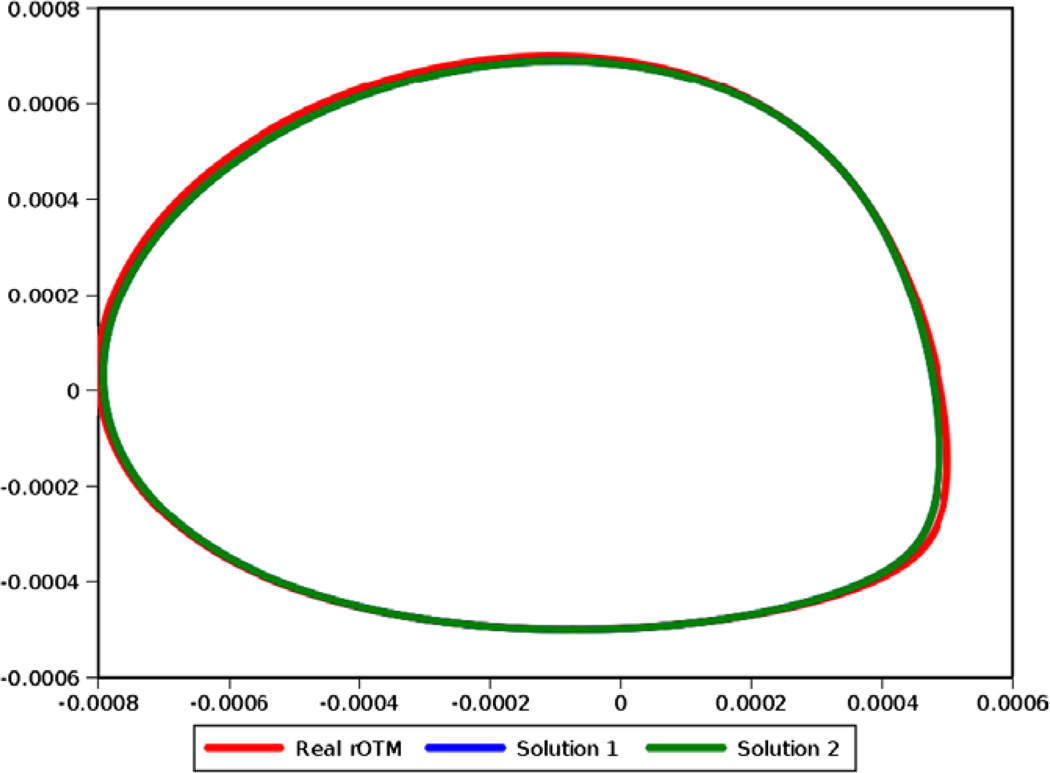
In this section only, we limit our work to ideal data with complete absence of noise in order to eliminate noise as the culprit for the observed ambiguity. Furthermore, our 2D-RDC method was modified to be seeded from an exhaustive set of Euler angles in order to eliminate entrapment in a local minimum. RDC data were generated with the order tensors shown in Table 1. Fig. 13 illustrates the theoretical λ-map (the e-hull illustrated in red) corresponding to those order tensors. 2D-RDC analysis produced canonical relative order tensors for each starting seed, which were then clustered and averaged. Cluster analysis showed two distinct solution sets whose canonical relative order tensors are shown in Table 5. These two clusters exhibited M-scores on the order of 10−3 Hz with respect to the average order tensor computed for each cluster. In addition, the two sets of solutions exhibited M-scores on the order of 10−2 and 4 Hz with respect to the true solution, respectively. Fig. 13 Provides an illustration of the external hulls corresponding to the average relative order tensor from each solution cluster. Note that these two external hulls are perfectly superimposed such that the external hull corresponding to solution 1 (in blue) is fully covered by the external hull of solution 2 (in green).
Fig. 13.
Three external hulls corresponding to the actual rOTM (red) and the two degenerate solutions. Note that the e-hull corresponding to the first solution (in blue) does is not visible because it is identical to the second solution (in green). (For interpretation of the references to color in this figure legend, the reader is referred to the web version of this paper.)
Table 5.
The two order tensor solutions corresponding to the λ-map corresponding to a given theoretical order tensor.
| Medium number | sxx | sxy | sxz | syy | syz | |
|---|---|---|---|---|---|---|
| Theoretical | S1 | 3.000E–04 | 0.000E+00 | 0.000E+00 | 5.000E–04 | 0.000E+00 |
| S2 | −2.974E–05 | 4.083E–04 | 6.273E–04 | −6.068E–05 | 4.398E–04 | |
| Solution 1 | S1 | 3.052E–04 | 0.000E+00 | 0.000E+00 | 4.873E–04 | 0.000E+00 |
| S2 | −2.44E–005 | 4.10E–004 | 6.25E–004 | −5.99E–005 | 4.37E–004 | |
| Solution 2 | S1 | 3.052E–04 | 0.000E+00 | 0.000E+00 | 4.873E–04 | 0.000E+00 |
| S2 | −2.44E–005 | 3.80E–004 | 4.98E–004 | −5.99E–005 | 5.97E–004 |
4.3. Results of experimental data
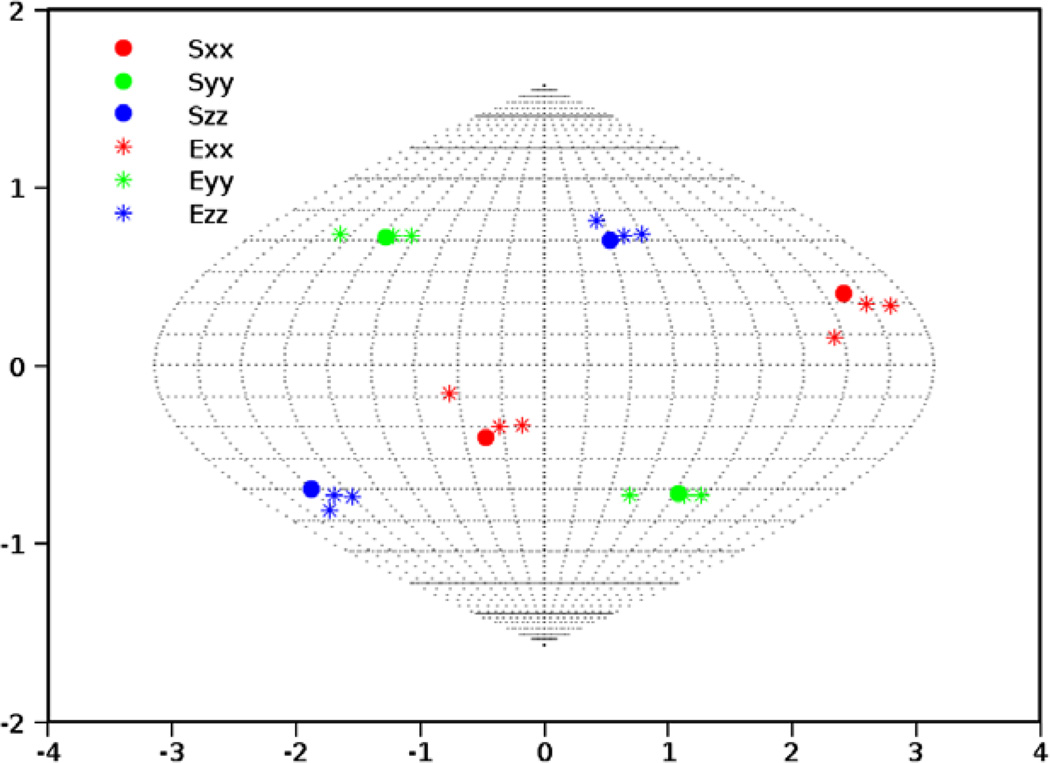
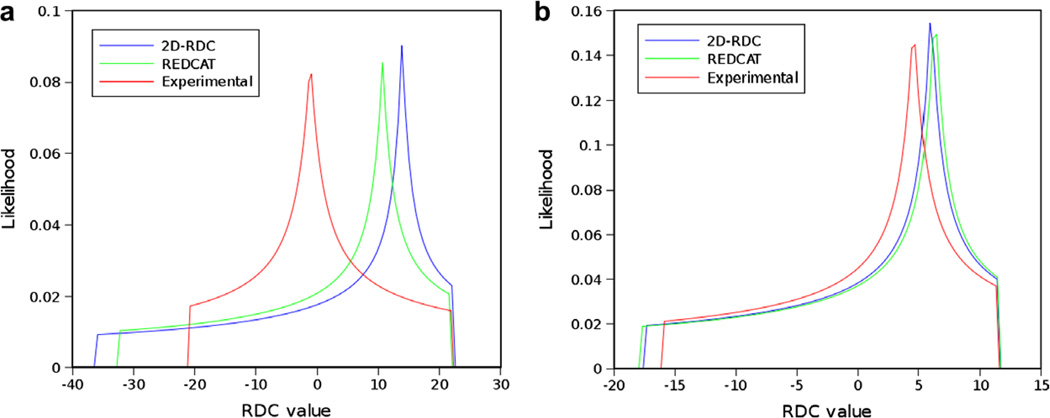
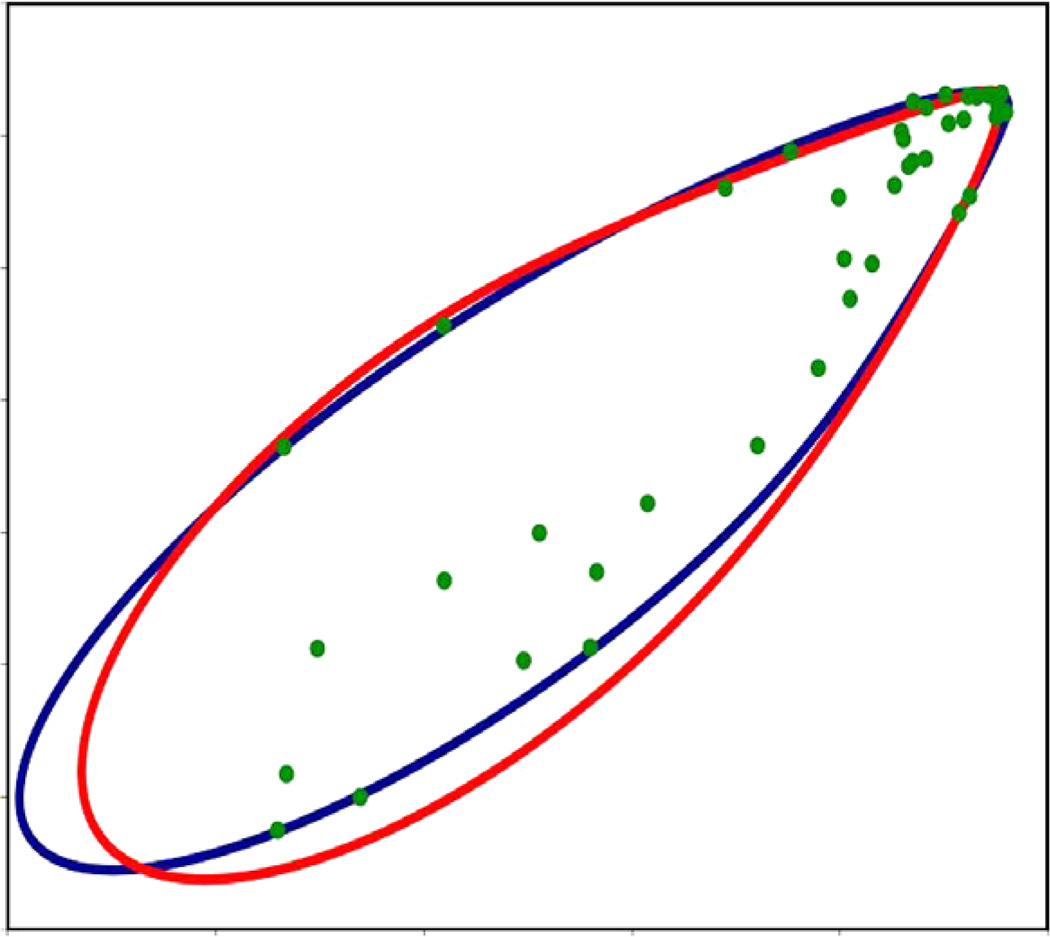
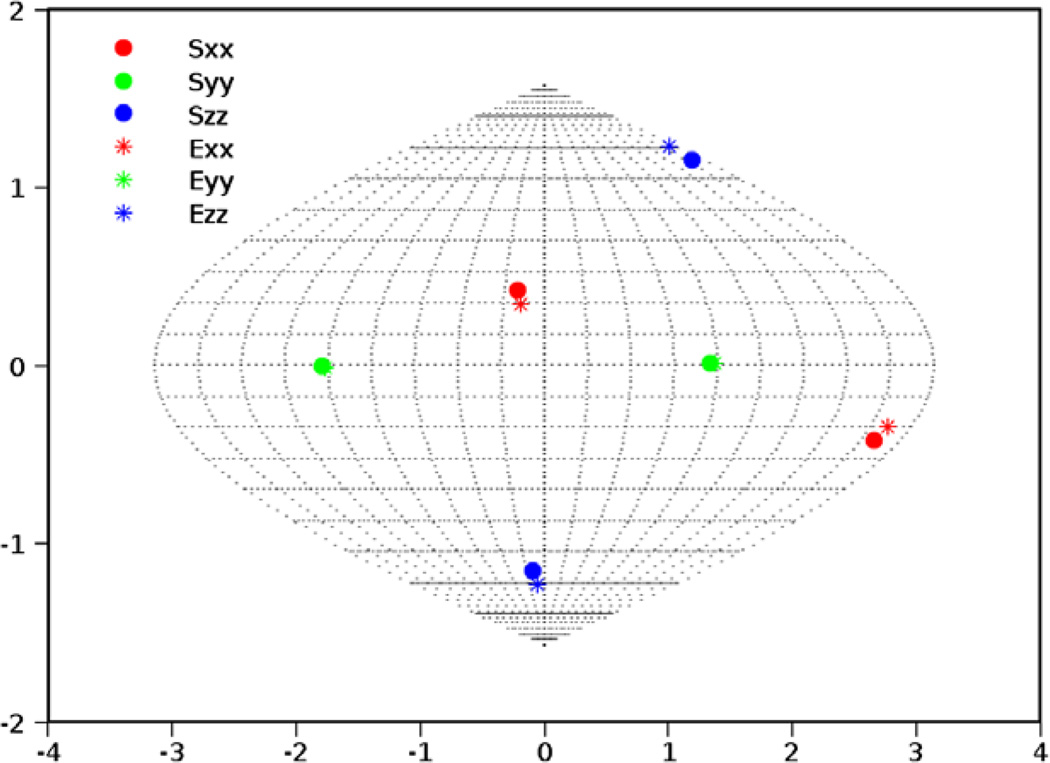
Experimental data provides unique challenges that are not normally present with simulated data. These include the true properties of random noise and, more importantly, the nature of missing data. Therefore as a final test of our method, we have used RDC data from protein 1P7E, the immunoglobulin-G binding domain of Protein G (GB3) [47] obtained from BMRB. This data is representative of the practical conditions of noisy data as well as an extreme case of missing data. Here only 40 RDC values were available for a 56 residue protein (~70% available data). The powder pattern based on the order parameters obtained from REDCAT using the structure and assignment of data is shown in Fig. 14 in green. The red powder pattern corresponds to the powder pattern with order parameters estimated from the extreme points of the experimental data. The powder pattern shown in blue is based on order parameters estimated from the 2D-RDC method. It is clear that the experimental data provides a limited sampling of the RDC space. Fig. 15 shows the results of the fitting of a λ-map hull to the e-hull of the data set. Despite the fact that much of the 2D-RDC distribution was not sampled by this small, well-ordered molecule, the order tensor estimates recorded in Table 6 and displayed in Fig. 16 are quite close to the estimates produced by REDCAT using the protein structure and assigned RDC data. Using the M-score distance metric from Section 3.2, these estimates were within 1.773 Hz RMSD for M1 and 1.713 Hz RMSD for M2.
Fig. 14.
Comparison of powder patterns obtained by using principal order parameters estimated by REDCAT (green), 2D-RDC (blue) and the extrema points of the experimental data (red) from Bicelle and PEG alignment media illustrated in panels (a) and (b), respectively. (For interpretation of the references to color in this figure legend, the reader is referred to the web version of this paper.)
Fig. 15.
Comparison of REDCAT order tensor estimate (in red) with 2D RDC order tensor estimate from λ-map fitting (in blue) of the 2D-RDC data (in green). (For interpretation of the references to color in this figure legend, the reader is referred to the web version of this paper.)
Table 6.
The five principal elements of the relative order tensors estimated for 1P7E by the method of λ-map analysis.
| sxx | sxy | sxz | syy | syz | |
|---|---|---|---|---|---|
| S1 | 5.690E–04 | 0.00 | 0.00 | 9.036E–04 | 0.00 |
| S2 | 1.567E–04 | 5.224E–05 | 3.053E–04 | 4.456E–04 | 4.493E–05 |
Fig. 16.
SF-plot of the orientational component of the anisotropy for the second alignment medium (PEG) of 1P7E. Sii and Eii indicate the principal axes of alignment reported by REDCAT and the 2D-RDC analysis, respectively.
5. Conclusion and discussion
Estimation of relative order tensors does suffer from degeneracy in the number of possible solutions. Any given e-hull corresponds to an infinite number of order tensor pairs, which can be reduced to up to eight solutions by using the conventions presented in Section 3.4. These eight possible solutions can further be clustered into sets of four solutions that are related to each other through a 180° rotation about the axes of the anchor alignment medium as discussed in Section 3.4. Our proposed convention further reduces each of these sets of four solutions into one canonical form which results in up to two possible rOTM solutions for each λ-map. The proposed convention of reducing a set of related rOTMs into only one may at first appear artificial and requires further explanation. In practice, selection of any of the four degenerate solutions is inconsequential because of the absence of a molecular structure. For example, any of the four degenerate solutions could be used for structure determination of an unknown protein with the final results differing only by a 180° rotation of the molecular frames. Selecting any member of the second cluster of solutions would, however, yield different structures. It is therefore advisable for the users to utilize both order tensors in their work and observe the effects. It is very likely that depending on the application, only one of the relative order tensors will produce an acceptable result. The final point to note is that in some instances a second cluster of solutions does not exist. The exact relationship and the nature of these two solutions is not currently known. However, both order parameters and orientational components of anisotropy play a role in their existence.
Aside from the clear information content of λ-maps, the presented estimation of an rOTM exhibits distinct advantages over the previously presented method. The previous method suffers from reliance on accurate estimates of the Da and Dr components of anisotropy; these entities are likely to be poorly estimated from simply observing the minimum and maximum values of the RDC data. Furthermore, the presented method is a far more efficient approach than the previously presented exhaustive approach of exploring all possible orientations through a grid search. Our implementation further optimizes the computation time by eliminating the need for the numerical calculation of RDC data for a large number of vectors (100,000). The new approach presented in this article limits calculation of the RDC data to a much smaller subset of vectors (1000) corresponding to points along the e-hull of the λ-map. This more efficient approach alone has a significant impact on the execution time of our presented method.
Early estimation of the rOTM from unassigned RDC data in the absence of a structure can be of great benefit in a number of endeavors. The presented method of accurately estimating the rOTM can provide far more information, with significantly higher reliability and fault tolerance, than two independent analyses of 1D-RDC data sets using powder patterns. Estimation of relative order tensors can potentially lead to more straightforward and effective structure determination of macromolecules while reducing the amount of data required. Estimation of the rOTM from two separate domains of a system of molecules can provide an assessment of relative internal motion in the complete absence of any structural information. Estimation of the rOTM with the scattering pattern of RDC data points within a λ-map can be envisioned to lead to reliable methods of identifying structural homologues from a library of structures or validation of a computed structure without the need for the costly step of data assignment. Finally, rOTM estimation bridges the gap for gradual extraction of information in transition from 1D to higher dimensional data (such as RDC data from three or more alignment media), which have been the subject of recent developments [13–15].
Acknowledgments
This work has been funded by NSF Grant number MCB-0644195 and Grant number 1R01GM081793 from National Institutes of Health to Dr. Homayoun Valafar.
References
- 1.Opella SJ, Nevzorov A, Mesleh MF, Marassi FM. Structure determination of membrane proteins by NMR spectroscopy. Biochemistry and Cell Biology-Biochimie Et Biologie Cellulaire. 2002;80:597–604. doi: 10.1139/o02-154. [DOI] [PMC free article] [PubMed] [Google Scholar]
- 2.Opella SJ, Marassi FM. Structure determination of membrane proteins by NMR spectroscopy. Chemical Reviews. 2004;104:3587–3606. doi: 10.1021/cr0304121. [DOI] [PMC free article] [PubMed] [Google Scholar]
- 3.Franzin CM, Gong X, Teriete P, Marassi FM. Structures of the FXYD regulatory proteins in lipid micelles and membranes. Journal of Bioenergetics and Biomembranes. 2007;39:379–383. doi: 10.1007/s10863-007-9105-y. [DOI] [PMC free article] [PubMed] [Google Scholar]
- 4.Gong X, Franzin CM, Thai K, Yu J, Marassi FM. Nuclear magnetic resonance structural studies of membrane proteins in micelles and bilayers. Methods in Molecular Biology. 2007;400:515–529. doi: 10.1007/978-1-59745-519-0_35. [DOI] [PMC free article] [PubMed] [Google Scholar]
- 5.Umemoto K, Leffler H, Venot A, Valafar H, Prestegard JH. Conformational differences in liganded and unliganded states of Galectin-3. Biochemistry. 2003;42:3688–3695. doi: 10.1021/bi026671m. [DOI] [PubMed] [Google Scholar]
- 6.Azurmendi HF, Martin-Pastor M, Bush CA. Conformational studies of Lewis X and Lewis A trisaccharides using NMR residual dipolar couplings. Biopolymers. 2002;63:89–98. doi: 10.1002/bip.10015. [DOI] [PubMed] [Google Scholar]
- 7.Azurmendi HF, Bush CA. Conformational studies of blood group A and blood group B oligosaccharides using NMR residual dipolar couplings. Carbohydrate Research. 2002;337:905–915. doi: 10.1016/s0008-6215(02)00070-8. [DOI] [PubMed] [Google Scholar]
- 8.Tjandra N, Tate S, Ono A, Kainosho M, Bax A. The NMR structure of a DNA dodecamer in an aqueous dilute liquid crystalline phase. Journal of the American Chemical Society. 2000;122:6190–6200. [Google Scholar]
- 9.Vermeulen A, Zhou HJ, Pardi A. Determining DNA global structure and DNA bending by application of NMR residual dipolar couplings. Journal of the American Chemical Society. 2000;122:9638–9647. [Google Scholar]
- 10.Al-Hashimi HM, Gosser Y, Gorin A, Hu WD, Majumdar A, Patel DJ. Concerted motions in HIV-1 TAR RNA may allow access to bound state conformations: RNA dynamics from NMR residual dipolar couplings. Journal of Molecular Biology. 2002;315:95–102. doi: 10.1006/jmbi.2001.5235. [DOI] [PubMed] [Google Scholar]
- 11.Al-Hashimi HM, Pitt SW, Majumdar A, Xu WJ, Patel DJ. Mg2+-induced variations in the conformation and dynamics of HIV-1 TAR RNA probed using NMR residual dipolar couplings. Journal of Molecular Biology. 2003;329:867–873. doi: 10.1016/s0022-2836(03)00517-5. [DOI] [PMC free article] [PubMed] [Google Scholar]
- 12.Bryson M, Tian F, Prestegard JH, Valafar H. REDCRAFT: a tool for simultaneous characterization of protein backbone structure and motion from RDC data. Journal of Magnetic Resonance. 2008;191:322–334. doi: 10.1016/j.jmr.2008.01.007. [DOI] [PMC free article] [PubMed] [Google Scholar]
- 13.Yao L, Vögeli B, Torchia DA, Bax A. Simultaneous NMR study of protein structure and dynamics using conservative mutagenesis. Journal of Physical Chemistry B. 2008;112:6045–6056. doi: 10.1021/jp0772124. [DOI] [PubMed] [Google Scholar]
- 14.Ruan K, Briggman KB, Tolman JR. De novo determination of internuclear vector orientations from residual dipolar couplings measured in three independent alignment media. Journal of Biomolecular NMR. 2008;41:61–76. doi: 10.1007/s10858-008-9240-8. [DOI] [PMC free article] [PubMed] [Google Scholar]
- 15.Miao X, Mukhopadhyay R, Valafar H. Estimation of relative order tensors, and reconstruction of vectors in space using unassigned RDC data and its application. Journal of Magnetic Resonance. 2008;194:202–211. doi: 10.1016/j.jmr.2008.07.005. [DOI] [PMC free article] [PubMed] [Google Scholar]
- 16.Miao X, Waddell PJ, Valafar H. TALI: local alignment of protein structures using backbone torsion angles. Journal of Bioinformatics and Computational Biology. 2008;6:163–181. doi: 10.1142/s0219720008003370. [DOI] [PubMed] [Google Scholar]
- 17.Valafar H, Prestegard JH. Rapid classification of a protein fold family using a statistical analysis of dipolar couplings. Bioinformatics. 2003;19:1549–1555. doi: 10.1093/bioinformatics/btg201. [DOI] [PubMed] [Google Scholar]
- 18.Bansal S, Miao X, Adams MWW, Prestegard JH, Valafar H. Rapid classification of protein structure models using unassigned backbone RDCs and probability density profile analysis (PDPA) Journal of Magnetic Resonance. 2008;192:60–68. doi: 10.1016/j.jmr.2008.01.014. [DOI] [PMC free article] [PubMed] [Google Scholar]
- 19.Lakomek NA, Carlomagno T, Becker S, Griesinger C, Meiler J. A thorough dynamic interpretation of residual dipolar couplings in ubiquitin. Journal of Biomolecular NMR. 2006;34:101–115. doi: 10.1007/s10858-005-5686-0. [DOI] [PubMed] [Google Scholar]
- 20.Bouvignies G, Bernadó P, Meier S, Cho K, Grzesiek S, Brüschweiler R, Blackledge M. Identification of slow correlated motions in proteins using residual dipolar and hydrogen-bond scalar couplings. Proceedings of the National Academy of Science USA. 2005;102:13885–13890. doi: 10.1073/pnas.0505129102. [DOI] [PMC free article] [PubMed] [Google Scholar]
- 21.Hus J, Peti W, Griesinger C, Brüschweiler R. Self-consistency analysis of dipolar couplings in multiple alignments of ubiquitin. Journal of the American Chemical Society. 2003;125:5596–5597. doi: 10.1021/ja029719s. [DOI] [PubMed] [Google Scholar]
- 22.Valafar H, Prestegard JH. REDCAT: a residual dipolar coupling analysis tool. Journal of Magnetic Resonance. 2004;167:228–241. doi: 10.1016/j.jmr.2003.12.012. [DOI] [PubMed] [Google Scholar]
- 23.Losonczi JA, Andrec M, Fischer MWF, Prestegard JH. Order matrix analysis of residual dipolar couplings using singular value decomposition. Journal of Magnetic Resonance. 1999;138:334–342. doi: 10.1006/jmre.1999.1754. [DOI] [PubMed] [Google Scholar]
- 24.Valafar H, Mayer K, Bougault C, LeBlond P, Jenney F, Brereton P, Adams M, Prestegard J. Backbone solution structures of proteins using residual dipolar couplings: application to a novel structural genomics target. Journal of Structural and Functional Genomics. 2005;5:241–254. doi: 10.1007/s10969-005-4899-5. [DOI] [PMC free article] [PubMed] [Google Scholar]
- 25.Prestegard J, Mayer K, Valafar H, Benison G. Determination of protein backbone structures from residual dipolar couplings. Methods in Enzymology. 2005;394:175–209. doi: 10.1016/S0076-6879(05)94007-X. [DOI] [PMC free article] [PubMed] [Google Scholar]
- 26.Schwieters CD, Kuszewski JJ, Tjandra N, Clore GM. The Xplor-NIH NMR molecular structure determination package. Journal of Magnetic Resonance. 2003;160:65–73. doi: 10.1016/s1090-7807(02)00014-9. [DOI] [PubMed] [Google Scholar]
- 27.Hus JC, Marion D, Blackledge M. Determination of protein backbone structure using only residual dipolar couplings. Journal of the American Chemical Society. 2001;123:1541–1542. doi: 10.1021/ja005590f. [DOI] [PubMed] [Google Scholar]
- 28.Blackledge M. Recent progress in the study of biomolecular structure and dynamics in solution from residual dipolar couplings. Progress in Nuclear Magnetic Resonance Spectroscopy. 2005;46:23–61. [Google Scholar]
- 29.Miao X, Mukhopadhyay R, Valafar H. Estimation of relative order tensors, and reconstruction of vectors in space using unassigned RDC data and its application. Journal of Magnetic Resonance. 2008;194(2):202–211. doi: 10.1016/j.jmr.2008.07.005. [DOI] [PMC free article] [PubMed] [Google Scholar]
- 30.Warren JJ, Moore PB. A maximum likelihood method for determining D(a)(PQ) and R for sets of dipolar coupling data. Journal of Magnetic Resonance. 2001;149:271–275. doi: 10.1006/jmre.2001.2307. [DOI] [PubMed] [Google Scholar]
- 31.Nomura K, Kainosho M. Graphical analysis of the relative orientation of molecular alignment tensors for a protein dissolved in two different anisotropic media. Journal of Magnetic Resonance. 2002;154:146–153. doi: 10.1006/jmre.2001.2470. [DOI] [PubMed] [Google Scholar]
- 32.Cavanagh J, Fairbrother WJ, Palmer AG, Rance M, Skelton NJ. Protein NMR Spectroscopy: Principles and Practice. second ed. Academic Press; 2007. [Google Scholar]
- 33.Levitt MH. Spin Dynamics: Basics of Nuclear Magnetic Resonance. Wiley; 2008. [Google Scholar]
- 34.Prestegard JH, Al-Hashimi HM, Tolman JR. NMR structures of biomolecules using field oriented media and residual dipolar couplings. Quarterly Reviews of Biophysics. 2000;33:371–424. doi: 10.1017/s0033583500003656. [DOI] [PubMed] [Google Scholar]
- 35.Bax A. Weak alignment offers new NMR opportunities to study protein structure and dynamics. Protein Science. 2003;12:1–16. doi: 10.1110/ps.0233303. [DOI] [PMC free article] [PubMed] [Google Scholar]
- 36.Press W, Teukolsky SA, Vetterling WT, Flannery BP. Numerical Recipes in C, The Art of Scientific Computing. 2002. [Google Scholar]
- 37.Saupe A, Englert G. High-resolution nuclear magnetic resonance spectra of orientated molecules. Physical Review Letters. 1963;11:462–464. [Google Scholar]
- 38.Al-Hashimi HM, Valafar H, Terrell M, Zartler ER, Eidsness MK, Prestegard JH. Variation of molecular alignment as a means of resolving orientational ambiguities in protein structures from dipolar couplings. Journal of Magnetic Resonance. 2000;143:402–406. doi: 10.1006/jmre.2000.2049. [DOI] [PubMed] [Google Scholar]
- 39.Varner SJ, Vold RL, Hoatson GL. An efficient method for calculating powder patterns. Journal of Magnetic Resonance Series A. 1996;123:72–80. doi: 10.1006/jmra.1996.0215. [DOI] [PubMed] [Google Scholar]
- 40.Clore GM, Gronenborn AM, Bax A. A robust method for determining the magnitude of the fully asymmetric alignment tensor of oriented macromolecules in the absence of structural information. Journal of Magnetic Resonance. 1998;133:216–221. doi: 10.1006/jmre.1998.1419. [DOI] [PubMed] [Google Scholar]
- 41.Doreleijers JF, Mading S, Maziuk D, Sojourner K, Yin L, Zhu J, Markley JL, Ulrich EL. BioMagResBank database with sets of experimental NMR constraints corresponding to the structures of over 1400 biomolecules deposited in the Protein Data Bank. Journal of Biomolecular NMR. 2003;26:139–146. doi: 10.1023/a:1023514106644. [DOI] [PubMed] [Google Scholar]
- 42.Ulrich EL, Akutsu H, Doreleijers JF, Harano Y, Ioannidis YE, Lin J, Livny M, Mading S, Maziuk D, Miller Z, Nakatani E, Schulte CF, Tolmie DE, Kent Wenger R, Yao H, Markley JL. BioMagResBank. Nucleic Acids Research. 2008;36:D402–D408. doi: 10.1093/nar/gkm957. [DOI] [PMC free article] [PubMed] [Google Scholar]
- 43.Tolman JR, Al-Hashimi HM, Kay LE, Prestegard JH. Structural and dynamic analysis of residual dipolar coupling data for proteins. Journal of the American Chemical Society. 2001;123:1416–1424. doi: 10.1021/ja002500y. [DOI] [PubMed] [Google Scholar]
- 44.Levenberg K. A method for the solution of certain problems in least-squares. Quarterly Applied Math. 1944;2:164–168. [Google Scholar]
- 45.Coleman TF, Li Y. On the convergence of interior-reflective Newton methods for nonlinear minimization subject to bounds. Mathematical Programming. 1994;67:189–224. [Google Scholar]
- 46.Dennis JE., Jr . Nonlinear least squares and equations. In: Jacobs D, editor. The State of the Art of Numerical Analysis. Orlando, Fla: Academic Press; 1977. pp. 269–312. [Google Scholar]
- 47.Ulmer TS, Ramirez BE, Delaglio F, Bax A. Evaluation of backbone proton positions and dynamics in a small protein by liquid crystal spectroscopy. Journal of the American Chemical Society. 2003;125:9179–9191. doi: 10.1021/ja0350684. [DOI] [PubMed] [Google Scholar]


