Abstract
Background
Interpretation and analysis of electroencephalography (EEG) measurements relies on the correspondence of electrode scalp coordinates to structural and functional regions of the brain.
New Method
An algorithm is introduced for automatic calculation of the International 10–20, 10-10, and 10-5 scalp coordinates of EEG electrodes on a boundary element mesh of a human head. The EEG electrode positions are then used to generate parcellation regions of the cerebral cortex based on proximity to the EEG electrodes.
Results
The scalp electrode calculation method presented in this study effectively and efficiently identifies EEG locations without prior digitization of coordinates. The average of electrode proximity parcellations of the cortex were tabulated with respect to structural and functional regions of the brain in a population of 20 adult subjects.
Comparison with Existing Methods
Parcellations based on electrode proximity and EEG sensitivity were compared. The parcellation regions based on sensitivity and proximity were found to have 44.0 ± 11.3% agreement when demarcated by the International 10–20, 32.4 ± 12.6% by the 10-10, and 24.7 ± 16.3% by the 10-5 electrode positioning system.
Conclusions
The EEG positioning algorithm is a fast and easy method of locating EEG scalp coordinates without the need for digitized electrode positions. The parcellation method presented summarizes the EEG scalp locations with respect to brain regions without computation of a full EEG forward model solution. The reference table of electrode proximity versus cortical regions may be used by experimenters to select electrodes that correspond to anatomical and functional regions of interest.
Keywords: Electroencephalography, electrode positioning, brain parcellation, EEG forward model
1. Introduction
The correspondence of electroencephalography (EEG) electrodes placed on the scalp to anatomical and functional regions of the cortex is important for the interpretation of EEG data. Several studies have investigated the correlation of electrode locations and cortical regions using projection techniques (Koessler et al., 2009), or spherical best-fitting techniques (Towle et al., 1993). These techniques involve time-consuming processes and their computation requires prior knowledge of the three-dimensional location of electrode scalp coordinates that are obtained using position digitizers or specialized electrodes (Koessler et al., 2008). We present a method for automatically obtaining the electrode positions from an anatomical MRI without prior markers of any kind.
Scalp electrode locations have been standardized by the International 10–20 positioning system to aid in the interpretation of the results obtained with EEG, providing neuro-anatomical correspondence and permitting intra and inter-subject comparisons of the signals (Towle et al., 1993). Using a standardized system also allows for systematic tomographic evaluations of the measurements and comparison of the results with other modalities (Jurcak et al., 2005; Tsuzuki et al., 2007). Specific and reproducible standards allow for comparison of results between subjects or across multiple studies performed by different investigators or at different times. Furthermore, standardized procedures permit technology and methods to advance while maintaining the ability to compare with prior results following published guidelines (Gasser et al., 1985).
Just as it is necessary to have accurate and precise positioning of electrodes on a subject’s head, it is also desirable to know the electrode positions for analysis of the data. Knowing the positions of the electrodes is needed for computation of the EEG forward model. In the present work we introduce an algorithm for systematically calculating the scalp coordinates of the EEG electrodes in three-dimensional space on a boundary element mesh of a human head. The process for placing EEG locations on the head described by the International Federation leaves some geometric ambiguities, particularly in the selection of preauricular positions, which are addressed in the present work as is required when implementing a computer-based geometric Specification algorithm. We also discuss the solutions we use in our algorithm with respect to the methods chosen by Jurcak et al. (2005) when addressing this same topic.
EEG source localization reveals the brain regions where the cortical activity originates. Knowing the location of the originating activity further benefits from prior knowledge about the function of the anatomical structures involved in order to provide a basis for interpretation of the signals. Towards this end, structural and functional parcellations map out the different regions of the brain (Desikan et al., 2006; Destrieux et al., 2010; Fischl et al., 2004; Yeo et al., 2011; Goulas et al., 2012; Bohland et al., 2009). Another perspective on interpretation of cortical activity is through maps of connectivity between brain regions. Functional connectivity mapping is performed through stimulation of brain regions coupled with functional neuroimaging (Paus et al., 1997; Sack, 2006; Pascual-Leone et al., 2000). Advancements in structural and functional maps of the brain will continue to improve the interpretation of EEG signals. We examine the correspondence of automatically obtained EEG scalp coordinates with structural and functional regions of the brain.
When the International Federation of Clinical Neurophysiology introduced the 10–20 electrode positioning system, one of the recommendations proposed was that locations should be reported in terms of the brain regions that they monitor, rather than their nomenclature, to aid the scientific community in understanding the measurements (Klem et al., 1999). In order to accomplish this aim, the areas of the brain to which each electrode is sensitive must be known (Rush and Driscoll, 1969).
Accurate source localization requires solving the EEG forward and inverse problems (Hallez et al., 2007). The forward model for EEG results in cortical sensitivity maps for each electrode. If the inverse problem is solved as well, it is then possible to calculate tomographic maps of brain activation from the EEG signals and to localize neural current sources as dipoles. The forward and inverse problems are commonly solved when analyzing EEG data because of the topographical information that can be obtained and because such results are more informative and enlightening than the EEG signals on their own (Michel et al., 2004). Despite the advantages of computing the forward and inverse models for EEG, it can be complex and time consuming to process and interpret.
In this study we present a new algorithm to calculate EEG electrode scalp coordinates on head meshes that utilizes methods that improve on previous techniques by resolving ambiguities and by adding accuracy to the procedures. The algorithm we developed uses similar methods as those presented by Jurcak et al. (2005) but utilizes more information available in head meshes to improve the accuracy of the resulting coordinates. Also, we consider cortical parcellations based on proximity as a simple method of communicating the anatomical and functional correspondences of EEG electrodes. The core concept of our study is the analysis of the correspondence between proximity-based parcellations of the cortex – computed with newly formulated algorithms – and Freesurfer1-based anatomical and functional parcellations of the cortex (Fischl, 2012).
The utility of proximity parcellations is evaluated through comparisons with electrode sensitivity maps that are obtained by solving the forward model. Next we examine the average intersection of proximity cortical parcellation regions with functional and structural parcellation regions of the cortex in 20 human subjects. These intersections are presented as look-up tables that provide information about which brain structures and functional regions are proximal to electrodes in the 10–20, 10-10, and 10-5 positioning systems. The method we employ finds a corresponding electrode to all superficial structural regions of the cortex, consequently providing more information than previous studies (Koessler et al., 2009; Okamoto et al., 2004). The analysis we performed with our new algorithm on anatomical regions was also carried out on functional regions, which has not been previously studied. This tabulated information could be used for example by researchers to determine which electrodes to include when examining functional networks, by clinicians to select electrode locations for chronic monitoring, or in the design of EEG brain-computer interfaces where it is desirable to minimize the number of active electrodes that are needed. In addition, the methods introduced in this study are consistent with the recommendations for systematic EEG electrode placement and communication in terms of the brain regions that correspond to electrodes.
2. Methods
2.1. EEG Electrode Positioning Algorithm
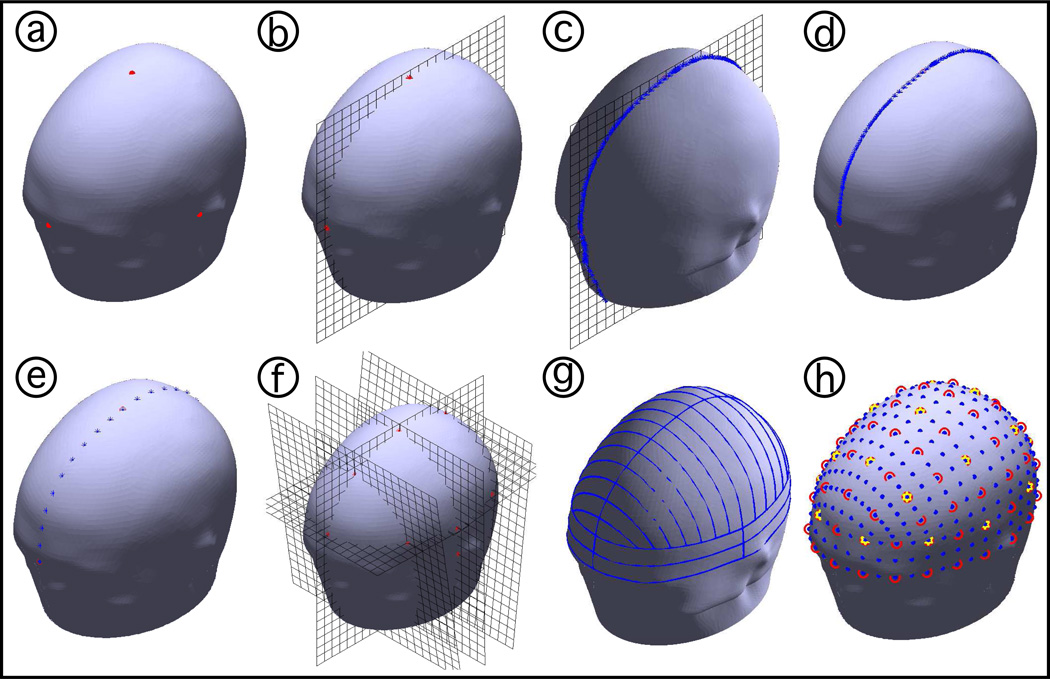
The EEG positioning algorithm was implemented in Matlab2. It begins with a user-supplied boundary-element mesh of a head. Fiducial positions on the head (inion, nasion, left and right preauricular points) are then identified by the user in the digital model in a similar manner as how they would be physically identified on a person (figure 2.a). There are some ambiguities in the identification of the fiducial positions, particularly the preauricular points, and have a definite impact on the resulting coordinates for the entire set of EEG locations (Jurcak et al., 2007). Our algorithm uses preauricular positions placed at the dent between the upper edge of the targus and the daith, as this position was determined by Jurcak et al. (2007) as the most stable preauricular location. Also, the algorithm sets the left and right preauricular positions to correspond to EEG positions T9 and T10, respectively. The algorithm uses only these four fiducial points to generate the 10-5 positions on arcs that follow the contours of the scalp in the same manner as is done in physical practice (Jurcak et al., 2007; Oostenveld and Praamstra, 2001). The outputs are 19 positions for the International 10–20 positioning system, 81 for the 10-10 system, and 329 for the 10-5 system.
Figure 2.
Illustration of the EEG positioning computational process. a) The algorithm starts with a 3D surface mesh of the head and fiducial positions identified by the user. b) The plane that intersects the mesh at those positions is found. c) The intersection points between the plane and the mesh are calculated. d) The subset of points that delimit the arc are identified. e) The positions at the specified percentages (5% for the case of the 10-5 positioning system) are calculated. f) The points that delimit new arcs from previously calculated points are identified and the process repeats for the new arcs. g) All the arcs necessary to calculate all 10-5 positions are found. h) With this method, all three sets of positions can be calculated, where blue dots show the 10-5, red circles show the 10-10 system, and yellow stars show the 10–20 system.
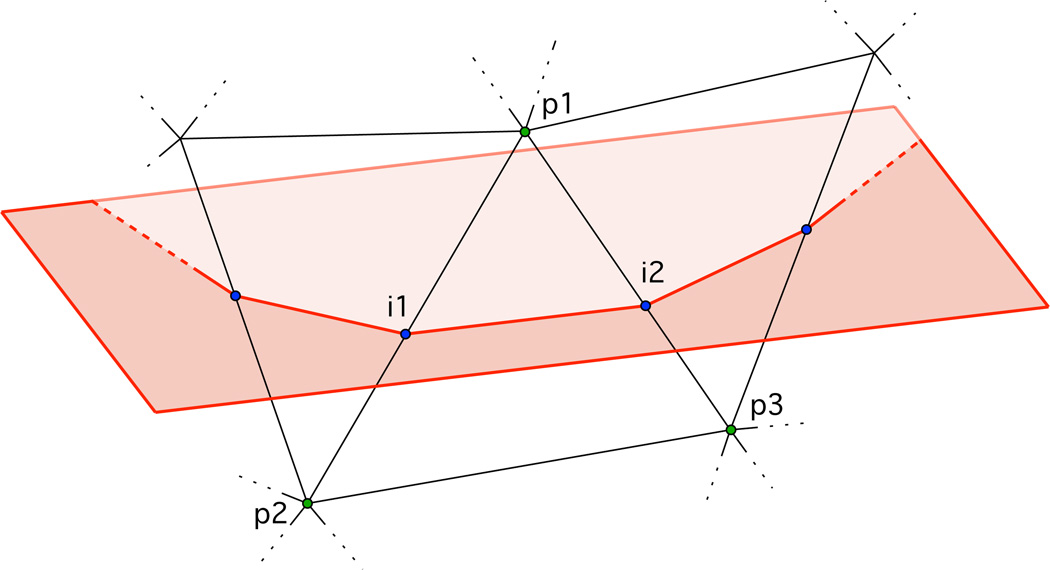
Four basic subroutines are used to define the EEG electrode locations on each of the arcs. These routines are based on the assumptions that arcs are on mesh-plane intersections and that planes are defined by 3 points. First, the three points (f1, f2, f3) that define a plane containing the desired arc are identified. Second, the points at which the mesh and the plane intersect are calculated, which encompass the entire boundary of the mesh-plane intersection. In order to do this, a subroutine finds all the faces that intersect the plane, identifies the intersecting line segments from those faces, and calculates the intersection point between the plane and each line segment. The intersection points are calculated from each line segment of the triangular elements intersecting the plane, as shown in figure 1.
Figure 1.
Diagram depicting calculation of mesh-plane intersection points for EEG positioning algorithm. Plane (shown in red) intersecting mesh element (shown in black) demarcated by 3D coordinates (p1, p2, p3) (shown in green) at points i1 and i2 (shown in blue).
First, the plane equation (ax + by + cz + d = 0) constants a, b, c, and d are obtained from the coordinates of the 3 points defining the desired arc as
| (1) |
| (2) |
| (3) |
| (4) |
Then, the line segments (p1 → p2) and (p1 → p3) are identified for each mesh element that is intersected by the plane, where point p1 lies on one side of the plane and points p2 and p3 lie at the other, as shown in figure 1. Intersection point i1 is calculated from the segment point pair p1 → p2
| (5) |
where the intersection point constant u is calculated using the plane constants a, b, c, d, and
| (6) |
The same is done to obtain intersection point i2. If the plane intersects an element at a node, only one intersection point is calculated for that element. This process ensures that the mesh-plane intersection point is calculated to lie exactly on the mesh-plane boundary whether or not there are mesh vertices that fall on the plane. Third, the subset of boundary intersection line segments that correspond to the arc in question are selected. Finally, a subroutine calculates the total arc length along the line segments, and calculates the EEG positions in the arc at the 5% subdivisions of the total arc length. These four subroutines are carried out for all arcs throughout the head defined in the 10-5 positioning system.
All of the 10-5 positions are based upon the inion-nasion (sagittal) arc and the preauricular (coronal) arc. Defining the inion-nasion and preauricular arcs requires that the position where these two arcs intersect, namely the central position (Cz), must be found. Cz is defined as the simultaneous midpoint of the arc length for both the inion-nasion and preauricular arcs. Since its position is an unknown, the algorithm optimizes the Cz position starting from a guess. This is accomplished by first calculating the plane of the sagittal arc using a guess of the Cz location as a third point on the plane. An updated Cz position is then defined at the average of the current point and the midpoint of this inion-nasion arc. The updated Cz position is then used to define the plane of the coronal arc. The Cz position is updated with the average of the current point and the midpoint of the preauricular arc. The process then iterates between computations of the sagittal and coronal arcs with an updated Cz each time until the position of Cz converges.
Once Cz is identified, the electrode positions along the inion-nasion arc and preauricular arc are calculated. Then, the circumference is defined from positions calculated on these two main arcs. The circumference is divided into four quadrants and each quadrant is subdivided independently, which maintains the original position of the preauricular locations. The locations placed at the subdivisions of the circumference, together with the locations in the inion-nasion arc, become the basis for subsequent arcs.
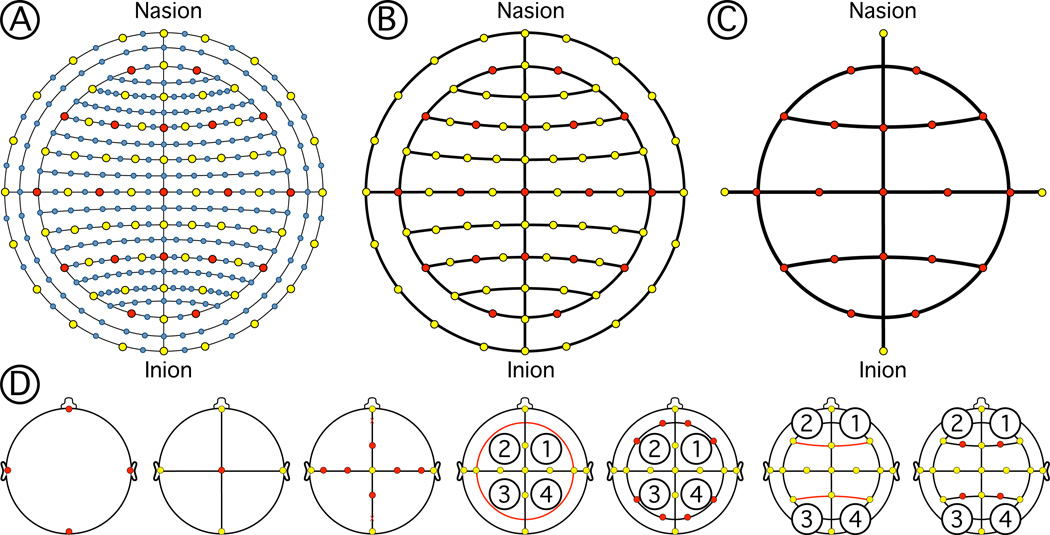
The arcs that follow are also subdivided independently on the left to right sides so that the subdivisions can occur without relocating the inion-nasion arc points. This process is followed for the 10-10 and 10-5 positioning system as well. As a consequence there are two circumferences on the 10-10 and three on the 10-5 positioning system. The positioning method allows the 10-10 positions to be an exact subset to the 10-5, and for the 10–20 positions to be an exact subset of the 10-10. To achieve this, the circumference used for the 10–20 system must also be used in the 10-10 system, and likewise for the 10-5. When only the 10-10 or 10–20 positions are desired, the software has the option to calculate the subset that corresponds to those positions instead of the whole 10-5 set. The set of positions that the software produces are labeled according to the 10-5 nomenclature proposed by Oostenveld and Praamstra (2001) (Jurcak et al., 2007). The order in which the arcs are defined is outlined in figure 3.
Figure 3.
EEG electrode layouts and positioning algorithm. A) 10-5 positioning system. B) 10-10 positioning system. C) 10–20 positioning system. The set of positions that the software produces are labeled according to the 10-5 nomenclature proposed by Oostenveld and Praamstra (2001). EEG positioning order of operations. D) (From left to right) The fiducials are identified in the head (Nasion, inion, left and right preauriculars). Arcs following the contour of the scalp connect those points. The central position (Cz) is identified at the midpoint of the two arc lengths. EEG locations are identified by percentage subdivisions of the arcs. Locations are used to form new arcs that delimit the circumference of the head. Four quadrant arcs are found connecting those points. Circumference points are calculated from percentage subdivisions of quadrant arcs. Points in the inion-nasion arc and circumference are connected with arcs. EEG positions are found on those arcs by percentage subdivisions.
2.2. EEG Forward Model Using the 10-5 positions
Using the EEG positions calculated with our proposed methods and a magnetic resonance imaging (MRI) head scan, we used Brainstorm3 (Tadel et al., 2011) to solve the EEG forward model. A simulated MRI head scan was obtained from BrainWeb, a publicly available database of head tissue segmentations and simulated T1 images using a SFLASH (spoiled FLASH) sequence with TR = 22ms, TE = 9.2ms, a 30° flip angle, and 1mm isotropic voxel size, generated from real MRI head scans obtained under IRB approval (Vincent, 2006; Aubert-Broche et al., 2006). First, segmentations of an MRI head scan were used to generate a boundary element mesh (BEM) of the subject’s scalp and cortical surface. The Freesurfer pipeline was used to segment the MRI head scan in order to obtain scalp and brain BEM using default settings (Fischl et al., 1999; Dale et al., 1999; Fischl, 2012; Reuter et al., 2012). From these two surfaces, the ‘Generate BEM Surfaces’ function in Brainstorm was used to generate inner-skull and outer-skull surfaces with a 4mm skull thickness. The scalp BEM was exported to Matlab, where our EEG positioning algorithm was used to calculate the 10-5 EEG scalp coordinates. The three-dimensional EEG positions were then uploaded to Brainstorm. The scalp, outer skull, inner skull, and cortex BEM surfaces were used in conjunction with the 10-5 EEG scalp coordinates to compute the forward model, using the Open MEEG routine (Kybic et al., 2005; Gramfort et al., 2010). The forward model provided the sensitivity of each cortical mesh vertex with respect to each of the 329 electrodes.
2.3. Proximity Parcellation of the Cortex
The EEG proximity parcellation method begins in the same way as the EEG positioning software, with a user-supplied surface mesh of a head and its four fiducial positions. It also requires the surface mesh of the cortex to be registered to the surface mesh of the head. Using the BEM of the head and the fiducials, the EEG positioning algorithm is used to calculate the EEG scalp coordinates for any of the 3 positioning systems (10–20, 10-10, or 10-5). Once all of the three-dimensional scalp coordinates are found, the parcellation function generates a matrix containing the distance from each electrode to all mesh nodes in the cortical surface. The shortest distance from each node to each electrode is calculated by finding the minimum of the distance matrix in the nodal dimension, yielding a set containing a minimum distance value for each node. The indices of the minimum distances in the set correspond to the electrode with the minimum nodal distance. The resulting proximity parcellation is a set of size equal to the number of nodes in the cortical BEM, with each value corresponding to the index of the nearest electrode. This same process was performed three times to obtain parcellation regions for the 10-5, 10-10, and 10–20 EEG locations.
2.4. Sensitivity and Proximity Parcellations
Using a similar method as the one used for proximity parcellation, we generated parcellation regions of the cortex based on sensitivity. The forward model generated with Brainstorm contains a matrix of EEG sensitivity values at each cortical mesh node for all electrodes. This matrix is similar to the distance matrix used in the proximity parcellation. The absolute value of the forward model removes the directionality and yields a matrix of sensitivity magnitudes. The maximum sensitivity from each cortical node at each electrode was calculated by finding the maximum of the matrix in the nodal dimension, yielding a set containing a maximum sensitivity value for each node. The indices of the maximum sensitivity in the set correspond to the electrode with maximum sensitivity at that node. This process was used to obtain parcellation regions for the 10-5, 10-10, and 10–20 EEG electrode locations.
We evaluated the correspondence of the sensitivity parcellation regions with the proximity parcellation regions to determine how well electrode proximity can serve as a proxy for electrode sensitivity. For this evaluation we performed proximity and sensitivity parcellations for the same subject and quantified the percent intersection of the sensitivity and proximity parcellation regions. The intersection was calculated for each electrode separately by totaling the nodes at the intersection of the sensitivity and proximity parcellation regions and normalizing by the sum of either sensitivity or proximity nodes for that electrode, whichever was less. This normalizes the result to the maximum amount of nodes that could potentially intersect.
2.5. Intersection of Functional and Structural Parcellations with Proximity Parcellations
We also analyzed the correspondences between parcellation regions of the brain based on anatomical structure and functional regions, with parcellation regions based on proximity to the EEG electrodes. MRI head scans of 20 subjects were obtained from the BrainWeb database. Freesurfer was used to segment the MRI head scans in order to obtain scalp and brain BEMs, as described in section 2.2. Also, using the anatomical and functional parcellation routines in Freesurfer, four distinct brain parcellation sets for all subjects were generated, an anatomical parcellation based on 32 regions (Desikan et al., 2006), an anatomical parcellation based on 74 regions (Fischl et al., 2004; Destrieux et al., 2010), and two functional parcellations based on 7 and 17 regions (Yeo et al., 2011). The anatomical parcellations divide the cortex in regions that correspond to sulco-gyral structures of the human brain. The parcellation labels for the 74 regions are more Specific than those corresponding to the 32 regions. The functional parcellations divide the cortex in 7 and 17 regions that represent large scale cerebral networks classified with respect to functional connectivity. The parcellation regions for the 17 regions are more finely defined than those corresponding to the 7 regions. These sets of anatomical and functional parcellations divide the brain into distinct regions that can be singled out for Specific studies of the brain. The correspondence of EEG electrode proximity parcellation regions to these distinct functional and structural parcellation regions can aid in selecting which electrodes to use for a particular study that analyses a Specific area of the brain.
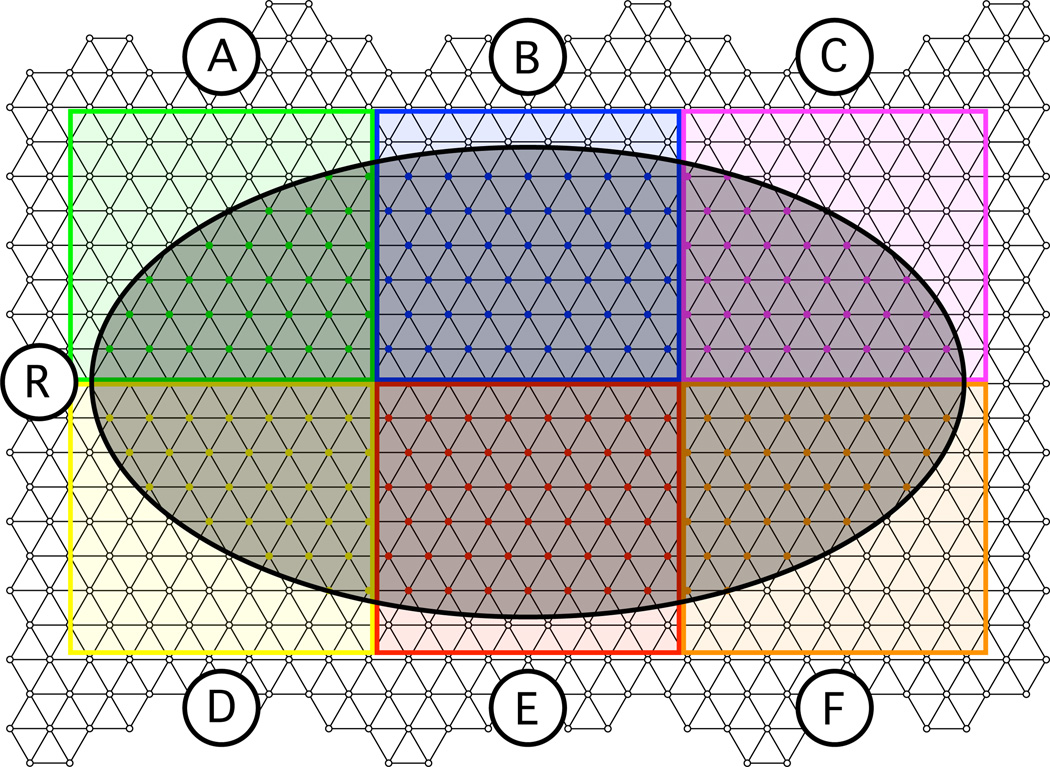
The EEG positioning algorithm and proximity parcellation routines were used in conjunction with the scalp and brain BEMs to calculate proximity-based parcellation regions for the International 10–20, 10-10, and 10-5 EEG positioning systems. Intersection analyses for all 20 subjects were then performed between the proximity parcellation regions and the anatomical and functional parcellation regions. Intersection analyses were performed on the cortex as a whole rather than on each hemisphere independently because the EEG electrode proximity regions span between the two hemispheres. Separating the analysis between hemispheres would artificially separate what’s physically associated in the sensitivity maps. An intersection matrix with size of the number of anatomical or functional parcellation regions by the number of electrode proximity regions was computed, where the value corresponding to a particular parcellation region and an electrode proximity region was the amount of mesh nodes that they share, as shown in figure 5, where R is an anatomical or functional region (black) containing nR nodes, A → F are EEG electrode proximity regions (colored) containing nA → nF nodes, and nAR → nFR is the number of nodes that correspond to both region R and regions A → F (colored nodes). The intersection results were normalized in two different ways: First, we report the percentage of cortical nodes in a given structural or functional region that are most proximal to each of the electrodes. Second, we report the maximum percent intersection between a single structural or functional region with the proximity parcellation region of each electrode.
Figure 5.
Intersection analysis diagram. Anatomical or functional region R intersecting EEG electrode proximity parcellation regions A → F on a triangular mesh.
To report the contribution of the signal measured by each electrode to the measurement of a particular structural or functional region, we compute the percentage of cortical nodes in a given structural or functional region most proximal to each electrode. For example, for region R in figure 5, where the number of nodes inside R (nR) is 100%, the percentage Pi that each EEG electrode proximity region intersects is the ratio of the number of nodes corresponding to each colored region that are within region R and the total number of nodes in R,
| (7) |
In this way, the result is the percentage contribution by each electrode to region R, where
| (8) |
Because there are so many electrode proximity regions, particularly when we analyze the 10-5 positions, the intersection percentages Pi are reported in sorted order, starting with the maximum.
To report the structural or functional region that is most prominent in the signal measured by each electrode, we compute the maximum percent intersection between a single structural or functional region with the proximity parcellation region of each electrode. For example, for region R in figure 5, the percentage of intersection for EEG electrode proximity region B (PEEG;B) is the ratio of the number of nodes in B inside region R (nBR), shown in blue, and the total amount of nodes in B (nB),
| (9) |
where the total number of nodes in B is nB = 100%. In this way, the result is the percentage of signal measured by electrode B that corresponds to region R. This is repeated for all other electrode proximity regions A → F.
The results for intersection percentage computed with respect to structural and functional regions and with respect to electrode proximity regions, were averaged across the 20 subjects studied. The first intersection percentage values indicate the amount of signal that each electrode measurement contributes to fully study an individual anatomical or functional region. The second intersection percentage values indicate which electrodes are closest to which functional or structural region. These results could also be viewed as a rough approximation of electrode sensitivity to a structural or functional region.
3. Results
3.1. EEG Electrode Positioning Algorithm
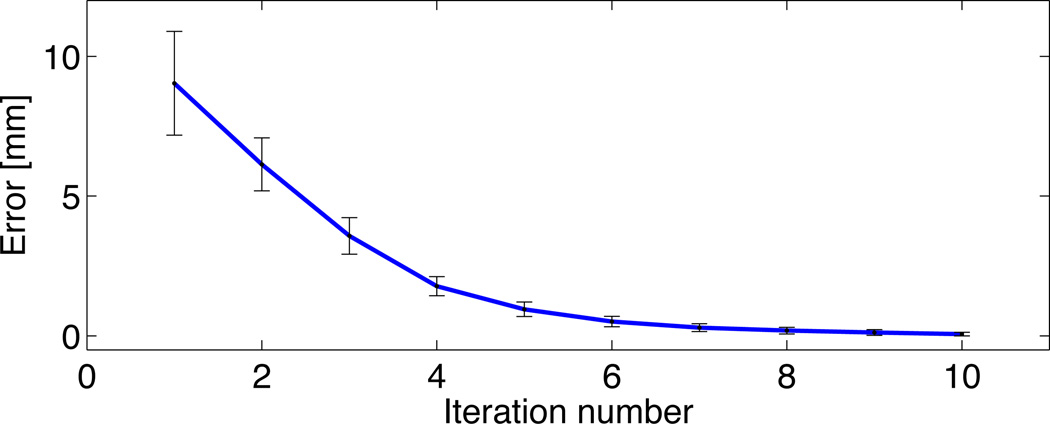
The EEG positioning algorithm ran successfully on all 20 subjects without errors. Execution took 3 seconds to calculate 329 positions on a head mesh of 72366 nodes4. The optimization error for the computation of Cz was calculated as the difference between Cz at the current iteration and Cz in the prior iteration. It took an average of 10 iterations for the error to be below 0.1mm for all subjects, as shown in figure 6. We also calculated an average inion-nasion arc length of 400.25 ± 4.65mm, a preauricular arc length of 361.88 ± 5.85mm, and a 10–20 circumference of 622.29 ± 14.45mm, from the 20 subjects studied. The arc length subdivisions were accurate to the numerical precision of the computer. EEG electrode positions from the algorithm were imported to the BrainStorm software without errors. We also compared the 10-10 positions calculated with the electrode positioning algorithm developed by Jurcak et al. (2005) (the maximum available with that software), with those calculated with our algorithm and obtained an average difference of 2.64 ± 1.65mm between the two sets of positions.
Figure 6.
Cz optimization error.
3.2. Sensitivity and Proximity Parcellations
Using the EEG positioning algorithm and electrode proximity parcellation routines we developed, we generated cortical parcellation regions based on proximity using the International 10–20, 10-10, and 10-5 electrode positioning systems. The proximity parcellations execute quickly, for example, on a brain mesh of 325987 nodes using a head mesh of 10242 nodes, the function executes in 14 seconds for the 10-5, 14 seconds for the 10-10, and 13 seconds for the 10–20 positioning system5. Also, we computed the EEG forward model for the same subject and generated cortical parcellation regions based on sensitivity using the International 10–20, 10-10, and 10-5 electrode positioning systems. Figure 7 shows the regions of the parcellations based on proximity and sensitivity to each electrode for the 10–20, 10-10, and 10-5 positioning systems, colored following the same order for both parcellations, for visualization and comparison. The sensitivity and proximity intersection percentages were 44.0 ± 11.3% for the International 10–20, 32.4 ± 12.6% for the 10-10, and 24.7 ± 16.3% for the 10-5 electrode positioning system. The percentage of intersection between the proximity and sensitivity parcellations indicates the degree of agreement between the regions of the two parcellations, and the extent to which parcellations based on electrode proximity approximate the parcellations based on electrode sensitivity to the cortex.
Figure 7.
EEG proximity (top) and sensitivity (bottom) parcellations for a) 10–20, b) 10-10, and c) 10-5 electrode scalp coordinates. Brain parcellation intersection percentage based on the intersection of sensitivity with proximity parcellations for the 10–20 positioning system (44.0 ± 11.3%), for the 10-10 positioning system (32.4 ± 12.6%), and for the 10-5 positioning system (24.7 ± 16.3%). (Colors match the top and bottom figures for comparison and are random for visualization purposes)
3.3. Functional and Structural Parcellations
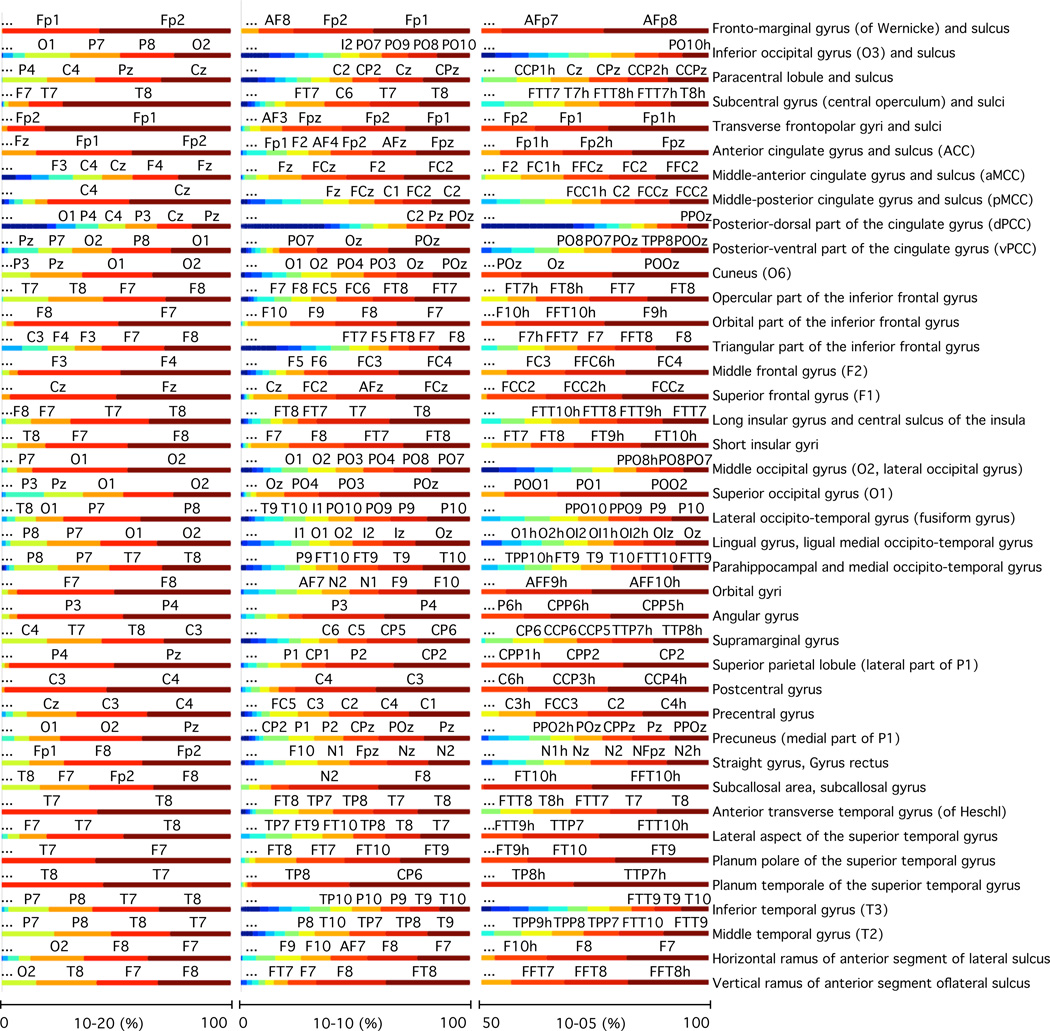
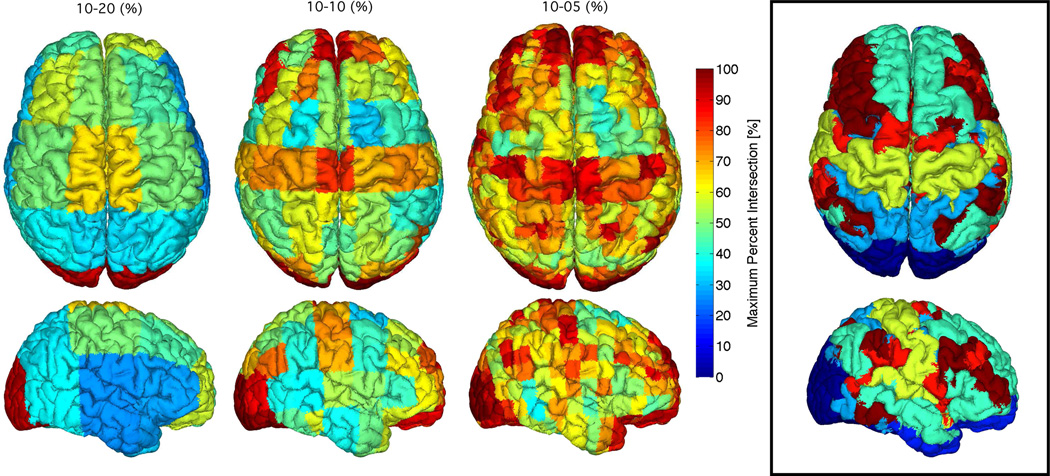
Using the EEG positioning algorithm and proximity parcellation routines we developed, we generated cortical parcellation regions based on proximity using the International 10–20, 10-10, and 10-5 electrode positioning systems on 20 subjects. On these same subjects, two structural and two functional parcellations were also computed. The average intersection percentage between each electrode proximity region, shown in the top of Figure 7, and the structural parcellation with 32 regions, shown in the black box in figure 8, across all subjects is shown in figure 9. The color and size of each line segment in the bars represents the percentage of intersection they occupy within the structural region. This result corresponds to the first intersection method described in section 2.5, which uses equations 7 and 8. The results are sorted from the electrode that contributes the most to the measurement of that region to the one that contributes the least. This means that 100% corresponds to the sum of the contributions of all electrodes, where the electrodes that are closest to the region contribute the largest percentages and the ones farthest from it contribute negligibly or not at all. The nomenclature for the electrodes with highest percentages is also displayed on top of their line segments. In this way, the figure illustrates which electrodes are most proximal to each region.
Figure 8.
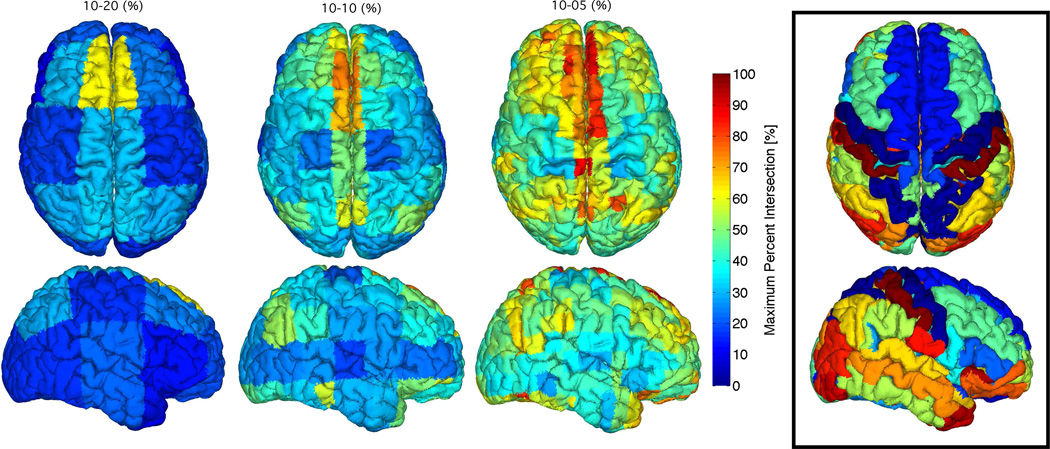
Brain intersection percentages between regions of structural parcellation 1 (black box) and the electrode proximity parcellation regions for the 10–20 (left), 10-10 (middle), and 10-5 (right) positioning system. The maximum percent intersections of structural regions with electrode proximity regions are mapped to the cortical surface. Results are 20 subject averages.
Figure 9.
Brain intersection percentages between regions of structural parcellation 1 (black box on figure 8) and the electrode proximity parcellation regions for the 10–20 (left), 10-10 (middle), and 10-5 (right) positioning system. Intersection percentages of electrode proximity regions with structural regions are shown with the horizontal bar graphs. The structural regions are labelled according to the analysis performed by Desikan et al. (2006). Results are 20 subject averages.
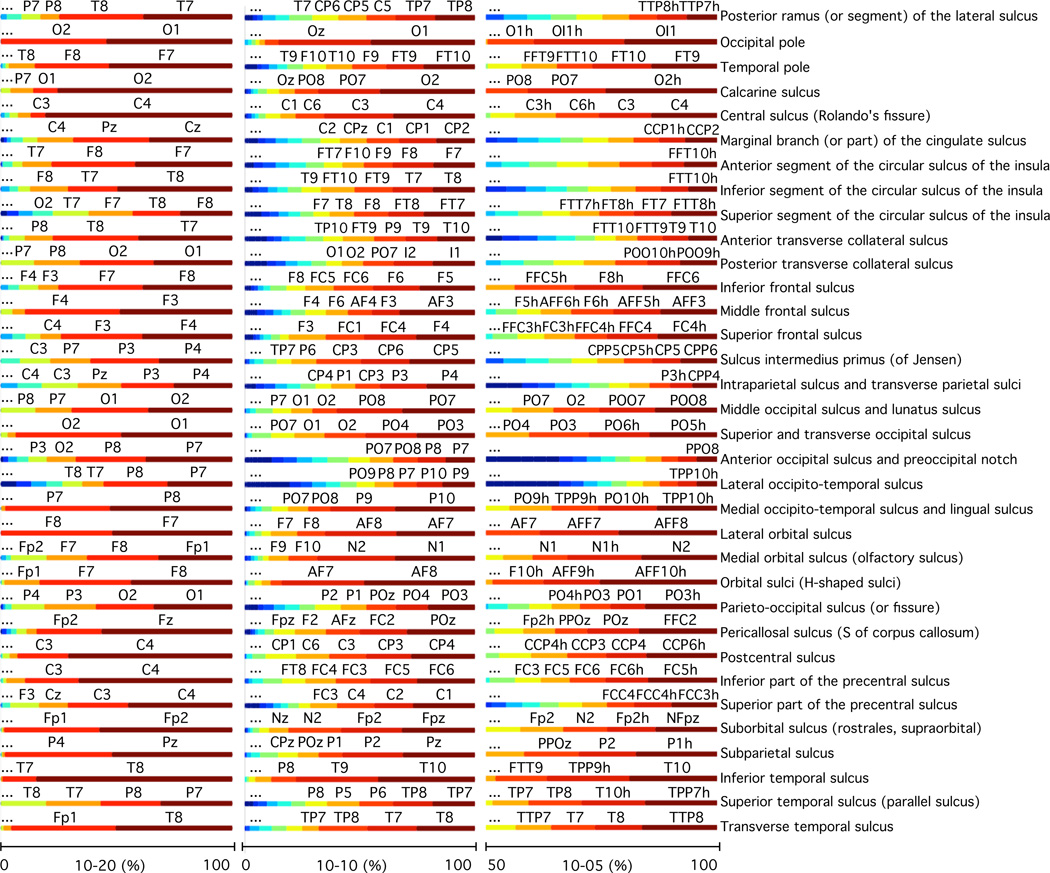
Figure 8 shows the maximum intersection percentage with respect to electrode proximity region. If an electrode proximity region intersects more than one anatomical region, the result displayed is the one with the largest percent intersection. This result corresponds to the second intersection method described in section 2.5, which uses equation 9. This result illustrates which electrodes measure more exclusively from one region and which electrodes measure across multiple regions. The result is provided as the average across 20 subjects, so it shows which electrodes are most likely to measure from the same region across a population. To aid comparison of the results, the structural parcellation (32 anatomical regions) being studied is shown in the box. The results displayed in figures 8 and 9 were obtained for the second structural parcellation (74 anatomical regions) shown in figures 10 and 11, and for the two functional parcellations (7 and 17 functional regions), shown in figures 12, 13, 14 and 15.
Figure 10.
Brain intersection percentages between regions of structural parcellation 2 (black box) and the electrode proximity parcellation regions for the 10–20 (left), 10-10 (middle), and 10-5 (right) positioning system. The maximum percent intersections of structural regions with electrode proximity regions are mapped to the cortical surface. Results are 20 subject averages.
Figure 11.
Brain intersection percentages between regions of structural parcellation 2 (black box on figure 10) and the electrode proximity parcellation regions for the 10–20 (left), 10-10 (middle), and 10-5 (right) positioning system. Intersection percentages of electrode proximity regions with structural regions are shown with the horizontal bar graphs. The structural regions are labelled according to the analysis performed by Destrieux et al. (2010). Results are 20 subject averages.
Figure 12.
Brain intersection percentages between regions of functional parcellation 1 (black box) and the electrode proximity parcellation regions for the 10–20 (left), 10-10 (middle), and 10-5 (right) positioning system. The maximum percent intersections of functional regions with electrode proximity regions are mapped to the cortical surface. Results are 20 subject averages.
Figure 13.
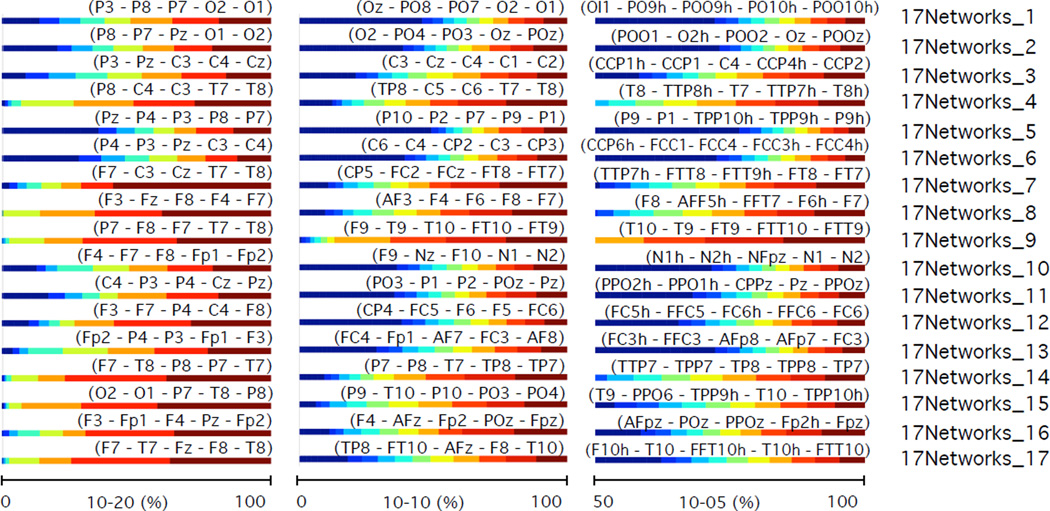
Brain intersection percentages between regions of functional parcellation 1 (black box on figure 12) and the electrode proximity parcellation regions for the 10–20 (left), 10-10 (middle), and 10-5 (right) positioning system. Intersection percentages of electrode proximity regions with functional regions are shown with the horizontal bar graphs [The 5 electrodes with highest percent contribution to each region are labeled in parentheses]. The functional regions are labelled according to the network analysis performed by Yeo et al. (2011). Results are 20 subject averages.
Figure 14.
Brain intersection percentages between regions of functional parcellation 2 (black box) and the electrode proximity parcellation regions for the 10–20 (left), 10-10 (middle), and 10-5 (right) positioning system. The maximum percent intersections of functional regions with electrode proximity regions are mapped to the cortical surface. Results are 20 subject averages.
Figure 15.
Brain intersection percentages between regions of functional parcellation 2 (black box on figure 14) and the electrode proximity parcellation regions for the 10–20 (left), 10-10 (middle), and 10-5 (right) positioning system. Intersection percentages of electrode proximity regions with functional regions are shown with the horizontal bar graphs [The 5 electrodes with highest percent contribution to each region are labeled in parentheses]. The functional regions are labelled according to the network analysis performed by Yeo et al. (2011). Results are 20 subject averages.
4. Discussion
The advantages that emerge from standardizing the positioning of EEG electrodes on the scalp are many: test-retest variability analyses, intra-subject variability analyses, comparison across studies, comparison across multiple brain monitoring modalities, consistent and compatible evolution of technology and methods, reduced set-up time, and reduced prior knowledge required to use the system. These advantages are apparent both when setting up for an experiment and also when analyzing the results obtained. Virtual representations of the head and sources of measurements are important tools to maximize the information obtained from each study. Digitization methods (He and Estepp, 2013) and custom electrode designs (Koessler et al., 2008) are often used to translate the locations of measurement from the subject to the software analysis tools and methods. Head probes and caps can also be used to provide accurate and precise positioning of electrodes in a fast and convenient way (Giacometti and Diamond, 2013). However, the need for localization of scalp coordinates is still necessary for EEG data analysis. Computational algorithms that calculate the EEG scalp coordinates on the surface mesh of a head are useful to take full advantage of the benefits of positional standardization and head probes. A significant difference between the algorithm we developed from the one used by Jurcak et al. (2005) is that ours uses the mesh elements to calculate the actual location of the intersection points between the plane demarcating each arc and the head mesh, rather than just using the mesh nodes and their projections into the intersecting plane. Our method ensures that all points used for the calculation of the EEG locations lie exactly on the surface of the head, rather than an approximation of the surface of the head. Using just the mesh nodes for the calculation of the arc points introduces inaccuracies in the arc following the contour of the scalp, particularly with arcs on heads that do not follow a convex hull curve. Once the arc points and arc lengths are calculated, the locations of the EEG positions are calculated on the arcs. Since our method uses only points that lie on the surface of the head mesh, the resulting EEG locations lie exactly on the surface of the head mesh. Calculating points that lie on the mesh surface is another improvement of our algorithm, since it does not need to find the closest mesh node to the calculated EEG location to assign as the on-surface EEG location, as done in the algorithm by Jurcak et al. (2005). The last area of difference with our algorithm is the determination of the central position Cz. This position is integral to the accuracy of all positions as it demarcates the location of the inion-nasion and preauricular arcs, the two main arcs which all positions are based upon. Although the procedures to determine Cz are similar in both algorithms, instead of repeating the process a Specific number of times, ours iterates the optimization process until the position converges, as seen on figure 6. The number of iterations required for optimization will vary among different head meshes, particularly with those that have varying mesh densities. Having a fixed number of iterations for the optimization process will yield an inaccurate result in head meshes that require more iterations to converge. Our optimization method ensures that Cz is as accurate as the head mesh density permits. The EEG positioning algorithm we developed is particularly useful when used with head probes that are based on the same fiducial positions as the EEG positioning system. The positions of the electrodes need not be digitized manually because our algorithm computes the same positions. This approach avoids the need to use markers in MRI head scans as well because the fiducial points can be identified in the MRI scan data. The measurements made with EEG can then be easily translated to the surface of the scalp using our presented algorithm as a preprocessing step in a data analysis stream.
One of the key differences between the presented algorithm and the procedure described by the International Federation (Klem et al., 1999) is that the circumference is marked between positions that are already calculated on inion-nasion and preauricular arcs. As a consequence the circumference is computed in four quadrants and each quadrant is subdivided independently. According to the International Federation the circumference can be subdivided into equal percentages from the inion to the nasion to form half of the circumference, where the preauricular position is assumed to be at 50% of the arc length. However, this typically creates a geometric conict between the already specified fiducial points and the equal subdivisions on the circumference. We chose not to move the fiducial points since they are based on anatomical references. As a consequence, each quadrant of the circumference is subdivided independently.
Maps of the brain based on electrode proximity instead of sensitivity can be used for topographical cortical navigation and to aid in the choice of electrode layout when planning for experiments using EEG. In practice, computing the forward model solution for each subject is a potentially time consuming and complex process (Musha and Okamoto, 1999). Also, computation of the forward model requires extracting BEMs from MRI head scans, which can be a complicated and laborious process (Boesen et al., 2004). Although forward model analysis is desired in certain instances, there are times when simplistic information about the average proximity of EEG electrodes to cortical structures may be preferred, for example in the absence of MRI data or during high-level planning of experiments. In these cases, a map of average electrode and cortical proximity is informative and helpful for planning and/or analysis of the recordings. Average electrode proximity maps on the cortex may be particularly useful in the clinical setting where EEG interpretation is often still performed using only scalp-based nomenclature. Proximity maps can be used instead of sensitivity maps in such cases because they broadly provide analogous information, as shown in figure 7. The regions that result from parcellating the brain with respect to sensitivity encompass approximately the same regions as the ones demarcated by the proximity-based parcellations. The coincidence between the proximity and sensitivity regions is less obvious when the amount of electrodes increases. Consequently, proximity maps of the cortex could be used as a sufficient alternative to sensitivity maps when used for general interpretation of data or for experimental planning, especially when using smaller numbers of electrodes. For example, when planning a study on the primary motor cortex, the results from figure 7.a show that the proximity regions of the cortex for electrodes C3 (yellow), Cz (orange), and C4 (green) are maximally sensitive to those same electrodes. In this way, the proximity parcellations of the cortex can be used without having to compute the EEG forward model solution and sensitivity map.
In addition, having information about the intersection of the electrode regions and structural or functional regions is a valuable resource for EEG researchers who are interested in studies that target Specific regions of interest. The intersection information provided in this study provides a starting point for more in-depth studies of EEG sensitivity. Studies such as the ones by Koessler et al. (2009) and Okamoto et al. (2004) project electrode scalp coordinates onto the cortex and list the anatomical regions where the projection lands on, averaged across a population. In this study, we approach the analysis starting from the brain so that we can report what electrode is most proximal to all anatomical regions of the brain, not just the ones where an electrode location’s projection lands on. This is useful when planning a study that focuses in a Specific brain region because the results provided show which electrodes to use, whether or not the cortical region has the projection of an electrode position land on it, which would be the case when using a low electrode density set of positions like the 10–20 system or when studying smaller and more Specific brain regions. Also, we carried out this study on both anatomical and functional parcellations of the cortex, while prior studies did not consider functional regions, so that the results can be used when analyzing the structure as well as the functional networks of the cortex. Furthermore, we performed this analysis on two region densities, to aid in experimental planning for studies tackling general and Specific anatomical or functional regions, and three electrode densities, so that the results apply to studies using 10–20, 10-10, or 10-5 electrode positions. Finally, not only do we provide the functional or anatomical regions that are closest to each electrode position, but we also report all the positions that are closest to each region, so that the experimental planning can be performed from the electrode side or the cortical region side. For example, if a study uses electrode position Fz, the results displayed in figure 8 show that on average across the population studied, the 85.8% of the proximity region intersects the superior frontal gyrus for the 10-5 parcellation, 87.3% for the 10-10 parcellation, and 81.7% for the 10–20 parcellation. Alternatively, if a study focuses on the superior frontal gyrus, the results from figure 9 show that, across the population studied, the regions that are maximally proximal to it are Fz, Cz, F4, and Fp2 for the 10-5 parcellation, FC2, FCz, AFz, and FC1 for the 10-10 parcellation, and FCC2, FC2, FFC2, and FCz for the 10-5 parcellation. Similar interpretations can be performed for any other electrode position, structural region, and functional network region.
The results of this study show that EEG electrode proximity maps intersect with EEG sensitivity maps of the human brain. This intersection permits the use of proximity maps to inform experimenters about the cortical origin of scalp recordings. Proximity parcellations are approximate EEG sensitivity maps when the electrode coordinates are sparse, such as in the 10–20 layout. The increased detail introduced by high-density electrode layouts decreases the agreement between sensitivity and proximity parcellation maps. Furthermore, intersection of structural and functional regions of the brain with cortical proximity parcellations shows the correspondences between scalp coordinates and potential regions of clinical or scientific interest in the cortex. Also, the results presented in this study on the average intersection of structural and functional regions with EEG electrode proximity regions can be used for high-level experimental planning and initial interpretations of EEG data.
Figure 4.
Forward model process. a) The software starts with the MRI of a head. b) The boundary element meshes of the cortex and the scalp are found. The inner and outer skull surfaces are calculated. c) The 10-5 scalp coordinates are calculated and imported into Brainstorm. d) The forward model is computed showing the sensitivity of each electrode at the cortical surface (Illustrated here is the normalized maximum sensitivity for each electrode).
Highlights.
We propose an algorithm to automatically calculate EEG electrode positions on a mesh.
We calculate positions following standard layouts on the scalp of 20 adult subjects.
We present an algorithm to parcellate the cortex based on electrode proximity.
These parcellations are compared to anatomical and functional cortical regions.
We offer a reference table for experimental design and initial analysis of EEG data.
Acknowledgements
This work was supported by the NIH National Institute of Aging R21AG033256, Dartmouth SYNERGY, and the Institute for Quantitative Biomedical Sciences (iQBS).
Footnotes
Publisher's Disclaimer: This is a PDF file of an unedited manuscript that has been accepted for publication. As a service to our customers we are providing this early version of the manuscript. The manuscript will undergo copyediting, typesetting, and review of the resulting proof before it is published in its final citable form. Please note that during the production process errors may be discovered which could affect the content, and all legal disclaimers that apply to the journal pertain.
Athinoula A. Martinos Center for Biomedical Imaging, Cambridge, MA, USA
The Mathworks Inc., Natick, MA, USA
Documented and freely available for download online under the GNU general public license (http://neuroimage.usc.edu/brainstorm).
Using a laptop computer with a 2.66 GHz Intel Core 2 Duo processor and 4GB of RAM, running MacOSX 10.7.
Using a laptop computer with a 2.66 GHz Intel Core 2 Duo processor and 4GB of RAM, running MacOSX 10.7.
References
- Aubert-Broche B, Griffn M, Pike GB, Evans AC, Collins DL. Twenty new digital brain phantoms for creation of validation image data bases. IEEE Transactions on Medical Imaging. 2006 Nov;25:1410–1416. doi: 10.1109/TMI.2006.883453. [DOI] [PubMed] [Google Scholar]
- Boesen K, Rehm K, Schaper K, Stoltzner S, Woods R, Lüders E, Rottenberg D. Quantitative comparison of four brain extraction algorithms. NeuroImage. 2004 Jul;22:1255–1261. doi: 10.1016/j.neuroimage.2004.03.010. [DOI] [PubMed] [Google Scholar]
- Bohland JW, Bokil H, Allen CB, Mitra PP. The brain atlas concordance problem: quantitative comparison of anatomical parcellations. PloS One. 2009 Jan;4:e7200. doi: 10.1371/journal.pone.0007200. [DOI] [PMC free article] [PubMed] [Google Scholar]
- Dale AM, Fischl B, Sereno MI. Cortical surface-based analysis. I. Segmentation and surface reconstruction. NeuroImage. 1999 Feb;9:179–194. doi: 10.1006/nimg.1998.0395. [DOI] [PubMed] [Google Scholar]
- Desikan RS, Ségonne F, Fischl B, Quinn BT, Dickerson BC, Blacker D, Buckner RL, Dale AM, Maguire RP, Hyman BT, Albert MS, Killiany RJ. An automated labeling system for subdividing the human cerebral cortex on MRI scans into gyral based regions of interest. NeuroImage. 2006 Jul;31:968–980. doi: 10.1016/j.neuroimage.2006.01.021. [DOI] [PubMed] [Google Scholar]
- Destrieux C, Fischl B, Dale A, Halgren E. Automatic parcellation of human cortical gyri and sulci using standard anatomical nomenclature. NeuroImage. 2010 Oct;53:1–15. doi: 10.1016/j.neuroimage.2010.06.010. [DOI] [PMC free article] [PubMed] [Google Scholar]
- Fischl B. FreeSurfer. NeuroImage. 2012 Aug;62:774–781. doi: 10.1016/j.neuroimage.2012.01.021. [DOI] [PMC free article] [PubMed] [Google Scholar]
- Fischl B, van der Kouwe A, Destrieux C, Halgren E, Ségonne F, Salat DH, Busa E, Seidman LJ, Goldstein J, Kennedy DN, Cavines V, Makris N, Rosen BR, Dale AM. Automatically Parcellating the Human Cerebral Cortex. Cerebral Cortex. 2004 Jan;14:11–22. doi: 10.1093/cercor/bhg087. [DOI] [PubMed] [Google Scholar]
- Fischl B, Sereno MI, Dale AM. Cortical surface-based analysis. II: Inflation, flattening, and a surface-based coordinate system. NeuroImage. 1999 Feb;9:195–207. doi: 10.1006/nimg.1998.0396. [DOI] [PubMed] [Google Scholar]
- Gasser T, Bächer P, Steinberg H. Test-retest reliability of spectral parameters of the EEG. Electroencephalography and Clinical Neurophysiology. 1985;60(no. 4):312–319. doi: 10.1016/0013-4694(85)90005-7. [DOI] [PubMed] [Google Scholar]
- Giacometti P, Diamond SG. Compliant head probe for positioning electroencephalography electrodes and near-infrared spectroscopy optodes. Journal of Biomedical Optics. 2013 Feb;18:27005. doi: 10.1117/1.JBO.18.2.027005. [DOI] [PMC free article] [PubMed] [Google Scholar]
- Goulas A, M. Uylings HB, Stiers P. Unravelling the intrinsic functional organization of the human lateral frontal cortex: a parcellation scheme based on resting state fMRI. The Journal of Neuroscience. 2012 Jul;32:10238–10252. doi: 10.1523/JNEUROSCI.5852-11.2012. [DOI] [PMC free article] [PubMed] [Google Scholar]
- Gramfort A, Papadopoulo T, Olivi E, Clerc M. OpenMEEG: opensource software for quasistatic bioelectromagnetics. Biomedical Engineering Online. 2010 Jan;9:1–20. doi: 10.1186/1475-925X-9-45. [DOI] [PMC free article] [PubMed] [Google Scholar]
- Hallez H, Vanrumste B, Grech R, Muscat J, De Clercq W, Vergult A, D’Asseler Y, Camilleri KP, Fabri SG, Van Huffel S, Lemahieu I. Review on solving the forward problem in EEG source analysis. Journal of NeuroEngineering and Rehabilitation. 2007 Jan;4:46. doi: 10.1186/1743-0003-4-46. [DOI] [PMC free article] [PubMed] [Google Scholar]
- He P, Estepp JR. A practical method for quickly determining electrode positions in high-density EEG studies. Neuroscience Letters. 2013 Apr;541:73–76. doi: 10.1016/j.neulet.2013.02.028. [DOI] [PubMed] [Google Scholar]
- Jurcak V, Okamoto M, Singh A, Dan I. Virtual 10–20 measurement on MR images for inter-modal linking of transcranial and tomographic neuroimaging methods. NeuroImage. 2005 Jul;26:1184–1192. doi: 10.1016/j.neuroimage.2005.03.021. [DOI] [PubMed] [Google Scholar]
- Jurcak V, Tsuzuki D, Dan I. 10/20, 10/10, and 10/5 systems revisited: Their validity as relative head-surface-based positioning systems. NeuroImage. 2007 Feb;34:1600–1611. doi: 10.1016/j.neuroimage.2006.09.024. [DOI] [PubMed] [Google Scholar]
- Klem GH, Lüders HO, Jasper HH, Elger C. The ten-twenty electrode system of the International Federation. Electroencephalography and Clinical Neurophysiology. 1999;52:3–6. [PubMed] [Google Scholar]
- Koessler L, Benhadid a, Maillard L, Vignal JP, Felblinger J, Vespignani H, Braun M. Automatic localization and labeling of EEG sensors (ALLES) in MRI volume. NeuroImage. 2008 Jul;41:914–923. doi: 10.1016/j.neuroimage.2008.02.039. [DOI] [PubMed] [Google Scholar]
- Koessler L, Maillard L, Benhadid A, Vignal JP, Felblinger J, Vespignani H, Braun M. Automated cortical projection of EEG sensors: anatomical correlation via the international 10-10 system. NeuroImage. 2009 May;46:64–72. doi: 10.1016/j.neuroimage.2009.02.006. [DOI] [PubMed] [Google Scholar]
- Kybic J, Clerc M, Abboud T, Faugeras O, Keriven R, Papadopoulo T. A common formalism for the integral formulations of the forward EEG problem. IEEE Transactions on Medical Imaging. 2005 Jan;24:12–28. doi: 10.1109/tmi.2004.837363. [DOI] [PubMed] [Google Scholar]
- Michel CM, Murray MM, Lantz G, Gonzalez S, Spinelli L, Grave de Peralta R. EEG source imaging. Clinical Neurophysiology. 2004 Oct;115:2195–222. doi: 10.1016/j.clinph.2004.06.001. [DOI] [PubMed] [Google Scholar]
- Musha T, Okamoto Y. Forward and inverse problems of EEG dipole localization. Critical Reviews in Biomedical Engineering. 1999 Jan;27:189–239. [PubMed] [Google Scholar]
- Okamoto M, Dan H, Sakamoto K, Takeo K, Shimizu K, Satoru K, Oda I, Isobe S, Suzuki T, Kohyama K, Dan I. Three-dimensional probabilistic anatomical cranio-cerebral correlation via the international 1020 system oriented for transcranial functional brain mapping. NeuroImage. 2004 Jan;21:99–111. doi: 10.1016/j.neuroimage.2003.08.026. [DOI] [PubMed] [Google Scholar]
- Oostenveld R, Praamstra P. The five percent electrode system for high-resolution EEG and ERP measurements. Clinical Neurophysiology. 2001 Apr;112:713–719. doi: 10.1016/s1388-2457(00)00527-7. [DOI] [PubMed] [Google Scholar]
- Pascual-Leone A, Walsh V, Rothwell J. Transcranial magnetic stimulation in cognitive neuroscience - virtual lesion, chronometry, and functional connectivity. Current Opinion in Neurobiology. 2000 Apr;10:232–237. doi: 10.1016/s0959-4388(00)00081-7. [DOI] [PubMed] [Google Scholar]
- Paus T, Jech R, Thompson CJ, Comeau R, Peters T, Evans AC. Transcranial magnetic stimulation during positron emission tomography: a new method for studying connectivity of the human cerebral cortex. The Journal of Neuroscience. 1997 May;17:3178–3184. doi: 10.1523/JNEUROSCI.17-09-03178.1997. [DOI] [PMC free article] [PubMed] [Google Scholar]
- Reuter M, Schmansky NJ, Rosas HD, Fischl B. Within-subject template estimation for unbiased longitudinal image analysis. NeuroImage. 2012 Jul;61:1402–1418. doi: 10.1016/j.neuroimage.2012.02.084. [DOI] [PMC free article] [PubMed] [Google Scholar]
- Rush S, Driscoll Da. EEG electrode sensitivity–an application of reciprocity. IEEE Transactions on Biomedical Engineering. 1969 Jan;16:15–22. doi: 10.1109/tbme.1969.4502598. [DOI] [PubMed] [Google Scholar]
- Sack AT. Transcranial magnetic stimulation, causal structure-function mapping and networks of functional relevance. Current Opinion in Neurobiology. 2006 Oct;16:593–599. doi: 10.1016/j.conb.2006.06.016. [DOI] [PubMed] [Google Scholar]
- Tadel F, Baillet S, Mosher JC, Pantazis D, Leahy RM. Brainstorm: a user-friendly application for MEG/EEG analysis. Computational Intelligence and Neuroscience. 2011 Jan;2011:879716,1–879716,13. doi: 10.1155/2011/879716. [DOI] [PMC free article] [PubMed] [Google Scholar]
- Towle VL, Bolaños J, Suarez D, Tan K, Grzeszczuk R, Levin DN, Cakmur R, Frank SA, Spire J-P. The spatial location of EEG electrodes: locating the best-fitting sphere relative to cortical anatomy. Electroencephalography and Clinical Neurophysiology. 1993 Jan;86:1–6. doi: 10.1016/0013-4694(93)90061-y. [DOI] [PubMed] [Google Scholar]
- Tsuzuki D, Jurcak V, Singh AK, Okamoto M, Watanabe E, Dan I. Virtual spatial registration of stand-alone fNIRS data to MNI space. NeuroImage. 2007 Feb;34:1506–1518. doi: 10.1016/j.neuroimage.2006.10.043. [DOI] [PubMed] [Google Scholar]
- Vincent R. BrainWeb: Simulated Brain Database. 2006 http://www.bic.mni.mcgill.ca/brainweb/ [Google Scholar]
- Yeo BTT, Krienen FM, Sepulcre J, Sabuncu MR, Lashkari D, Hollinshead M, Roffman JL, Smoller JW, Zöllei L, Polimeni JR, Fischl B, Liu H, Buckner RL. The organization of the human cerebral cortex estimated by intrinsic functional connectivity. Journal of Neurophysiology. 2011 Sep;106:1125–65. doi: 10.1152/jn.00338.2011. [DOI] [PMC free article] [PubMed] [Google Scholar]


