

Abstract
We begin with a look back at the field to identify themes of recent research that we expect to continue to occupy researchers in the future. As part of this overview, we characterize the themes and topics examined in research about measurement and survey questions published in Public Opinion Quarterly in the past decade. We then characterize the field more broadly by highlighting topics that we expect to continue or to grow in importance, including the relationship between survey questions and the total survey error perspective, cognitive versus interactional approaches, interviewing practices, mode and technology, visual aspects of question design, and culture. Considering avenues for future research, we advocate for a decision-oriented framework for thinking about survey questions and their characteristics. The approach we propose distinguishes among various aspects of question characteristics, including question topic, question type and response dimension, conceptualization and operationalization of the target object, question structure, question form, response categories, question implementation, and question wording. Thinking about question characteristics more systematically would allow study designs to take into account relationships among these characteristics and identify gaps in current knowledge.
Introduction
There are many ways to approach the future, and we begin by looking back. In the first part of our article, we take stock of current knowledge by identifying recent investigations relevant to designing survey questions. We characterize the topics covered by research about survey questions published in Public Opinion Quarterly in the past decade. Then we look at the field more broadly to identify some relevant results and areas that we expect to continue to occupy researchers in the immediate future. In the second part of our article, we consider additional directions for future research, and that leads us to advocate for a decision-oriented framework for thinking about survey questions and their characteristics. Although survey instruments are more than the sum of the questions of which they are composed, and survey measurement includes topics in addition to those concerning questions and questionnaires, our main focus here is questions. We review a large body of research on designing questions, but we do not provide prescriptions for question design more generally. For that purpose, we guide readers to other recent publications such as Krosnick and Presser (2010) and Schaeffer and Presser (2003).
Recent Research with Implications for Questionnaire Design: Topics, Themes, and Findings
One of many areas in which POQ has contributed to improvements in survey methodology is survey measurement, particularly question design—which we construe broadly to include issues of mode because of the implications that mode has for measurement. In order to characterize which topics have occupied researchers in the area of survey measurement, we turn to POQ and summarize topics considered by work published there in the past decade. We then characterize the field more broadly by highlighting themes that we expect to continue or grow in importance.
TOPICAL SUMMARY OF A DECADE OF RESEARCH IN POQ
We compiled articles published in POQ from 2000 to 2010 that examined the effects of variation in question development, context, wording, format, form, or implementation (including mode) on measurement. The 78 articles we identified varied with respect to whether they focused on an issue specific to a substantive problem or topic such as support for affirmative action (e.g., Wilson et al. 2008) versus one or more general problems faced by question designers such as the impact of question characteristics on respondents’ behavior (e.g., Holbrook, Cho, and Johnson 2006). Appendix A provides an overview of the articles we examined, ordered by year. For each article we selected, we categorize the general topic explored and then note the implications of the article for current practice in survey measurement. Based on our review, we highlight the following:
A substantial number of studies examined the design of questions for administration in Web surveys. Over the period examined, roughly one-third of the articles dealt with questionnaire design issues in Web surveys, including a special issue on “Web Survey Methods” in 2008.
A large number of studies evaluated the impact of visual aspects of question design on responses to self-administered instruments, both paper and Web based, a theme we return to in our general discussion.
Several papers incorporated new methodologies (or applied known methods to new topics) to increase data quality in measurement. As an example, Delavande and Rohwedder (2008) made use of a computer-assisted visual display to compare an approach in which respondents allocated balls into bins to indicate what chance they believed they would have to receive Social Security benefits of varying amounts to a question using a standard percent-chance format (e.g., “On a scale from 0 to 100, what is the percent chance your benefits will be more/less than $X?”).
Some studies explicitly evaluated the effects of different modes of administration on survey responses, effects for which the design of the instrument and the consequences for the response process are partly responsible. For example, Heerwegh and Loosveldt (2008) find that Web survey respondents provide lower-quality data than face-to-face respondents.
Response effects—especially unintended effects due to question context and ordering—continued to be studied. Whereas some studies focused on demonstrating such effects, others attempted to uncover and document conditions and variables associated with the effects (e.g., Bishop and Smith 2001; Holbrook et al. 2007; Moore 2002; Schuman 2009).
TOTAL SURVEY ERROR PERSPECTIVE
The goal of considering the components of survey error and evaluating the impact of reducing a component of error on total cost (Groves 1989) is important for the task of measurement in several ways (Biemer 2010; Groves and Lyberg 2010). First, measurement errors may affect attempts to reduce other components of the total error in a survey estimate. For example, when measurement errors are correlated with characteristics of respondents or true values, such as when parents who receive no child support report more accurately than those who do, measurement errors may compromise adjustments intended to reduce nonresponse bias (e.g., Lin and Schaeffer 1995; Lin, Schaeffer, and Seltzer 1999). Second, measurement errors may increase when “reluctant respondents” are included to increase response rates in the hope of reducing nonresponse bias (see, e.g., Peytchev, Peytcheva, and Groves 2010). Third, measurement strategies can affect other components of error directly, as when, for example, respondents to Web surveys become nonrespondents when presented with a grid (Peytchev 2009). Fourth, although instrument development and testing can take considerable time, increases in reliability translate into increases in effective sample size that could make efforts to improve measurement cost effective. Finally, the perspective reminds practitioners to consider how design decisions affect both variable errors and bias.
But researchers can assess how a feature of a survey question affects some component of survey error only if the study includes a criterion, and studies of measurement often overlook this critical aspect of design. Although past research often allows us to predict how a marginal distribution will be affected by changing the order of two questions or by reversing the order of categories in a response scale, we are too often unable to say which version of a question is more reliable or valid. In the absence of evidence of reliability or validity, we sometimes rely on the presumed correlates of reliability or validity provided by supplementary criteria—such as information provided by focus groups and cognitive interviews during the development and testing of questions (Willis, DeMaio, and Harris-Kojetin 1999), paradata in a Web survey (Malhotra 2008; Smyth et al. 2006), an underlying structure of errors (e.g., Biemer 2004; Kreuter, Yan, and Tourangeau 2008), or interaction coding in interviewer-administered interviews (Fowler 1992; Oksenberg, Cannell, and Kalton 1991).
Demonstrations of the circumstances under which these proxy criteria really capture aspects of reliability or validity are difficult to design and have given mixed results. For example, using an iterative question development process that includes focus groups and cognitive interviews does not ensure that validity will improve (Schaeffer and Dykema 2004), and changes in question wording by an interviewer are sometimes associated with less accurate answers, sometimes with more accurate answers, and sometimes there is no relationship (Dykema and Schaeffer 2005). However, when respondents “report” information instead of giving a formatted answer, hesitate, or qualify their answers, the evidence is fairly consistent that measurement error is likely to be higher (Dykema, Lepkowski, and Blixt 1997; Hess, Singer, and Bushery 1999; Mathiowetz 1999; Schaeffer and Dykema 2004; Schober and Bloom 2004).
COGNITIVE VERSUS INTERACTIONAL APPROACHES TO SURVEY QUESTIONS
Most research about survey questions takes either a cognitive or an interactional approach. Cognitive approaches, based on social-information-processing models of the response process (e.g., Cannell, Miller, and Oksenberg 1981; Tourangeau 1984), generate hypotheses about how features of questions affect the stages of the response process, particularly comprehension and retrieval. A large corpus of studies based on this approach demonstrated how useful theory can be in generating hypotheses, interpreting findings, and moving the field forward (see, e.g., Turner and Martin 1984; Sudman, Bradburn, and Schwarz 1996; Tourangeau, Rips, and Rasinski 2000). Experiments in this tradition vary characteristics of questions and analyze answers but assume that the question on the page or screen is the question that interviewers ask and that the answer recorded in the data file is produced by the respondent's interaction with the question—the interviewer rarely makes an appearance. In contrast, interactional approaches recognize that there are three parties to (interviewer-administered) interviews—the interviewer, the respondent, and the task, that is, the survey question. Sudman and Bradburn (1974) used this structural analysis to organize their early literature review, but examination of what actually happens during the interview was prominent in the tradition of interaction coding originating in the work of Charles Cannell et al. (Cannell, Fowler, and Marquis 1968; see also Brenner 1982; Dijkstra and Van der Zouwen 1982; Van der Zouwen and Smit 2004).
The motivation for examining interaction is provided by an implicit conceptual model of the relationship among the characteristics of survey questions, the behavior of interviewers, the behavior and cognitive processing of respondents, and the measurement properties of the resulting answers (Fowler and Cannell 1996; Schaeffer and Dykema 2011; see also Ongena and Dijkstra 2007). This model is based on a variety of sources, such as evidence of interviewer variance, which motivates the practices of standardization (see review in Schaeffer, Dykema, and Maynard 2010), and evidence that behaviors such as response latency are associated with cognitive processing (e.g., Ehlen, Schober, and Conrad 2007; Garbarski, Schaeffer, and Dykema 2011; Schaeffer et al. 2008) or reflect conversational practices that have consequences for measurement (e.g., Schaeffer 1991; Schaeffer and Maynard 2002). Conversational practices may be involved in the response process for self-administered as well as interviewer-administered instruments. Because the quality of measurement is affected by both the ability of respondents to interpret and remember and how questions are implemented in the interview, future research is likely to draw on these perspectives as well as related methods such as analysis of paradata and usability testing (e.g., Couper, Tourangeau, and Marvin 2009).
THE INTERSECTION OF INSTRUMENT DESIGN AND INTERVIEWING PRACTICES
Although the practices of standardization dominate survey interviewing, there are varieties of standardization (Viterna and Maynard 2002), and some tasks that are included in interviews entail more variable trajectories than traditional standardization can easily accommodate. What we think of as “instrument design” developed along with the practices of standardization, and changes to the style of the instrument may entail changes in the method of interviewing, and vice versa. Methods such as event history calendars (Belli, Stafford, and Alwin 2009) or time lines (Glasner and Van der Vaart 2009; Van der Vaart 2004) are not administered in a linear manner. Similarly, absent the constraints of a computer-assisted instrument, interviewers and respondents are unlikely to complete complex rosters and grids in a strictly scripted manner. Such instruments require their own principles of instrument design (e.g., how and when to present definitions and probes) and interviewing and an accompanying training regimen that has the goal of reducing interviewer variability (e.g., Sayles, Belli, and Serrano 2010). In addition, surveys that incorporate methodologies such as cognitive assessments, physical measurements, or physical tests combine both more scripted and less scripted styles of administration and require methods that train interviewers in ways that control variability (Jaszczak, Lundeen, and Smith 2009; Sakshaug, Couper, and Ofstedal 2010; Sastry, McGonagle, and Schoeni 2009). For example, if interviewers must take peak flow readings, the survey must have field procedures and methods to train and monitor interviewers for quality during the field period—in addition to providing the words used to introduce and explain the task to the respondent.
MODE AND TECHNOLOGY
Several reasons have combined to make multi-mode survey designs and the relationship between question design and mode increasingly prominent (Dillman, Smyth, and Christian 2009). Some reasons are rooted in features of study design, including an increasing and quickly changing range of affordable technologies (Conrad and Schober 2008; Couper 2008), the movement of subgroups in the population (and increasingly the population as a whole) away from landlines (Blumberg and Luke 2010), and declining participation due to both increasing refusals and difficulties in making contact (Curtin, Presser, and Singer 2005), all of which motivate researchers to contact sample members in multiple modes. Other reasons are consequences of complex measurement goals: Once the expense of securing a respondent has been incurred, researchers may want to use demanding interviewing techniques to improve recall (Belli, Shay, and Stafford 2001) or collect biological measures (e.g., Sastry et al. 2009) and cognitive assessments (Schaeffer et al. 2008; Yonker, Hauser, and Freese 2007). In addition, new technologies may blur traditional distinctions between modes, as for example when a video interviewer or animated avatar reads the questions for a self-administered instrument (Conrad and Schober 2008).
Making comparisons between survey questions administered in different modes is complex and often inconclusive (e.g., Tourangeau, Steiger, and Wilson 2002). The possible reasons for differences between modes include differences in sampling frames; nonresponse (with the proportions of refusals and noncontacts varying across modes); interviewer recruiting, training, and supervision; respondent selection procedures; details of question implementation that affect question formatting, structure, wording, delivery, or recording of answers; or item nonresponse due to the better capacity of interviewers using computerized instruments to obtain complete answers. Researchers who design instruments for surveys using multiple modes have two main concerns: that instruments not contribute to differences between modes in the rates or types of refusals, and that measurements taken using different modes can be combined in analysis. The survey instrument could interact with mode in affecting nonresponse if, for example, respondents to the Web version of an instrument break off during an item battery but respondents to the paper version of the instrument do not. But researchers’ concerns have focused on combining responses obtained with different modes, particularly responses to self-administered and interviewer-administered modes, and particularly when the questions are rating scales, which may be answered very differently in self-administered and interviewer-administered modes (e.g., Heerwegh and Loosveldt 2008; Springer and Hauser 2006). For example, in a mixed-mode survey, investigators may want to analyze respondents who answered a paper self-administered questionnaire used in nonresponse follow-up together with respondents who answered in the main telephone mode; but answers for these two groups of respondents could differ because of mode or because of differential selection into mode. Similarly, sometimes the modes in a mixed-mode design vary with respect to primacy and recency effects (for questions that ask respondents to select from a list of objects), and combining groups of respondents who have selected themselves into different modes further complicates the analysis by confounding the selection process and the mode effect.
One approach to designing questions for multiple modes is to try to identify mode-invariant question forms, questions that respondents with the same true value would answer the same way across modes (Dillman et al. 2009); another approach is to use in each mode the type of question that obtains the most reliable or valid answer, even if that type of question would show a mode effect in an experimental comparison. Questions that give the same result across modes can be best identified by between-subjects experiments in which sources of differences between modes other than the question are held constant. Because of the challenges of implementing such experiments, they may use specialized populations (such as university faculty or students). Results may then be affected by the underlying true distribution (e.g., if no one engages in threatening behavior, attempts to improve reporting will appear ineffective), and the results might not be generalizable to other populations.
SELF-ADMINISTERED INSTRUMENTS—VISUAL ASPECTS OF QUESTION DESIGN
Important advances made over the past two decades in documenting and understanding the impact of the visual aspects of question design will probably continue as the use of self-administered mail and Web surveys grows in stand-alone surveys, as a component of face-to-face interviews, and in mixed-mode designs (Christian and Dillman 2004; Couper 2008; Jenkins and Dillman 1997; Redline et al. 2003; Tourangeau, Couper, and Conrad 2004; Tourangeau, Couper, and Conrad 2007). Researchers have focused on how nonverbal information such as images and graphics (e.g., the “size, brightness and color, shape, location, and spatial arrangement of words, numbers, and symbols”) (Christian and Dillman 2004, p. 59; see also Couper, Tourangeau, and Kenyon 2004), numbers (Schwarz et al. 1991), and symbols (Redline and Dillman 2002; Redline et al. 2003) interact with verbal information to affect survey responses. Several experiments demonstrate the impact of images on survey responses. For instance, Couper et al. (2004) show that coupling images with questions in Web surveys can influence responses (e.g., pictures depicting high behavioral frequencies were associated with higher reporting of the behavior than pictures depicting low behavioral frequencies). Persistent context effects have been demonstrated in a series of experiments in which respondents were presented with images of a sick or healthy person and asked to rate their own health (Couper, Conrad, and Tourangeau 2007).
Tourangeau et al. describe five heuristics that respondents are likely to use when processing visual information provided in a self-administered questionnaire: middle means typical; left and top mean first; near means related; up means good; and like means close (Tourangeau, Couper, and Conrad 2004; see also Dillman 2007). In experiments that varied the color scheme and labeling of scale points of response options in Web surveys, Tourangeau et al. (2007, p. 109) provide evidence indicating that respondents may impose a hierarchy when attending to visual characteristics of rating scales in which verbal information trumps numerical information, which has priority over color. Researchers have also shown that the size of the answer space provided conveys information that affects responses. In the case of reporting dates, using a smaller space for the month and a larger space for the year increases the percentage of respondents who report dates in the desired format (Christian, Dillman, and Smyth 2007). Several other researchers have demonstrated that when provided with a larger answer space on a paper instrument for recording open-ended text, respondents write more (Christian and Dillman 2004; Israel 2010; Smith 1993). Researchers have applied these principles of visual design in innovative ways. For example, Kimball and Kropf (2005) coded paper-based voting ballots based on features such as location and readability of instructions, shading, bolding, and clutter, and show that the features were associated with “item nonresponse” (unrecorded votes) in gubernatorial contests from select counties. The majority of the studies we identified focus on self-administration in mail and Web surveys. Fewer studies replicate or explore visual aspects of designing questions for administration in computer-assisted self-interviewing (CASI or ACASI) or consider issues that affect interviewers.
CULTURE
Recent interest in the role of culture in and the requirements for cross-cultural survey research is reflected in a range of studies (e.g., Harkness, Van de Vijver, and Mohler 2003; Harkness et al. 2010). Developing recommended practices for translation across countries and for subgroups within a country is a major focus of this work (e.g., Harkness, Pennell, and Schoua-Glusberg 2004). However, more recent work has also focused on a wide range of survey design and implementation issues that affect measurement, including issues related to operationalization and communication of questions and constructs (Johnson et al. 2006; Smith 2003), response and context effects (Schwarz 2003), and question testing and evaluation (see, for example, a discussion and overview of the use of interaction coding in cross-cultural contexts in Schoua-Glusberg 2011). An overview of issues and a compendium of recommended practices are maintained at the “Cross-Cultural Survey Guidelines” website (see http://ccsg.isr.umich.edu/index.cfm).
Writing Survey Questions: Decisions and Question Characteristics
Writing survey questions requires attention to the conceptual and operational definitions of survey concepts as well as to the technical issues that arise in composing the items themselves. These technical issues are examined in a body of research, some of which we have just discussed, that considers how characteristics of questions affect responses, their distributions and associations with other variables, and their validity and reliability. The usefulness of this research depends, ultimately, on the underlying analysis of the characteristics of questions, which characteristics are compared, and how the dependencies among question characteristics are taken into account in the study design. For example, what characteristics of questions should be held constant when the effect of another characteristic is being estimated? If one wants to examine how using an odd versus an even number of response categories affects the measurement properties of rating scales, must all the scales included in the analysis be either bipolar or unipolar and have comparable verbal and numeric labels? Or, if one has estimated how reliability is affected by using three, four, or five categories in a unipolar rating scale with verbal labels, to what other types of rating scales can the results be generalized? Making progress in understanding how the characteristics of questions affect measurement requires that we also develop our understanding of what those characteristics are and how they co-vary or nest within each other. In principle, one could compare different approaches to the study of question characteristics on such dimensions as which characteristics are identified, how the characteristics are conceptualized, and their operational definitions.
A common way to identify question characteristics does so in an ad hoc manner to meet the needs of a specific analysis. The challenges involved in such comparisons can be seen by examining the question characteristics included in three analyses chosen as illustrations in table 1. Each of these analyses attempted to measure an aspect of the complexity of an item's language or grammar. Knauper et al. (1997, p. 186) identified several concepts that might affect how difficult it was for the respondent to interpret the question: question length, question complexity (syntax), presence of instructions (e.g., “include” or “exclude”), introductory phrases, and ambiguous terms. Holbrook et al. (2006, p. 570) looked at “five characteristics that may influence their [questions’] difficulty: question length, the reading level of the question (a function of word and sentence difficulty), the level of abstraction of the concepts referenced in the question, the response format used, and whether the question required respondents to make a qualified judgment.” For Yan and Tourangeau (2008, p. 56), “Question complexity is represented by the number of clauses in the question (excluding the response categories), the number of words per clause, and the question type….” In table 1, we have arranged similar concepts in the same row. Although the concepts and operational definitions are compelling (and productive) in all three cases, the only measures common to all three studies concern question length, question complexity, and some indication of the type of response categories, but even then their operationalizations vary. (See Molenaar 1982 for an early analysis of “formal” question characteristics that anticipated these later developments—including the use of the Flesch reading score.)
Table 1.
Comparison of Ad Hoc Analyses of Question Characteristicsa
| Knauper et al. 1997 | Holbrook, Cho & Johnson 2006 | Yan and Tourangeau 2008 |
| Question length (number of words) [Understanding] | Question length (number of words) | Number of words per clause [Complexity of the question] |
| Question complexity (for example, embedded or inverted sentences) [Understanding] | Reading level (Flesch-Kincaid Grade Level) | Number of clauses [Complexity of the question] |
| Instructions to respondent (for example, “not counting any money or assets…”) [Understanding] | Qualified judgment (e.g., specified time frame or excluding items) | |
| Ambiguous terms (e.g., “Do you have less than one drink…”) [Understanding] | Level of abstraction (very abstract, somewhat abstract, concrete) | |
| Introductory phrase (e.g., “The next question might not be easy…”) [Understanding] | ||
| Whether or not question asked for a retrospective report [Retrieval/judgment] | ||
| Attitude/opinion [Complexity of the question/question type] | ||
| Behavioral frequency report [Retrieval/judgment]Quantity report [Retrieval/judgment] | Factual/behavioral [Complexity of the question/question type] | |
| Demographic [Complexity of the question/question type] | ||
| Whether a response scale is provided [Response formatting] | Response format (requesting numeric values, verbal labels, yes/no) | Nature of the response categories (not a scale, fully labeled scale, end-point-only-labeled scale, rating scale, frequency scale) [Complexity of the response options] |
| Number of response categories [Complexity of the response options] |
Phrases in square brackets indicate the authors’ label for the concept under which the specific characteristic appears. The dependent variables in the three analyses are, respectively, “don't know” answers, behaviors that suggest comprehension or mapping difficulties, and response times.
A second way that survey researchers have identified question characteristics is by associating “problems” that interviewers or respondents encounter with specific features of survey questions (see table 2). The association may be based on observations of such problems, for example in cognitive interviews, or by informed speculation about the possible consequences that features of questions might have for interviewers or respondents; both observations and speculations may be guided by the information-processing model of the question-answering process. So, for example, the Problem Classification Coding Scheme (CCS) lists 28 “problems” grouped under the stages of answering a question (Forsyth, Rothgeb, and Willis 2004, p. 530), and the Question Appraisal System (QAS) comprises 28 characteristics of questions that may cause problems in cognitive processing (Willis 2005). (See also Van der Zouwen and Dijkstra (2002, pp. 236–37) for another approach.) Table 2 shows partial results of using these two approaches to code potential problems in an illustrative item about vision and compares the results with those obtained using the Question Understanding Aid (QUAID) (Graesser et al. 2006). The first two methods are rooted in the four-stage social-information-processing model of the response process; QUAID consults databases about language and applies a technical analysis of grammatical structures. We have retained the authors’ terminology but arranged the rows so that categories concerned with roughly the same issue are grouped together. Although all three systems recognize that there is some vagueness in the item, the systems vary in precisely where they locate the vagueness. Two approaches identify issues with complexity, with the technical term “newsprint,” and with the reference period, but the specific diagnosis varies, and one of the approaches finds issues (e.g., inappropriate assumptions, constant behavior, and issues of social acceptability) that the other two do not. However, none of the three approaches locates one common problem that can be seen by observing behavior during the interview when this item is administered to older adults—whether or not to include “reading glasses” as “glasses,” as shown in the following transcription from an actual interview:
I: during the past four weeks have you been able to see well enough to read ordinary newsprint without glasses or contact lenses (pause)
R: ah just reading glasses (pause)
I: okay I'm just going to reread the question
R: [Overlap][Laugh Token] okay
I: [Overlap] uh
I: during the past four weeks have you been able to see well enough to read ordinary newsprint without glasses or contact lenses (pause)
R: ah (pause)
R: no
I: okay
Table 2.
Codes from Applying Three Systems for Identifying Problems to a Single Itema
During the past four weeks, have you been able to see well enough to read ordinary newsprint without glasses or contact lenses? YES/NO
| Problem Classification Coding Scheme (CCS) | Question Appraisal System (QAS) | QUAID |
| Vague topic/term [“able to see,” “well enough”] | VAGUE: There are multiple ways to interpret the question or to decide what is to be included or excluded. [It is not clear whether this means only in written form, or on the computer, as people increasingly get their news that way.] | Vague or imprecise relative terms: Quantification ambiguity: well |
| Complex topic [“able to see well enough to read ordinary newsprint without glasses or contact lenses”] | WORDING: Question is lengthy, awkward, ungrammatical, or contains complicated syntax. [Question is complex and may be difficult to comprehend.] | |
| Question too long | ||
| TECHNICAL TERM(S) are undefined, unclear, or complex. [The term “newsprint” may not be generally understood.] | Unfamiliar technical terms: newsprint, lenses | |
| INAPPROPRIATE ASSUMPTIONS are made about the respondent or about his/her living situation. [Assumes that people have even tried to read newsprint.] | ||
| ASSUMES CONSTANT BEHAVIOR or experience for situations that vary. [Assumes a static situation that lasted for four weeks.] | ||
| SOCIALLY ACCEPTABLE response is implied by the question. [The question is classically biased in that it presents only “one side of the story” (that you CAN see well enough).] | ||
| Reference period unanchored or rolling | Vague or imprecise relative terms: Temporal ambiguity: past |
Comments of expert coders appear in square brackets.
The varied ways in which question characteristics have been identified are reflected in the different approaches to conceptualizing them. Question characteristics may be specified as the presence of a feature (such as features of the response categories) or as the absence of a feature (such as the absence of a transition; see Forsyth et al. 2004, p. 530). There is also variation in how clearly the question characteristic is defined, which may affect how reliably it is coded for analysis. Some question characteristics seem relatively specific, such as “Double-barreled: contains more than one implied question” (Willis 2005, p. 82) or “[reference period] carried over from earlier question” (Forsyth et al. 2004, p. 530). But other question characteristics require more interpretation, for example by referring to an implicit threshold (e.g., of word length or difficulty) that, if crossed, might lead to problems or lower measurement quality (e.g., “Question too long” or “COMPUTATION problem: The question requires a difficult mental calculation”).
Another way that survey researchers have identified question characteristics is by analyzing the decisions that are made when questions are written. For example, figures 1 and 2 show some of those decisions for two common types of survey questions: questions about events and behaviors and questions that use rating scales (Schaeffer and Presser 2003; see also Fowler and Cosenza 2008; Saris and Gallhofer 2007b). Some of the decisions in figures 1 and 2 have an inherent order or nesting. For example, if one uses a bipolar rating scale, one must decide whether or not to offer a middle category and, if it is offered, whether and how to label it. In addition, the outlines in figures 1 and 2 suggest that there are some fundamental differences among items of different types that might be inappropriate to ignore in the analysis of how question characteristics affect measurement. For example, a decision about the “number of categories” potentially means something different for a rating scale (for which the respondent is trying to locate an intensity category that conveys their own intensity) than it does for a question about the frequency of events (for which the respondent is trying to compile memories supplemented with estimation and heuristics).
Figure 1.

Simplified Schematic of Decisions for Questions About Events and Behaviors, Showing Detail for Frequency Questions.
Figure 2.
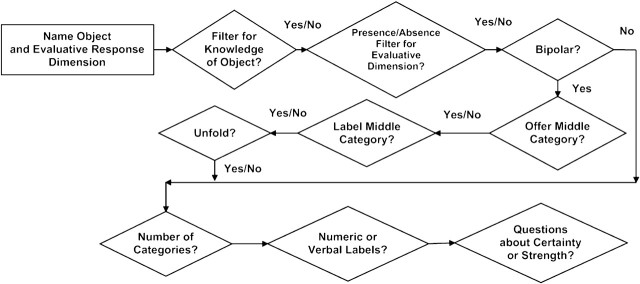
Simplified Schematic of Decisions for Questions That Use Rating Scales.
The approach to thinking about item characteristics that we propose below identifies item characteristics by first distinguishing among classes of decisions to be made in writing survey questions. For these classes of decisions, we use the following labels: question topic, question type and response dimension, the conceptualization and operationalization of the target object in a question, question structure, question form, response categories, question implementation, and question wording. We attach these labels—“structure,” “form,” “characteristics,” and so on—to the various classes of decisions, knowing that the labels have been used somewhat differently in the past, that the classes could have been labeled somewhat differently, and that distinctions between classes are clearer in some cases than in others. Despite the difficulties involved, however, we believe that pursing these underlying distinctions can identify issues about survey questions and their characteristics that may have been overlooked and provide a useful framework for organizing the results of past and future research. A systematic framework such as the one we propose is particularly useful to aid in understanding how item characteristics are related to each other—many item characteristics can be distinguished in principle but are correlated in practice. In addition, the conclusions one reaches about the importance of some question characteristic may depend on the range of characteristics included in a given analysis, and we currently have little theory or practice to guide decisions about what range of characteristics should be included.
Here is an extended example. Closed (or “selection,” Dohrenwend 1965) questions about the frequency of events can use at least three different types of categories: relative frequency categories (sometimes called “vague quantifiers” of frequency), grouped absolute frequencies (e.g., 1–10, 11–15, etc.), or rates (e.g., about once a day, several times a week, a few times a month, etc.). Among the challenges of designing an experimental comparison between open and closed questions about the frequency of events are those of selecting which type of closed question to use and how to label the resulting categories. The three types of closed categories may evoke different cognitive processing; and processing may well interact with the number of categories, the specific labels used, and the mode in which the questions are administered. Thus, an experiment that includes only one type of closed question may provide the ability to generalize only to that type of closed question administered in the mode used in the experiment. Furthermore, decisions about whether to use open or closed questions (and consequent concerns about the order of response categories and cognitive processing) are substantially different for questions about the frequency of events than they are for questions that ask respondents to select from among a set of objects (such as “What is the most important problem facing the country these days?”). Indeed, in Dohrenwend's (1965) classification, “open” questions that ask for specific quantities, such as frequencies or dates, are considered “identification” questions rather than open questions.
QUESTION TOPIC
“Topic” can refer to a broad domain of content, such as “health,” or to more refined distinctions (such as “evaluation of own health in absolute terms” vs. “comparison of own health to that of others”), and both levels can be important in thinking about issues of measurement. Topics vary along several dimensions, including how threatening they are, how difficult they might be (e.g., recall of past experience vs. current experience), whether they involve comparisons, and so forth. Although some discussions of question characteristics consider the role of topic (e.g., “domain” in Saris and Gallhofer 2007b), the influence of topic has not received systematic attention, perhaps because the range of content in any given analysis may be highly restricted. Consequently, we do not have a consensus about what features of topics might be important to measure, other than, perhaps, some aspects of how the topic might affect retrieval or how threatening a topic is, although even in the latter case we lack a clear metric for assessing question threat. An additional complication is that topic may be closely related to other question characteristics, such as question type (e.g., questions that ask about the future may use some sort of bipolar scale to ask whether things will get better or worse). For these reasons, it may be difficult to draw conclusions about how the topic of a survey question influences measurement, controlling for other features of the question.
QUESTION TYPE AND RESPONSE DIMENSION
Although we do not have a compendium of different types of survey questions (compare Yan and Tourangeau 2008, p. 56; this is roughly what Turner and Martin 1984 labeled “nature of the judgment” and Saris and Gallhofer 2007b labeled “concepts”), such a list would include, at least, questions about events and behaviors (that is, questions that ask about target objects that occur in time, whether the event is external or internal, performed by the respondent or occurring in the respondent's environment), evaluations or judgments (absolute or comparative) about objects (such questions are often used to measure “attitudes,” which we consider a theoretical construction rather than a type of question), internal states or feelings (such as worry or happiness), accounts (such as reasons for leaving a job), classifications (such as whether one has a defined benefit retirement plan), other social characteristics (such as age and marital status), and descriptions of the environment (such as how many FTEs are employed at the place you work). Many classification questions and social characteristic questions are associated with underlying events or behaviors (e.g., one signed up for the retirement plan, got married, gave birth, etc.).
An important reason to distinguish among different types of questions is that they are associated with different topics, response dimensions, response processes, response errors, question structures, and question forms. The various types of response dimensions (e.g., occurrence, frequency, agree/disagree, intensity of an attribute) might be considered a further specification of the type of question. For example, recent work suggests that a type of question in which an object is evaluated directly using a response scale built around an appropriate response dimension can be expected to have higher reliability and validity than a parallel question in which respondents are asked to rate how much they agree or disagree with a statement about the object (Saris et al. 2010). Clearly, question type and question form (discussed later) are closely related.
CONCEPTUALIZATION AND OPERATIONALIZATION OF THE TARGET OBJECT
Early in the process of developing questions, researchers refine their conceptualization of the target object that a specific question asks about—which, in the terminology of figures 1 and 2, could be an event or behavior being assessed on some response dimension associated with frequency or an object being rated—and select words to label that target object. For example, a researcher might need to decide exactly what sorts of contacts with what sorts of medical providers to ask about and how to label the contacts (e.g., “office visits,” “telephone calls,” “e-mail or other contacts over the Internet”) and providers (e.g., “physicians,” “physician's assistants and other medical providers who work with physicians”). Or, a researcher might want to obtain ratings of “Governor Walker's Budget Repair Bill,” but will need to decide what to call it, which version of the bill to ask about, and whether or not to describe specific provisions of the bill. Decisions about these matters are somewhat related to decisions about question structure and question form, but once a label is selected, it can often be implemented in a range of question structures and forms. Similarly, decisions about how to label a target object clearly overlap with issues of question wording. For example, whether a question refers to “abortion” or “ending a pregnancy” or asks about whether to “forbid” or “allow” a behavior (Schuman and Presser 1981) are matters of both the labeling of the target object and the wording of the question. The operationalization of the survey concept may be complicated in several ways: by conditions (e.g., “Have you received treatment for an injury in the past five years?”); by other modifiers—usually adjectives, adverbs, or prepositional phrases—that set a threshold for reporting (e.g., “Did you see a doctor for any, reason…”); by instructions to “include” or “exclude” certain objects; by explicit definitions; by cues for retrieval; by examples; or by being presented as a positive or negative concept (e.g., are you “happy” versus are you “unhappy”).
We noted above that research about the effectiveness of methods for testing survey questions has been inconclusive. Our tools for question development, for turning the raw material of the content of a domain into a structure of questions to measure a concept, are probably in an even more primitive state. Even when the target objects to be asked about are relatively clear (e.g., the amount of child support owed and received), a large number of approaches is possible. When the objects are less clear (e.g., beliefs about climate change), the possibilities are even greater. During question development, decisions about conceptual and operational definitions of survey concepts are closely tied to decisions about question structure.
In many cases, decisions about question structure involve varieties of “decomposition.” This can be seen by considering some relatively simple decisions involving question structure and form for questions about events. If, for example, you wanted to measure “news consumption,” or the frequency with which respondents take in news, you could ask the global question “In the past 7 days, did you read, watch, or listen to news?” Alternatively, you could turn each of the ways in which the news is absorbed (e.g., “watch news on TV”) into separate items and present the items in check-all (items are listed and respondents are asked to select all of the items that are true for them), checklist (items are presented in a grid or matrix in which “yes” and “no” are offered as explicit choices), or stand-alone response formats (items are formatted as distinct questions each with their own “yes” and “no” categories). In selecting among these approaches, you would have to rely on the small body of research comparing checklist to check-all response formats (Dykema et al. 2011). It finds that while checklist formats are associated with respondents providing more “yes” responses (e.g., providing higher counts of events and behaviors) in phone (Jordan, Marcus, and Reeder 1980; Smyth, Christian, and Dillman 2008), paper (Rasinski, Mingay, and Bradburn 1994), and Web surveys (Smyth et al. 2006; Thomas and Klein 2006) and taking longer to answer in Web surveys (Smyth et al. 2006; Thomas and Klein 2006) (which may indicate deeper processing of the items), neither response format has been shown to be more valid than the other, and neither appears to be more or less effective in reducing response effects such as acquiescence bias or primacy effects.
The choice between global versus specific questions is also informed by research on decomposition. Decomposition, a response strategy that respondents sometimes spontaneously use when reporting about events and behaviors (Blair and Burton 1987; Lessler, Tourangeau, and Salter 1989), is an umbrella term that encompasses a variety of approaches. In one common approach, the researcher divides a global behavioral frequency question into two or more mutually exclusive, less cognitively taxing subquestions, usually about an exhaustive set of subcategories, and provides cues along a relevant dimension, such as time, place, person, context, or content. The respondent then recalls or estimates frequencies for the subquestions, and the researcher combines subquestions (e.g., through addition) to obtain a value for the global category (Beatty 2010; Belli et al. 2000; Dykema and Schaeffer 2000; Means et al. 1994; Menon 1997; Sudman et al. 1996; Sudman and Schwarz 1989). Decomposing a general category into a set of more specific categories and more specific questions is also a technique for implementing a definition (e.g., the items in a checklist inform the respondent what we consider to be “news”), and the order of items can be chosen to promote clarity (e.g., asking about visits to nurse practitioners before asking about visits to doctors to encourage a clarifying “subtraction” effect). A category of objects can be decomposed along different dimensions, such as time (temporal), place (spatial), person, and context or content (Belli et al. 2000), and decomposition strategies may vary in effectiveness.
QUESTION STRUCTURE
We use the phrase “question structure” to refer to decisions concerned with relationships between questions. For example, a decision about whether or how to decompose a class of objects would be a decision about how to structure the set of questions. In some cases, the alternative structures comprise one or two closely related questions, and in these cases “structure” and “form” are extremely closely related. Examples would include whether or not to use an occurrence filter followed by a frequency question versus a frequency question alone (Schaeffer and Dykema 1994); how to group multiple filter and frequency questions (Kreuter et al. 2011); or whether to use a “no opinion” filter followed by a rating scale versus a rating scale alone (Schuman and Presser 1981), a valence question followed by an intensity question as in “unfolding” (Krosnick and Berent 1993; Malhotra, Krosnick, and Thomas 2009), or a presence/absence filter followed by an intensity question (Sterngold, Warland, and Herrmann 1999). Using this terminology, a comparison between an unfolded bipolar rating scale and a single-item bipolar rating scale in which both items used the same category labels and yielded the same number of categories would be a comparison of two question structures.
QUESTION FORM
We use the phrase “question form” to refer to decisions about alternate forms for a given question, such as a comparison between open and closed questions about the frequency of face-to-face visits with a physician. Most question forms are built around one of the response dimensions available for a given type of question and project the format of the desired response. Thus, an occurrence question projects a “yes” or “no” answer, and a closed frequency question may project a selection among grouped absolute frequency categories (such as “0 times,” “1–5 times,” etc.) or among relative frequency categories (such as “never,” “rarely,” “sometimes,” etc.). A projected response format can often be implemented in various ways so, although we think of the projected response as a function of question form, we consider the particular implementation (e.g., the number and labeling of the response categories) separately. Although much research about questions that measure evaluations and judgments examines rating scales, Converse and Schuman (1984) provided a classification of a variety of question forms for attitude questions, some of which have not been systematically investigated (see also Molenaar 1982).
RESPONSE CATEGORIES
There has been considerable research about the effect of the number and labeling of response categories—that is, categories offered for respondents to select among or to interviewers for recording answers—for various types of rating scales (Krosnick and Fabrigar 1997; Krosnick and Presser 2010), and of the order of categories for questions that ask respondents to select objects (e.g., “Which of these is the most important problem facing the country these days?”) (Krosnick 1999, p. 552). Comparisons of judgment scales that use a “quasi-filter” or offer a “don't know” category compared to those that do not have been important in theoretical efforts to understand what constitutes an attitude (Krosnick et al. 2002). (Questions with quasi-filters have also been used in experiments about question structure in which questions with quasi-filters are compared to a two-question sequence with a full filter, e.g., Schuman and Presser 1981, p. 125.) Self-administered modes raise additional issues concerning response categories; for example, for questions about events, outstanding issues include how to format answer spaces for open questions about frequencies that respondents might want to report as rates; and for rating scales, outstanding topics include optimal rating scale design for the confined space of screen and page, particularly for mixed-mode surveys.
QUESTION IMPLEMENTATION
An item is ultimately tailored in some way to fit the mode in which it is presented and, although details of the implementation of the item in a given mode may have consequences for the quality of the resulting measurement, such details may be omitted when results are reported. For an interviewer-administered mode, features of implementation may include interviewing practices taught in basic training (e.g., how to probe when the respondent says “don't know”), item-specific instructions to the interviewer included in the instrument (e.g., “repeat question stem as needed”), the use of a show card, and scripted instructions to explain the task (e.g., “I am going to read a list of medical practitioners you might have had contact with about your own health. As I read each one, please tell me whether or not you had contact with that type of medical practitioner in the past 12 months. First, did you have contact with a nurse practitioner about your own health in the past 12 months?”). The instructions, layouts, and quasi-filters used for batteries of items, rosters, and grids can also have implications for the quality of measurement (Alwin 2007; Fuchs 2002; Hess et al. 2001; McClendon 1991; Saris and Gallhofer 2007b). In addition to the order of questions and the use of introductions that may result in buffering or priming, important features of implementation include the formatting or layout of the item on the page or screen, which can be informative and consequential for both interviewers (e.g., Sanchez 1992) and respondents (e.g., Redline et al. 2003; Sudman et al. 1996, pp. 122–23). Other features of implementation include general instructions to the respondent (e.g., “check all that apply”); the availability, visibility (e.g., categories may be always available in computer-assisted modes but not shown on the screen to reduce their salience and save space), labeling, and spacing of “don't know,” “refused,” and “not applicable” categories (e.g., Tourangeau et al. 2004); and item-specific instructions (e.g., “The list below shows different types of medical practitioners you might have had contact with about your own health in the past 12 months”). As these examples suggest, in many cases implementing a question in different modes entails changes to question wording, instructions, or the way the question is formatted. Implementation also includes such features of the study as global instructions (e.g., providing information about the purpose of the study or attempting to motivate the respondent). Such features of implementation may not be reported because of limitations in space, but also because we are often unaware which are actually consequential.
QUESTION WORDING
We have already discussed under more specific headings some features of questions that could also be considered issues of wording. For example, we grouped techniques for labeling and defining the target object with issues of “conceptualization and operationalization,” and “task instructions” (e.g., “For each task I read, please tell me…”) with “question implementation.” Not dealt with elsewhere are other issues of question wording. In addition to definitions and task instructions, the preambles or introductions of questions accomplish other tasks: reinforce reference periods (e.g., “By ‘last week’ I mean the seven days beginning Monday, March 1, and ending yesterday”), motivate (e.g., “This information is important, so please take your time”), desensitize (e.g., “In talking to people about elections, we often find a lot of people were not able to vote because they weren't registered, they were sick, or they just didn't have time…”), or improve recall (e.g., “Before you answer, think of a number of different things that would likely come to mind if you actually had voted in this election…”) (e.g., Belli et al. 1999). Finally, there remains a substantial group of item characteristics that concern language, particularly usage that affects comprehension (e.g., because the vocabulary or grammar is complex) or retrieval (e.g., because the question provides cues or time for retrieval). Item characteristics involving language include question length; reading difficulty of the vocabulary; number of words that are vague, ambiguous, or technical; and grammatical complexity (e.g., number of clauses, number of conjunctions).
Conclusions
Obviously, we have not attempted to survey the entire field of instrument design since the founding of POQ, but based on the review that we were able to conduct, we speculate that research about question design has gone through stages in which researchers puzzled over differences in marginal distributions produced by (possibly) similar questions, discovered that relationships with other variables could also be affected when features of questions were changed, adapted social-information-processing models to investigate how different versions or orders of questions affected the response process and subsequent answers, observed how interviewers and respondents interact with our survey instruments, and imported theories about perception to study the impact of physical design on information processing and responses. Underlying these stages are themes of the role of technology and respondent characteristics. Research about question design has often begun with findings that seemed puzzling at the time or with reflections on the choices available at different points in the design process, but some of the most productive and coherent lines of research have deployed theories imported from other disciplines to explain the puzzles or rationalize the choices that researchers make.
Our review of recent research with implications for questionnaire design highlighted several themes and topics that are likely to occupy researchers in the coming years. First, declining response rates coupled with variable coverage of the general population for any given mode will continue to conspire to make mixed- and multi-mode survey designs necessary. The implications for designing questionnaires—especially those formatted for interviewer- versus self-administration—can be complex. The tension between writing questions that are invariant across mode versus optimal for a given mode will continue. Second, the field will continue to see research evaluating the impact of visual aspects of question design on responses to self-administered instruments, both paper and Web based. This area has grown rapidly and appears to be driven by both theoretically based agendas (e.g., Couper et al. 2004; Redline et al. 2003; Tourangeau et al. 2004) and responses to practical problems (e.g., Christian et al. 2007). Each of these avenues is likely to continue to produce research and responses. Third, we believe that the increasing costs of fielding traditional surveys, the easy availability of Web survey programs, and the availability of online panels will continue to foster research on designing instruments for administration in Web surveys. Fourth, survey design may become increasingly heterogeneous because of varying research needs and development of diverse technologies, such as video interviewers, some of which may communicate with respondents in tailored ways. Surveys designed to capture many types of measurements for each participant will require complicated instruments and protocols for interviewer training. Other types of surveys may rely on personal technologies—smart phones and their successors—and require questions that can fit on very small screens and be completed quickly. Fifth, the measurement of complex topics, such as household purchases, event histories, and complicated family structures, may require fitting instruments and styles of interviewing to the way in which respondents recall and provide information, while still attempting to control interviewer variability in large-scale production surveys. Finally, as researchers become more aware of the diversity in the populations that provide their data, and they make comparisons across countries or social groups, the demands of cross-cultural measurement will receive more attention.
For survey measurement, an analysis of the decisions made in the process of designing questions is one avenue for identifying “question characteristics” and future topics for research. Our review of decisions and question characteristics to be considered when writing survey questions suggests that current research focuses on a restricted set of the possible topics. An analysis of question characteristics—whether the one we propose in a rudimentary form here or another—implies both an agenda for research (e.g., how question characteristics interact with each other) and the use of a shared or at least more specific terminology that facilitates the cumulation of research findings. We believe that the field will make progress not only by researchers’ addressing specific problems but also by developing a research agenda that offers a systematic conceptual framework and considers how question characteristics are correlated in practice. The theoretical underpinnings of such frameworks are to be found in such disciplines as cognitive psychology, conversation analysis, and linguistics. The routine use of criteria to evaluate different measurement strategies—even a criterion as simple as concurrent prediction, but preferably stronger criteria—is critical for progress in measurement.
The list of topics we were not able to consider is possibly longer than the list of those we were. Data quality can be affected by the interaction between the characteristics of the respondent and the demands of the task (e.g., Knauper et al. 1997; Krosnick 1991). But the motivation of the respondent—a theme from the early work of Charles Cannell (e.g., Cannell and Kahn 1968; Cannell et al. 1981) that also appears in the work of Dijkstra and Van der Zouwen (1987) —has received less attention. The quality of data may be reduced when the respondent is “reluctant” (Couper 1997; Fricker and Tourangeau 2010), when items are grouped in batteries (Alwin 2007; Saris and Gallhofer 2007a) or come late in the interview, all topics that implicitly refer to issues of motivation, as well as ability and fatigue. Dependent interviewing (e.g., Mathiowetz and McGonagle 2000; Pascale and Mayer 2004) is attractive in longitudinal surveys for reducing respondent burden and overreporting of change. Despite considerable effort, we know less about how to effectively develop or test survey questions, how to obtain accurate reports about behaviors, or how to reduce the threat of threatening topics than we need to know. The future looks busy.
Appendix A.
Listing and description of articles broadly related to designing questions and published in Public Opinion Quarterly, 2000–20101
| Year | Topic | Implications for Current Practice | Authors | |
| 2000 | Question wording experiments that concern the definition of the target object were placed in three telephone surveys to determine the source of pro-incumbent bias in Congressional voting patterns. | Topic-specific implications: Not mentioning candidates’ names when evaluating voting behavior may reduce inaccuracy in reporting, which is biased toward overreporting about incumbents. | Box-Steffensmeier, Jacobson, and Grant | |
| Instrument design and interviewing practice experiment in which respondents were interviewed using standardized versus conversational interviewing techniques; although the written question may appear the same in the two implementations, the questions presented to the respondent differ. | Broad-based question design implications: When respondents misinterpret factual questions, providing definitions may improve reporting accuracy. | Conrad and Schober | ||
| Question wording evaluation in which the accuracy with which respondents in a face-to-face survey dated two landmark events is examined. | Broad-based question design implications: Results imply that including landmark events in the wording of a question may not improve respondents’ ability to date other events and may lead to systematic biases. | Gaskell, Wright, and O'Muircheartaigh | ||
| Question structure experiments placed in two mail surveys to evaluate two alternative methods for rating items, to determine which method produces greater differentiation in responding. | Question-specific implications: Results suggest that differentiation is increased when respondents first anchor ratings for items with regard to most–least. | McCarty and Shrum | ||
| Question order naturally occurring experiment in two face-to-face surveys (1994, 1995 NHIS) to examine the effect of preceding questions on difficulty seeing and legal blindness with questions about vision or nonvision. | Topic-specific implications: Results suggest that when administering large batteries of questions about health, unintended context effects may occur. | Todorov (a) | ||
| Question order naturally occurring experiment in two face-to-face surveys (1994, 1995 NHIS) to examine the impact of questions on different conditions on reports of what was the main condition causing a disability. | Topic-specific implications: Results suggest that when administering large batteries of questions about health, unintended but potentially predictable context effects may occur. | Todorov (b) | ||
| 2001 | Instrument design and interviewing practice experiment in which respondents were interviewed using standardized interviewing methods versus event history calendar (EHC) methods in a telephone survey and responses were validated against previously provided reports. | Broad-based question design implications: Results indicated that EHC methods were associated with more consistent reporting for some variables and overreporting for other variables. | Belli, Shay, and Stafford | |
| Response category (order) experiments from 176 evaluations conducted by the Gallup Organization in the 1930s and 1940s to examine overall effect sizes and associations with moderator variables. | Question-format-specific practical implications: Questions administered orally may be more likely to produce recency effects when the questions or response categories are longer. | Bishop and Smith | ||
| Overall questionnaire format/structural design experiments to examine the effects of progress indicators, single or multiple items per page, and use of radio buttons on data quality in a Web survey. | Broad-based and mode-specific question design implications: Responses are influenced by formatting (e.g., formatting questions in multiple-item versus single-item screens may reduce respondent burden and the number of nonsubstantive responses provided). | Couper, Traugott, and Lamias | ||
| Overall questionnaire format experiment to test “household-based” versus “person- based” data collection strategies in a telephone survey. | Question-format-specific implications: Results for using a household- versus person-based strategy were mixed, and decisions about which to use may vary depending on which indictors of data quality researchers want to maximize. | Hess et al. | ||
| 2002 | Question order quasi-experiment in the National Election Study (1964–96) to examine whether the public's decline in “faith in elections” was a methodological artifact. | Topic-specific implications: Results suggest that specific political attitudes may be influenced by context in unintended ways. | Bartels | |
| Question form/wording experiment from two telephone and one face- to-face survey in which respondents are administered political questions and randomly offered the option of providing a “no opinion” response or not. | Broad-based question design implications: Results provide compelling evidence for question designers to unilaterally say “no” to “no opinion” response options. | Krosnick et al. | ||
| Question wording naturally occurring experiment examining what effect omitting examples of specific Hispanic groups had on reporting in the 2000 Census. | Topic- and question-specific implications: Omission of examples of specific Hispanic groups resulted in fewer reports of detailed Hispanic groups, suggesting that inclusion or exclusion of examples may affect survey responses. | Martin | ||
| Question order experiment using data from 1997 Gallup Poll analyzed and led to the development of two novel types of effects termed “additive” and “subtractive.” | Question-specific implications: Documentation of “additive” and “subtractive” question-order effects may be used to better understand, predict, and potentially reduce such effects. | Moore | ||
| Mode experiment comparing differences in measures of data quality between interactive voice (IVR) methods and CATI and mail surveys. | Mode-specific implications: Results indicate that respondents provided more honest answers with IVR than CATI. | Tourangeau, Steiger, and Wilson | ||
| 2003 | Question wording experiments placed in self-administered questionnaires modeled after the YRBS (Youth Risk Behavior Survey) to examine effect of allowing young respondents to select more than one racial/ethnic category. | Topic-specific implications: While allowing respondents to mark one or more race/ethnic categories may only result in a small percentage doing so, it may reduce item nonresponse. | Brener, Kann, and McManus | |
| Mode experiment in a laboratory setting to examine differences in reports about sensitive and socially desirable information between audio-CASI and text-CASI administered under different levels of privacy. | Mode- and topic-specific implications: Results indicate that survey reports are relatively unaffected by the addition of audio to text-CASI. | Couper, Singer, and Tourangeau | ||
| Mode experiment comparing differences in measures of data quality between RDD telephone interviewing and face-to-face interviewing from three sets of national samples. | Mode-specific implications: Results indicate that RDD telephone respondents provided lower-quality data than face-to-face respondents, as evidenced by their being more likely to satisfice. | Holbrook, Green, and Krosnick | ||
| Question wording and ordering experiments from three evaluations to determine variables associated with producing a seam effect. | Question-specific implications: In a panel study, seam effect may be larger when questions about the same topic appear together and when task burdens memory. | Rips, Conrad, and Fricker | ||
| 2004 | Question formatting experiments in a mail survey to examine effects of the use of symbols and graphics on responses. | Broad-based question design implications: Responses are influenced by formatting (e.g., providing larger spaces to record open-ended text increases the amount recorded). | Christian and Dillman | |
| Question formatting experiments in a Web survey to examine the effects of presenting pictures depicting low- or high-frequency examples of a behavior on behavioral frequency reports. | Topic-specific implications: Coupling images with pictures may influence responses. | Couper, Tourangeau, and Kenyon | ||
| Mode/implementation experiment comparing reports about smoking behaviors between telephone audio computer-assisted self-interviewing (T-ACASI) and traditional telephone interviewing. | Mode- and topic-specific implications: Results indicate that respondents are more likely to report smoking behaviors with T-ACASI. | Currivan et al. | ||
| Mode/implementation experiment comparing reports about smoking behaviors and susceptibility between telephone audio computer-assisted self-interviewing (T-ACASI) and CATI. | Mode- and topic-specific implications: Results indicate that respondents are more likely to report smoking behaviors and susceptibility with T-ACASI but that both modes are associated with social desirability response bias. | Moskowitz | ||
| Question formatting experiments in Web surveys to examine how five interpretive heuristics (e.g., “near means related”) influence ways in which respondents assign meaning to visual cues. | Broad-based question design implications: Responses are influenced by formatting (e.g., intercorrelations among items in a battery were highest when the items were presented on the same page than when they were separated). | Tourangeau, Couper, and Conrad | ||
| 2005 | Formatting analysis of paper-based voting ballots to examine whether verbal and visual aspects are associated with unrecorded votes in selected counties. | Questionnaire/mode-specific practical implications: Design features such as the location and readability of instructions, shading, bolding, and clutter may affect item nonresponse. | Kimball and Kropf | |
| Question wording experiments in two telephone surveys to compare response distributions and validity of fully versus minimally balanced questions for measuring attitudes. | Question-specific practical implications: In measuring attitudes using dichotomous questions, minimally balanced may be more efficient and likely comparable to fully balanced questions in terms of data quality. | Shaeffer et al. | ||
| 2006 | Mode/implementation experiment to evaluate the effects of mode (PAPI, CASI) and setting (home, school) on responses to questions based on the YRBS. | Mode-specific practical implications: In measuring sensitive behaviors among youth, reporting may be higher when questionnaires are administered in schools using CASI. | Brener et al. | |
| Question wording evaluations providing an overview of QUAID (Question Understanding Aid) and comparing it to expert and non-expert reviewers and eye-tracking data. | Broad-based practical implications: QUAID (a computer application) may be used to evaluate problems with the wording, syntax, and semantics of individual questions. | Graesser et al. | ||
| Question characteristics analysis of multiple questions to identify associations between question characteristics, respondent characteristics, and indicators of comprehension difficulties. | Broad-based practical implications: Questions with specific characteristics may be associated with indicators that have been associated with poorer data quality. | Holbrook, Cho, and Johnson | ||
| Overall questionnaire format/structural design/ implementation experiment to examine the effects of a paging versus scrolling design on data quality in a Web survey. | Mode-specific practical implications: No differences between the designs on most indicators examined, including nonresponse, break-off rates, and response distributions. | Peytchev et al. | ||
| Response format experiments from two Web and one mail survey comparing check-all and checklist response formats. | Question-specific practical implications: For multiple- item question batteries, formatting the items as checklist versus check-all may improve data quality. | Smyth et al. | ||
| 2007 | Question testing research synthesis on cognitive interviewing. | Broad-based practical implications: While cognitive interviewing is a frequently used pretesting technique, more research is need to understand best practices for implementation and interpretation of the data produced. | Beatty and Willis | |
| Instrument design and interviewing practice experiment in which respondents were interviewed using standardized interviewing methods versus event history calendar (EHC) methods in a telephone survey and responses were validated against previously provided reports. | Broad-based question design implications: Results indicated that while response quality was more variable depending on the question being asked than on the interviewing technique, variability was overall higher using EHC interviewing methods. | Belli et al. | ||
| Question format and wording experiments in three Web surveys to examine how manipulating words, symbols, and graphics affects the percentage of respondents reporting information about dates in the desired format. | Question-specific practical implications: The following all affect the precision with which information about dates is reported: answer space size, representing month and year with symbols, and grouping the space with the symbol. | Christian, Dillman, and Smyth | ||
| Question format experiments in three Web surveys to explore how topic-specific but contradictory images influence survey responses and create context effects. | Overall design and topic-specific implications: Context effects can be induced by including images that are relevant to the topic under study. | Couper, Conrad, and Tourangeau | ||
| Question wording experiment in the 2002 NES to determine whether a new question that provides respondents with socially acceptable reasons for not voting would reduce voter overreporting. | Topic-specific implications: Offering respondents a list of socially acceptable reasons for not voting reduced the percentage who overreported. | Duff et al. | ||
| Response category (order) experiments from 548 experiments in telephone surveys conducted by the Gallup Organization (1995–2000) to examine factors that moderate effects for dichotomous categorical questions. | Question-format-specific practical implications: For dichotomous categorical questions, recency effects are associated with question and respondent characteristics. | Holbrook et al. | ||
| Question format/question response experiment comparing 10-, 11-, and 101-point scales administered in a face-to-face survey to measure left–right political attitudes. | Topic-specific implications: 11-point scales are more valid than 10- or 101-point scales in measuring left–right political orientations. | Kroh | ||
| Question format experiments from two Web surveys that examine the influence of the color scheme and labeling of scale points on responses and response times. | Question-specific practical implications: Respondents make use of the visual features of rating scales when responding. | Tourangeau, Couper, and Conrad | ||
| Question structure/form experiment from a Web survey to compare the item count technique to the direct questioning technique to measure a sensitive versus socially desirable behavior. | Topic-specific implications: While estimates of a sensitive behavior were higher with the item count technique, estimates of a socially desirable behavior were comparable between the two techniques. | Tsuchiya, Hirai, and Ono | ||
| 2008 | Question wording experiment in a telephone survey to compare how respondents, particularly women, classify themselves when asked how they “think” versus “feel” about their party identification. | Question- and topic-specific implications: Respondents may report different attitudes depending on whether questions ask them to “think” versus “feel.” Asking women to report party identification in terms of how they feel may reduce the partisan gender gap. | Burden | |
| Question wording/question format experiment in a Web survey of respondents to the Health and Retirement Study to compare a visual bins-and-balls format to a more standard percent-change format to assess subjective probabilities about Social Security expectations. | Question- and topic-specific implications: Results indicate that using a visual bins-and-balls format to measure subjective probabilities with a computer-assisted visual display may reduce missing data and yield less biased results. | Delavande and Rohwedder | ||
| Response category (order) and response format experiments in a Web survey evaluated using eye-tracking data. | Question- and mode-specific implications: Results provide direct support that primacy effects result from respondents spending more time looking at initial versus later items in a list and failing to view items appearing at the end of a list at all. | Galesic et al. | ||
| Mode/implementation experiment evaluating the consistency in reporting about smoking between school (using PAPI SAQs) versus home (using CAPI versus ACASI) among adolescents. | Topic-specific implications: The underreporting of smoking behavior that occurs in household settings may not be significantly reduced using ACASI methods. | Griesler et al. | ||
| Mode/implementation experiment comparing differences in measures of data quality between a Web and face-to-face survey. | Mode-specific implications: Results indicate that Web survey respondents provided lower- quality data than face-to-face respondents, as evidenced by a higher rate of “don't know” responses, less item differentiation, and more item nonresponse. | Heerwegh and Loosveldt | ||
| Response category (order) naturally occurring experiment from California elections (1978–2002) examining effect of alphabetic randomization for candidates’ names on voting. | Topic- and general-question format-specific practical implications: Response effects were more likely for primary than general elections, suggesting that for choice-based questions, when the amount of information respondents have about the listed choices is lower, response order effects may be more likely. | Ho and Imai | ||
| Mode experiment comparing differences in measures of data quality in reports of sensitive information among CATI, IVR, and Web methods. | Mode-specific implications: Results indicate higher levels of reports of sensitive information and more accurate reporting with the Web survey versus traditional CATI methods, with reports using IVR methods falling between Web and CATI methods. | Kreuter, Presser, and Tourangeau | ||
| Response category (order) experiment in a Web survey to examine the relationship between primacy effects and completion time. | Mode-specific implications: Completion time in Web surveys may serve as an indicator of data quality given that shorter completion times were associated with primacy effects. | Malhotra | ||
| Question form/wording experiment from three Web surveys in which respondents are administered political and general knowledge questions and provided different thresholds for reporting a “don't know” response. | Question-type implications: Experimental results recommend a “don't know”-discouraged approach in which respondents are not presented with a “don't know” option and not actively encouraged to guess. | Miller and Orr | ||
| Response format and mode experiment from a Web and telephone survey comparing check-all and checklist response formats. | Question-specific practical implications: For multiple-item question batteries, formatting the items as checklist versus check-all leads to greater endorsement of the items on the Web and over the phone. | Smyth, Christian, and Dillman | ||
| Question structure/form experiment from a telephone survey using the item count technique to determine public support for a female president. | Topic-specific implications: Direct questioning indicators of public support for a female president may exaggerate actual support. | Streb et al. | ||
| Question form/wording experiment from a telephone survey in which respondents are administered political knowledge questions and provided different thresholds for reporting a “don't know” response. | Question-type implications: Experimental results recommend the continued use of the conventional approach for measuring political knowledge in which respondents are encouraged to answer “don't know” (versus guessing) if they are not certain of their answer. | Sturgis, Allum, and Smith | ||
| Overall questionnaire format/structural design and response format experiments from three sets of experiments in two online panels to examine the effects of number of items per screen and response format manipulations on responses among trained and fresh respondents. | Question-type and mode implications: No effects due to number of items per screen but significant differences in reporting when closed versus open questions were used and as a result of manipulations in how rating scales were presented. Few differences in responding between trained and fresh online panel members. | Toepoel, Das, and Van Soest | ||
| Question order experiment from a Gallup telephone poll to examine the effect of whether support for affirmative action for women and racial minorities varies depending on whether the initial question is about programs for women versus racial minorities. | Topic-specific implications: Support for affirmative action for women and racial minorities varies depending on which question is asked first. | Wilson et al. | ||
| 2009 | Mode/implementation experiment comparing responses to the same questionnaires administered using RDD telephone sampling methods versus a probability and nonprobability Web survey. | Mode-specific implications: Relative to the data from the RDD telephone sample or nonprobability Internet sample, the data from the probability Internet sample yielded the highest-quality data overall. | Chang and Krosnick | |
| Question testing experiment to examine the effect of two different methods of probing in cognitive interviewing. | Broad-based question design implications: Method of probing during cognitive interviewing may affect the total number of problems identified and how accurately valid problems are identified. | Conrad and Blair | ||
| Mode experiment from a pretest for the National Survey of Family Growth (NSFG) to examine differences in reports about sensitive information between audio-CASI and text-CASI. | Mode- and topic-specific implications: Relative to text-CASI, audio-CASI does not appear to have a consistent effect on reports of sensitive information. | Couper, Tourangeau, and Marvin | ||
| Overall questionnaire format experiment from an opt-in Web survey to examine the effect of expected and actual questionnaire length on data quality. | Mode-specific implications: Perceived length of a Web survey may have a negative effect on response rates, and actual length may negatively affect data quality. | Galesic and Bosnjak | ||
| Mode experiment to examine differences in reports about sensitive subjective phenomena between telephone audio-CASI (T-ACASI) and administration by a telephone interviewer. | Mode- and topic-specific implications: Relative to administration by a telephone interviewer, T-ACASI may be associated with less tolerant and socially liberal reports. | Harmon et al. | ||
| Question wording experiments and evaluation of verbal labels for defining the type of social network being asked about. | Topic-specific implications: During an election season, asking for people with whom respondent discusses “important matters” leads to results similar to those obtained when asking for those with whom respondent discusses politics. | Klofstad, McClurg, and Rolfe | ||
| Response category (order) experiments from two Web surveys to compare how order effects varied for ranking versus rating tasks. | Broad-based question design implications: There may be a relationship between task difficulty and satisficing such that satisficing may be more likely with simple (e.g., rating tasks) than complex (e.g., ranking tasks) tasks. | Malhotra | ||
| Question form and structure experiments from face-to-face, telephone, and Web surveys to determine how different options for branching midpoints and endpoints affected validity. | Broad-based question design implications: Results indicated that the following designs were most valid: branching endpoints into three levels of extremity, not branching the midpoint, and using 7 points with a bipolar rating scale. | Malhotra, Krosnick, and Thomas | ||
| Question wording evaluation in which survey reports from the Current Population Survey were compared to external records to assess the accuracy of reports about Medicaid enrollment and diagnose possible sources of reporting error. | Broad-based question design implications: Results indicate that respondents may ignore the reference period when reporting about the receipt of benefits. | Pascale, Roemer, and Resnick | ||
| Overall questionnaire format/structural design/question characteristic evaluations to examine the effects of questionnaire and respondent characteristics on break-offs in two Web surveys. | Mode-specific practical implications: Specific questionnaire (e.g., more cognitively complex questions) and respondent characteristics (e.g., lower education) may be associated with higher break-off rates in Web surveys. | Peytchev | ||
| Evaluation comparing the accuracy of estimates based on self-reports to those based on external records. | Topic-specific implications: Respondents appear to overreport their personal media use when self-reports are compared to external records. | Prior | ||
| Question order experiments conducted at different times suggest that the effect of question order on attitudes about newspaper reporters may change over time because of social changes. | Broad-based implications for research about effects of question characteristics: Experiments with convenience samples may not allow researchers to observe how features of the social context affect results. | Schuman | ||
| Question format experiments in three Web surveys to examine the effects of variations in answer box sizes and verbal instructions. | Question- and mode-specific practical implications: Increasing the size of answer boxes and providing instructions may increase response quality. | Smyth et al. | ||
| 2010 | Mode/implementation experiment comparing the effect of administering questions orally (over an intercom) versus self-administered on a computer. | Mode-specific implications: Instruments that are self-administered (perhaps particularly those that use a computer-assisted mode) may have superior measurement properties (i.e., concurrent validity, less social desirability response bias, and less satisficing). | Chang and Krosnick | |
| Question form and response categories manipulation comparing reports of likely voting using verbal response categories to those using numeric statements of probabilities. | Broad-based implications for question design: Reports of subjective probabilities may provide more—or somewhat different—information than some sets of verbal response categories. | Delavande and Manski | ||
| Question testing and evaluation methods using computer audio-recorded interviewing (CARI) and interaction coding to allow ongoing examination of how survey questions are actually implemented. | Broad-based implications for question development and testing: Routine integration of recording and interaction coding of interviews during pretesting and fieldwork may identify some problematic questions. | Hicks et al. | ||
| Question structure/form and mode comparisons to determine whether the item count technique reduces overreports of voting in a telephone survey and Web survey. | Mode-specific implications and implications for question structure: Like previous research, results find that overreporting appears lower in the self-administered Web-based form versus using traditional telephone methods. | Holbrook and Krosnick (a) | ||
| Question structure and mode experiment comparing different implementations of the randomized response technique (RTT) in both telephone and Web surveys. | Topic-specific implications: RTT does not appear to provide improvements in measurement for threatening behaviors. | Holbrook and Krosnick (b) | ||
| Question form and order experiments examine improvements to anchoring vignette techniques in both telephone and Web surveys. | Broad-based question design implications for design of subjective questions using scales and for direct comparisons: Refinements to the anchoring vignettes methodology find that interpersonal comparability is improved, resulting in greater construct validity when the order of questions clarifies the task; questions that ask for direct comparisons lose substantial information. | Hopkins and King | ||
| Cross-national evaluation of satisficing (don't know, straight-lined, inconsistent, and extreme responses) and reluctance to participate in face-to-face surveys finds that relationship is present but explained by cognitive ability. | Broad-based implications for instrument design: Differences in the level of measurement error among respondents with different levels of cognitive ability pose a challenge to instrument design. | Kaminska, McCutcheon, and Billiet | ||
| Instrument design and interviewing practice experiment in which respondents were interviewed using conventional standardized interviewing methods (CQ) versus event history calendar (EHC) methods in a telephone survey and responses were validated against previously provided reports. | Broad-based question design implications: Results found increased interviewer variation for EHC as compared to CQ for 7 of 9 comparisons, but authors conclude that levels are comparable to those observed in CQ studies. Interviewer variance may be higher when instrument provides less structure. | Sayles, Belli, and Serrano | ||
| Question wording and response category experiment assigned four vignettes about genetic versus environmental causes to each subject in the two-by-two design. | Broad-based implications for question meaning: Framing of a question can change its meaning and how responses are related to other variables. | Singer et al. | ||
| Mode/implementation experiment examining the impact of survey topic, mode, and incentives on measurement and nonresponse error in self-reported voting. | Mode-specific practical implications: Consistent with previous research, results suggest that overreporting is reduced with a self-administered instrument. | Tourangeau, Groves, and Redline | ||
| Question order experiment examining how judgments of how prejudiced members of a group are depend on both whether the group being judged is one's own and the order of the questions. | Topic-specific implications for controlling order of questions involving related judgments. | Wilson |
We compiled and summarized the authors’ views of their findings rather than providing a critical review. It was not always obvious how to set the boundaries for which papers to include, particularly if the study did not involve an experiment or a comparison of different approaches to measurement. Our summary includes studies explicitly about the characteristics of survey questions that involved mode comparisons (which affect details of how a question is implemented, even though these details are not always specified in the articles), or about the role of survey questions in measurement error. We excluded several potentially relevant papers that are focused on the measurement of specific constructs, such as religious identity (Alwin et al. 2006), health insurance (Davern et al. 2008), telephone lines (Merkle and Langer 2008), or how to select among candidate measures of likely voters (Murray, Riley, and Scime 2009), that compare the relative contributions of measurement and nonresponse error (Peytchev, Peytcheva, and Groves 2010; Sakshaug, Yan, and Tourangeau 2010), or that examine mode effects generally without focusing on the instrument's contribution to those effects (e.g., Vannieuwenhuyze, Loosveldt, and Molenberghs 2010).
References
- Alwin Duane F. Margins of Error: A Study of Reliability in Survey Measurement. Hoboken, NJ: John Wiley & Sons; 2007. [Google Scholar]
- Alwin Duane F, Felson Jacob L, Walker Edward T, Tufis Paula A. “Measuring Religious Identities in Surveys.”. Public Opinion Quarterly. 2006;70:530–64. [Google Scholar]
- Bartels Larry M. “Question Order and Declining Faith in Elections.”. Public Opinion Quarterly. 2002;66:67–79. [Google Scholar]
- Beatty Paul C. “Considerations in the Use of Global Questions Regarding the Consumer Expenditure Survey.”. 2010 Paper presented at the Consumer Expenditure Redesign Workshop at the U.S. Census Bureau, Suitland, MD, USA. [Google Scholar]
- Beatty Paul C, Willis Gordon B. “Research Synthesis: The Practice of Cognitive Interviewing.”. Public Opinion Quarterly. 2007;71:287–311. [Google Scholar]
- Belli Robert F, Schwarz Norbert, Singer Eleanor, Talarico Jennifer. “Decomposition Can Harm the Accuracy of Behavioural Frequency Reports.”. Applied Cognitive Psychology. 2000;14:295–308. [Google Scholar]
- Belli Robert F, Shay William L, Stafford Frank P. “Event History Calendars and Question List Surveys: A Direct Comparison of Interviewing Methods.”. Public Opinion Quarterly. 2001;65:45–74. doi: 10.1086/320037. [DOI] [PubMed] [Google Scholar]
- Belli Robert F, Smith Lynette M, Andreski Patricia M, Agrawal Sangeeta. “Methodological Comparisons Between CATI Event History Calendar and Conventional Questionnaire Instruments.”. Public Opinion Quarterly. 2007;71:603–22. [Google Scholar]
- Belli Robert F, Stafford Frank P, Alwin Duane F. Calendar and Time Diary Methods in Life Course Research. Thousand Oaks, CA: Sage; 2009. [Google Scholar]
- Belli Robert F, Traugott Michael W, Young Margaret, McGonagle Katherine A. “Reducing Vote Overreporting in Surveys: Social Desirability, Memory Failure, and Source Monitoring.”. Public Opinion Quarterly. 1999;63:90–108. [Google Scholar]
- Biemer, Paul B. 2004. “Modeling Measurement Error to Identify Flawed Questions.” In Methods for Testing and Evaluating Survey Questionnaires, edited by S. Presser, J. M. Rothgeb, M. P. Couper, J. T. Lessler, E. Martin, J. Martin, and E. Singer, 225–246. New York: Springer-Verlag. [Google Scholar]
- Biemer Paul P. “Total Survey Error: Design, Implementation, and Evaluation.”. Public Opinion Quarterly. 2010;74:817–48. [Google Scholar]
- Bishop George, Andrew Smith “Response-Order Effects and the Early Gallup Split-Ballots.”. Public Opinion Quarterly. 2001;65:479–505. [Google Scholar]
- Blair Edward, Burton Scot. “Cognitive Processes Used by Survey Respondents to Answer Behavioral Frequency Questions.”. Journal of Consumer Research. 1987;14:280–88. [Google Scholar]
- Blumberg Stephen J, Luke Julian V. National Center for Health Statistics; 2010. “Wireless Substitution: Early Release of Estimates from the National Health Interview Survey, July–December 2009.”. [Google Scholar]
- Box-Steffensmeier Janet M, Jacobson Gary C, Grant JTobin. “Question Wording and the House Vote Choice: Some Experimental Evidence.”. Public Opinion Quarterly. 2000;64:257–70. doi: 10.1086/317988. [DOI] [PubMed] [Google Scholar]
- Brener Nancy D, Eaton Danice K, Kann Laura, Anne Grunbaum Jo, Gross Lori A, Kyle Tonja M, Ross James G. “The Association of Survey Setting and Mode with Self-Reported Health Risk Behaviors among High School Students.”. Public Opinion Quarterly. 2006;70:354–74. [Google Scholar]
- Brener Nancy D, Kann Laura, McManus Tim. “A Comparison of Two Survey Questions on Race and Ethnicity among High School Students.”. Public Opinion Quarterly. 2003;67:227–36. [Google Scholar]
- Brenner Michael. Response Behavior in the Survey Interview, edited by W. Dijkstra and J. Van der Zouwen, 131–65. London: Academic Press; 1982. “Response Effects of ‘Role-Restricted’ Characteristics of the Interviewer.” In. [Google Scholar]
- Burden Barry C. “The Social Roots of the Partisan Gender Gap.”. Public Opinion Quarterly. 2008;72:55–75. [Google Scholar]
- Cannell Charles F, Fowler, Jr Floyd J, Marquis Kent H. U.S. Department of Health and Human Services, Washington, DC; 1968. “The Influence of Interviewer and Respondent Psychological and Behavioral Variables on the Reporting in Household Interviews.”. [DOI] [PubMed] [Google Scholar]
- Cannell Charles F, Kahn Robert L. The Handbook of Social Psychology. 1968. “Interviewing.” In. vol. II, Research Methods, edited by G. Lindzey and E. Aronson, 526–95. Reading, MA: Addison-Wesley. [Google Scholar]
- Cannell Charles F, Miller Peter V, Oksenberg Lois. Sociological Methodology, vol. 11, edited by S. Leinhardt, 389–437. San Francisco: Jossey-Bass; 1981. “Research on Interviewing Techniques.” In. [Google Scholar]
- Chang Linchiat, Krosnick Jon A. “National Surveys via RDD Telephone Interviewing versus the Internet: Comparing Sample Representativeness and Response Quality.”. Public Opinion Quarterly. 2009;73:641–78. [Google Scholar]
- ———. “Comparing Oral Interviewing with Self-Administered Computerized Questionnaires: An Experiment.”. Public Opinion Quarterly. 2010;74:154–67. [Google Scholar]
- Christian Leah Melani, Dillman Don A. “The Influence of Graphical and Symbolic Language Manipulations on Responses to Self-Administered Questions.”. Public Opinion Quarterly. 2004;68:57–80. [Google Scholar]
- Christian Leah Melani, Dillman Don A, Smyth Jolene D. “Helping Respondents Get It Right the First Time: The Influence of Words, Symbols, and Graphics in Web Surveys.”. Public Opinion Quarterly. 2007;71:113–25. [Google Scholar]
- Conrad Frederick G, Johnny Blair “Sources of Error in Cognitive Interviews.”. Public Opinion Quarterly. 2009;73:32–55. [Google Scholar]
- Conrad Frederick G, Schober Michael F. “Clarifying Question Meaning in a Household Telephone Survey.”. Public Opinion Quarterly. 2000;64:1–28. doi: 10.1086/316757. [DOI] [PubMed] [Google Scholar]
- ———. Envisioning the Survey Interview of the Future. Hoboken, NJ: Wiley; 2008. [Google Scholar]
- Converse Jean M, Schuman Howard. “The Manner of Inquiry: An Analysis of Survey Question Form across Organizations and over Time.”. In: Turner CF, Martin E, editors. Surveying Subjective Phenomena, vol. 2. New York: Russell Sage Foundation; 1984. pp. 283–316. [Google Scholar]
- Couper Mick P. “Survey Introductions and Data Quality.”. Public Opinion Quarterly. 1997;61:317–38. [Google Scholar]
- ———. Designing Effective Web Surveys. Cambridge, UK: Cambridge University Press; 2008. [Google Scholar]
- Couper Mick P, Conrad Frederick G, Tourangeau Roger. “Visual Context Effects in Web Surveys.”. Public Opinion Quarterly. 2007;71:623–34. doi: 10.1093/poq/nfs063. [DOI] [PMC free article] [PubMed] [Google Scholar]
- Couper Mick P, Singer Eleanor, Tourangeau Roger. “Understanding the Effects of Audio-CASI on Self-Reports of Sensitive Behavior.”. Public Opinion Quarterly. 2003;67:385–95. [Google Scholar]
- Couper Mick P, Tourangeau Roger, Kenyon Kristin. “Picture This! Exploring Visual Effects in Web Surveys.”. Public Opinion Quarterly. 2004;68:255–66. [Google Scholar]
- Couper Mick P, Roger Tourangeau, Theresa Marvin “Taking the Audio Out of Audio-CASI.”. Public Opinion Quarterly. 2009;73:281–303. [Google Scholar]
- Couper Mick P, Traugott Michael W, Lamias Mark J. “Web Survey Design and Administration.”. Public Opinion Quarterly. 2001;65:230–53. doi: 10.1086/322199. [DOI] [PubMed] [Google Scholar]
- Currivan Douglas B, Nyman Amy L, Turner Charles F, Biener Lois. “Does Telephone Audio Computer-Assisted Self-Interviewing Improve the Accuracy of Prevalence Estimates of Youth Smoking? Evidence from the UMass Tobacco Study.”. Public Opinion Quarterly. 2004;68:542–64. doi: 10.1093/poq/nfh039. [DOI] [PMC free article] [PubMed] [Google Scholar]
- Curtin Richard, Presser Stanley, Singer Eleanor. “Changes in Telephone Survey Nonresponse over the Past Quarter Century.”. Public Opinion Quarterly. 2005;69:87–98. [Google Scholar]
- Davern Michael, Thiede Call Kathleen, Ziegenfuss Jeanette, Davidson Gestur, Beebe Timothy J, Blewett Lynn. “Validating Health Insurance Coverage Survey Estimates: A Comparison of Self-Reported Coverage and Administrative Data Records.”. Public Opinion Quarterly. 2008;72:241–59. [Google Scholar]
- Delavande Adeline, Manski Charles F. “Probabilistic Polling and Voting in the 2008 Presidential Election: Evidence from the American Life Panel.”. Public Opinion Quarterly. 2010;74:433–59. doi: 10.1093/poq/nfq019. [DOI] [PMC free article] [PubMed] [Google Scholar]
- Delavande Adeline, Rohwedder Susann. “Eliciting Subjective Probabilities in Internet Surveys.”. Public Opinion Quarterly. 2008;72:866–91. doi: 10.1093/poq/nfn062. [DOI] [PMC free article] [PubMed] [Google Scholar]
- Dijkstra Wil, Van der Zouwen Johannes. Response Behavior in the Survey Interview. London: Academic Press; 1982. [Google Scholar]
- ———. “Styles of Interviewing and the Social Context of the Survey Interview.” In. In: Hippler H-J, Schwarz N, Sudman S, editors. Social Information Processing and Survey Methodology, edited by. New York: Springer-Verlag; 1987. 200–211. [Google Scholar]
- Dillman Don A. Mail and Internet Surveys: The Tailored Design Method 2007 Update with New Internet, Visual, and Mixed-Mode Guide. 2nd ed. New York: Wiley; 2007. [Google Scholar]
- Dillman Don A, Smyth Jolene D, Christian Leah Melani. Internet, Mail, and Mixed-Mode Surveys: The Tailored Design Method. 3rd ed. New York: John Wiley & Sons; 2009. [Google Scholar]
- Dohrenwend Barbara Snell. “Some Effects of Open and Closed Questions on Respondents’ Answers.”. Human Organization. 1965;24:175–84. [Google Scholar]
- Duff Brian, Hanmer Michael J, Park Won-Ho, White Ismail K. “Good Excuses: Understanding Who Votes with an Improved Turnout Question.”. Public Opinion Quarterly. 2007;71:67–90. [Google Scholar]
- Dykema Jennifer, Lepkowski James M, Blixt Steven. “The Effect of Interviewer and Respondent Behavior on Data Quality: Analysis of Interaction Coding in a Validation Study.”. In: Lyberg L, Biemer P, Collins M, de Leeuw E, Dippo C, Schwarz N, Trewin D, editors. Survey Measurement and Process Quality. New York: Wiley-Interscience; 1997. pp. 287–310. [Google Scholar]
- Dykema Jennifer, Schaeffer Nora Cate. “Events, Instruments, and Reporting Errors.”. American Sociological Review. 2000;65:619–29. [Google Scholar]
- ———. “An Investigation of the Impact of Departures from Standardized Interviewing on Response Errors in Self-Reports About Child Support and Other Family-Related Variables.”. 2005 Paper presented at the Annual Meeting of the American Association for Public Opinion Research, Miami Beach, FL, USA. [Google Scholar]
- Dykema Jennifer, Schaeffer Nora Cate, Beach Jeremy, Lein Vicki, Day Brendan. “Designing Questions for Web Surveys: Effects of Check-List, Check-All, and Stand-Alone Response Formats on Survey Reports and Data Quality.”. 2011 Paper presented at the Annual Meeting of the American Association for Public Opinion Research, Phoenix, AZ, USA. [Google Scholar]
- Ehlen Patrick, Schober Michael F, Conrad Frederick G. “Modeling Speech Disfluency to Predict Conceptual Misalignment in Speech Survey Interfaces.”. Discourse Processes. 2007;44:245–65. [Google Scholar]
- Forsyth Barbara, Rothgeb Jennifer M, Willis Gordon B. “Does Pretesting Make a Difference? An Experimental Test.”. In: Presser S, Rothgeb JM, Couper MP, Lessler JT, Martin E, Martin J, Singer E, editors. Methods for Testing and Evaluating Survey Questionnaires, edited by S. Presser, J.M. Rothgeb, M.P. Couper, J.T. Lessler, E. Martin, J. Martin, and E. Singer, 525–46. New York: Springer-Verlag; 2004. [Google Scholar]
- Fowler, J Floyd, Cosenza Carol. “Writing Effective Questions.”. In: de Leeuw ED, Hox JJ, Dillman DA, editors. International Handbook of Survey Methodology. New York: Lawrence Erlbaum Associates; 2008. pp. 136–60. [Google Scholar]
- Fowler, Jackson Floyd. “How Unclear Terms Affect Survey Data.”. Public Opinion Quarterly. 1992;56:218–31. doi: 10.1086/269312. [DOI] [PubMed] [Google Scholar]
- Fowler, Jackson Floyd, Cannell Charles F. “Using Behavioral Coding to Identify Cognitive Problems with Survey Questions.”. In: Schwarz N, Sudman S, editors. Answering Questions: Methodology for Determining Cognitive and Communicative Processes in Survey Research. San Francisco, CA: Jossey-Bass; 1996. pp. 15–36. [Google Scholar]
- Fricker Scott, Tourangeau Roger. “Examining the Relationship Between Nonresponse Propensity and Data Quality in Two National Household Surveys.”. Public Opinion Quarterly. 2010;74:934–55. [Google Scholar]
- Fuchs Marek. “The Impact of Technology on Interaction in Computer-Assisted Interviews.”. In: Maynard DW, Houtkoop-Steenstra H, Van der Zouwen J, Schaeffer NC, editors. Standardization and Tacit Knowledge: Interaction and Practice in the Survey Interview. New York: Wiley; 2002. pp. 471–91. [Google Scholar]
- Galesic Mirta, Bosnjak Michael. “Effects of Questionnaire Length on Participation and Indicators of Response Quality in a Web Survey.”. Public Opinion Quarterly. 2009;73:349–60. [Google Scholar]
- Galesic Mirta. Roger Tourangeau, Couper Mick P, Conrad Frederick G. 2008 . “Eye-Tracking Data: New Insights on Response Order Effects and Other Cognitive Shortcuts in Survey Responding.”. Public Opinion Quarterly. 72:892–913. doi: 10.1093/poq/nfn059. [DOI] [PMC free article] [PubMed] [Google Scholar]
- Garbarski Dana, Schaeffer Nora Cate, Dykema Jennifer. “Are Interactional Behaviors Exhibited When the Self-Reported Health Question Is Asked Associated with Health Status?”. Social Science Research. 2011;40:1025–36. doi: 10.1016/j.ssresearch.2011.04.002. [DOI] [PMC free article] [PubMed] [Google Scholar]
- Gaskell George D, Wright Daniel B, O'Muircheartaigh Colm A. “Telescoping of Landmark Events: Implications for Survey Research.”. Public Opinion Quarterly. 2000;64:77–89. doi: 10.1086/316761. [DOI] [PubMed] [Google Scholar]
- Glasner Tina, Van der Vaart Wander. “Applications of Calendar Instruments in Social Surveys: A Review.”. Quality and Quantity. 2009;43:333–49. doi: 10.1007/s11135-007-9129-8. [DOI] [PMC free article] [PubMed] [Google Scholar]
- Graesser Arthur C, Cai Zhiqiang, Louwerse Max M, Daniel Frances. “Question Understanding AID (QUAID): A Web Facility That Tests Question Comprehensibility.”. Public Opinion Quarterly. 2006;70:3–22. [Google Scholar]
- Griesler Pamela C, Kandel Denise B, Schaffran Christine, Hu Mei-Chen, Davies Mark. “Adolescents’ Inconsistency in Self-Reported Smoking: A Comparison of Reports in School and in Household Settings.”. Public Opinion Quarterly. 2008;72:260–90. doi: 10.1093/poq/nfn016. [DOI] [PMC free article] [PubMed] [Google Scholar]
- Groves Robert M. Survey Errors and Survey Costs. New York: John Wiley & Sons; 1989. [Google Scholar]
- Groves Robert M, Lyberg Lars. “Total Survey Error: Past, Present, and Future.”. Public Opinion Quarterly. 2010;74:849–79. [Google Scholar]
- Harkness Janet A, Braun Michael, Edwards Brad, Johnson Timothy P, Lyberg Lars E, Mohler Peter Ph., Pennell Beth-Ellen, Smith Tom W. Survey Methods in Multicultural, Multinational, and Multiregional Contexts. Hoboken, NJ: John Wiley & Sons; 2010. [Google Scholar]
- Harkness Janet, Pennell Beth-Ellen, Schoua-Glusberg Alisú. “Survey Questionnaire Translation and Assessment.”. In: Presser S, Rothgeb JM, Couper MP, Lessler JT, Martin E, Martin J, Singer E, editors. Methods for Testing and Evaluating Survey Questionnaires. New York: Springer-Verlag; 2004. pp. 453–76. [Google Scholar]
- Harkness Janet A, Van de Vijver Fons JR, Mohler Peter Ph. Cross-Cultural Survey Methods. Hoboken, NJ: John Wiley & Sons; 2003. [Google Scholar]
- Harmon Thomas, Turner Charles F, Rogers Susan M, Eggleston Elizabeth, Roman Anthony M, Villarroel Maria A, Chromy James R, Ganapathi Laxminarayana, Li Sheping. “Impact of T-ACASI on Survey Measurements of Subjective Phenomena.”. Public Opinion Quarterly. 2009;73:255–80. doi: 10.1093/poq/nfp020. [DOI] [PMC free article] [PubMed] [Google Scholar]
- Heerwegh Dirk, Loosveldt Geert. “Face-to-Face versus Web Surveying in a High-Internet-Coverage Population: Differences in Response Quality.”. Public Opinion Quarterly. 2008;72:836–46. [Google Scholar]
- Hess Jennifer, Moore Jeffrey, Pascale Joanne, Rothgeb Jennifer, Catherine Keeley “The Effects of Person-Level versus Household-Level Questionnaire Design on Survey Estimates and Data Quality.”. Public Opinion Quarterly. 2001;65:574–84. [Google Scholar]
- Hess Jennifer, Singer Eleanor, Bushery John M. “Predicting Test-Retest Reliability from Behavior Coding.”. International Journal of Public Opinion Research. 1999;11:346–60. [Google Scholar]
- Hicks Wendy D, Edwards Brad, Tourangeau Karen, McBride Brett, Harris-Kojetin Lauren D, Moss Abigail J. “Using CARI Tools to Understand Measurement Error.”. Public Opinion Quarterly. 2010;74:985–1003. [Google Scholar]
- Ho Daniel E, Imai Kosuke. “Estimating Causal Effects of Ballot Order from a Randomized Natural Experiment: The California Alphabet Lottery, 1978–2002.”. Public Opinion Quarterly. 2008;72:216–40. [Google Scholar]
- Holbrook Allyson, Ik Cho Young, Johnson Timothy. “The Impact of Question and Respondent Characteristics on Comprehension and Mapping Difficulties.”. Public Opinion Quarterly. 2006;70:565–95. [Google Scholar]
- Holbrook Allyson L, Green Melanie C, Krosnick Jon A. “Telephone versus Face-to-Face Interviewing of National Probability Samples with Long Questionnaires: Comparisons of Respondent Satisficing and Social Desirability Response Bias.”. Public Opinion Quarterly. 2003;67:79–125. [Google Scholar]
- Holbrook Allyson L, Krosnick Jon A. “Social Desirability Bias in Voter Turnout Reports: Tests Using the Item Count Technique.”. Public Opinion Quarterly. 2010;74:37–67. [Google Scholar]
- ———. Public Opinion Quarterly. 2010. “Measuring Voter Turnout by Using the Randomized Response Technique: Evidence Calling into Question the Method's Validity.”. 74:328–43. [Google Scholar]
- Holbrook Allyson L, Krosnick Jon A, Moore David, Tourangeau Roger. “Response Order Effects in Dichotomous Categorical Questions Presented Orally: The Impact of Question and Respondent Attributes.”. Public Opinion Quarterly. 2007;71:325–48. [Google Scholar]
- Hopkins Daniel J, King Gary. “Improving Anchoring Vignettes: Designing Surveys to Correct Interpersonal Incomparability.”. Public Opinion Quarterly. 2010;74:201–22. [Google Scholar]
- Israel Glenn D. “Effects of Answer Space Size on Responses to Open-Ended Questions in Mail Surveys.”. Journal of Official Statistics. 2010;26:271–85. [Google Scholar]
- Jaszczak Angela, Lundeen Katie, Smith Stephen. “Using Nonmedically Trained Interviewers to Collect Biomeasures in a National In-Home Survey.”. Field Methods. 2009;21:26–48. doi: 10.1177/1525822X08323988. [DOI] [PMC free article] [PubMed] [Google Scholar]
- Jenkins Cleo R, Dillman Don A. “Toward a Theory of Self-Administered Questionnaire Design.”. In: Lyberg L, Biemer P, Collins M, de Leeuw E, Dippo C, Schwarz N, Trewin D, editors. Survey Measurement and Process Quality. New York: Wiley-Interscience; 1997. pp. 165–96. [Google Scholar]
- Johnson Timothy P, Ik Cho Young, Holbrook Allyson L, O'Rourke Diane, Warnecke Richard B, Noel Chavez “Cultural Variability in the Effects of Question Design Features on Respondent Comprehension of Health Surveys.”. Annals of Epidemiology. 2006;16:661–68. doi: 10.1016/j.annepidem.2005.11.011. [DOI] [PubMed] [Google Scholar]
- Jordan Lawrence A, Marcus Alfred C, Reeder Leo G. “Response Styles in Telephone and Household Interviewing: A Field Experiment.”. Public Opinion Quarterly. 1980;44:210–22. [Google Scholar]
- Kaminska Olena, McCutcheon Allan L, Billiet Jaak. “Satisficing Among Reluctant Respondents in a Cross-National Context.”. Public Opinion Quarterly. 2010;74:956–84. [Google Scholar]
- Kimball David C, Kropf Martha. “Ballot Design and Unrecorded Votes on Paper-Based Ballots.”. Public Opinion Quarterly. 2005;69:508–29. [Google Scholar]
- Klofstad Casey A, McClurg Scott D, Rolfe Meredith. “Measurement of Political Discussion Networks: A Comparison of Two ‘Name Generator’ Procedures.”. Public Opinion Quarterly. 2009;73:462–83. [Google Scholar]
- Knauper Barbel, Belli Robert F, Hill Daniel H, Regula Herzog A. “Question Difficulty and Respondents’ Cognitive Ability: The Effect on Data Quality.”. Journal of Official Statistics. 1997;13:181–99. [Google Scholar]
- Kreuter Frauke, McCulloch Susan, Presser Stanley, Tourangeau Roger. “The Effects of Asking Filter Questions in Interleafed versus Grouped Format.”. Sociological Methods & Research. 2011;40:88–104. [Google Scholar]
- Kreuter Frauke, Presser Stanley, Tourangeau Roger. “Social Desirability Bias in CATI, IVR, and Web Surveys: The Effects of Mode and Question Sensitivity.”. Public Opinion Quarterly. 2008;72:847–65. [Google Scholar]
- Kreuter, Frauke Ting Yan, Roger Tourangeau “Good Item or Bad—Can Latent Class Analysis Tell?: The Utility of Latent Class Analysis for the Evaluation of Survey Questions.”. Journal of the Royal Statistical Society. 2008 Series A, 171, Part 3:723–738. [Google Scholar]
- Kroh Martin. “Measuring Left–Right Political Orientation: The Choice of Response Format.”. Public Opinion Quarterly. 2007;71:204–20. [Google Scholar]
- Krosnick Jon A. “Response Strategies for Coping with the Cognitive Demands of Attitude Measures in Surveys. Special Issue: Cognition and Survey Measurement.”. Applied Cognitive Psychology. 1991;5:213–36. [Google Scholar]
- ———. “Survey Research.”. Annual Review of Psychology. 1999;50:537–67. doi: 10.1146/annurev.psych.50.1.537. [DOI] [PubMed] [Google Scholar]
- Krosnick Jon A, Berent Matthew K. “Comparisons of Party Identification and Policy Preferences: The Impact of Survey Question Format.”. American Journal of Political Science. 1993;37:941–64. [Google Scholar]
- Krosnick Jon A, Fabrigar Leandre R. “Designing Rating Scales for Effective Measurement in Surveys.”. In: Lyberg L, Biemer P, Collins M, de Leeuw E, Dippo C, Schwarz N, Trewin D, 141–64, editors. Survey Measurement and Process Quality. New York: Wiley-Interscience; 1997. [Google Scholar]
- Krosnick Jon A, Holbrook Allyson L, Berent Matthew K, Carson Richard T, Hanneman WMichael, Kopp Raymond J, Mitchell Robert Cameron, Presser Stanley, Ruud Paul A, Kerry Smith V, Moody Wendy R, Green Melanie C, Conaway Michael. “The Impact of ‘No Opinion’ Response Options on Data Quality: Non-Attitude Reduction or an Invitation to Satisfice?”. Public Opinion Quarterly. 2002;66:371–403. [Google Scholar]
- Krosnick Jon A, Presser Stanley. “Question and Questionnaire Design.”. In: Marsden PV, Wright JD, editors. Handbook of Survey Research, 2nd. Bingley, UK: Emerald Group Publishing Limited; 2010. pp. 263–313. [Google Scholar]
- Lessler Judith, Tourangeau Roger, Salter William. Questionnaire Design in the Cognitive Research Laboratory., vol. 1. Rockville, MD: National Center for Health Statistics; 1989. [Google Scholar]
- Lin I-Fen, Cate Schaeffer Nora. “Using Survey Participants to Estimate the Impact of Nonparticipation.”. Public Opinion Quarterly. 1995;59:236–58. [Google Scholar]
- Lin I-Fen, Cate Schaeffer Nora, Seltzer Judith A. “Causes and Effects of Nonparticipation in a Child Support Survey.”. Journal of Official Statistics. 1999;15:143–166. [Google Scholar]
- Malhotra Neil. “Completion Time and Response Order Effects in Web Surveys.”. Public Opinion Quarterly. 2008;72:914–34. [Google Scholar]
- ———. “Order Effects in Complex and Simple Tasks.”. Public Opinion Quarterly. 2009;73:180–98. [Google Scholar]
- Malhotra Neil, Krosnick Jon A, Thomas Randall K. “Optimal Design of Branching Questions to Measure Bipolar Constructs.”. Public Opinion Quarterly. 2009;73:304–24. [Google Scholar]
- Martin Elizabeth. “The Effects of Questionnaire Design on Reporting of Detailed Hispanic Origin in Census 2000 Mail Questionnaires.”. Public Opinion Quarterly. 2002;66:582–93. [Google Scholar]
- Mathiowetz Nancy A. “Expressions of Respondent Uncertainty as Indicator of Data Quality.”. International Journal of Public Opinion Research. 1999;11:289–96. [Google Scholar]
- Mathiowetz Nancy A, McGonagle Katherine A. “An Assessment of the Current State of Dependent Interviewing in Household Surveys.”. Journal of Official Statistics. 2000;16:401–18. [Google Scholar]
- McCarty John A, Shrum LJ. “The Measurement of Personal Values in Survey Research: A Test of Alternative Rating Procedures.”. Public Opinion Quarterly. 2000;64:271–98. doi: 10.1086/317989. [DOI] [PubMed] [Google Scholar]
- McClendon McKee J. “Acquiescence and Recency Response Order Effects in Interview Surveys.”. Sociological Methods & Research. 1991;20:60–103. [Google Scholar]
- Means Barbara, Swan Gary E, Jobe Jared B, Esposito James L. “The Effects of Estimation Strategies on the Accuracy of Respondents’ Reports of Cigarette Smoking.”. In: Schwarz N, Sudman S, editors. Autobiographical Memory and the Validity of Retrospective Reports. New York: Springer Verlag; 1994. pp. 107–20. [Google Scholar]
- Menon Geeta. “Are the Parts Better Than the Whole? The Effects of Decompositional Questions on Judgments with Frequent Behaviors.”. Journal of Marketing Research. 1997;34:335–46. [Google Scholar]
- Merkle Daniel, Langer Gary. Public Opinion Quarterly 72:114–24; 2008. “How Too Little Can Give You a Little Too Much: Determining the Number of Household Phone Lines in RDD Surveys.”. [Google Scholar]
- Miller Melissa K, Orr Shannon K. “Experimenting with a ‘Third Way’ in Political Knowledge Estimation.”. Public Opinion Quarterly. 2008;72:768–80. [Google Scholar]
- Molenaar Nico J. “Response-Effects of ‘Formal’ Characteristics of Questions.”. In: Dijkstra W, Van der Zouwen J, editors. Response Behavior in the Survey Interview. London: Academic; 1982. pp. 49–89. [Google Scholar]
- Moore David W. “Measuring New Types of Question-Order Effects: Additive and Subtractive.”. Public Opinion Quarterly. 2002;66:80–91. [Google Scholar]
- Moskowitz Joel M. “Assessment of Cigarette Smoking and Smoking Susceptibility Among Youth: Telephone Computer-Assisted Self-Interviews versus Computer-Assisted Telephone Interviews.”. Public Opinion Quarterly. 2004;68:565–87. [Google Scholar]
- Murray Gregg R, Riley Chris, Scime Anthony. “Pre-Election Polling: Identifying Likely Voters Using Iterative Expert Data Mining.”. Public Opinion Quarterly. 2009;73:159–71. [Google Scholar]
- Oksenberg Lois, Cannell Charles, Kalton Graham. “New Strategies for Pretesting Survey Questions.”. Journal of Official Statistics. 1991;7:349–65. [Google Scholar]
- Ongena Yfke P, Wil Dijkstra “A Model of Cognitive Processes and Conversational Principles in Survey Interview Interaction.”. Applied Cognitive Psychology. 2007;21:145–163. [Google Scholar]
- Pascale Joanne, Mayer Thomas S. “Exploring Confidentiality Issues Related to Dependent Interviewing: Preliminary Findings.”. Journal of Official Statistics. 2004;20:357–77. [Google Scholar]
- Pascale Joanne, Roemer Marc I, Michael Resnick Dean. “Medicaid Underreporting in the CPS: Results from a Record Check Study.”. Public Opinion Quarterly. 2009;73:497–520. [Google Scholar]
- Peytchev Andy. “Survey Breakoff.”. Public Opinion Quarterly. 2009;73:74–97. [Google Scholar]
- Peytchev Andy, Couper Mick P, Esteban McCabe Sean, Crawford Scott D. “Web Survey Design: Paging versus Scrolling.”. Public Opinion Quarterly. 2006;70:596–607. [Google Scholar]
- Peytchev Andy, Peytcheva Emilia, Groves Robert M. “Measurement Error, Unit Nonresponse, and Self-Reports of Abortion Experiences.”. Public Opinion Quarterly. 2010;74:319–27. [Google Scholar]
- Prior Markus. “The Immensely Inflated News Audience: Assessing Bias in Self-Reported News Exposure.”. Public Opinion Quarterly. 2009;73:130–43. [Google Scholar]
- Rasinski Kenneth A, Mingay David, Bradburn Norman M. “Do Respondents ‘Mark All That Apply’ on Self-Administered Questions?”. Public Opinion Quarterly. 1994;58:400–8. [Google Scholar]
- Redline Cleo D, Dillman Don A. “The Influence of Alternative Visual Designs on Respondents’ Performance with Branching Instructions in Self-Administered Questionnaires.”. In: Groves RM, Dillman DA, Eltinge JL, Little RJA, editors. Survey Nonresponse. New York: John Wiley & Sons; 2002. pp. 179–93. [Google Scholar]
- Redline Cleo, Dillman Don A, Dajani Aref N, Ann Scaggs Mary. “Improving Navigational Performance in U.S. Census 2000 by Altering the Visually Administered Languages of Branching Instructions.”. Journal of Official Statistics. 2003;19:403–20. [Google Scholar]
- Rips Lance J, Conrad Frederick G, Fricker Scott S. “Straightening the Seam Effect in Panel Surveys.”. Public Opinion Quarterly. 2003;67:522–54. [Google Scholar]
- Sakshaug Joseph W, Couper Mick P, Beth Ofstedal Mary. “Characteristics of Physical Measurement Consent in a Population-Based Survey of Older Adults.”. Medical Care. 2010;48:64–71. doi: 10.1097/mlr.0b013e3181adcbd3. [DOI] [PMC free article] [PubMed] [Google Scholar]
- Sakshaug Joseph W, Yan Ting, Tourangeau Roger. “Nonresponse Error, Measurement Error, and Mode of Data Collection: Tradeoffs in a Multi-Mode Survey of Sensitive and Non-Sensitive Items.”. Public Opinion Quarterly. 2010;74:907–33. [Google Scholar]
- Sanchez Maria Elena. “Effects of Questionnaire Design on the Quality of Survey Data.”. Public Opinion Quarterly. 1992;56:206–17. [Google Scholar]
- Saris Willem E, Gallhofer Irmtraud. “Estimation of the Effects of Measurement Characteristics on the Quality of Survey Questions.”. Survey Research Methods. 2007;1:29–43. [Google Scholar]
- ———. Design, Evaluation, and Analysis of Questionnaires for Survey Research. New York: Wiley; 2007. [Google Scholar]
- Saris Willem E, Revilla Melanie, Krosnick Jon A, Shaeffer Eric M. “Comparing Questions with Agree/Disagree Response Options to Questions with Item-Specific Response Options.”. Survey Research Methods. 2010;4:61–79. [Google Scholar]
- Sastry Narayan, McGonagle Katherine, Schoeni Robert F. “Introduction to the Special Issue on the Scientific Assessment of Biomeasures in the Panel Study of Income Dynamics.”. Biodemography and Social Biology. 2009;55:113–17. doi: 10.1080/19485560903446141. [DOI] [PMC free article] [PubMed] [Google Scholar]
- Sayles Harlan, Belli Robert F, Serrano Emilio. 2010. “Interviewer Variance Between Event History Calendar and Conventional Questionnaire Interviews.”. Public Opinion Quarterly. 74:140–153. [Google Scholar]
- Schaeffer Nora Cate. “Conversation with a Purpose—Or Conversation? Interaction in the Standardized Interview.”. In: Biemer PP, Groves RM, Lyberg LE, Mathiowetz NA, Sudman S, 367–92, editors. Measurement Errors in Surveys. New York: John Wiley & Sons; 1991. [Google Scholar]
- Schaeffer Nora Cate, Dykema Jennifer. Center for Demography and Ecology, Working Paper. 94–18; 1994. “Open and Closed Questions About the Frequency of Events: Replication, Extension, Paradox.”. [Google Scholar]
- ———. “A Multiple-Method Approach to Improving the Clarity of Closely Related Concepts: Distinguishing Legal and Physical Custody of Children.” In. In: Presser S, Rothgeb JM, Couper MP, Lessler JT, Martin E, Martin J, Singer E, editors. Methods for Testing and Evaluating Survey Questionnaires, edited by. 475–502. New York: Springer-Verlag; 2004. [Google Scholar]
- ———. “Response 1 to Fowler's Chapter: Coding the Behavior of Interviewers and Respondents to Evaluate Survey Questions.”. In: Madans J, Miller K, Maitland A, Willis G, editors. Question Evaluation Methods: Contributing to the Science of Data Quality, edited by. 23–39. Hoboken, NJ: John Wiley & Sons; 2011. [Google Scholar]
- Schaeffer Nora Cate, Dykema Jennifer, Garbarski Dana, Maynard Douglas W. Proceedings of the Survey Research Methods Section, 4344–51. Denver, CO: American Statistical Association; 2008. “Verbal and Paralinguistic Behaviors in Cognitive Assessments in a Survey Interview.” In. [Google Scholar]
- Schaeffer Nora Cate, Dykema Jennifer, Maynard Douglas W. “Interviewers and Interviewing.”. In: Marsden PV, Wright JD, editors. Handbook of Survey Research, 2nd ed., Bingley, UK: Emerald Group Publishing Limited; 2010. pp. 437–70. [Google Scholar]
- Schaeffer Nora Cate, Maynard Douglas W. “Occasions for Intervention: Interactional Resources for Comprehension in Standardized Survey Interviews.”. In: Maynard DW, Houtkoop-Steenstra H, Schaeffer NC, Van der Zouwen J, editors. Standardization and Tacit Knowledge: Interaction and Practice in the Survey Interview. New York: Wiley; 2002. pp. 261–80. [Google Scholar]
- Schaeffer, Nora Cate, Stanley Presser “The Science of Asking Questions.”. Annual Review of Sociology. 2003;29:65–88. [Google Scholar]
- Schober Michael F, Bloom Jonathan E. “Discourse Cues That Respondents Have Misunderstood Survey Questions.”. Discourse Processes. 2004;38:287–308. [Google Scholar]
- Schoua-Glusberg Alisú. “Response 2 to Fowler's Chapter: Coding the Behavior of Interviewers and Respondents to Evaluate Survey Questions.”. In: Madans J, Miller K, Maitland A, Willis G, editors. Question Evaluation Methods: Contributing to the Science of Data Quality. Hoboken, NJ: John Wiley & Sons; 2011. pp. 41–48. [Google Scholar]
- Schuman Howard. “Context Effects and Social Change.”. Public Opinion Quarterly. 2009;73:172–79. [Google Scholar]
- Schuman Howard, Presser Stanley. Questions and Answers in Attitude Surveys: Experiments on Question Form, Wording, and Context. Orlando, FL: Academic Press; 1981. [Google Scholar]
- Schwarz Norbert. “Culture-Sensitive Context Effects: A Challenge for Cross-Cultural Surveys.”. In: Harkness JA, Van de Vijver FJR, Mohler PP, editors. Cross-Cultural Survey Methods. Hoboken, NJ: John Wiley & Sons; 2003. pp. 93–100. [Google Scholar]
- Schwarz Norbert, Knauper Barbel, Hippler Hans J, Noelle-Neumann Elisabeth, Clark Leslie. “Rating Scales: Numeric Values May Change the Meaning of Scale Labels.”. Public Opinion Quarterly. 1991;55:570–82. [Google Scholar]
- Shaeffer Eric M, Krosnick Jon A, Langer Gary E, Merkle Daniel M. “Comparing the Quality of Data Obtained by Minimally Balanced and Fully Balanced Attitude Questions.”. Public Opinion Quarterly. 2005;69:417–38. [Google Scholar]
- Singer Eleanor, P. Couper Mick, Raghunathan Trivellore E, Antonucci Toni C, Burmeister Margit, Van Hoewyk John. “The Effect of Question Framing and Response Options on the Relationship Between Racial Attitudes and Beliefs About Genes as Causes of Behavior.”. Public Opinion Quarterly. 2010;74:460–76. doi: 10.1093/poq/nfq009. [DOI] [PMC free article] [PubMed] [Google Scholar]
- Smith Tom W. Chicago: National Opinion Research Center; 1993. “Little Things Matter: A Sampler of How Differences in Questionnaire Format Can Affect Survey Responses.”. [Google Scholar]
- ———. “Developing Comparable Questions in Cross-National Surveys.” In. In: Harkness JA, Van de Vijver FJR, Mohler PP, editors. Cross-Cultural Survey Methods, edited by. 69–91. Hoboken, NJ: John Wiley & Sons; 2003. [Google Scholar]
- Smyth Jolene D, Christian Leah Melani, Dillman Don A. “Does ‘Yes or No’ on the Telephone Mean the Same as ‘Check-All-That-Apply’ on the Web?”. Public Opinion Quarterly. 2008;72:103–13. [Google Scholar]
- Smyth Jolene D, Dillman Don A, Christian Leah Melani, McBride Mallory. “Open-Ended Questions in Web Surveys.”. Public Opinion Quarterly. 2009;73:325–37. [Google Scholar]
- Smyth Jolene D, Dillman Don A, Christian Leah Melani, Stern Michael J. “Comparing Check-All and Forced Choice Question Formats in Web Surveys.”. Public Opinion Quarterly. 2006;70:66–77. [Google Scholar]
- Springer Kristen W, Hauser Robert M. “An Assessment of the Construct Validity of Ryff's Scales of Psychological Well-Being: Method, Mode, and Measurement Effects.”. Social Science Research. 2006;35:1080–102. [Google Scholar]
- Sterngold Arthur, Warland Rex H, Herrmann Robert O. “Do Surveys Overstate Public Concern?”. Public Opinion Quarterly. 1999;58:255–63. [Google Scholar]
- Streb Matthew J, Burrell Barbara, Frederick Brian, Genovese Michael A. “Social Desirability Effects and Support for a Female American President.”. Public Opinion Quarterly. 2008;72:76–89. [Google Scholar]
- Sturgis Patrick, Allum Nick, Smith Patten. “An Experiment on the Measurement of Political Knowledge in Surveys.”. Public Opinion Quarterly. 2008;85:90–102. [Google Scholar]
- Sudman Seymour, Bradburn Norman M. Response Effects. Chicago: Aldine; 1974. [Google Scholar]
- Sudman Seymour, Bradburn Norman M, Schwarz Norbert. Thinking About Answers: The Application of Cognitive Processes to Survey Methodology. San Francisco: Jossey-Bass; 1996. [Google Scholar]
- Sudman Seymour, Schwarz Norbert. “Contributions of Cognitive Psychology to Advertising Research.”. Journal of Advertising Research. 1989;29:43. [Google Scholar]
- Thomas Randall K, Klein Jonathan D. “Merely Incidental? Effects of Response Format on Self-Reported Behavior.”. Journal of Official Statistics. 2006;22:221–44. [Google Scholar]
- Todorov Alexander. “The Accessibility and Applicability of Knowledge: Predicting Context Effects in National Surveys.”. Public Opinion Quarterly. 2000;64:429–51. doi: 10.1086/318639. [DOI] [PubMed] [Google Scholar]
- ———. “Context Effects in National Health Surveys: Effects of Preceding Questions on Reporting Serious Difficulty Seeing and Legal Blindness.”. Public Opinion Quarterly. 2000;64:65–76. [PubMed] [Google Scholar]
- Toepoel Vera, Das Marcel, Van Soest Arthur. “Effects of Design in Web Surveys: Comparing Trained and Fresh Respondents.”. Public Opinion Quarterly. 2008;72:985–1007. [Google Scholar]
- Tourangeau Roger. “Cognitive Sciences and Survey Methods.”. In: Jabine T, Straf M, Tanur J, Tourangeau R, editors. Cognitive Aspects of Survey Methodology: Building a Bridge Between Disciplines. Washington, DC: National Academy Press; 1984. pp. 73–100. [Google Scholar]
- Tourangeau Roger, Couper Mick P, Conrad Frederick. “Spacing, Position, and Order: Interpretive Heuristics for Visual Features of Survey Questions.”. Public Opinion Quarterly. 2004;68:349–67. [Google Scholar]
- ———. “Color, Labels, and Interpretive Heuristics for Response Scales.”. Public Opinion Quarterly. 2007;71:91–112. [Google Scholar]
- Tourangeau Roger, Groves Robert M, Redline Cleo D. “Sensitive Topics and Reluctant Respondents: Demonstrating a Link Between Nonresponse Bias and Measurement Error.”. Public Opinion Quarterly. 2010;74:413–32. [Google Scholar]
- Tourangeau Roger, Rips Lance J, Rasinski Kenneth. The Psychology of Survey Response. Cambridge, UK: Cambridge University Press; 2000. [Google Scholar]
- Tourangeau Roger, Miller Steiger Darby, Wilson David. “Self-Administered Questions by Telephone: Evaluating Interactive Voice Response.”. Public Opinion Quarterly. 2002;66:256–78. [Google Scholar]
- Tsuchiya Takahiro, Hirai Yoko, Ono Shigeru. “A Study of the Properties of the Item Count Technique.”. Public Opinion Quarterly. 2007;71:253–72. [Google Scholar]
- Turner Charles F, Martin Elizabeth. Surveying Subjective Phenomena. New York: Russell Sage Foundation; 1984. [Google Scholar]
- Van der Vaart Wander. “The Timeline as a Device to Enhance Recall in Standardized Research Interviews: A Split Ballot Study.”. Journal of Official Statistics. 2004;20:301–18. [Google Scholar]
- Van der Zouwen Johannes, Dijkstra Wil. “Testing Questionnaires Using Interaction Coding.”. In: Maynard DW, Houtkoop-Steenstra H, Van der Zouwen J, Schaeffer NC, 427–48, editors. Standardization and Tacit Knowledge: Interaction and Practice in the Survey Interview. New York: Wiley; 2002. [Google Scholar]
- Van der Zouwen Johannes, Smit Johannes H. Methods for Testing and Evaluating Survey Questionnaires, edited by S. Presser, J.M. Rothgeb, M.P. Couper, J.T. Lessler, E. Martin, J. Martin, and E. Singer, 109–30. 2004. “Evaluating Survey Questions by Analyzing Patterns of Behavior Codes and Question-Answer Sequences: A Diagnostic Approach.”. New York: Wiley. [Google Scholar]
- Vannieuwenhuyze Jorre, Loosveldt Geert, Molenberghs Geert. “A Method for Evaluating Mode Effects in Mixed-Mode Surveys.”. Public Opinion Quarterly. 2010;74:1027–45. [Google Scholar]
- Viterna Jocelyn S, Maynard Douglas W. “How Uniform Is Standardization? Variation Within and Across Survey Research Centers Regarding Protocols for Interviewing.”. In: Maynard DW, Houtkoop-Steenstra H, NC, Van der Zouwen J, editors. Standardization and Tacit Knowledge: Interaction and Practice in the Survey Interview. New York: Wiley; 2002. pp. 365–401. [Google Scholar]
- Willis Gordon B. Cognitive Interviewing: A Tool for Improving Questionnaire Design. Thousand Oaks, CA: Sage; 2005. [Google Scholar]
- Willis Gordon B, DeMaio Theresa J, Harris-Kojetin Brian. “Is the Bandwagon Headed to the Methodological Promised Land? Evaluating the Validity of Cognitive Interviewing Techniques.”. In: Sirken MG, Herrmann DJ, Schechter S, Schwarz N, Tanur JM, Tourangeau R, editors. Cognition and Survey Research. New York: John Wiley & Sons; 1999. pp. 133–54. [Google Scholar]
- Wilson David C. “Perceptions About the Amount of Interracial Prejudice Depend on Racial Group Membership and Question Order.”. Public Opinion Quarterly. 2010;74:344–56. [Google Scholar]
- Wilson David C, Moore David W, McKay Patrick F, Avery Derek R. “Affirmative Action Programs for Women and Minorities: Expressed Support Affected by Question Order.”. Public Opinion Quarterly. 2008;72:514–22. [Google Scholar]
- Yan Ting, Tourangeau Roger. “Fast Times and Easy Questions: The Effects of Age, Experience, and Question Complexity on Web Survey Response Times.”. Applied Cognitive Psychology. 2008;22:51–68. [Google Scholar]
- Yonker James A, Hauser Robert M, Freese Jeremy. 2007. “The Dimensionality and Measurement of Cognitive Functioning at Age 65 in the Wisconsin Longitudinal Study.”. Center for Demography and Ecology Working Paper 2007-06, University of Wisconsin–Madison, Madison, WI. [Google Scholar]