

SUMMARY
Activity-dependent neurotransmitter switching engages genetic programs regulating transmitter synthesis but the mechanism by which activity is transduced is unknown. We suppressed activity in single neurons in the embryonic spinal cord to determine whether glutamate-GABA switching is cell-autonomous. Transmitter respecification did not occur, suggesting that it is homeostatically regulated by the level of activity in surrounding neurons. Graded increase in the number of silenced neurons in cultures led to graded decrease in the number of neurons expressing GABA, supporting non-cell-autonomous transmitter switching. We found that BDNF is expressed in the spinal cord during the period of transmitter respecification and that spike activity causes release of BDNF. Activation of TrkB receptors triggers a signaling cascade involving JNK-mediated activation of cJun that regulates tlx3, a glutamate/GABA selector gene, accounting for calcium-spike-BDNF-dependent transmitter switching. Our findings identify a molecular mechanism for activity-dependent respecification of neurotransmitter phenotype in developing spinal neurons.
Keywords: Calcium signaling, neurotransmitter respecification, BDNF, JNK, cJun, neuronal development, Xenopus
INTRODUCTION
Specification of neurotransmitters is a fundamental aspect of neuronal development, allowing establishment of functional connections at synapses and enabling normal operation of the nervous system. Distinct expression patterns of transmitters are initially determined by transcription factors via genetic programs (Cheng et al., 2004; Mizuguchi et al., 2006; Pillai et al., 2007), and subsequently respecified by electrical activity (Dulcis and Spitzer, 2008; Demarque and Spitzer, 2010; Marek et al., 2010). Activity-dependent transmitter respecification is a recently discovered form of brain plasticity, distinct from changes in synaptic strength and number of synapses, in which neurons acquire an additional transmitter, lose a transmitter or switch between one transmitter and another (Spitzer, 2012). It can be driven by target-derived factors, experimental manipulations of spontaneous activity, or by natural fluctuations in sensory stimuli in both developing and mature neurons (Furshpan et al. 1976; Landis, 1976; Walicke et al., 1977; Schotzinger & Landis, 1988; Gutiérrez, 2002; Borodinsky et al., 2004; Dulcis & Spitzer, 2008; Demarque & Spitzer, 2010; Marek et al., 2010; Dulcis et al., 2013). Spontaneous Ca2+ spikes regulate inhibitory and excitatory transmitter phenotypes homeostatically in embryonic Xenopus spinal neurons. When Ca2+ spikes are suppressed, more neurons express the excitatory neurotransmitters glutamate and acetylcholine. In contrast, when Ca2+ spiking is increased, more neurons express the inhibitory neurotransmitters GABA and glycine (Borodinsky et al., 2004). Here we identify the signal transduction cascade linking activity to changes in gene expression that lead to transmitter switching.
Electrical activity leads to a wide range of elevations of intracellular Ca2+ that could regulate expression of genes determining excitatory or inhibitory phenotype in a cell-autonomous manner. However, these transient elevations of intracellular Ca2+ could also regulate cellular secretion enabling inductive interactions among cells to specify neurotransmitter via a non-cell-autonomous mechanism (Spitzer, 2006). The role of cell-autonomous versus non-cell autonomous mechanisms is often examined in purified and sparsely plated cultures (Tonge and Andrews, 2010) but is more challenging to address in vivo (Lee and Luo, 1999; Zong et al., 2005). We address this issue by developing a novel single-neuron targeting method in vivo. No transmitter switch was observed in single neurons in which Ca2+ spikes had been suppressed, indicating that a non-cell-autonomous mechanism is involved.
BDNF then became an attractive candidate to regulate activity-dependent transmitter respecification because its expression and release are regulated by neuronal activity (Balkowiec and Katz, 2002; Gartner and Staiger, 2002; Tabuchi et al., 2000) and it has been implicated in mechanisms that optimize neuronal differentiation and neuronal plasticity (Vicario-Abejon et al., 2002; Park and Poo, 2013). Application or overexpression of BDNF promotes development of inhibition (Ohba et al., 2005), whereas decreased expression or disruption of the function of BDNF impairs development of inhibitory synapses (Hong et al., 2008; Shinoda et al., 2011). On the other hand, application of BDNF leads to suppression of excitatory synaptic transmission (Yang et al., 2002). BDNF exerts its action by binding preferentially to its tyrosine receptor kinase (TrkB) but also through its low affinity receptor p75. Upon ligand binding, TrkB receptor dimerization leads to transautophosphorylation and activation of intracellular signaling cascades, including MAP kinase (MAPK), PI 3-kinase (PI3K) and phospholipase-Cγ (PLCγ) pathways (Huang and Reichardt, 2003).
We demonstrate Ca2+ spike-dependent BDNF release, identify critical components of the molecular signaling pathway downstream of BDNF, and show that BDNF regulates glutamate/GABA switching. Thus genetic programs and collective electrical activity that drives transmitter induction via BDNF determine the mature transmitter phenotype. Understanding the molecular basis of transmitter respecification identifies potential points of intervention for therapeutically enhancing or restoring synaptic transmission that is impaired in neurological or psychiatric disorders.
RESULTS
Suppression of Ca2+ spike activity in single neurons in vivo
Ca2+-dependent electrical activity in embryonic Xenopus spinal neurons homeostatically regulates respecification of the neurotransmitters that neurons express without affecting cell identities both in vivo and in vitro (Borodinsky et al., 2004). Misexpression of human inward rectifier K+ channels (hKir2.1) by injection of hKir2.1 mRNA causes more neurons to express the excitatory transmitters glutamate and acetylcholine while fewer neurons express the inhibitory transmitters GABA and glycine in the spinal cord. We developed a single-neuron targeting system to determine whether activity-dependent neurotransmitter respecification is cell-autonomous in vivo. Expression from DNA constructs is mosaic and only a few cells express large amounts of transcript while most cells express none (Kroll and Amaya, 1996). Accordingly, blastomeres were injected with hKir2.1 DNA instead of mRNA. Although mosaic expression from DNA constructs has been regarded as a nuisance, here it becomes an asset. In addition, neuronal lineages have been determined at the 16-cell stage (Moody, 1989), enabling more specific manipulation of Ca2+ spike activity in particular classes of spinal neurons. We thus performed injections at this stage to further limit the number of cells expressing the DNA of interest.
We injected hKir2.1-mCherry DNA into the D1.1 or D1.2 blastomeres of the 16-cell blastula (Figure S1A), both of which make a major contribution to neurons in the ventral spinal cord (Xenbase.org). When embryos reached the late tailbud stage (stage 41), mCherry was typically observed in several neurons separated along the spinal cord (Figure S1B), indicating the success of targeting single neurons by this method. Eighty percent of them were located on the ventral side of the neural tube and only twenty percent of them were located on the dorsal side of the neural tube (Figure S1C). Since V1.2 blastomeres make a major contribution to the dorsal spinal cord (Xenbase.org), DNA injection of these cells predominantly targeted neurons on the dorsal side (data not shown).
Activity blockade in single neurons does not switch neurotransmitters
hKir2.1 has been used to suppress neuronal excitability both in vitro (Burrone et al., 2002) and in vivo (Borodinsky et al., 2004; Mizuno et al., 2007). To determine whether misexpression of hKir2.1-mCherry in single neurons suppresses Ca2+ spikes, we assessed Ca2+ activity in these mCherry-labeled neurons by confocal imaging of Fluo-4 AM. Although neurons located on both dorsal and ventral surfaces spike in situ in X. laevis, those positioned on the dorsal surface spike at lower frequencies at early stages of development (Belgacem and Borodinsky, 2011; Borodinsky et al., 2004; Gu et al., 1994; Root et al., 2008). We thus imaged the intact ventral spinal cord at stage 23–25 when most classes of neurons exhibit a higher incidence and frequency of Ca2+ spikes (Borodinsky et al., 2004). Neurons without hKir2.1 expression in the same embryos served as internal controls (Figure 1A). Misexpression of hKir2.1-mCherry decreased both spike incidence and frequency in single neurons (Figure 1B,C; Figure S1D). The incidence and frequency of spiking in single neurons expressing mCherry alone were similar to those in internal controls, suggesting that mCherry has no effect on Ca2+ spike activity and allows hKir2.1 to effectively exert its hyperpolarizing function (Figure 1C; Figure S1D).
Figure 1. Misexpression of hKir2.1 suppresses Ca2+ spike generation in single neurons in situ without changing the identity of their neurotransmitter.
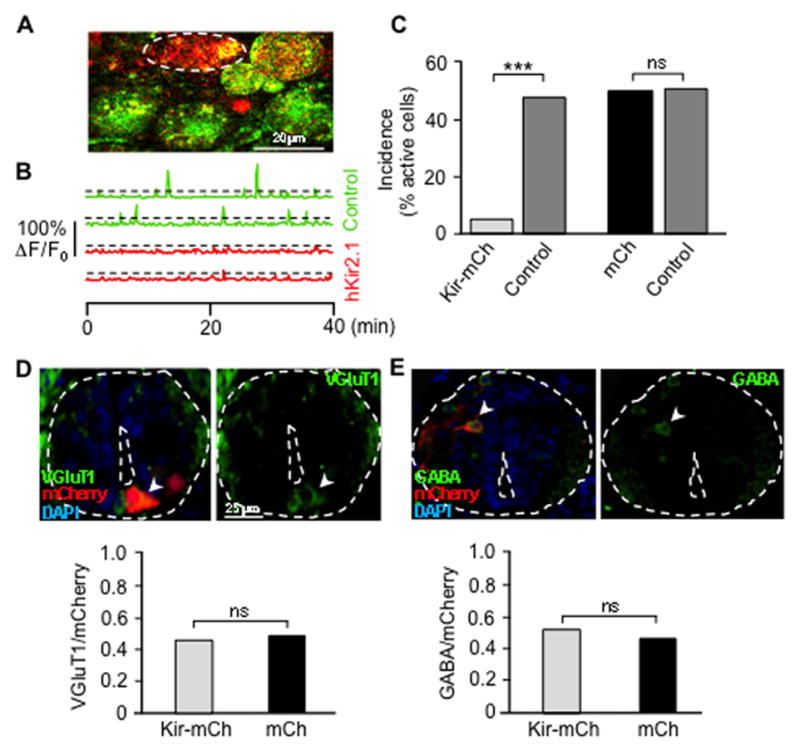
(A) Confocal image of a stage 25 ventral spinal cord. Dashed oval outlines a hKir2.1-mCherry/Fluo-4 AM-expressing neuron (red and yellow). Neurons loaded with Fluo-4 AM (green) are internal controls.
(B) Spike activity is absent in these hKir2.1-mCherry-expressing neurons and present in internal controls. Ca2+ spikes were identified as fluorescence transients greater than 20% of ΔF/F0 (dashed lines), more than twice the standard deviation of the baseline.
(C) Spike incidence during one hr imaging periods. n≥7 stage 23–25 embryos per group; 37–63 neurons were analyzed per group. Kir-mCh cells, hKir2.1-mCherry-expressing neurons; mCh cells, mCherry alone-expressing neurons.
(D,E) VGluT1 and GABA staining and quantitative analysis of stage 41 larvae from Kir-mCherry DNA- and mCherry DNA-injected embryos. Arrowheads identify a VGluT1-immunoreactive and a GABA-immunoreactive neuron. n≥7 embryos per group; 36–58 neurons were analyzed for each group. VGluT1/mCherry and GABA/mCherry represent the fraction of mCherry-labeled neurons that are VGluT1-immunoreactive and GABA-immunoreactive. ***, p<0.001; ns, not significant. Mann-Whitney U test.
See also Figure S1.
We then determined whether homeostatic transmitter switching occurred in the single neurons in which Ca2+ spike activity had been suppressed. The primary nervous system in Xenopus embryos is comprised of only ~1000 neurons (Hartenstein, 1993). Neurons on the ventral side of the neural tube include cholinergic motor neurons, GABAergic ascending interneurons, and cholinergic/glutamatergic descending interneurons (Li et al., 2004; Roberts et al., 1987). Neurons on the dorsal side of the neural tube comprise the glutamatergic Rohon-Beard sensory neurons and GABAergic/glycinergic dorsolateral ascending interneurons (Roberts et al., 1987; Sillar and Roberts, 1988). If Ca2+ spikes acted cell-autonomously, we expected that suppressing activity in single neurons on the ventral side of the spinal cord would cause neurons not normally glutamatergic to acquire a glutamatergic phenotype, identified by expression of vesicular glutamate transporter (vGluT1). VGluT1- but not vGluT2- or vGluT3-immunoreactivity colocalizes with glutamate immunoreactivity (Glu-IR), making vGluT1 a useful glutamatergic marker (Borodinsky et al., 2004). In parallel, we expected that suppressing activity in single neurons on the dorsal side of the spinal cord would cause them to lose the GABAergic phenotype, assessed by GABA-immunoreactivity (GABA-IR). Neurons were identified by position and morphology. Strikingly, the incidence of vGluT1-IR neurons among hKir2.1-mCherry-labeled ventral neurons and among mCherry-alone-labeled ventral neurons did not differ from each other. This result indicates that the glutamatergic phenotype was not acquired in single neurons in which Ca2+ spikes had been suppressed (Figure 1D). Moreover no difference was observed in the incidence of GABA-IR between hKir2.1-mCherry labeled neurons and mCherry-alone-labeled dorsal neurons, indicating that there is no decrease in the incidence of GABA-IR cells among the single neurons in which Ca2+ spikes have been suppressed (Figure 1E). These data suggest that the mechanism for Ca2+ spike activity-dependent transmitter respecification in the embryonic spinal cord is non-cell-autonomous.
To further analyze network-dependent regulation of transmitter switching we changed the ratio of silenced to unsilenced neurons in a graded manner. Because most chemical synapses have yet to be formed during the period when activity respecifies transmitter identity, the network is likely to involve secreted ligands that diffuse to receptors on neurons. Accordingly we plated different ratios of active (wild-type) and silenced (hKir2.1-mCherry labeled) neurons in dissociated cell cultures (Figure 2A,B) and assessed the impact of diffusion of agents among synaptically unconnected neurons. The results indicate that the percent of neurons expressing GABA depends on the percent of silenced hKir2.1-mCherry-expressing neurons in the total population, as demonstrated by linear regression analysis (Figure 2C): the slope is significantly nonzero (black). In addition, assuming a linear relationship, the slopes are not significantly different for active (wild-type, grey) and silenced (hKir2.1-mCherry, red) neurons, further supporting a non-cell autonomous mechanism. We grouped the data into five classes (0, 25, 50, 75 and 100% of silenced neurons) to determine whether differences in percent of neurons expressing GABA as a function of neurons expressing hKir2.1-mCherry were significant (Figure 2D). We found that increasing the percent of silenced neurons (hKir2.1-mCherry) leads to a progressive decrease in the percent of GABA-IR, further motivating the search for a secreted ligand that regulates neurotransmitter respecification.
Figure 2. Increasing the number of silenced neurons in vitro decreases the number of both silenced and active GABA-IR neurons equally.
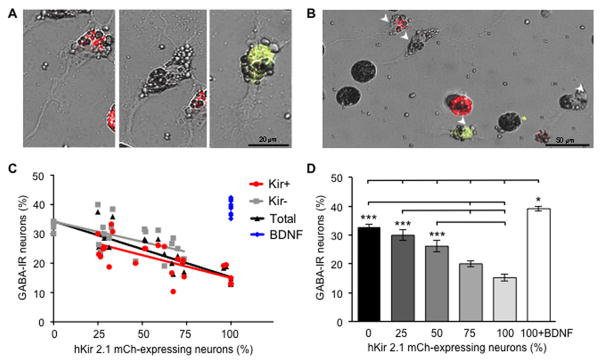
(A–B) A representative view of active (wild-type) and silenced (hKir2.1-mCherry labeled) neurons in a dissociated 50% silenced neuron-enriched culture. (A) High magnification views of individual active or silenced neurons. (B) Low magnification view showing 2 active and 2 silenced neurons (arrowheads), one of which is GABA-IR+. hKir2.1-mCherry: red; GABA-IR/hKir2.1-mCherry: yellow.
(C) The percent of neurons expressing GABA-IR depends on the percent of silenced neurons expressing hKir2.1-mCherry. Black: total number of GABA-IR neurons/total number of neurons. Red: number of GABA-IR Kir+ neurons/number of Kir+ neurons. Grey: number of GABA-IR Kir− neurons/number of Kir− neurons. Blue: Total GABA-IR% of 100% silenced cultures with BDNF addition. Simple linear regression analysis was performed for the first 3 groups. Total: slope= −0.19 ± 0.02, significantly non-zero (p<0.0001); Kir+: slope= −0.15 ± 0.03, significantly non-zero (p<0.0001); Kir-: slope= −0.14 ± 0.04, significantly non-zero (p=0.002). ANOVA. The slopes for active (Kir-) neurons, silenced (Kir+) neurons, and the total population are not significantly different. ANOVA.
(D) Bars represent the percent of neurons expressing GABA-IR from 6 groups (0, 25, 50, 75, 100% silenced and 100% silenced plus BDNF). Cultures with more than 35 neurons post-staining were selected, and n=4–8 cultures per group were analyzed. Data are mean±SEM. *, p<0.05; ***, p<0.001; ****, p<0.0001. One-way ANOVA Tukey’s multiple comparisons test.
BDNF is released by Ca2+ spike activity
Neurotrophins are important regulators of neural development, survival, function, and plasticity (Chao, 2003). Neurotransmitter specification in Xenopus embryos is most responsive to changes in Ca2+ spike activity during the critical period between neural tube formation (stage 20) and an early larval stage (stage 28); sensitivity decreases and disappears when the embryo approaches stage 35 (Borodinsky et al., 2004; Root et al., 2008). BDNF expression has been detected in the neural plate in Xenopus embryos at stage 18 (Huang et al., 2007).
In situ hybridization with a 387 bp probe to BDNF revealed its expression in the neural plate and neural tube at stages 18, 24 and 28, throughout the critical period for transmitter respecification when spontaneous Ca2+ spike activity is present (Figure 3A). TrkB immunostaining identifies the presence of BDNF receptors at stages 24 and 28 (Figure S2), sparsely expressed on a subset of neurons. To determine whether BDNF is released by spike activity we prepared nerve-muscle cultures from embryos expressing BDNF-pHluorin (Matsuda et al., 2009). Depolarization of neurons with KCl to mimic Ca2+ spikes (Gu and Spitzer, 1995) stimulated Ca2+-dependent decreases in fluorescence (Figure 3B). A significant decrease was observed during depolarization at the presence of 2 mM Ca2+ (13%±1%), whereas no difference was observed during depolarization in the absence of Ca2+ (1%±2%) (Figure 3C). This result is consistent with the changes in BDNF-pHluorin fluorescence observed with substantial BDNF release (Matsuda et al., 2009). To ascertain whether BDNF is released by spontaneous activity throughout this critical period, we collected cell-conditioned culture medium before (1–3 hr in vitro), during (3–9 hr in vitro) and after (14 hr in vitro) spontaneous Ca2+ spike activity (Chang and Spitzer, 2009). Only cell-conditioned medium collected during the period of spontaneous Ca2+ spike activity showed an increase in the levels of released BDNF compared to the earlier and later times when spontaneous Ca2+ spike activity is reduced (Figure 3D). Moreover, a significant increase was observed in cell-conditioned medium from control cultures when compared to cell-conditioned medium obtained from cultures in which Ca2+ spike activity had been suppressed by misexpression of hKir2.1 mRNA. These results suggest that BDNF is released in an activity-dependent manner. Strikingly, the decrease in percent of GABA-IR neurons observed after the increase in hKir2.1-mCherry expressing neurons in vitro (Figure 2C,D) is prevented when BDNF is applied to cultures of fully silenced neurons. Based on these observations, we hypothesized that BDNF regulates activity-dependent transmitter respecification during early development.
Figure 3. BDNF is expressed throughout the critical period for neurotransmitter specification and release depends on spontaneous Ca2+ spike activity.
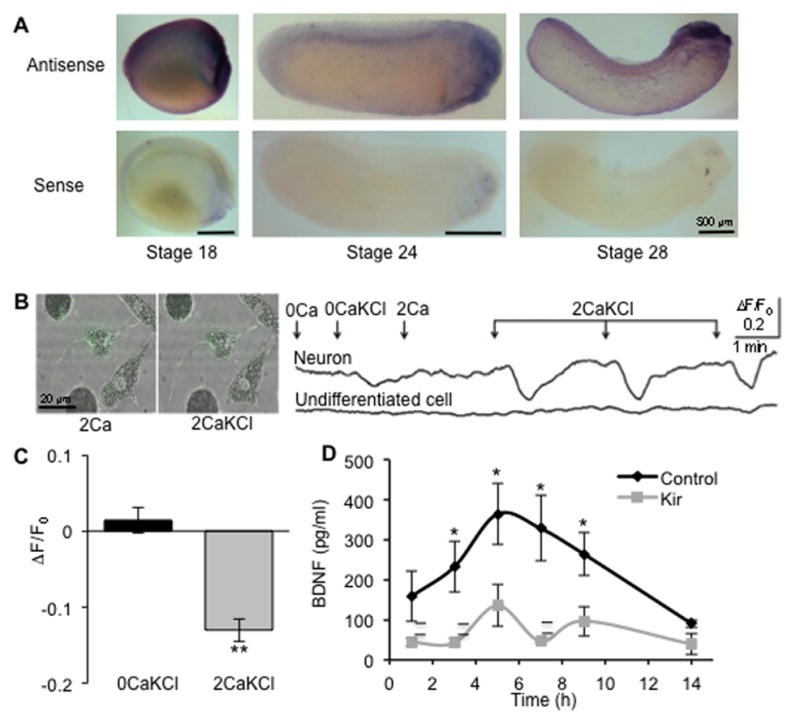
(A) BDNF transcript expression in embryos at stages 18, 24 and 28.
(B) BDNF release by Ca2+ spike activity. Left: superimposed fluorescence and bright field images of a neuron and muscle and undifferentiated cells loaded with BDNF-pHluorin before and after depolarization with 2 mM Ca2+ + 100 mM KCl (2CaKCl). Right: representative trace showing time course of cell body fluorescence changes of a neuron and an undifferentiated cell. The culture was first depolarized with KCl in the absence of Ca2+ as control (0CaKCl), and then depolarized 3 times in the presence of Ca2+ (2CaKCl). Each 30s depolarization, mimicking a Ca2+ spike, causes a decrease in BDNF-pHluorin fluorescence selectively in the neuron in the presence of Ca2+. Arrows indicate the start of perfusion: 0Ca, 0 mM Ca2+ + 0.67 mM KCl; 0CaKCl, 0 mM Ca2+ + 100 mM KCl; 2Ca, 2 mM Ca2+ + 0.67 mM KCl; 2CaKCl, 2 mM Ca2+ + 100 mM KCl.
(C) Quantification of the decrease of BDNF-pHluorin fluorescence in response to 2CaKCl. n=5 neurons from 5 independent experiments. Data are mean±SEM. **, p<0.01. Mann-Whitney U Test.
(D) BDNF protein in culture medium in the absence (Kir) or in the presence (control) of spontaneous activity. Cultures were prepared from embryos injected either with hKir2.1 mRNA and Cascade Blue dextran or Cascade Blue dextran alone (control). Medium was collected at the indicated times and released BDNF levels (pg/ml) were measured with a conventional two-site ELISA system. n ≥4 cultures per condition; ≥40 neurons/culture. Kir, hKir2.1 misexpression. Data are mean±SEM. *, p<0.05. Mann-Whitney U test.
BDNF regulates neurotransmitter phenotype homeostatically
To examine the role of BDNF in the non-cell-autonomous mechanism of neurotransmitter respecification in vivo, we spatially and temporally restricted production of BDNF by delivering a lissamine-tagged BDNF morpholino (BDNF MO) to the anterior spinal cord by local electroporation at the neural plate stage (stage 15/16) to avoid early developmental defects caused by constitutive inhibition (Figure 4A). Larvae from embryos electroporated with a control MO (CMO) or BDNF MO were fixed at 3 d (stage 41). The number of glutamatergic neurons was increased and the number of GABAergic neurons was decreased in the anterior spinal cord of embryos electroporated with BDNF MO (Figure 4C–E), mirroring the effect of hKir2.1 misexpression in Xenopus spinal neurons on transmitter respecification when Ca2+ spike activity is blocked (Borodinsky et al., 2004).
Figure 4. BDNF regulates neurotransmitter phenotype downstream of Ca2+ spike activity.
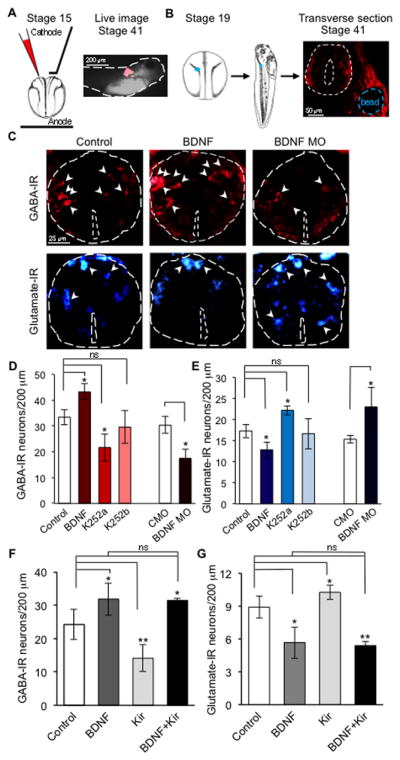
(A) Embryos were electroporated with lissamine-tagged BDNF MO or CMO. Lissamine distribution (red) in a live stage 41 larva demonstrates targeting of the spinal cord.
(B) Single agarose beads (blue) loaded with BDNF, K252a or K252b were implanted adjacent to the nascent neural tube (white dashed circle) at stage 19 and stage 41 larvae were sectioned for immunocytochemistry.
(C–E) GABA (C,D) and glutamate (C,E) staining following implantation of beads containing BDNF (100 ng/ml), K252a or K252b (50 μM), a membrane impermeable analog of K252a, or BDNF MO and CMO electroporation. Beads were located adjacent to the most rostral 100 μm of the spinal cord. 101 to 195 neurons were analyzed per condition per 200 μm.
(F,G) GABA and glutamate expression in embryos in the presence of BDNF, in embryos misexpressing hKir2.1, and in embryos misxpressing hKir2.1 in the presence of BDNF. C–G, n≥5 embryos per condition. 128–255 neurons were analyzed per condition per 200 μm. Data are mean±SEM. *, p<0.05; **, p<0.01. ns, not significant. ANOVA test with Bonferroni post-hoc analysis.
See also Figure S2.
We then implanted small agarose beads adjacent to the anterior spinal cord to locally and chronically release BDNF during specific stages of development (Borodinsky et al., 2004; Root et al., 2008). Beads were loaded with BDNF or vehicle, implanted at the time of neural tube closure (stage 18) and larvae were fixed at stage 41 (Figure 4B). Embryos implanted with BDNF-loaded beads showed an increase in number of GABAergic neurons and a decrease in number of glutamatergic neurons (Figure 4C–E; Figure S3), mirroring the effect of rat brain sodium channel II (Nav1.2α/β) misexpression in Xenopus spinal neurons on transmitter respecification when Ca2+ activity is enhanced (Borodinsky et al., 2004).
Activation of the TrkB receptor tyrosine kinase is the principal pathway by which BDNF initiates downstream signaling. To determine whether the observed effect of BDNF on transmitter respecification was mediated by Trk receptors we delivered K252a, a membrane permeable tyrosine kinase inhibitor with relatively high affinity for TrkB receptors, via agarose beads implanted in embryos. As a negative control, we implanted embryos with beads containing K252b, the non-functional analogue of K252a. As expected, the number of GABAergic neurons and glutamatergic neurons in embryos implanted with K252b-loaded beads was similar to that in controls with vehicle-loaded beads. However, Trk inhibition with K252a had a similar effect to that observed following electroporation of the BDNF MO (Figure 4D,E; Figure S3), suggesting that BDNF regulates transmitter phenotype through a K252a-sensitive pathway, most likely via TrkB receptor signaling.
To determine whether BDNF is an integration point for Ca2+ spike activity-dependent respecification of transmitters, we performed simultaneous manipulations of Ca2+ activity and BDNF in vivo. Misexpression of hKir2.1 mRNA to suppress Ca2+ spike activity throughout the spinal cord generated an increase in the number of glutamatergic neurons and a decrease in the number of GABAergic neurons. Release of BDNF from beads implanted adjacent to the spinal cord produced the opposite phenotypes. Simultaneous suppression of Ca2+ activity and application of BDNF in the spinal cord phenocopied the result obtained by application of BDNF alone (Figure 4F,G). These results indicate that Ca2+ spike activity regulates transmitter specification upstream of BDNF function. Given the low frequency and apparently stochastic generation of Ca2+ spikes, the non-cell-autonomous coordination of Ca2+ spike activity and BDNF derived from neighboring neurons may drive transmitter switching more reliably than cell-autonomous Ca2+ spike activity alone.
BDNF regulates neurotransmitter fate via JNK-mediated cJun phosphorylation
We next investigated the intracellular pathway regulated by BDNF. Previous work identified cJun phosphorylation as the Ca2+ spike entry point in the genetic pathway (Marek et al., 2010). Because Ca2+ activity regulates phosphorylation of cJun and BDNF is downstream of Ca2+ spikes we first determined whether BDNF regulates phosphorylation of cJun in vitro. Western blotting of extracts from neuronal cultures with phospho-specific antibodies showed that phosphorylation of cJun (P-cJun) at serine 73 (S73) was decreased in response to Ca2+ spike suppression or in absence of Ca2+ but restored after BDNF application. In addition K252a but not K252b blocked the effect of Ca2+ spikes on cJun phosphorylation (Figure 5A) and immunostaining of the embryonic spinal cord (stage 28) revealed that TrkB is expressed in the same subset of neurons showing cJun phosphorylation (Figure 5B), suggesting that BDNF-induced cJun phosphorylation is mediated by TrkB receptor signaling.
Figure 5. BDNF regulates cJun phosphorylation.
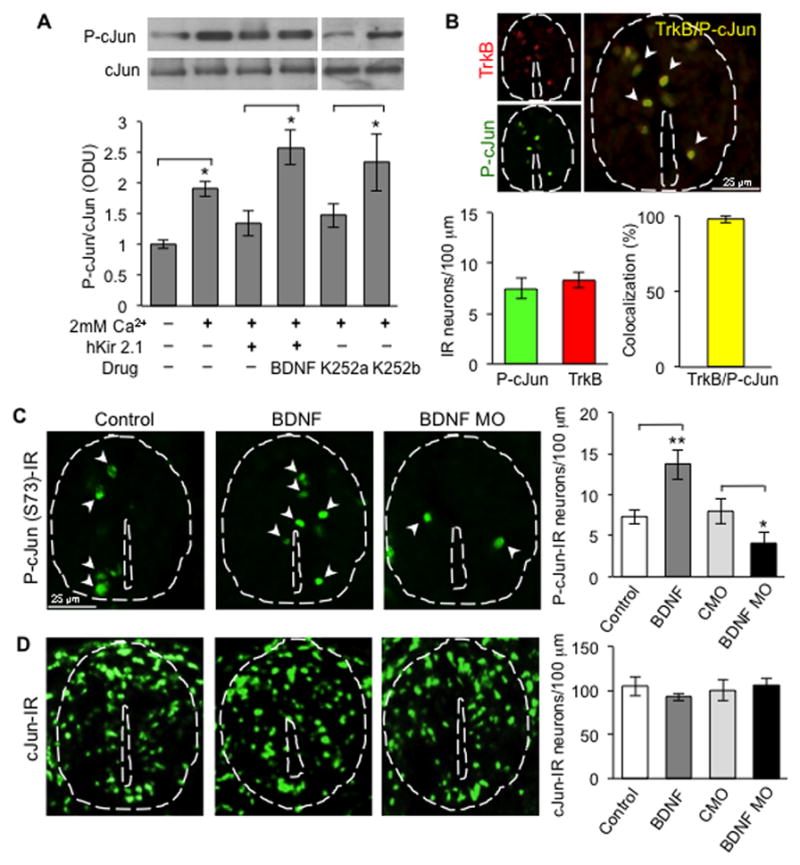
(A) P-cJun expression in the presence or absence of hKir2.1 expression, BDNF (100 ng/ml) or Trk receptor blocker (50 μM). Protein levels in neuronal cultures were determined by Western blot. Graph presents the ratio between the phosphorylated protein and total protein expressed in optical density units (O.D.U). n≥5 cultures per condition. Kir, hKir2.1 misexpression. Full-length Western blot is shown in Figure S5.
(B) P-cJun and TrkB staining of embryos (stage 28) showing colocalization. n ≥5 embryos per condition. 132 to 151 neurons were analyzed per condition per 100 μm.
(C) P-cJun and (D) cJun staining of embryos (stage 28) in the presence of control or BDNF beads or electroporated with BDNF MO or CMO. n≥5 embryos per condition. 137 to 158 neurons were analyzed per condition per 100 μm. Data are mean±SEM. *, p<0.05; **, p<0.01. Mann-Whitney U test.
To confirm these results in vivo we examined S73 cJun phosphorylation after BDNF manipulation. Embryos were electroporated with BDNF MO at the neural plate stage (stage 15/16) or implanted with BDNF-loaded beads at the time of neural tube closure (stage 18), fixed at 1.5 d of age (stage 28), sectioned and immunostained. BDNF-treated embryos showed an increase in the number of cells exhibiting cJun phosphorylation (14% to 28% of total cells expressing cJun) whereas the opposite effect was found when BDNF function was knocked down by morpholino electroporation (14% to 7% of total cells expressing cJun) (Figure 5C). This result is consistent with the previous demonstration of decreased phosphorylation of cJun in response to Ca2+ spike suppression and increased phosphorylation in response to Ca2+ spike enhancement (Marek et al., 2010). No changes were observed in the number of cells expressing cJun (Figure 5D).
To identify the signaling components downstream of BDNF leading to changes in cJun phosphorylation we turned again to neuronal cultures. A pharmacological screen was used to determine which drugs reduce the level of phosphorylated cJun detected by Western blots of protein extracts from neuronal cultures in which Ca2+ activity is present. BDNF stimulates pathways regulated by MAPK, PI3K and PLCγ by activation of TrkB receptors (Huang and Reichardt, 2003). We first assessed the role of MAPK inhibitors to characterize the kinase that phosphorylates cJun. cJun can be phosphorylated by MAPK such as JNK, p38 and ERK1/2. Accordingly we used SP600125 to inhibit JNK, U0126 to inhibit ERK1/2 (MEK) and SB235699 to inhibit p38. Western blot assays demonstrated that inhibiting JNK and MEK but not p38 causes a significant decrease in cJun phosphorylation (Figure S4).
Because Ca2+ activity could be involved, we tested inhibitors for the Ca2+-dependent kinases PKC (GF109203x) and CAMKII (KN-93). To determine whether TrkB/MAPK signaling is the principal pathway responsible for cJun phosphorylation, we tested inhibitors for the PI3K (LY294002) and PLCγ (U73122) pathways. Western blot assay showed that phosphorylation of cJun was not decreased in response to any of these inhibitors (Figure S4), suggesting that the TrkB activated MAPK signaling pathway is responsible for cJun phosphorylation.
To further test the participation of MAPK in BDNF signaling, we performed Western blot assays on cultures following Ca2+ spike suppression and BDNF addition. Both MEK and JNK inhibitors reduced cJun phosphorylation mediated by BDNF (Figure 6A). JNK is an attractive candidate because it can regulate cJun activity via direct phosphorylation of cJun S63/S73 and T91/T93 (Raivich, 2008) and its expression has been detected in the head and the dorsal region of stage 24 embryos by both RT-PCR and in situ hybridization (Yamanaka et al., 2002).
Figure 6. Signaling pathway regulating BDNF-dependent cJun phosphorylation.
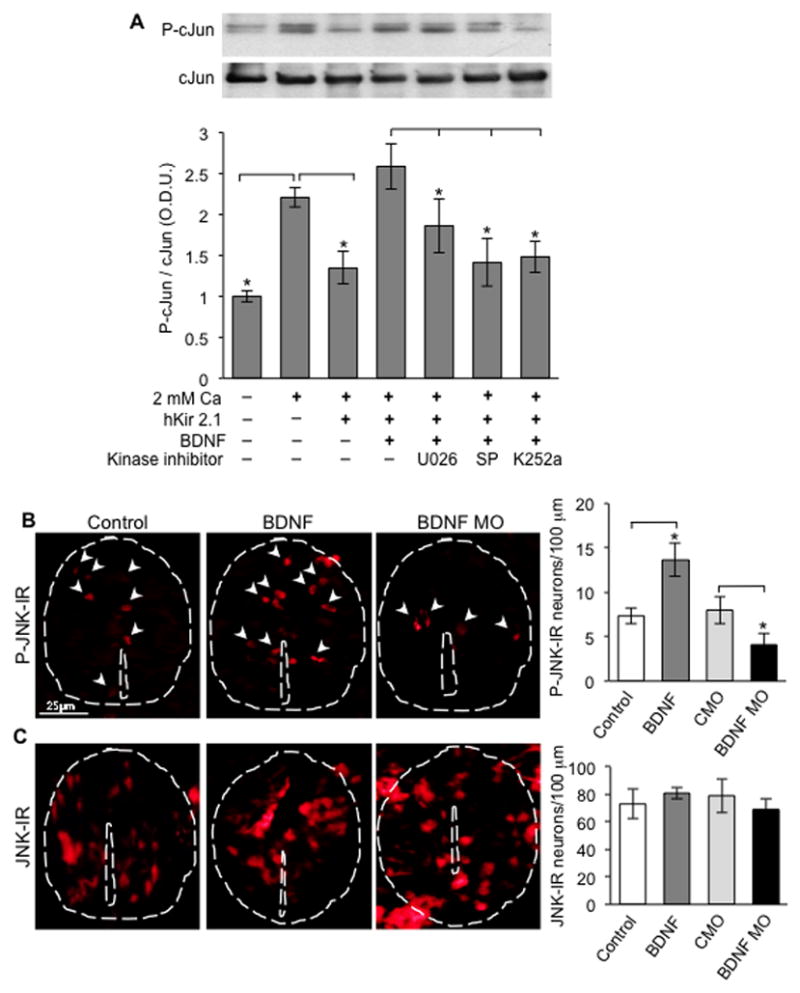
(A) P-cJun expression in the presence or absence of BDNF (100 ng/ml) and inhibitors of ERK1/2 (MEK, U0126), JNK (SP600125) or Trk receptors (K252a) (all 10 μM). Graph as in Figure 4. n≥5 cultures per condition; ≥40 neurons/culture. Data are mean±SEM. *, p<0.05. ANOVA test with Bonferroni post-hoc analysis. Full-length Western blot is shown in Figure S5.
(B,C) P-JNK and JNK staining of embryos in the presence of control or BDNF beads or electroporated with BDNF MO or CMO. n≥5 stage 28 embryos per condition; 137 to 151 neurons were analyzed per condition per 100 μm. Data are mean±SEM. *, p<0.05. Mann-Whitney U test.
To determine whether BDNF activates JNK in vivo in order to phosphorylate cJun, we examined JNK phosphorylation after BDNF manipulation. Embryos were electroporated with the BDNF MO or implanted with BDNF-loaded beads, in separate experiments, fixed at stage 28, sectioned and immunostained to examine JNK activation. BDNF-treated embryos showed an increase in the number of cells exhibiting JNK phosphorylation whereas the opposite effect was found when BDNF function was knocked down by MO electroporation (Figure 6B), suggesting that the BDNF-induced signaling pathway leads to JNK activation. No changes were observed in the number of cells expressing JNK (Figure 6C). Consistent with Western blot results, in vivo electroporation of a JNK MO blocked the increases in phospho-cJun-IR (Figure 7A), mimicking the effect of the BDNF MO described above and suggesting that JNK has a primary role in the BDNF-induced signaling pathway leading to cJun phosphorylation. No changes were observed in the number of cells expressing cJun (Figure 7B). Moreover, the JNK MO blocked the increase in GABA-IR and the decrease in glutamate-IR otherwise stimulated by misexpression of Nav1.2α/β that increases Ca2+ spike activity (Figure 7C,D). Thus, BDNF regulates transmitter respecification by modulating JNK-mediated cJun phosphorylation via a TrkB/MAPK signaling pathway.
Figure 7. JNK regulates cJun phosphorylation and neurotransmitter phenotype.
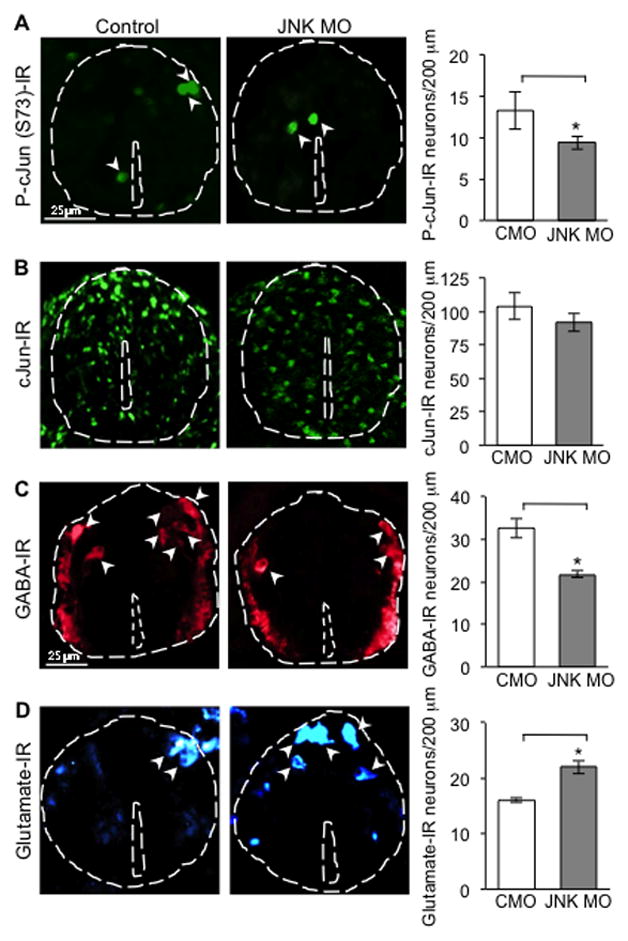
(A,B) P-cJun and cJun staining of embryos (stage 28) electroporated with JNK MO or CMO. 128–152 neurons were analyzed per condition per 100 μm.
(C,D) GABA and glutamate staining of embryos (stage 41) following JNK MO and CMO electroporation. n ≥5 embryos per condition. 152–215 neurons were analyzed per condition per 200 μm. Data are mean±SEM. *, p<0.05. Mann-Whitney U test.
DISCUSSION
Regulation of the levels of an existing neurotransmitter has been well characterized, but the molecular signaling involved in transmitter respecification initiated by activity has received little attention. Increases or decreases in Ca2+ spike activity during development of the Xenopus nervous system lead to changes in transmitter specification that are generally compensatory and homeostatic. Here we have developed a novel, practical method to manipulate Ca2+ activity in single neurons in vivo to determine whether changes are triggered by alteration of activity in single neurons. Our results indicate that suppression of activity in single spinal neurons is not sufficient to trigger changes in transmitters, identifying the role of a non-cell-autonomous mechanism. Graded suppression of activity in an increasingly large fraction of a neuronal population led to a graded change in the number of neurons expressing GABA, with no difference between silenced and active neurons. We then demonstrated that Ca2+ spike activity generated prior to synapse formation acts via BDNF through a TrkB/MAPK signaling pathway to phosphorylate cJun and respecify transmitter phenotype. These results provide the first identification of a molecular cascade that transduces electrical activity into a switch in transmitter identity.
Silencing single neurons in vivo and graded populations in vitro
Although delivery of genes to single cells in vivo is conceptually and experimentally attractive, it has been challenging to implement due to technical difficulties. Single cell gene targeting is useful to determine whether the effects induced by exogenous or endogenous gene expression in the targeted cell are cell-autonomous or due to interactions with neighboring cells. In Drosophila, homozygous mutant cells have been targeted for mosaic analysis by placing a repressible cell marker (MARCM) in trans to a mutant gene of interest using FLP/FRT-mediated mitotic recombination (Lee and Luo, 1999). In mice, the Cre/loxP system has been applied to develop a method for mosaic analysis with double markers (MADM) for simultaneous labeling and mutation of neurons (Zong et al., 2005). These genetic methods are efficient in labeling small populations of neurons and even single cells in small or inaccessible embryos when blastomere injection is not an option.
Ca2+ spike frequency homeostatically regulates respecification of transmitters in the spinal cord during a brief critical period (Borodinsky et al., 2004; Root et al., 2008). The number of neurons in which transmitter switching occurs is modest, both because the number of primary neurons is small (Hartenstein, 1993) and because some neurons do not demonstrate transmitter respecification (Borodinsky et al., 2004; Dulcis & Spitzer, 2008; Dulcis et al., 2013). We determined whether the effect on transmitter switching induced by Ca2+ spike activity occurs via a cell-autonomous mechanism by targeting single neurons efficiently with foreign gene (hKir2.1) expression in Xenopus at early developmental stages. Injection of this DNA into specific blastomeres of 16-cell-stage embryos drives its expression in a mosaic pattern in spinal neurons and suppresses spike activity in these neurons. Suppression of Ca2+ spikes in single neurons did not result in an increase in incidence of glutamate expression or a decrease in the incidence of GABA expression, providing evidence for non-cell-autonomous regulation. The absence of transmitter switching is unlikely to be due to delay of the normal process, because it was assayed well beyond the end of the critical period, when neurotransmitter in each subtype of neuron has been determined (Root et al., 2008). Cholinergic motorneurons demonstrate coactivity across the spinal cord at these early stages, enabling motorneurons on a silenced half of the spinal cord to receive excitation from motorneurons on an unsilenced half of the spinal cord, consistent with the observation that only bilateral and not unilateral silencing of activity is sufficient to switch the cholinergic phenotype (Borodinsky et al., 2004). However synchronized activity does not appear to be a general feature of these differentiating neurons. In contrast, glutamatergic and GABAergic neurons, which lack comparable synaptic excitation at this stage of development, exhibit transmitter switching in a silenced half of the spinal cord (Borodinsky et al., 2004).
Consistent with this result, progressive increase in the percent of silenced neurons in culture leads to a progressive decrease in the percent of neurons expressing GABA, equally in active and in silenced neurons. Thus the transmitter switches observed following global spike suppression in the entire spinal cord result from a non-cell-autonomous process. A key determinant appears to be the activity of surrounding neurons, rather than the activity level of the target neuron itself.
Role of BDNF in balancing neurotransmitter specification
BDNF appears to be a differentiation factor for most neurons (Park and Poo, 2013). It stimulates formation and maturation of inhibitory GABAergic neurons and synapses (Ohba et al., 2005) and suppresses excitatory synaptic transmission (Yang et al., 2002). Adult glutamatergic hippocampal granule cells in culture co-express a GABAergic phenotype when incubated in the presence of BDNF (Gomez-Lira et al., 2005). BDNF increases the number and density of GABAergic synapses in solitary neurons cultured from rat visual cortex (Palizvan et al., 2004) and in hippocampal neurons in vivo (Shinoda et al., 2011). Exogenous BDNF prevents the enhancement of synaptic strengths normally induced by chronic blockage of activity in cortical cultures. Further, preventing activation of endogenous BDNF receptors mimics the effects of activity blockade and increases synaptic strengths (Rutherford et al., 1998).
Our results indicate that BDNF is released from neurons in a Ca2+ spike activity-dependent manner and that BDNF regulates activity-dependent transmitter respecification. GFAP immunoreactivity is detected in radial cells in the neural tube as early as stage 24 (Szaro and Gainer, 1988) and GFAP-positive cells can express BDNF (Dreyfus et al., 1999; Abe et al., 2010); further studies will be needed to determine whether glia release BDNF in an activity-dependent or independent manner. An activity-independent BDNF source may be responsible for the release of BDNF observed after activity suppression. Activity-dependent release of BDNF increased the number of GABAergic neurons in the spinal cord in agreement with demonstration that BDNF scales up inhibitory neuronal networks; it decreased the number of glutamatergic neurons consistent with scaling down excitatory neuronal networks.
BDNF signaling in Ca2+ activity-dependent neurotransmitter switching
BDNF appears to regulate transmitter respecification via TrkB receptors, because the effects of a BDNF MO and K252a on the incidence of glutamatergic and GABAergic neurons were indistinguishable. The sparse expression of TrkB receptors, on a subset of cells, is consistent with transmitter switching in a subset of neurons. Interestingly, the neurons expressing TrkB receptors are the same neurons presenting the activated cJun pathway. They are distributed throughout the spinal cord and do not appear to constitute a previously identified class of neurons. BDNF could stimulate PLCγ, PI3K and MAPK signaling pathways via activation of TrkB receptors (Huang and Reichardt, 2003). However, we found that the MAPK pathway but not the PI3K or the PLC-γ pathways regulated the phosphorylation of cJun by BDNF via MEK and JNK. BDNF preferentially activates MEK but may also activate JNK (Chao, 2003) and there is crosstalk between these two signaling pathways (Dong and Bode, 2003). JNK regulates cJun activity via direct phosphorylation of S63/S73 and T91/T93 (Raivich, 2008) and MEK can also phosphorylate cJun S63/S73 via ERK 1/2 (Morton et al., 2003). Both MEK and JNK signaling had a role in cJun phosphorylation; whether they act in series or in parallel pathways remains to be determined. BDNF caused an increase in JNK phosphorylation that was correlated with an increase in cJun activation, since both the JNK MO and BDNF MO decreased cJun phosphorylation similarly. The number of P-cJun-IR neurons is small at each time point but it is likely that the total number is larger. Since the data are snapshots in time they do not reveal the total number of neurons showing P-cJun during the period of Ca2+ spiking. Phospho-cJun acts as a Ca2+ spike-dependent repressor of the homeobox gene tlx3 that functions as a switch specifying the glutamatergic over GABAergic phenotype in Xenopus (Marek et al., 2010). Consistent with this action, the percentage of neurons expressing phospho-cJun is similar to the percentage of GABAergic neurons both in the absence or presence of BDNF, suggesting that they are linked. Direct double staining of phospho-cJun and GABA or glutamate is not possible because the former has disappeared by the time the latter appear. The JNK MO mimicked the effect of the BDNF MO on the numbers of phospho-cJun-, GABA- and glutamate-IR neurons, suggesting that JNK signaling pathway activation is sufficient to phosphorylate cJun and lead to BDNF-induced transmitter switching. Determination of the molecular cascade by which activity drives transmitter respecification is essential for development of the tools with which to gain control over transmitter changes.
Model for non-cell-autonomous regulation of transmitter switching
Neuronal activity plays an important role in regulating many properties of neurons, including neuronal migration and synaptic plasticity, either cell-autonomously (Burrone et al., 2002; Tong et al., 2009) or non-cell-autonomously (Hartman et al., 2006; Wright and Ribera, 2010). We propose a model for non-cell-autonomous Ca2+ spike activity-mediated homeostatic transmitter respecification in Xenopus spinal neurons during early stages of development (Figure 8). Transmitter identity is initially specified genetically and then modulated by environmental influences through changes in spontaneous Ca2+-dependent activity. Ca2+ spikes regulate the release of BDNF that initiates the TrkB/MAPK signaling cascade. This cascade involves JNK-mediated phosphorylation of cJun that regulates tlx3 transcription through a CRE site in its promoter (Marek et al., 2010). Parallel pathways may be involved to ensure that the correct transmitter phenotype is established and maintained throughout development. The integration of activity and genetic programs provides a better understanding of transmitter switching and may also provide insights into the pathogenesis of neurological disorders, such as depression, to which environmental stimuli contribute and in which transmitter expression is altered.
Figure 8. Model of non-cell-autonomous regulation of transmitter expression.
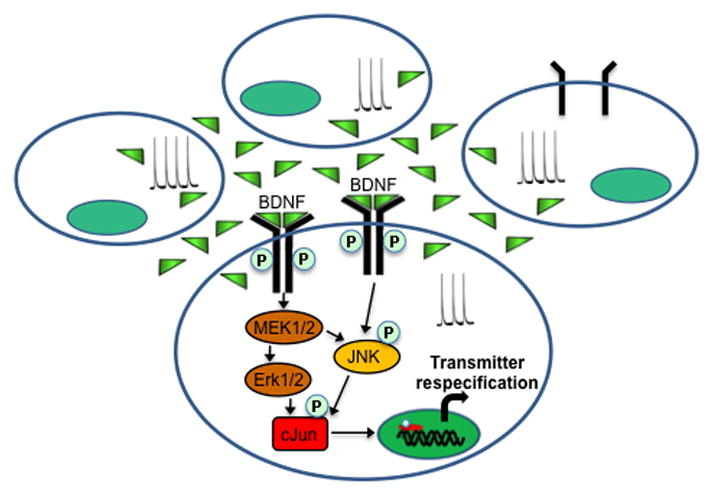
Transmitter identity is initially specified genetically and then modulated by environmental influences through changes in spontaneous Ca2+-dependent activity. Ca2+ spikes regulate the release of BDNF that initiates the TrkB/MAPK signaling cascade. JNK-mediated phosphorylation of cJun regulates transcription to select neurotransmitter fate.
EXPERIMENTAL PROCEDURES
Detailed experimental procedures are provided in the Supplemental Information. All animal procedures were performed in accordance with institutional guidelines and approved by the UCSD Institutional Animal Care and Use Committee.
Blastomere Injection
DNA injection (1 nl of 0.2 mg/ml hKir2.1-mCherry-pcDNA3.1 or mCherry-pcDNA3.1) was performed at the 16-cell stage in specific blastomeres identified according to Moody (1989). RNA injection (5–10 nl of 0.01–0.1 mg/ml hKir2.1 or BDNF-pHluorin with 10,000 MW 20 mg/ml Cascade Blue dextran) was performed at either the 2- or 16- cell stage. Injections were accomplished using a picospritzer (Picospritzer III, Parker Instrumentations, Cleveland, OH).
Calcium Imaging
Stage 23–25 embryos were dissected as previously described (Gu et al., 1994). Briefly, neural tubes were pinned to expose the ventral surface and loaded for 45 min with 5 μM of the Fluo-4 AM Ca2+ indicator (Invitrogen, Carlsbad, CA) and 0.01% Pluronic F-127 detergent (Invitrogen, Carlsbad, CA) in 2 mM Ca2+ saline. Images were acquired at 0.2 Hz for 1 hr periods with a Leica SP5 confocal system and Ca2+ transients were scored as spikes when the rise time was complete within 5 sec and the amplitude exceeded 20% of ΔF/F0, more than twice the standard deviation of the baseline during the previous 10 min. 7–10 embryos were imaged for each experiment. All hKir2.1-mCherry- or mCherry-expressing single neurons from these embryos were analyzed. Neurons not expressing hKir2.1-mCherry or mCherry in the same embryos were internal controls. The incidence of spiking neurons from each experimental group was calculated by dividing the number of neurons that spiked at least once during the 1 hr imaging period by the total number of neurons analyzed in that group.
Immunocytochemistry
Immunocytochemistry was performed as previously described (Borodinsky et. Al., 2004; Marek et al., 2010). Further information is provided in the Supplemental Experimental Procedures.
Cell Culture
Neuron-enriched cultures were prepared from the posterior neural plate of stage 15 Xenopus laevis embryos as previously described (Gu et al., 1994). Details can de found in Supplemental Experimental Procedures.
Graded expression of activity
Embryos were injected with 600 pg/pl hKir2.1-mCherry mRNA at the one or two cell stage and neuron-enriched cultures were prepared at stage 15 with 0, 25, 50, 75 or 100% silenced neurons. Graded silencing was achieved by mixing cells from neural plates of embryos expressing hKir2.1 differentially. For example, 75% silencing was achieved by plating half of a neural plate from an embryo expressing hKir2.1 unilaterally with half of a neural plate from an embryo expressing hKir2.1 bilaterally. For the rescue experiment, recombinant BDNF (100 ng/ml, Chemicon Millipore) was added to cultures with 100% silenced neurons. Cultures were fixed with 4% PFA with 0.1% glutaraldehyde at 1 d in vitro and immunostained for GABA. Cultures with more than 35 neurons post-staining were selected and the percents of neurons singly and doubly labeled for GABA-IR and hKir2.1-mCherry were scored.
Whole Mount In Situ Hybridization
Whole mount in situ hybridization was performed (Harland, 1991) using antisense and sense probes generated from pX112-13 containing a partial Xenopus BDNF cDNA (a generous gift from Dr. Susana Cohen-Cory, UC Irvine). Details are provided in the Supplemental Experimental Procedures.
Time-lapse Imaging of BDNF-pHluorin
Ca2+ spike-dependent BDNF release was assayed in cultures prepared from embryos injected with BDNF-phluorin mRNA at the 16-cell stage and grown in 0 mM Ca2+ medium for 9–12 hr. Cultures were mounted in a custom-made chamber, perfused with salines containing 100 mM KCl in the absence or presence of 2 mM Ca2+ for 30 s to mimic Ca2+ spikes as previously described (Gu & Spitzer, 1995), and imaged on a Leica SP5 confocal microscope with 63x water-immersion objective. Time-lapse images were acquired at 1.29 s intervals. Cell body fluorescence intensity of BDNF-pHluorin expressing neurons was quantified using ImageJ and normalized by non-neuronal cells in the same fields.
BDNF Immunoassay
BDNF released under different conditions was measured with a conventional two-site ELISA system according to the manufacturer’s protocol (Promega, Madison, WI).
Morpholino Electroporation
Local electroporation was performed on stage 15/16 embryos, ~18 hr post fertilization, using a protocol based on the method developed by Sasagawa et al. (2002). Embryos were placed on an agarose bed over a circular platinum anode (20 mm in diameter; NEPA GENE Co., Ltd., Chiba, Japan) in a 1x MMR solution to decrease the resistance between the 2 electrodes. We targeted the region of interest identified by a map of presumptive spinal cord region of the neural tube of stage 15 embryos (Eagleson and Harris, 1990) with the BDNF MO, JNK MO or a control MO. Morpholino solutions (5 nl of 0.25 μg/μl) were injected into the presumptive spinal cord region of the closing neural tube. A platinum wire cathode (0.5 mm diameter; Sigma, St. Louis, MO) was placed over the region of interest immediately after injection and a Grass stimulator was used to deliver 6 square pulses of 5 msec, 40 volts, at 500 msec intervals. Electroporated embryos were transferred to 10% MMR and kept at 18°C to slow development, promote healing and allow a longer period of action. Non-electroporated embryos grown in the same conditions served as controls. Larvae with lissamine fluorescence extending over a region of 400 μm encompassing the anterior spinal cord were analyzed at stage 41, approximately 5 d after electroporation.
Pharmacology
Agarose beads (100–200 mesh, Bio-Rad, Hercules, CA) were loaded overnight with drugs (50 μM K252a, K252b; 100 ng/μl BDNF) or DMSO/H2O (control) and inserted between the neural tube and myotomes at 20 hr of development (stage 18) (Borodinsky et al., 2004; Root et al., 2008). Sections of embryos with beads located adjacent to the first 100 μm of the spinal cord were collected 2 d later (stage 41). Changes in both GABA and glutamate expression in spinal neurons were significant along all 400 μm of the rostral spinal cord in K252a bead-implanted embryos, consistent with the small size of K252a (0.4 kD) enabling diffusion. Changes in both GABA and glutamate expression were significant only over the first 100 μm away from the BDNF-loaded bead, consistent with limited diffusion of recombinant BDNF (27 kD). Stock concentrations of kinase inhibitors SP600125, SB235699, U0126, KN-93, GF 109203x, LY294002 and U73122 (Tocris Bioscience, Minneapolis, MN) were 10 mM in DMSO and were added to the culture medium as indicated. Stock concentrations of drugs were 1 mM K252a (Sigma-Aldrich, St. Louis, MO) and 1 mM K252b (Sigma-Aldrich, St. Louis, MO) in DMSO, and 1 mg/ml recombinant BDNF (Millipore, Billerica, MA) in distilled water.
Statistics
Means and SEMs were calculated using Microsoft Excel. Statistical analyses were performed using STATA. For comparison between more than two groups, the ANOVA test was used and followed by Bonferroni post-hoc test. For comparison between two groups, the Mann–Whitney U test was used. Values are considered different when p is < 0.05.
Supplementary Material
Figure S1, related to Figure 1. Injection of hKir-mCherry DNA into the D1.1 blastomere at the 16-cell stage labels single neurons in stage 41 embryos and suppresses Ca2+ spike frequency in single neurons during one hour imaging period.
(A) Diagram illustrating the injection.
(B) Arrowheads identify some of the labeled spinal neurons in a stage 41 embryo.
(C) Distribution of neurons targeted on ventral and dorsal sides of the spinal cord.
(D) Each symbol is the spike frequency for a single neuron. Stages 23–25. Kir-mCh cells, hKir2.1-mCherry-expressing neurons; mCh cells, mCherry alone-expressing neurons. Control, neurons expressing neither construct. n≥7 embryos per group. ***, p<0.001. Mann-Whitney U test.
Figure S2, related to Figure 3. TrkB receptors are expressed during the critical period for neurotransmitter specification.
TrkB staining of the neural tube at stage 24 and 28 shows sparse labeling of neurons. n≥3 embryos.
Figure S3, related to Figure 4. BDNF regulates neurotransmitter phenotype via Trk receptors.
(A–C) Glutamate and GABA staining following implantation of beads containing BDNF, K252a and K252b, a membrane impermeable analog of K252a. Striped columns, controls. Solid columns, beads with 100 ng/ml BDNF or 50 mM K252a/K252b. Colors indicate distance from the beginning of the spinal cord. Beads were located adjacent to the most rostral 100 μm of the spinal cord. n≥5 embryos per condition. Data are mean±SEM. *, p<0.05; **, p< 0.01. Mann-Whitney U test.
Figure S4, related to Figure 5. Signaling pathway regulating activity-dependent cJun phosphorylation.
(A) Neuronal cultures were prepared from stage 15 embryos and plated in dishes containing 0 mM or 2 mM Ca2+ medium. Cells were maintained for 9 hr in the presence or absence of 10 mM of different kinase inhibitors as indicated and protein levels were determined by Western blot.
(B) Bars represent the ratio between the phosphorylated proteins and total protein expressed in optical density units (O.D.U). n≥5 cultures per condition. Data are mean±SEM. *, p<0.05. Mann-Whitney U test. Full-length Western blot is shown in Figure S5.
Figure S5. Full-length Western blots for Figures 5 and 6 and Figure S4
Samples were loaded on a 12% gel and immunoblotted with the indicated antibodies. Dashed lines indicate the bands presented in the other figures.
Highlights.
Suppressing Ca2+ spikes in single neurons does not cause transmitter switching
Ca2+ spikes stimulate release of BDNF
BDNF drives JNK-dependent phosphorylation of cJun that regulates tlx3 expression
BDNF regulates glutamate/GABA switching
Acknowledgments
We thank Armando de la Torre for technical assistance and Dr. Darcy Kelley for facilities and support. We are grateful to Drs. Darwin Berg, Andrew Huberman and Yimin Zou for insightful comments on an earlier draft of the manuscript. This work was supported by NIH NS15918 and NS57690.
Footnotes
The Supplemental Information including Supplemental Data, Supplemental Experimental Procedures and Supplemental References can be found online.
AUTHOR CONTRIBUTIONS
LX, AG, DM and NCS designed the experiments, LX, AG and DM performed the experiments and analysis, and LX, AG, DM and NCS wrote and edited the manuscript.
COMPETING FINANCIAL INTERESTS
The authors declare no competing financial interests
Publisher's Disclaimer: This is a PDF file of an unedited manuscript that has been accepted for publication. As a service to our customers we are providing this early version of the manuscript. The manuscript will undergo copyediting, typesetting, and review of the resulting proof before it is published in its final citable form. Please note that during the production process errors may be discovered which could affect the content, and all legal disclaimers that apply to the journal pertain.
References
- Abe M, Kimoto H, Eto R, Sasaki T, Kato H, Kasahara J, Araki T. Postnatal development of neurons, interneurons and glial cells in the substantia nigra of mice. Cell Mol Neurobiol. 2010;30:917–928. doi: 10.1007/s10571-010-9521-0. [DOI] [PMC free article] [PubMed] [Google Scholar]
- Balkowiec A, Katz DM. Cellular mechanisms regulating activity-dependent release of native brain-derived neurotrophic factor from hippocampal neurons. J Neurosci. 2002;22:10399–10407. doi: 10.1523/JNEUROSCI.22-23-10399.2002. [DOI] [PMC free article] [PubMed] [Google Scholar]
- Belgacem YH, Borodinsky LN. Sonic hedgehog signaling is decoded by calcium spike activity in the developing spinal cord. Proc Natl Acad Sci U S A. 2011;108:4482–4487. doi: 10.1073/pnas.1018217108. [DOI] [PMC free article] [PubMed] [Google Scholar]
- Borodinsky LN, Root CM, Cronin JA, Sann SB, Gu X, Spitzer NC. Activity-dependent homeostatic specification of transmitter expression in embryonic neurons. Nature. 2004;429:523–530. doi: 10.1038/nature02518. [DOI] [PubMed] [Google Scholar]
- Burrone J, O’Byrne M, Murthy VN. Multiple forms of synaptic plasticity triggered by selective suppression of activity in individual neurons. Nature. 2002;420:414–418. doi: 10.1038/nature01242. [DOI] [PubMed] [Google Scholar]
- Chang LW, Spitzer NC. Spontaneous calcium spike activity in embryonic spinal neurons is regulated by developmental expression of the Na+, K+-ATPase beta3 subunit. J Neurosci. 2009;29:7877–7885. doi: 10.1523/JNEUROSCI.4264-08.2009. [DOI] [PMC free article] [PubMed] [Google Scholar]
- Chao MV. Neurotrophins and their receptors: a convergence point for many signalling pathways. Nat Rev Neurosci. 2003;4:299–309. doi: 10.1038/nrn1078. [DOI] [PubMed] [Google Scholar]
- Cheng L, Arata A, Mizuguchi R, Qian Y, Karunaratne A, Gray PA, Arata S, Shirasawa S, Bouchard M, Luo P, et al. Tlx3 and Tlx1 are post-mitotic selector genes determining glutamatergic over GABAergic cell fates. Nat Neurosci. 2004;7:510–517. doi: 10.1038/nn1221. [DOI] [PubMed] [Google Scholar]
- Demarque M, Spitzer NC. Activity-dependent expression of Lmx1b regulates specification of serotonergic neurons modulating swimming behavior. Neuron. 2010;67:321–334. doi: 10.1016/j.neuron.2010.06.006. [DOI] [PMC free article] [PubMed] [Google Scholar]
- Dong Z, Bode AM. Dialogue between ERKs and JNKs: friendly or antagonistic? Mol Interv. 2003;3:306–308. doi: 10.1124/mi.3.6.306. [DOI] [PubMed] [Google Scholar]
- Dreyfus CF, Dai X, Lercher LD, Racey BR, Friedman WJ, Black IB. Expression of neurotrophins in the adult spinal cord in vivo. J Neurosci Res. 1999;56:1–7. doi: 10.1002/(SICI)1097-4547(19990401)56:1<1::AID-JNR1>3.0.CO;2-3. [DOI] [PubMed] [Google Scholar]
- Dulcis D, Jamshidi P, Leutgeb S, Spitzer NC. Neurotransmitter switching in the adult brain regulates behavior. Science. 2013;340:449–453. doi: 10.1126/science.1234152. [DOI] [PubMed] [Google Scholar]
- Dulcis D, Spitzer NC. llumination controls differentiation of dopamine neurons regulating behaviour. Nature. 2008;456:195–201. doi: 10.1038/nature07569. [DOI] [PMC free article] [PubMed] [Google Scholar]
- Eagleson GW, Harris WA. Mapping of the presumptive brain regions in the neural plate of Xenopus laevis. J Neurobiol. 1990;21:427–440. doi: 10.1002/neu.480210305. [DOI] [PubMed] [Google Scholar]
- Furshpan EJ, MacLeish PR, O’Lague PH, Potter DD. Chemical transmission between rat sympathetic neurons and cardiac myocytes developing in microcultures: evidence for cholinergic, adrenergic, and dual function neurons. Proc Natl Acad Sci U S A. 1976;73:4225–4229. doi: 10.1073/pnas.73.11.4225. [DOI] [PMC free article] [PubMed] [Google Scholar]
- Gartner A, Staiger V. Neurotrophin secretion from hippocampal neurons evoked by long-term-potentiation-inducing electrical stimulation patterns. Proc Natl Acad Sci U S A. 2002;99:6386–6391. doi: 10.1073/pnas.092129699. [DOI] [PMC free article] [PubMed] [Google Scholar]
- Gomez-Lira G, Lamas M, Romo-Parra H, Gutierrez R. Programmed and induced phenotype of the hippocampal granule cells. J Neurosci. 2005;25:6939–6946. doi: 10.1523/JNEUROSCI.1674-05.2005. [DOI] [PMC free article] [PubMed] [Google Scholar]
- Gu X, Olson EC, Spitzer NC. Spontaneous neuronal calcium spikes and waves during early differentiation. J Neurosci. 1994;14:6325–6335. doi: 10.1523/JNEUROSCI.14-11-06325.1994. [DOI] [PMC free article] [PubMed] [Google Scholar]
- Gu X, Spitzer NC. Distinct aspects of neuronal differentiation encoded by frequency of spontaneous Ca2+ transients. Nature. 1995;375:784–787. doi: 10.1038/375784a0. [DOI] [PubMed] [Google Scholar]
- Gutiérrez R. Activity-dependent expression of simultaneous glutamatergic and GABAergic neurotransmission from the mossy fibres in vitro. J Neurophysiol. 2002;87:2562–2570. doi: 10.1152/jn.2002.87.5.2562. [DOI] [PubMed] [Google Scholar]
- Harland RM. In situ hybridization: an improved whole-mount method for Xenopus embryos. Methods Cell Biol. 1991;36:685–695. doi: 10.1016/s0091-679x(08)60307-6. [DOI] [PubMed] [Google Scholar]
- Hartenstein V. Early pattern of neuronal differentiation in the embryonic brainstem and spinal cord. J Comp Neurol. 1993;328:213–231. doi: 10.1002/cne.903280205. [DOI] [PubMed] [Google Scholar]
- Hartman KN, Pal SK, Burrone J, Murthy VN. Activity-dependent regulation of inhibitory synaptic transmission in hippocampal neurons. Nat Neurosci. 2006;9:642–649. doi: 10.1038/nn1677. [DOI] [PubMed] [Google Scholar]
- Hong EJ, McCord AE, Greenberg ME. A biological function for the neuronal activity-dependent component of BDNF transcription in the development of cortical inhibition. Neuron. 2008;60:610–624. doi: 10.1016/j.neuron.2008.09.024. [DOI] [PMC free article] [PubMed] [Google Scholar]
- Huang EJ, Reichardt LF. Trk receptors: roles in neuronal signal transduction. Annu Rev Biochem. 2003;72:609–642. doi: 10.1146/annurev.biochem.72.121801.161629. [DOI] [PubMed] [Google Scholar]
- Huang JK, Dorey K, Ishibashi S, Amaya E. BDNF promotes target innervation of Xenopus mandibular trigeminal axons in vivo. BMC Dev Biol. 2007;7:59. doi: 10.1186/1471-213X-7-59. [DOI] [PMC free article] [PubMed] [Google Scholar]
- Kroll KL, Amaya E. Transgenic Xenopus embryos from sperm nuclear transplantations reveal FGF signaling requirements during gastrulation. Development. 1996;122:3173–3183. doi: 10.1242/dev.122.10.3173. [DOI] [PubMed] [Google Scholar]
- Landis SC. Rat sympathetic neurons and cardiac myocytes developing in microcultures: correlation of the fine structure of endings with neurotransmitter function in single neurons. Proc Natl Acad Sci U S A. 1976;73:4220–4224. doi: 10.1073/pnas.73.11.4220. [DOI] [PMC free article] [PubMed] [Google Scholar]
- Lee T, Luo L. Mosaic analysis with a repressible cell marker for studies of gene function in neuronal morphogenesis. Neuron. 1999;22:451–461. doi: 10.1016/s0896-6273(00)80701-1. [DOI] [PubMed] [Google Scholar]
- Li WC, Soffe SR, Roberts A. Glutamate and acetylcholine corelease at developing synapses. Proc Natl Acad Sci U S A. 2004;101:15488–15493. doi: 10.1073/pnas.0404864101. [DOI] [PMC free article] [PubMed] [Google Scholar]
- Marek KW, Kurtz LM, Spitzer NC. cJun integrates calcium activity and tlx3 expression to regulate neurotransmitter specification. Nat Neurosci. 2010;13:944–950. doi: 10.1038/nn.2582. [DOI] [PMC free article] [PubMed] [Google Scholar]
- Matsuda N, Lu H, Fukata Y, Noritake J, Gao H, Mukherjee S, Nemoto T, Fukata M, Poo MM. Differential activity-dependent secretion of brain-derived neurotrophic factor from axon and dendrite. J Neurosci. 2009;29:14185–14198. doi: 10.1523/JNEUROSCI.1863-09.2009. [DOI] [PMC free article] [PubMed] [Google Scholar]
- Mizuguchi R, Kriks S, Cordes R, Gossler A, Ma Q, Goulding M. Ascl1 and Gsh1/2 control inhibitory and excitatory cell fate in spinal sensory interneurons. Nat Neurosci. 2006;9:770–778. doi: 10.1038/nn1706. [DOI] [PubMed] [Google Scholar]
- Mizuno H, Hirano T, Tagawa Y. Evidence for activity-dependent cortical wiring: formation of interhemispheric connections in neonatal mouse visual cortex requires projection neuron activity. J Neurosci. 2007;27:6760–6770. doi: 10.1523/JNEUROSCI.1215-07.2007. [DOI] [PMC free article] [PubMed] [Google Scholar]
- Moody SA. Quantitative lineage analysis of the origin of frog primary motor and sensory neurons from cleavage stage blastomeres. J Neurosci. 1989;9:2919–2930. doi: 10.1523/JNEUROSCI.09-08-02919.1989. [DOI] [PMC free article] [PubMed] [Google Scholar]
- Morton S, Davis RJ, McLaren A, Cohen P. A reinvestigation of the multisite phosphorylation of the transcription factor c-Jun. EMBO J. 2003;22:3876–3886. doi: 10.1093/emboj/cdg388. [DOI] [PMC free article] [PubMed] [Google Scholar]
- Ohba S, Ikeda T, Ikegaya Y, Nishiyama N, Matsuki N, Yamada MK. BDNF locally potentiates GABAergic presynaptic machineries: target-selective circuit inhibition. Cereb Cortex. 2005;15:291–298. doi: 10.1093/cercor/bhh130. [DOI] [PubMed] [Google Scholar]
- Park H, Poo MM. Neurotrophin regulation of neural circuit development and function. Nat Rev Neurosci. 2013;14:7–23. doi: 10.1038/nrn3379. [DOI] [PubMed] [Google Scholar]
- Palizvan MR, Sohya K, Kohara K, Maruyama A, Yasuda H, Kimura F, Tsumoto T. Brain-derived neurotrophic factor increases inhibitory synapses, revealed in solitary neurons cultured from rat visual cortex. Neuroscience. 2004;126:955–966. doi: 10.1016/j.neuroscience.2004.03.053. [DOI] [PubMed] [Google Scholar]
- Pillai A, Mansouri A, Behringer R, Westphal H, Goulding M. Lhx1 and Lhx5 maintain the inhibitory-neurotransmitter status of interneurons in the dorsal spinal cord. Development. 2007;134:357–366. doi: 10.1242/dev.02717. [DOI] [PubMed] [Google Scholar]
- Raivich G. c-Jun expression, activation and function in neural cell death, inflammation and repair. J Neurochem. 2008;107:898–906. doi: 10.1111/j.1471-4159.2008.05684.x. [DOI] [PubMed] [Google Scholar]
- Roberts A, Dale N, Ottersen OP, Storm-Mathisen J. The early development of neurons with GABA immunoreactivity in the CNS of Xenopus laevis embryos. J Comp Neurol. 1987;261:435–449. doi: 10.1002/cne.902610308. [DOI] [PubMed] [Google Scholar]
- Root CM, Velazquez-Ulloa NA, Monsalve GC, Minakova E, Spitzer NC. Embryonically expressed GABA and glutamate drive electrical activity regulating neurotransmitter specification. J Neurosci. 2008;28:4777–4784. doi: 10.1523/JNEUROSCI.4873-07.2008. [DOI] [PMC free article] [PubMed] [Google Scholar]
- Rutherford LC, Nelson SB, Turrigiano GG. BDNF has opposite effects on the quantal amplitude of pyramidal neuron and interneuron excitatory synapses. Neuron. 1998;21:521–530. doi: 10.1016/s0896-6273(00)80563-2. [DOI] [PubMed] [Google Scholar]
- Sasagawa S, Takabatake T, Takabatake Y, Muramatsu T, Takeshima K. Improved mRNA electroporation method for Xenopus neurula embryos. Genesis. 2002;33:81–85. doi: 10.1002/gene.10094. [DOI] [PubMed] [Google Scholar]
- Schotzinger R, Landis SC. Cholinergic phenotype developed by noradrenergic sympathetic neurons after innervation of a novel cholinergic target in vivo. Nature. 1988;335:637–639. doi: 10.1038/335637a0. [DOI] [PubMed] [Google Scholar]
- Shinoda Y, Sadakata T, Nakao K, Katoh-Semba R, Kinameri E, Furuya A, Yanagawa Y, Hirase H, Furuichi T. Calcium-dependent activator protein for secretion 2 (CAPS2) promotes BDNF secretion and is critical for the development of GABAergic interneuron network. Proc Natl Acad Sci U S A. 2011;108:373–378. doi: 10.1073/pnas.1012220108. [DOI] [PMC free article] [PubMed] [Google Scholar]
- Sillar KT, Roberts A. Unmyelinated cutaneous afferent neurons activate two types of excitatory amino acid receptor in the spinal cord of Xenopus laevis embryos. J Neurosci. 1988;8:1350–1360. doi: 10.1523/JNEUROSCI.08-04-01350.1988. [DOI] [PMC free article] [PubMed] [Google Scholar]
- Spitzer NC. Electrical activity in early neuronal development. Nature. 2006;444:707–712. doi: 10.1038/nature05300. [DOI] [PubMed] [Google Scholar]
- Spitzer NC. Activity-dependent neurotransmitter respecification. Nat Rev Neurosci. 2012;13:94–106. doi: 10.1038/nrn3154. [DOI] [PMC free article] [PubMed] [Google Scholar]
- Szaro BG, Gainer H. Immunocytochemical identification of non-neuronal intermediate filament proteins in the developing Xenopus laevis nervous system. Brain Res. 1988;471:207–224. doi: 10.1016/0165-3806(88)90100-9. [DOI] [PubMed] [Google Scholar]
- Tabuchi A, Nakaoka R, Amano K, Yukimine M, Andoh T, Kuraishi Y, Tsuda M. Differential activation of brain-derived neurotrophic factor gene promoters I and III by Ca2+ signals evoked via L-type voltage-dependent and N-methyl-D-aspartate receptor Ca2+ channels. J Biol Chem. 2000;275:17269–17275. doi: 10.1074/jbc.M909538199. [DOI] [PubMed] [Google Scholar]
- Tong XP, Li XY, Zhou B, Shen W, Zhang ZJ, Xu TL, Duan S. Ca2+ signaling evoked by activation of Na+ channels and Na+/Ca2+ exchangers is required for GABA-induced NG2 cell migration. J Cell Biol. 2009;186:113–128. doi: 10.1083/jcb.200811071. [DOI] [PMC free article] [PubMed] [Google Scholar]
- Tonge PD, Andrews PW. Retinoic acid directs neuronal differentiation of human pluripotent stem cell lines in a non-cell-autonomous manner. Differentiation. 2010;80:20–30. doi: 10.1016/j.diff.2010.04.001. [DOI] [PubMed] [Google Scholar]
- Vicario-Abejon C, Owens D, McKay R, Segal M. Role of neurotrophins in central synapse formation and stabilization. Nat Rev Neurosci. 2002;3:965–974. doi: 10.1038/nrn988. [DOI] [PubMed] [Google Scholar]
- Walicke PA, Campenot RB, Patterson PH. Determination of transmitter function by neuronal activity. Proc Natl Acad Sci U S A. 1977;74:5767–5771. doi: 10.1073/pnas.74.12.5767. [DOI] [PMC free article] [PubMed] [Google Scholar]
- Wright MA, Ribera AB. Brain-derived neurotrophic factor mediates non-cell-autonomous regulation of sensory neuron position and identity. J Neurosci. 2010;30:14513–14521. doi: 10.1523/JNEUROSCI.4025-10.2010. [DOI] [PMC free article] [PubMed] [Google Scholar]
- Yamanaka H, Moriguchi T, Masuyama N, Kusakabe M, Hanafusa H, Takada R, Takada S, Nishida E. JNK functions in the non-canonical Wnt pathway to regulate convergent extension movements in vertebrates. EMBO Rep. 2002;3:69–75. doi: 10.1093/embo-reports/kvf008. [DOI] [PMC free article] [PubMed] [Google Scholar]
- Yang B, Slonimsky JD, Birren SJ. A rapid switch in sympathetic neurotransmitter release properties mediated by the p75 receptor. Nat Neurosci. 2002;5:539–545. doi: 10.1038/nn0602-853. [DOI] [PubMed] [Google Scholar]
- Zong H, Espinosa JS, Su HH, Muzumdar MD, Luo L. Mosaic analysis with double markers in mice. Cell. 2005;121:479–492. doi: 10.1016/j.cell.2005.02.012. [DOI] [PubMed] [Google Scholar]
Associated Data
This section collects any data citations, data availability statements, or supplementary materials included in this article.
Supplementary Materials
Figure S1, related to Figure 1. Injection of hKir-mCherry DNA into the D1.1 blastomere at the 16-cell stage labels single neurons in stage 41 embryos and suppresses Ca2+ spike frequency in single neurons during one hour imaging period.
(A) Diagram illustrating the injection.
(B) Arrowheads identify some of the labeled spinal neurons in a stage 41 embryo.
(C) Distribution of neurons targeted on ventral and dorsal sides of the spinal cord.
(D) Each symbol is the spike frequency for a single neuron. Stages 23–25. Kir-mCh cells, hKir2.1-mCherry-expressing neurons; mCh cells, mCherry alone-expressing neurons. Control, neurons expressing neither construct. n≥7 embryos per group. ***, p<0.001. Mann-Whitney U test.
Figure S2, related to Figure 3. TrkB receptors are expressed during the critical period for neurotransmitter specification.
TrkB staining of the neural tube at stage 24 and 28 shows sparse labeling of neurons. n≥3 embryos.
Figure S3, related to Figure 4. BDNF regulates neurotransmitter phenotype via Trk receptors.
(A–C) Glutamate and GABA staining following implantation of beads containing BDNF, K252a and K252b, a membrane impermeable analog of K252a. Striped columns, controls. Solid columns, beads with 100 ng/ml BDNF or 50 mM K252a/K252b. Colors indicate distance from the beginning of the spinal cord. Beads were located adjacent to the most rostral 100 μm of the spinal cord. n≥5 embryos per condition. Data are mean±SEM. *, p<0.05; **, p< 0.01. Mann-Whitney U test.
Figure S4, related to Figure 5. Signaling pathway regulating activity-dependent cJun phosphorylation.
(A) Neuronal cultures were prepared from stage 15 embryos and plated in dishes containing 0 mM or 2 mM Ca2+ medium. Cells were maintained for 9 hr in the presence or absence of 10 mM of different kinase inhibitors as indicated and protein levels were determined by Western blot.
(B) Bars represent the ratio between the phosphorylated proteins and total protein expressed in optical density units (O.D.U). n≥5 cultures per condition. Data are mean±SEM. *, p<0.05. Mann-Whitney U test. Full-length Western blot is shown in Figure S5.
Figure S5. Full-length Western blots for Figures 5 and 6 and Figure S4
Samples were loaded on a 12% gel and immunoblotted with the indicated antibodies. Dashed lines indicate the bands presented in the other figures.