Abstract
Atmospheric particulate have deleterious impacts on human health. Predicting dust and aerosol emission and transport would be helpful to reduce harmful impacts but, despite numerous studies, prediction of dust events and contaminant transport in dust remains challenging. In this work, we show that relative humidity and wind speed are both determinants in atmospheric dust concentration. Observations of atmospheric dust concentrations in Green Valley, AZ, USA, and Juárez, Chihuahua, México, show that PM10 concentrations are not directly correlated with wind speed or relative humidity separately. However, selecting the data for high wind speeds (> 4 m/s at 10 m elevation), a definite trend is observed between dust concentration and relative humidity: dust concentration increases with relative humidity, reaching a maximum around 25% and it subsequently decreases with relative humidity. Models for dust storm forecasting may be improved by utilizing atmospheric humidity and wind speed as main drivers for dust generation and transport.
Keywords: Dust emission, Relative humidity, Wind speed, Semi-arid, PM10
1. Introduction
Dust storms have been shown to have deleterious impacts to human health. When near-zero visibility occurs during these events, serious traffic accidents have claimed numerous lives and shut down entire highways for extended periods of time (Novlan et al., 2007). The mere presence of dust in breathed air can have negative impacts on the human respiratory and cardiovascular systems (Schwartz, 1993; Pope et al., 1995; Peters et al., 1997; Donaldson et al., 2001; Ghio and Devlin, 2001). Additionally, spores and contaminants associated with dust and aerosol can adversely impact human health, causing a range of issues from respiratory infections to toxic exposure (Low et al., 2006; Quintero et al., 2010; Csavina et al., 2011; Degobbi et al., 2011). In particular, the transport of metals and metalloids in atmospheric dust around mining operations may lead to increased human exposure to toxic contaminants such as arsenic, lead and cadmium (Csavina et al., 2011, 2012).
In arid and semi-arid climates, dust storms are common. In El Paso, TX, alone, Novlan et al. (2007) reported that an average of 14.5 significant dust events (i.e. blowing dust leading to visibility reductions of 6 miles or less for duration of 2 hours or more) have occurred annually since 1932. These dust events are predicted to increase in occurrence in the US Southwest due to warmer and drier conditions from climate change and therefore are becoming an increasingly studied phenomenon (IPCC - International Pannel for Climate Change 2007; Breshears et al. 2012).
Dust events are caused by local and regional aeolian erosion. Wind speed is a primary factor in dust generation with vegetation cover and soil structure also playing significant roles (Zobeck and Fryrear, 1986; Zobeck, 1991; Yin et al., 2007). Wind tunnel studies have shown that threshold velocity for aeolian erosion is dependent on atmospheric humidity due to its impact on soil surface moisture content which, in turn, affects interparticle cohesion (Ravi et al., 2004; Ravi et al., 2006; Neuman and Sanderson, 2008). Temperature has also been found to correlate with dust concentrations (Hussein et al., 2006). Yet, despite the many studies on the wind erosion of soils, prediction of dust events is still a significant challenge (Desouza et al., 2010).
A growing body of research is showing the importance of relative humidity on dust emissions and, consequently, atmospheric dust levels (Ravi et al., 2004; Ravi and D’Odorico, 2005; Karar and Gupta, 2006; Ravi et al., 2006; Shah et al., 2006; Vassilakos et al., 2007; Giri et al., 2008; Neuman and Sanderson, 2008). Ravi et al. (2004) found that the threshold friction velocity for dust emissions was positively correlated with relative humidity. However, later studies found opposite trends at high relative humidity (>40%) when temperature was relatively constant (Ravi and D’Odorico, 2005; Ravi et al., 2006).
At low air relative humidity (RH<40%), water content in soil particles at equilibrium with atmospheric air occurs as single-layer adsorption (Neuman and Sanderson, 2008). This water layer interferes with interparticle forces: in some cases, the threshold friction velocity decreases with an increase in water content, since the adsorbed water layer decreases particle cohesion. This effect was found to be the controlling factor in emission experiments performed with various types of sand in a wind tunnel set up by Ravi et al. (2004). However, in the same range of relative humidity, the water layer might increase cohesion in which case an increase in threshold velocity with relative humidity is observed. This type of effect was reported by Neuman and Sanderson (2008) in wind tunnel experiments with simulated soils made up of approximately monodisperse sand and glass beads. The opposite effects of an adsorbed single water layer and a multilayer liquid film suggest that dust emission is not completely determined by ambient humidity and wind speeds, but other factors that affect particle cohesion, such as surface roughness and chemical composition, might play an important role in low humidity environments. At high relative humidity (RH>40%), multiple adsorbed water layers exist and eventually liquid films and bridges (RH>60%) form, which invariably increase soil particle cohesion. In this regime, an increase in relative humidity leads to an increase in threshold friction velocity. Changes in the threshold velocity lead to changes in dust emission fluxes and, consequently, atmospheric particulate concentrations.
In this study, we examine dust events in two semi-arid sites: Green Valley, AZ, USA (average annual precipitation 11.3 in), and Juárez, Chihuahua, Mexico (average annual precipitation 10.5 in). During the spring months of March – May, dust storms are a common occurrence in these locations. Dust was sampled at six field locations, ranging in soil and vegetation cover, in the region of Green Valley and two locations in Juárez. In addition, PMx and meteorological data from the Pima Department of Environmental Quality (PDEQ) in Arizona were analyzed for longer term trends. We hypothesize that both wind speed and relative humidity may play an important role in observed atmospheric dust concentrations. In particular, the effect of relative humidity on dust emission rates should have a bearing on atmospheric dust.
2. Materials and Methods
2.1. Green Valley Study
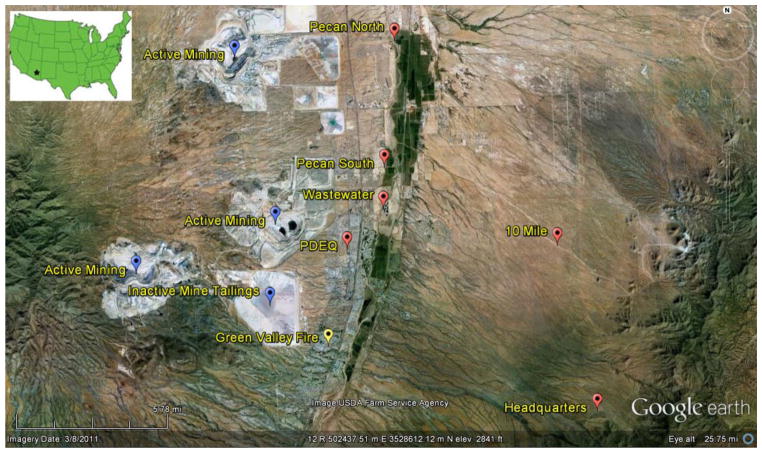
Green Valley (lat. 31° 52′ 16″, long. −110° 59′ 24″) is a unique location because it is impacted by regional dust sources from mining operations, including ore extraction and mine tailings, and it is proximate to the Santa Rita Experimental Range (a long-term ecological research station for semi-arid grasslands.) Green Valley is predominantly a retirement community so that the region has a large population of elderly people who may be especially sensitive to particulate inhalation health effects (Donaldson et al., 2001). Figure 1 shows six sampling locations chosen for the study of wind events in the period March – May, 2011. The southernmost mine tailings seen on the map are inactive and contain negligible concentrations of toxic species, such as As, Pb and Cd. The other three mining areas contain active mining operations, including ore extraction and mine tailings impoundment. The sampling sites were chosen to give a regional perspective on dust concentrations. The five sites represent a spectrum of vegetation and soil cover in the region. Wind events chosen for this study were selected for prevailing westerly winds, as defined by having 95 % or more of the wind vector from the directions between 200 and 340°. Because of this selection, the sampling sites are all downwind of the local mine tailing impoundments. Seasonally, April and May are generally the windiest months while in July and August, the months in which the North American Monsoon affects the region, winds are mostly the result of thunderstorm outflows. Prevailing winds are usually westerly, with a more southerly component during the winter months.
Figure 1.
Field locations for dust monitoring in Green Valley, AZ, USA. Pecan North and Pecan South are located on the edge of a pecan tree grove and beside a dry river bed; Wastewater is located beside the same river bed; PDEQ represents an urban sample; 10 Mile is approximately 10 miles (16 km) from mining activities; HQ (Santa Rita Experimental Range) represents a natural background site chosen for the region. Annual data were taken from Green Valley Fire. Mining activities for the region are labeled in blue.
Two of the sites, Pecan North and Pecan South, are located on the edge of a pecan tree grove (which is upwind of the events) and beside a dry river bed (downwind). The site named Wastewater is near the Green Valley wastewater treatment plant, and is also located along the dry river bed (which is downwind of the events). The PDEQ (Pima Department of Environmental Quality) site is in a commercial/residential area in Green Valley and was co-located with monitoring equipment from PDEQ, including PM2.5 and PM10 samplers. This site had the closest proximity to the mine tailings. The 10-Mile site was chosen to be approximately 10 miles (16 km) from a mining area. The Green Valley Fire location was not a part of the dust monitoring for this study, but 2011 annual data from the PDEQ PM10 monitor and meteorological data at this station were utilized for data validation.
The mine tailings and active mining areas around Green Valley (Figure 1) may contribute to local dust emissions, given their relatively large surface area. However, it is important to point out that the mine operators have implemented dust mitigation measures, such as moistening the surface of mine tailings impoundments.
Forecasts from the Arizona Regional WRF model with a horizontal resolution of 1.8 km (Leuthold, 2013)) were used to select sampling events: six windy events (wind speed ≥ 10 m/s at 10 m above ground level) and three calm events (wind speed ≤ 5 m/s at 10 m) were considered. Previous work (Tai et al., 2012) has shown that PM2.5 correlations with temperature and relative humidity are not a result of direct dependence but from covariation with synoptic transport that may be a consequence of, for example, the passage of a cold front. In this work, sampling events were selected when prevailing winds were from a southwesterly direction, which is the prevailing wind direction previous to cold front passage in the region. Event time periods took place between 11:00 and 18:00 Mountain Standard Time. Dust collection equipment was operated at each site for 4 hours during the forecast event period. The equipment consisted of a Dusttrak Aerosol Monitor (TSI Inc. DRX 8532), a Kestrel Weather Meter (Nielsen Kellerman 4500), and a Total Suspended Particulate (TSP) collector (F&J Specialty Products DF-AB-75L-Li). Dusttrak flow rate was 3.0 L/min and TSP flow rate was 60 L/min. Dusttrak measurements were taken with five-minute resolution and provide simultaneous real-time mass readings (mg/m3) for PM1, PM2.5, PM4, PM10, and TSP (<37 μm) (Wang et al. 2009). The Dusttrak was housed in an Environmental Enclosure (TSI Inc. 8535) with omni-directional inlet resulting in a cut-point diameter of 37 μm. Meteorological data, including wind speed and direction, relative humidity and temperature were also taken at a five minute resolution on all field instruments, which were synchronized before monitoring began. Glass fiber filters (F&J Specialty Products 206447) were used as TSP collection substrates. Filter substrates were transported to and from the field site in sealed petri dishes. Gravimetric analysis of the filters were performed using EPA class I equivalent methods on an ultra-microbalance (Mettler Toledo XP2U). The sample inlet for the Dusttrak and TSP and the weather vane for the Kestrel were set at a height of 1 m above ground level.
2.2. Juárez Study
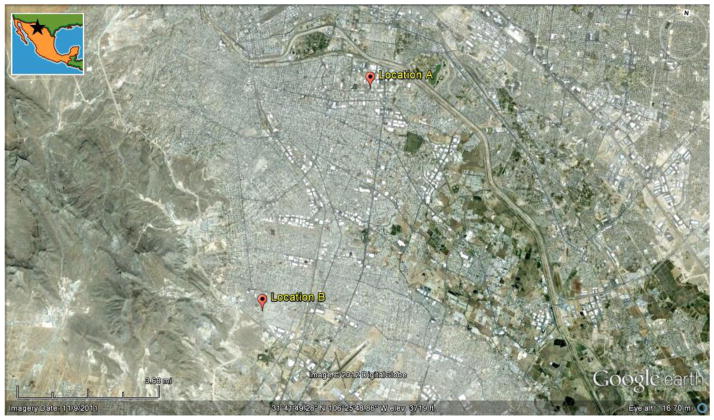
PM10 was monitored at two sites in Juárez, Mexico (lat. 31° 38′ 33″, long. −106° 25′ 48″), during the summer of 2008 (May – September). Both locations were in an urban setting, with Location A situated in the middle of a residential/commercial area surrounded by paved roads and Location B situated close to the city outskirts and surrounded by unpaved roads (Figure 2). Meteorological stations were co-located at Site A and within 2.5 km of Site B and managed by the Department of Civil and Environmental Engineering at Universidad Autónoma de Ciudad Juárez. Duplicate dust samples at each site were collected on standard filters (Partisol® 2000-FRM, Thermo Scientific) with a PM10 inlet. The sampler was operated at a flow rate of 16.7 L min−1 for 24-hour sampling periods. Glass fiber filters were used as substrates (1.5 μm pore, 47 mm diameter, Whatman) for collection of particulate matter.
Figure 2.
Field locations for monitoring in Juárez, Chihuahua, Mexico. PM10 monitoring was performed at the two locations show: Location A is surrounded by paved roads and Location B is surrounded by unpaved roads.
2.3. Dust sampler comparison
While all samplers utilized for this study are proven technologies for measuring windblown dust, it is important to note the differences in the variety of samplers. The samplers have varying flow rates, which will affect the cut-point of particle sizes sampled. Additionally, the PM10 TEOM operated by PDEQ and the Dusttrak have omni-directional inlets while PM10 and TSP filter samplers are directional inlets. Further, the TEOM and Dusttrak are optical samplers having errors associated with resolution and flow accuracy while filter samples’ accuracies largely depend on weighing and handling practices. The samplers are not intended to be compared directly between measurements due these varying biases, but rather to show trends of the magnitude of windblown dust with correlating conditions. All calibrations for instruments were maintained by University of Arizona, PDEQ, and Universidad Autónoma de Ciudad Juárez for the respective samplers.
3. Results and Discussion
3.1. Green Valley site comparison
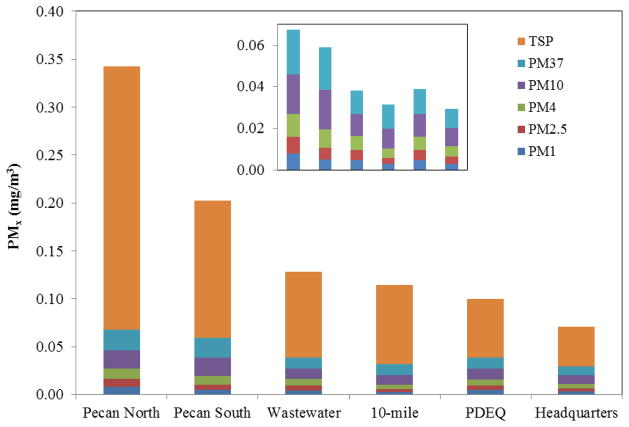
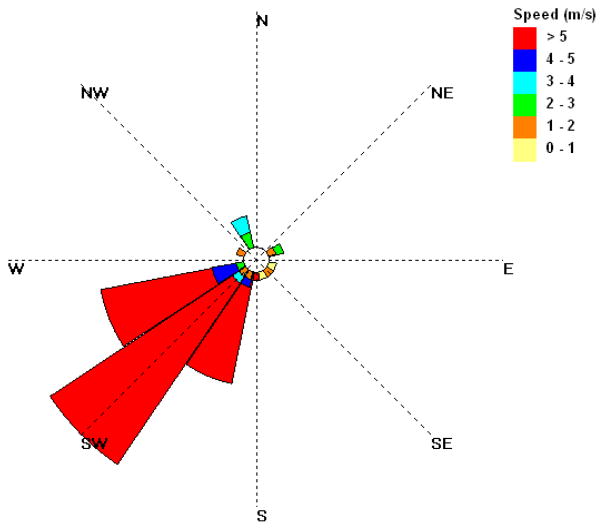
Average concentrations of PM fractions for the nine wind events during which sampling took place are presented in Figure 3, and the corresponding average wind rose is shown in Figure 4, which shows a generally southwesterly wind direction for the sampling events, consistent with the experimental design procedure. Without tracers, it is difficult to link the observed dust concentrations with specific sources, but it is worthwhile pointing out that the Pecan North site is exposed to a larger area of desert and mine tailings than any of the other sites, which might explain the substantially higher dust concentrations observed and the higher proportion of TSP with respect to smaller particle sizes. On the other hand, partly vegetated terrain and mountain foothills are located southwest of the Headquarters site, which is consistent with the relatively low amounts of dust measured. It is interesting to note the relatively high variability of the average dust concentrations among the sites, which are all contained within an area of about 100 km2. The overall change in concentration between any two sites generally extends to all particle size ranges; that is, if the total concentration decreases from one site to the next, the concentration of all particle size ranges also decreases. The proportional drop is always higher for the large particle size range (TSP), which exhibits the highest fractional variation among the sites.
Figure 3.
Overall average of PMx for the 9 events during March – May 2011 captured from TSP and Dusttrak observations at the Green Valley sites. The inset shows an expanded version of the plot without the TSP data.
Figure 4.
Overall average wind rose for the nine sampling events during March – May 2011 at the Green Valley site.
3.2. Green Valley wind event comparison
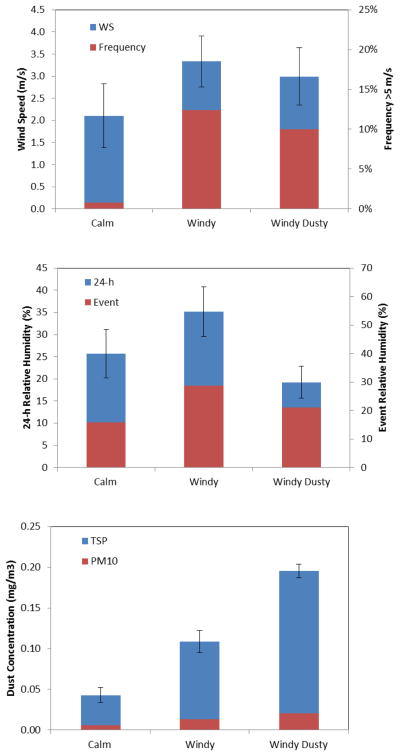
We term three of the nine events corresponding to average wind speeds lower than 5 m/s as “calm” events. The other six events corresponded to average wind speed higher than 10 m/s (Figure 4). Three of these events, termed “windy” events, resulted in significantly lower dust concentrations than the other three events, which we term “windy dusty” events (Figure 5), despite the fact that both the wind speed and gustiness (high wind frequencies >5 m/s) of the “windy” events were higher than those of the “windy dusty” events. On those windy but non-dusty days, the humidity was found to be higher than on windy, dusty days (Figure 5). Wind speed and relative humidity data were acquired from the PDEQ site while frequency of wind speed > 5 m/s was measured by the co-located Kestrel weather stations at each site. The frequency of high winds gives a sense of gustiness (with a consequent greater potential for particle entrainment) for the field locations while wind speed gives a sense for the event’s dust generation potential (Zeng et al., 2010; Cheng et al., 2012). Because relative humidity before and during the event is an important factor for soil moisture content, 24-hour average and event average relative humidity are compared in Figure 5. Since all the events occurred in the same season, the temperature variation was minimal between and during events, averaging 23.2 ± 2.6 °C. Differences in relative humidity were related to synoptic weather patterns. The corresponding summary wind roses (PDEQ site) for calm, windy, and windy dusty events can be seen in Figure 6. The data for the wind rose were also taken from the PDEQ weather station. These show that wind direction was fairly consistent for all the events, especially among the six windy events.
Figure 5.
Wind speed, relative humidity and dust concentration for measurements separated into “Calm”, “Windy”, and “Windy Dusty” events, each containing average of three different measurements, for the Green Valley events. Error bars represent standard deviations of repeat measurements of the same sample.
Figure 6.
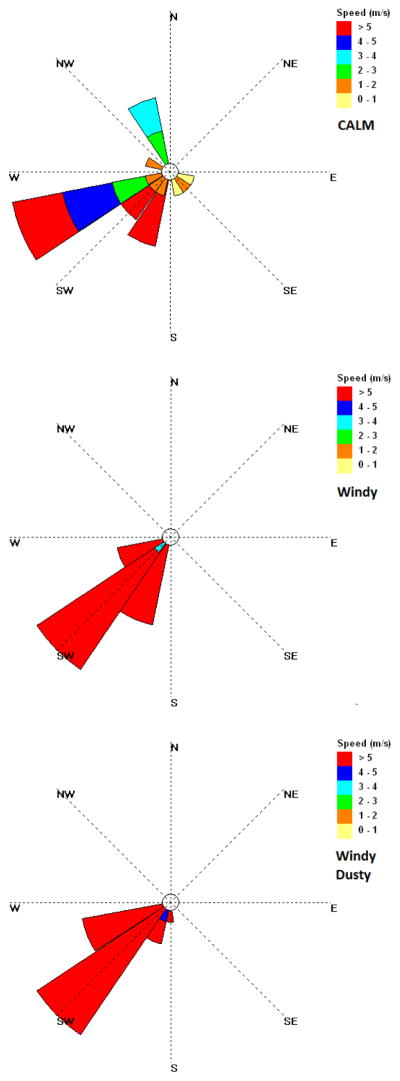
Wind roses for “Calm”, “Windy”, and “Windy Dusty” events, each corresponding to three different measurements.
To determine the possible roles that relative humidity and wind speed have on PM10 concentrations, we analyzed correlations among these parameters using the Spearman correlation coefficient, which measures the strength of association between two variables. Relative humidity and wind speed data were used from the Kestrel weather station co-located with the Dusttrak measuring the PM10 concentrations. Results are presented in Table 1. Independently, PM10 vs. wind speed and PM10 vs. relative humidity show very little correlation. However, when correlation factors are calculated for specific ranges of wind speed above a cut-off value, the strength of the correlation increases with wind cut-off wind speed and negative correlation coefficients are obtained, which indicates an overall decreasing trend of PM10 with increase in relative humidity.
Table 1.
Spearman correlation coefficients between PM10 (μg/m3), and wind speed (WS, m/s) and relative humidity (RH, %), using data from all nine events and six sites at Green Valley locations. Correlation factors with relative humidity are shown for all data, and data that include only measurements for wind speed exceeding the value noted (m/s) and RH>10%.
| x | y | Spearman correlation factor (y vs. x) |
|---|---|---|
| WS | PM10 | 0.24 |
| RH | PM10 | 0.10 |
| RH (WS > 4) | PM10 | −0.21 |
| RH (WS > 5) | PM10 | −0.36 |
| RH (WS > 6) | PM10 | −0.69 |
| RH (WS > 7) | PM10 | −0.88 |
3.3. Green Valley annual analysis
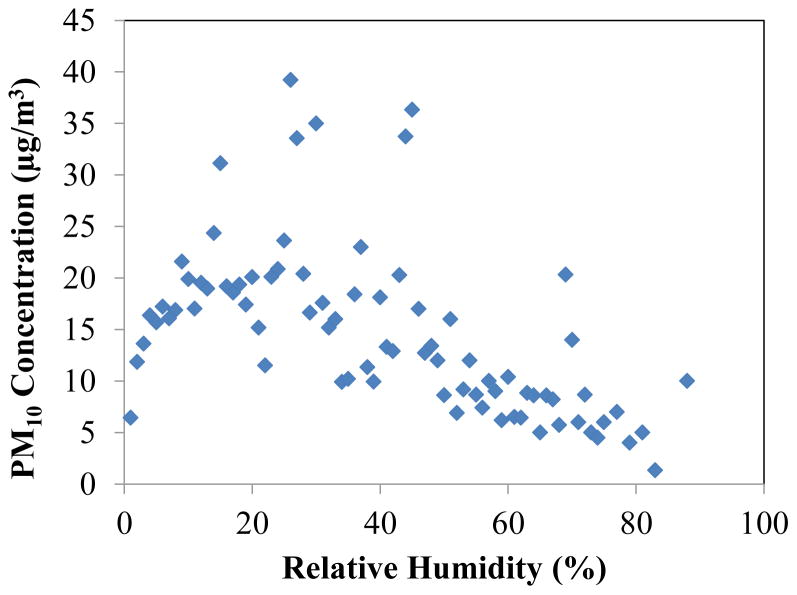
Annual (2011) PM10 data from the Green Valley Fire Station (Figure 1) were analyzed to examine long term interdependent correlations between PM10, wind speed, relative humidity and temperature. As discussed below, temperature did not have a significant effect on PM10 concentrations and the best correlation was obtained with relative humidity at high wind speed. The relation between these two variables is shown in Figure 7, where all data at wind speeds greater than 4 m/s are shown. In the range 0≤RH≤25%, the PM10 concentration increases with relative humidity. This could be due to increased dust emissions due to weakening interparticle cohesion as water starts adsorbing on dry particles, which would increase friction velocity. This observation is consistent with the results of Ravi et al. (2004) discussed above. However, the trend is reversed at RH>25%. The attenuation of PM10 by increasing relative humidity in this range may be a consequence of increasing interparicle cohesion forces due to presence of liquid water films on the particles.
Figure 7.
PM10 vs. relative humidity (WS>4 m/s) at the Green Valley Fire Station for 2011.
Spearman correlation coefficients for data at RH>25% are shown in Table 2. A weak correlation is seen between PM10 and wind speed and relative humidity when analyzed independently, similar to results presented in the previous section. A stronger correlation between PM10 and RH is seen when data were parsed out for high wind speeds, but no dependence on temperature is observed independently. This correlation indicates a monotonically decreasing trend in PM10 concentrations with RH at RH>25%.
Table 2.
Spearman correlation coefficients between PM10 (μg/m3), wind speed (WS, m/s), temperature (°C) and relative humidity (RH, %), using 2011 annual data from Green Valley Fire. Data analyzed include only RH>25%.
| x | y | Spearman correlation factor (y vs. x) |
|---|---|---|
| WS | PM10 | 0.14 |
| RH | PM10 | −0.24 |
| T | PM10 | 0.08 |
| RH (WS > 4) | PM10 | −0.66 |
| T (WS > 4) | PM10 | −0.0003 |
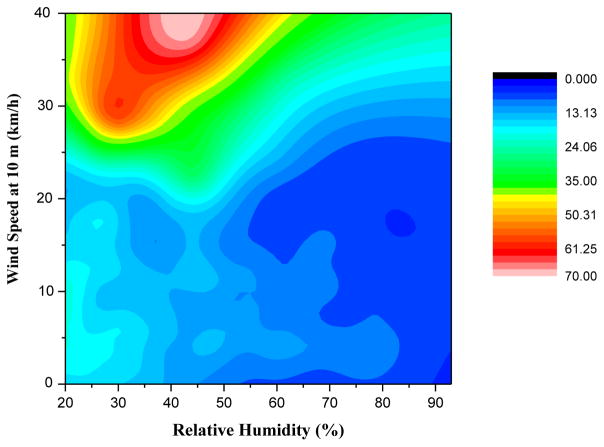
The combined effects of wind speed and relative humidity on PM10 concentrations can be more clearly seen in Figure 8. At wind speeds less than 6 m/s, PM10 concentrations are low and insensitive to either wind speed or relative humidity. However, at high wind speeds, the maximum in PM10 concentration with relative humidity is clearly seen. An absolute maximum close to 80 μg/m3 is obtained at 40% relative humidity and 11 m/s wind speed.
Figure 8.
PM10 concentration (μg/m3) contours of relative humidity versus wind speed for Green Valley Fire data.
The World Health Organization and US EPA PM10 24-hour guideline are 50 μg/m3 and 150 μg/m3, respectively (WHO, 1995; EPA, 2012). The minimum wind speed necessary to create these concentrations according to Figure 8 is approximately 7 m/s at a relative humidity of 35%. If relative humidity were to increase to 50% then the minimum wind speed would rise to 9 m/s. These values hold consistent with a field scale study by Ravi and D’Odorico (2005) in which wind erosion threshold velocities were found to peak at RH 35% with an increasing trend with air humidity (RH<35%) and subsequent decreasing trend with humidity (RH>35%).
3.4. Juárez PM10 study
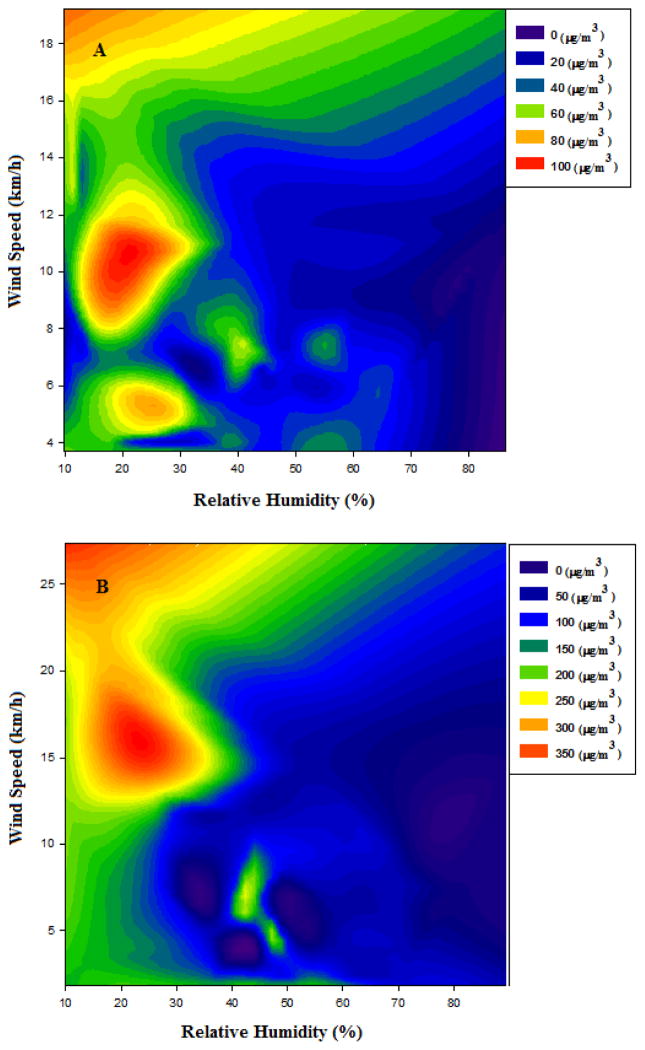
The interdependence of PM10 concentration on wind speed and relative humidity was also observed in Juárez, Chihuahua, Mexico. Similar to Green Valley, Juárez is situated in a semi-arid region that experiences frequent dust storms. Figure 9 shows PM10 concentrations contours as a function of relative humidity and wind speed, using data from a field campaign to study the difference between PM10 concentration of paved (A) and unpaved roads (B). As would be expected, higher concentrations of PM10 are seen for unpaved roads. Both contour plots show a comparable trend of low relative humidity and high wind speeds yielding high PM10 concentrations.
Figure 9.
PM10 concentration (μg/m3) contours compared to relative humidity (%) versus and speed (km/h) from a study in Juárez, Chihuahua Mexico. Location A monitored PM10 near paved roads (top) and Location B monitored near unpaved roads (bottom).
As in the Green Valley study (Figure 8), an absolute maximum in PM10 concentration is observed. The wind speeds and relative humidities at which the maxima occur (11 m/s WS and 23% RH for paved roads and 16 m/s WS and 23% RH for unpaved roads) are of the same order of magnitude as those observed in Green Valley, although the maxima of PM10 concentrations are noticeably higher, especially for the case of unpaved roads, where the PM10 concentration reaches a maximum of 350 μg/m3. The higher concentration values may be a result of surfaces with higher propensity to wind erosion, but it is interesting to note that similar conditions at both sites in terms of wind speed and relative humidity are necessary to obtain relatively high PM10 concentrations. García et al. (2004) used chemical fingerprinting to assess dust sources in the neighboring city of El Paso, TX, and concluded that anthropogenic dust sources (e.g. fugitive dust from a smelter and quarry) had significant impact on atmospheric dust concentrations of pollutants. It is not known if these results translate to the Juárez area directly, but, if so, it would imply that both anthropogenic and natural sources follow the same trends with variations in wind speed and relative humidity.
4. Concluding Remarks
The study of dust generation in Green Valley has implications to dust event predictions. While dust storm forecasts factor drought conditions in models, wind speed is considered the main driver in dust concentration predictions (Lu and Shao, 2001; Yin et al., 2005). Here, we show that both relative humidity and wind speed are determinants of dust generation. Results from annual PM10 data confirm there is no seasonal reliance on relative humidity or wind speed being a factor in dust concentration. Additionally, results from a study in Juárez, Chihuahua, Mexico, confirm the interdependent importance of relative humidity and wind speed in PM10 concentration in semi-arid regions.
The underappreciated role of relative humidity on atmospheric dust concentrations should be considered in the prediction of atmospheric dust concentrations. Our results show a complex, nonlinear dependence of PM10 on wind speed and relative humidity in which water sorption seems to control friction velocities at low relative humidity (< 25%) while interparticle cohesion forces due to liquid bridges predominate at high relative humidity (> 25%), which needs to be considered in regional dust event forecasts, as well as in future effects of climate change on dust events in the US Southwest. The wide scatter of the data suggests that wind speed and relative humidity are not the only factors determining dust concentrations. Effects of variability of wind direction and speed (e.g. in terms of wind gusts) should also be considered. However, our limited data set did not allow us to look into these additional variables.
Acknowledgments
The authors gratefully acknowledge the Pima Department of Environmental Quality for the provision of the PM10 and weather data used for this publication and Dr. David Breshears for the loan of field equipment. This work was supported by grant number P42 ES04940 from the National Institute of Environmental Health Sciences (NIEHS), National Institutes of Health (NIH). The views of authors do not necessarily represent those of the NIEHS, NIH.
References
- Breshears DD, Kirchner TB, et al. Modeling aeolian transport in response to succession, disturbance and future climate: Dynamic long-term risk assessment for contaminant redistribution. Aeolian Res. 2012;3:445–457. [Google Scholar]
- Cheng XL, Wu L, et al. Parameterizations of some important characteristics of turbulent fluctuations and gusty wind disturbances in the atmospheric boundary layer. J Geophys Res-Atmos. 2012;117:D08113. doi: 10.1029/2011JD017191. [DOI] [Google Scholar]
- Csavina J, Landázuri A, et al. Metal and metalloid contaminants in atmospheric aerosols from mining operations. Water Air Soil Poll. 2011;221:145–157. doi: 10.1007/s11270-011-0777-x. [DOI] [PMC free article] [PubMed] [Google Scholar]
- Csavina J, Field J, et al. A review on the importance of metals and metalloids in atmospheric dust and aerosol from mining operations. Sci Total Environ. 2012;433:58–73. doi: 10.1016/j.scitotenv.2012.06.013. [DOI] [PMC free article] [PubMed] [Google Scholar]
- Degobbi C, Lopes F, et al. Correlation of fungi and endotoxin with PM2.5 and meteorological parameters in atmosphere of Sao Paulo. Brazil Atmos Environ. 2011;45:2277–2283. [Google Scholar]
- Desouza ND, Simon B, et al. Evolutionary characteristics of a dust storm over Oman on 2 February 2008. Meteorol Atmos Phys. 2010;114:107–121. [Google Scholar]
- Donaldson K, Stone V, et al. US Dept Health Human Sciences. Public Health Science; Washington: 2001. Ambient particle inhalation and the cardiovascular system: Potential mechanisms. [DOI] [PMC free article] [PubMed] [Google Scholar]
- Environmental Protection Agency (EPA) [accessed 2013];2012 http://www.epa.gov/air/criteria.html.
- García JH, Li WW, Arimoto R, Okrasinski R, Greenlee J, Walton J, Schloesslin C, Sage S. Characterization and implication of potential fugitive dust sources in the Paso del Norte region. Sci Tot Environ. 2004;325:95–112. doi: 10.1016/j.scitotenv.2003.11.011. [DOI] [PubMed] [Google Scholar]
- Ghio AJ, Devlin RB. Inflammatory lung injury after bronchial instillation of air pollution particles. Am J Resp Crit Care. 2001;164:704–708. doi: 10.1164/ajrccm.164.4.2011089. [DOI] [PubMed] [Google Scholar]
- Giri D, Krishna MV, et al. The influence of meteorological conditions on PM10 concentrations in Kathmandu Valley. Int J Environ Res. 2008;2:49–60. [Google Scholar]
- Hussein T, Karppinen A, et al. Meteorological dependence of size-fractionated number concentrations of urban aerosol particles. Atmos Environ. 2006;40:1427–1440. [Google Scholar]
- IPCC - International Pannel for Climate Change. Climate Change 2007: Climate Change Impacts, Adaptation and Vulnerability. New York: Cambridge University Press; 2007. Working Group II Contribution to the Intergovernmental Panel on Climate Change Fourth Assessment Report. [Google Scholar]
- Karar K, Gupta AK. Seasonal variations and chemical characterization of ambient PM10 at residential and industrial sites of an. urban region of Kolkata (Calcutta), India. Atmos Res. 2006;81:36–53. [Google Scholar]
- Leuthold M. [accessed 2013];2013 http://www.atmo.arizona.edu/?section=weather&id=wrf.
- Low RB, Bielory L, et al. The relation of stroke admissions to recent weather, airborne allergens, air pollution, seasons, upper respiratory infections, and asthma incidence, September 11, 2001, and day of the week. Stroke. 2006;37:951–957. doi: 10.1161/01.STR.0000214681.94680.66. [DOI] [PubMed] [Google Scholar]
- Lu H, Shao YP. Toward quantitative prediction of dust storms: an integrated wind erosion modelling system and its applications. Environ Modell Softw. 2001;16:233–249. [Google Scholar]
- Neuman CM, Sanderson S. Humidity control of particle emissions in aeolian systems. J Geophys Res-Earth Surf. 2008;113:F2. doi: 10.1029/2007JF000780. [DOI] [Google Scholar]
- Novlan DJ, Hardiman M, et al. A synoptic climatology of blowing dust events in El Paso, Texas from 1932–2005. Conference on Applied Climatology, American Meteorological Society (J3.12); 2007. p. 13. [Google Scholar]
- Peters A, Dockery DW, et al. Short-term effects of particulate air pollution on respiratory morbidity in asthmatic children. Eur Respir J. 1997;10:872–879. [PubMed] [Google Scholar]
- Pope CA, Bates DV, et al. Health Effects of Particulate Air Pollution: Time for Reassessment? Environ Health Perspect. 1995;103:472–480. doi: 10.1289/ehp.95103472. [DOI] [PMC free article] [PubMed] [Google Scholar]
- Quintero E, Rivera-Mariani F, et al. Analysis of environmental factors and their effects on fungal spores in the atmosphere of a tropical urban area (San Juan, Puerto Rico) Aerobiologia. 2010;26:113–124. [Google Scholar]
- Ravi S, D’Odorico P, et al. On the effect of air humidity on soil susceptibility to wind erosion: The case of air-dry soils. Geophys Res Lett. 2004;31:L09501. doi: 10.1029/2004GL019485. [DOI] [Google Scholar]
- Ravi S, D’Odorico P. A field-scale analysis of the dependence of wind erosion threshold velocity on air humidity. Geophys Res Lett. 2005;32:L21404. doi: 10.1029/2005GL023675. [DOI] [Google Scholar]
- Ravi S, Zobeck TM, et al. On the effect of moisture bonding forces in air-dry soils on threshold friction velocity of wind erosion. Sedimentology. 2006;53:597–609. [Google Scholar]
- Schwartz J. Particulate air pollution and chronic respiratory disease. Environ Res. 1993;64:36–52. doi: 10.1006/enrs.1993.1083. [DOI] [PubMed] [Google Scholar]
- Shah MH, Shaheen NN, et al. Characterization, source identification and apportionment of selected metals in TSP in an urban atmosphere. Environ Monit Assess. 2006;114:573–587. doi: 10.1007/s10661-006-4940-6. [DOI] [PubMed] [Google Scholar]
- Tai APK, Mickley LJ, et al. Meteorological modes of variability for fine particulate matter (PM2.5) air quality in the United States: implications for PM2.5 sensitivity to climate change. Atmos Chem Phys. 2012;12:3131–3145. [Google Scholar]
- Vassilakos C, Veros D, et al. Estimation of selected heavy metals and arsenic in PM10 aerosols in the ambient air of the Greater Athens Area, Greece. J Hazardous Mat. 2007;140:389–398. doi: 10.1016/j.jhazmat.2006.11.002. [DOI] [PubMed] [Google Scholar]
- Wang XL, Chancellor G, et al. A novel optical instrument for estimating size segregated aerosol mass concentration in real time. Aerosol Sci Technol. 2009;43:939–950. [Google Scholar]
- WHO - World Health Organization. Updating and Revision of the Air Quality Guideline for Europe. EUR/ICP/EHAZ 94 05/PB01. Meeting of the Working Group “Classical” Air Pollutants.World Health Organization Regional Office for Europe; 1995. [Google Scholar]
- Yin D, Nickovic S, et al. Modeling wind-blown desert dust in the southwestern United States for public health warning: A case study. Atmos Environ. 2005;39:6243. [Google Scholar]
- Yin D, Nickovic S, et al. The impact of using different land cover data on wind-blown desert dust modeling results in the southwestern United States. Atmos Environ. 2007;41:2214–2224. [Google Scholar]
- Zeng QC, Cheng XL, et al. Gustiness and coherent structure of strong winds and their role in dust emission and entrainment. Adv Atmos Sci. 2010;27:1–13. [Google Scholar]
- Zobeck TM. Soil properties affecting wind erosion. J Soil Water Conserv. 1991;46:112–118. [Google Scholar]
- Zobeck TM, Fryrear DW. Chemical and physical characteristics of windblown sediment, II: chemical characteristics and total soil and nutrient discharge. T ASAE. 1986;29:1037–1041. [Google Scholar]


