

Abstract
Channelrhodopsins (ChRs), which form a distinct branch of the microbial rhodopsin family, control phototaxis in green algae. Because ChRs can be expressed and function in neuronal membranes as light-gated cation channels, they have rapidly become an important optogenetic tool in neurobiology. While channelrhodopsin-2 from the unicellular alga Chlamydomonas reinhardtii (CrChR2) is the most commonly used and extensively studied optogenetic ChR, little is known about the properties of the diverse group of other ChRs. In this study, near-infrared confocal resonance Raman spectroscopy along with hydrogen–deuterium exchange and site-directed mutagenesis were used to study the structure of red-shifted ChR1 from Chlamydomonas augustae (CaChR1). These measurements reveal that (i) CaChR1 has an all-trans-retinal structure similar to those of the light-driven proton pump bacteriorhodopsin (BR) and sensory rhodopsin II but different from that of the mixed retinal composition of CrChR2, (ii) lowering the pH from 7 to 2 or substituting neutral residues for Glu169 or Asp299 does not significantly shift the ethylenic stretch frequency more than 1–2 cm–1 in contrast to BR in which a downshift of 7–9 cm–1 occurs reflecting neutralization of the Asp85 counterion, and (iii) the CaChR1 protonated Schiff base (SB) has stronger hydrogen bonding than BR. A model is proposed to explain these results whereby at pH 7 the predominant counterion to the SB is Asp299 (the homologue to Asp212 in BR) while Glu169 (the homologue to Asp85 in BR) exists in a neutral state. We observe an unusual constancy of the resonance Raman spectra over the broad range from pH 9 to 2 and discuss its implications. These results are in accord with recent visible absorption and current measurements of CaChR1 [Sineshchekov, O. A., et al. (2013) Intramolecular proton transfer in channelrhodopsins. Biophys. J. 104, 807–817; Li, H., et al. (2014) Role of a helix B lysine residue in the photoactive site in channelrhodopsins. Biophys. J. 106, 1607–1617].
Channelrhodopsins (ChRs) found in green flagellate algae form a distinct branch of the phylogenetic tree of the type 1 “microbial rhodopsin” family.3,4 Recently, ChRs have become important optogenetic tools because of their ability to function as light-gated ion channels when expressed in neurons.5−7 In neuronal cells expressing CrChR2, light causes an inward flow of cations along the electrochemical gradient causing a depolarization of the neuronal membrane and triggering action potentials.5 This new photonic capability has led to many incisive applications, including the high spatial mapping of brain circuits8 and the potential use of light instead of electrical stimulation with cardiac pacemakers.9
Although ChRs exist in a variety of environments, channelrhodopsin-2 from Chlamydomonas reinhardtii (CrChR2)10,11 is thus far the most extensively studied ChR. On a molecular level, it exhibits significant differences compared to the model light-driven proton pump bacteriorhodopsin (BR) as well as many other microbial rhodopsins (for a recent review, see ref (12)). For example, resonance Raman spectroscopy (RRS) and retinal extraction show that unlike the almost pure all-trans composition of light-adapted BR,13 the CrChR2 retinal chromophore for both light- and dark-adapted forms exists as a mixture of all-trans, 13-cis, and possibly 9-cis isomers.14
Furthermore, although ChRs conserve residues from BR, including the homologues to Asp85, the proton acceptor and primary counterion to the Schiff base (SB), and Asp212, which is also located near the SB and believed to exist in a negative form at neutral pH (see Figure 1), their role may be different in ChRs. For example, the X-ray structure of a chimera of CrChR1 and CrChR2 (C1C2) shows that the position of these residues relative to the SB proton is altered along with their hydrogen bonding to other residues and position of an internal water molecule (W402) in the retinal binding pocket.15 This suggests that the relative pKa values of these two critical counterion residues are altered in CrChR2 as well as their function, consistent with recent FTIR measurements of CrChR2.16
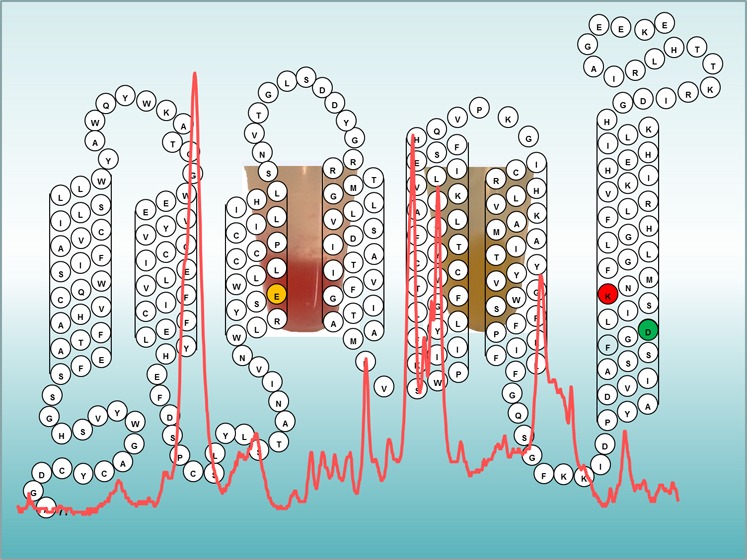
Figure 1.

Sequence of CaChR1 and predicted folding pattern in the membrane based on earlier models of archaerhodopsins and other microbial rhodopsins (see, for example, ref (56)). Highlighted residues are the homologues of Asp85 and Asp212 in BR that comprise the complex counterion to the SB.
An important question is whether the molecular structure and functional mechanism of CrChR2 are common to other ChRs. Channelrhodopsins are phylogenetically diverse and display a range of spectroscopic, photocycle, and channel properties.17 It is possible that the molecular mechanism of light-gated channel activity will also exhibit variations. To explore this question, near-infrared confocal RRS was used to study the retinal structure and the interaction of the SB with nearby residues in the binding pocket of a ChR1 from Chlamydomonas augustae (CaChR1). Although a low-efficiency ChR compared to CrChR2, CaChR1 has a red-shifted λmax (525 nm vs 470 nm) and slower light inactivation,17 making it a possible candidate for some optogenetic applications.
We report here RRS measurements revealing that CaChR1 exhibits a predominantly all-trans-retinal chromophore structure that is remarkably similar to sensory rhodopsin II from Natronobacterium pharonis (NpSRII) and to a large extent also bacteriorhodopsin (BR) in contrast to the mixed isomer composition of CrChR2.18 Its more homogeneous chromophore makes CaChR1 an attractive protein for the study of ChR photochemistry. On the basis of pH titration measurements, deuterium–hydrogen (D–H) exchange, and the effects of substitutions of the two putative SB counterion residues, Glu169 and Asp299 (Asp85 and Asp212 in BR), we conclude that at pH 7 Glu169 exists in a protonated form (i.e., neutral state) whereas Asp299 exists in an ionized form and serves as the predominant counterion for the SB, in agreement with recent UV–visible absorption and current measurements of CaChR1 and some of its mutants.1,2 The relatively unchanged vibrational spectrum of CaChR1 with a decrease in the pH of CaChR1 from pH 9 to 2 suggests that charge neutrality is maintained near the SB over a broad pH range.
Materials and Methods
Expression, Purification, and Reconstitution of ChRs
The 7TM domain of CaChR1 was expressed in Pichia pastoris and reconstituted using a procedure similar to that described in ref (2). Cells were grown in BMGY (Buffered Minimal Glycerol Yeast) medium; expression was induced by the addition of 0.5% methanol every 24 h in the presence of 5 μM all-trans-retinal. Cells were grown for 2 days, harvested by low-speed centrifugation, and disrupted by a bead beater. Membrane fragments were collected by centrifugation for 1 h at 38000 rpm. The protein was partially purified on a Ni-NTA agarose column (Qiagen, Hilden, Germany) after solubilization by incubation overnight in 3% dodecyl maltoside (DDM). For membrane reconstitution, the protein was eluted in 20 mM HEPES (pH 7.4), 100 mM NaCl, 0.05% DDM, and 300 mM imidazole and then mixed with Escherichia coli polar lipids (ECPL) (Avanti Polar Lipids, Alabaster, AL) at a concentration of 5 mg/mL in 10% octyl glucoside at a ratio of 1:10 (CaChR1:ECPL) and incubated at room temperature for 1 h after which 0.25 g of SM-2 Bio-Beads (Bio-Rad, Hercules, CA) was added, and the mixture was incubated for 1 h at room temperature with slow rotation. The protein-lipid suspension was transferred to a fresh tube with 0.25 g of SM-2 Bio-Beads and the mixture incubated at room temperature overnight with slow rotation, and the reconstituted CaChR1 proteoliposomes were pelleted at 10000 rpm for 10 min. The pellet was resuspended in 10 mM phosphate buffer (pH 7.0) and washed twice.
Similar procedures were used to express and reconstitute CrChR2 as described above except the cDNA of CrChR2 encoded residues 1–309 with a C-terminal six-His tag sequence that was cloned in the pPIC9K vector (Invitrogen) within its EcoRI and NotI sites. The production of detergent-purified CrChR2 followed the methods of Bamann et al.19 and Li et al.2 For liposome reconstitution, CrChR2 in 1% decyl maltoside (DM) was mixed with DMPC (Avanti Polar Lipids, Alabaster, AL) at a ratio of 1:20 (w/w).
Near-Infrared (IR) Resonance Raman Spectroscopy
The reconstituted ChRs prepared as described above were used for resonance Raman studies. ChR samples were measured using confocal near-IR RRS using methods similar to those previously reported for Archaerhodopsin-3.20 Approximately 20 μg of reconstituted ChR was pelleted using a SCI Logex D2012 centrifuge spun at 15000 rpm for 5 min, resuspended in a wash buffer (50 mM K2HPO4 and 10 mM NaCl) adjusted to various pH values using H3PO4/KOH titration, and recentrifuged and washed at least two additional times to form a final pellet. A similar procedure was used to prepare a sample with 2 M NaCl and 1 M Na2SO4, except the pH was adjusted to 3 using HCl or H2SO4 and the K2HPO4 was omitted. A portion of the pellet was inserted into a square borosilicate glass capillary (0.5 mm by 0.5 mm cross section inside diameter, Wale Apparatus, Hellertown, PA) using a 10 μL syringe (Hamilton Co., Reno NV). One end of the capillary was sealed prior to addition of protein, and a short centrifugation (<1 min at 15000 rpm) was used to concentrate the protein at the sealed end. The other end is sealed with Critoseal (Leica Microsystems, Buffalo Grove, IL) to prevent dehydration. The level of water in the pellet was sufficient to keep the membranes fully hydrated during the course of the measurements.
RRS was conducted at room temperature on a Bruker Senterra confocal Raman microscope (Olympus BX51M) equipped with a 20× objective with a numerical aperture (NA) of 0.4 using 785 nm laser excitation. A laser power of 100 mW (40 mW measured at the sample) was used for most measurements unless otherwise noted at an effective resolution of 3–5 cm–1. Averaged spectra were obtained by measuring the sample for 120 s, leaving the sample in the dark for 1 min, and then repeating this cycle over 4–6 h. Spectra obtained from an empty capillary were subtracted to eliminate the fluorescence background. Resonance Raman spectra obtained in this way were also compared to spectra of a CaChR1 proteoliposome preparation that was heat-denatured at 75 °C for 30 min to identify possible nonresonance contributions from protein and lipid vibrations.
UV–Vis Spectroscopy
Between 100 and 200 μg of reconstituted CaChR1 in ECPL was washed in wash buffer (same that was used for RRS) at pH 7. Samples were then placed in a quartz cuvette (Agilent Technologies Inc., Santa Clara, CA), and UV–vis absorption data were acquired at room temperature with a Cary 6000 spectrometer equipped with a diffuse scattering apparatus (both from Agilent Technologies, Inc.) using an averaging time of 0.5 s per step size of 1 nm. The total data acquisition time was 300 s. Measurements on light-adapted samples were recorded immediately after illumination for 5 min using a 530 nm LED operating at 10 mW/cm2 at the sample. Dark-adapted spectra were recorded immediately after the sample had been kept in the dark for 60 min.
Spectral Analysis
Baseline corrections, spectral subtractions, and peak fitting were performed using Grams/AI version 7.02 (Thermo Fisher Scientific, Inc.). The UV–vis baseline was corrected by fitting a quartic baseline. Resonance Raman spectra of samples were corrected for fluorescence and Raman background arising from the empty capillary by subtraction of its spectrum using a least-squares minimization algorithm.
To calculate the subcomponent bands in the ethylenic region of the resonance Raman spectra as shown in Figure S4 of the Supporting Information, a curve-fitting program that is part of Grams/AI version 7.02 was utilized, which incorporates iterative χ2 minimization. The resonance Raman spectra, including those as a function of pH, were fit from 1488 to 1578 cm–1 with a linear baseline, and the routine found in all cases two Voigtian peaks, which resulted in an R2 value of >0.99. Similar methods were used to fit the UV–vis data shown in Figure S1 of the Supporting Information, which resulted in three Voigtian peaks with an R2 value of >0.99.
Results
Similarity of the Raman Spectra of CaChR1, BR, and NpSRII
The near-IR resonance Raman spectrum of CaChR1 is remarkably similar to the near-IR resonance Raman spectrum recorded under identical conditions for BR and even more similar to that of NpSRII (Figure 2). This is particularly true in the configurationally sensitive fingerprint region (1150–1300 cm–1) that involves mainly the C–C stretching modes of the retinal chromophore. In the case of both BR and NpSRII, previous RRS and FTIR studies21−24 led to the conclusion that the retinal chromophore exists in an all-trans protonated SB configuration. For example, bands in the BR spectrum were previously assigned to an all-trans-retinal chromophore using model retinal compounds and isotope labeling.2513C solid state NMR also provides strong confirmation of the existence of an almost pure all-trans configuration of the retinal chromophore in the case of BR.26 In addition, NpSRII appears to exist in a pure all-trans form in both light-adapted and dark-adapted states.27
Figure 2.

Resonance Raman spectra of BR (purple membrane), CaChR1 reconstituted into E. coli polar lipids, and CrChR2 reconstituted into DMPC recorded in H2O at pH 7. Data were recorded at room temperature using a 785 nm probe laser with a 100 mW power (40 mW measured at the sample). A background spectrum of the quartz capillary and buffer was subtracted from the sample. The spectra were scaled using the intensity of the ethylenic band at 1526 cm–1. Additional details are given in Materials and Methods.
Bands in the fingerprint region of retinal are particularly sensitive to the isomeric state of retinal and arise mainly from the various mixed C–C stretching modes of the chromophore.22,25,28 The similarity of the relative intensities and frequencies of bands in this region for CaChR1, BR, and NpSRII strongly indicates that all three chromophores have a similar all-trans-retinal configuration. For example, bands appear in this region in CaChR1, BR, and NpSRII near 1272, 1256, 1207 (shoulder), 1201, 1184, 1172, and 1163 cm–1 (CaChR1). While the 1172 cm–1 band in CaChR1 and the 1170 cm–1 band in NpSRII do not appear clearly in BR, this is most likely due to an upshift of the 1163 cm–1 band to 1168 cm–1. The latter band in BR is assigned mainly to the C10–C11 stretching mode25 and may indicate some differences in structure in this region of the chromophore compared to the structures of CaChR1 and NpSRII. Many other microbial rhodopsins with all-trans chromophores such as AR320 and green- and blue-absorbing proteorhodopsin (GPR and BPR, respectively)29 also exhibit very similar resonance Raman spectra in the fingerprint region, reflecting a similar all-trans-retinal configuration.
The agreement between the intensity and frequency of many bands outside the fingerprint region also provides strong evidence of the similar configurations of BR, NpSRII, and CaChR1 chromophores. For example, the 1006 cm–1 band assigned in BR to in-plane methyl rocking vibrations of the two methyl groups at positions C9 and C13 appears at a similar frequency in CaChR1.25 A second example is in the hydrogen out-of-plane (HOOP) region, where bands appear at 961, 901, and 881 cm–1 in CaChR1 and 958, 889, and 881 cm–1 in BR.29
Visible absorption measurements indicate that there is very little change in the absorption of CaChR1 between the light- and dark-adapted states (Figure S1 of the Supporting Information). The curve-fit major component appears at 524 nm, close to the peak for the maximal wavelength of the action spectrum for the current generation of CaChR1.2 Furthermore, the spectrum of BR recorded under identical conditions (Figure 2) using 785 nm Raman excitation exhibits no major bands characteristic of the dark-adapted state (e.g., the 1536 cm–1 ethylenic band),20 indicating that even if CaChR1 did exhibit dark adaptation it should remain in the light-adapted state during the Raman measurement. Reducing the 785 nm excitation power from 100 to 10 mW or continuously illuminating the sample with a 530 nm LED during the measurement did not significantly alter the resonance Raman spectrum (Figure S2 of the Supporting Information). Thus, we do not consider it likely that the Raman spectrum recorded with 785 nm excitation shown in Figure 2 reflects a long-lived photoproduct in the photocycle.
In contrast to CaChR1, the RSS of CrChR2, particularly in the fingerprint region, differs significantly from that of BR and CaChR1 (Figure 2). This reflects the heterogeneity of the chromophore structure of CrChR2 that has been found to exist in a mixture of all-trans and 13-cis isomers both in the light- and dark-adapted states.14,16,18 For example, Nack et al.14 found on the basis of RRS and extraction–high-performance liquid chromatography analysis that there were significant contributions from 13-cis-retinal and small amounts from 9-cis-retinal, both of which increased with light adaptation. Note that even though the earlier study was performed using a different laser excitation frequency (647 nm),14 almost all of the bands appear at similar frequencies and intensities as in the resonance Raman spectrum shown in Figure 2 recorded using 785 nm excitation.
The most outstanding differences between CrChR2 and BR, NpSRII, and CaChR1 appear in the fingerprint region. The magnitude of the 1185 cm–1 band, which is highly characteristic of the 13-cis isomer, increases relative to that of the 1200 cm–1 band, which is characteristic of the all-trans form.25,30 This increase is also apparent in both the resonance Raman spectrum and FTIR difference spectrum of many of the BR photointermediates with a 13-cis-retinal configuration.31,32 For example, bands at 1186 and 1198 cm–1 are almost equal in magnitude in the resonance Raman spectra of the N intermediate,33 very similar to bands reported here and previously for CrChR2.14 An almost identical fingerprint profile is also found for BR548, the 13-cis-retinal-containing component of dark-adapted BR.30 On the basis of normal mode calculations, the 1185 cm–1 band is assigned primarily to the C10–C11 stretching mode of the retinylidene chromophore.30 In contrast, microbial rhodopsins that contain the predominantly all-trans-retinal chromophore such as light-adapted BR, NpSRII (see Figure 2), display a much weaker band intensity near 1185 cm–1 relative to that near 1200 cm–1, which is most likely due to a different C–C stretching mode.23
Additional differences in the resonance Raman spectra of CrChR2 compared to BR and CaChR1 appear in the in-plane methyl rocking vibration and HOOP mode regions (Figure 2). Overall, this comparison indicates that CrChR2 has a significantly higher fraction of the 13-cis isomer in the light-adapted ground state than CaChR1 does.
Assignment of the CaChR1 Ethylenic C=C Stretching Vibration
One significant difference between the resonance Raman spectra of BR, NpSRII, CaChR1, and CrChR2 is in the ethylenic C=C stretching region where intense bands appear at different frequencies (BR at 1526 cm–1, CaChR1 at 1532 cm–1, NpSRII at 1547 cm–1, and CrChR2 at 1553 cm–1) (Figure 2). Importantly, these variations are in agreement with the expected inverse relationship between λmax and νC=C found for most microbial rhodopsins. For example, λmax and νC=C of CaChR1 fall close to a best fit line that includes several microbial rhodopsins, including the dark-adapted form and M intermediate of BR (see Figure S3 of the Supporting Information).
In addition to the 1532 cm–1 band, a shoulder appears near 1545 cm–1 in the resonance Raman spectrum of CaChR1, which reflects an underlying band near 1549 cm–1 as revealed by curve fitting (see Figure S4 of the Supporting Information). It is possible that this band arises from a second form of CaChR1 that on the basis of the empirical correlation shown in Figure S3 of the Supporting Information would have a λmax near 480 nm. In fact, curve fitting of the visible absorption of light-adapted CaChR1 (Figure S1 of the Supporting Information) reveals a second component near this wavelength. However, this does not establish the existence of a second form of CaChR1, because multiple bands can appear in the visible absorption of retinal-containing proteins because of vibronic coupling. For example, in the case of NpSRII, a major band appears at ∼500 nm and two others attributed to vibronic coupling appear at 460 and 420 nm.35,36 The first vibronic band is separated from the major band by 1760 cm–1, which is not significantly different from the separation of the CaChR1 main band and curve-fit shoulder (1781 cm–1).
In the case of CrChR2, a second ethylenic band in the resonance Raman spectrum was also found by curve fitting at 1557 cm–1 and assigned to the presence of a second species having predominantly 13-cis-retinal.14 However, in the case of CaChR1, the two bands in the resonance Raman spectrum may arise from a single chromophore species that has two Raman-active ethylenic stretching modes as previously observed for the resonance Raman spectrum of the L intermediate of BR.37,38 The existence of multiple ethylenic modes is common for vibrational spectra of retinals and is actually expected for microbial rhodopsins, although in some cases only one mode dominates the resonance Raman spectrum. An additional possibility is that the second band at 1549 cm–1 arises from nonresonant Raman contributions of the protein (nonchromophore) such as the amide II vibration mode characteristic of α-helical protein structure. However, this mode is relatively weak in the nonresonance Raman spectra of proteins such as bovine opsin relative to the amide I and III modes.39 Because we do not observe contributions from the amide I mode except in the case in which CaChR1 is partially heat denatured where it appears at 1652 cm–1 (data not shown), it is unlikely the amide II mode contributes significantly to this shoulder. Further studies using differential isotope labeling of the retinal chromophore and protein are needed to distinguish among these various possibilities.
Assignment of the CaChR1 SB C=N Stretching Mode and Strength of Hydrogen Bonding
In general, the C=N SB stretching frequency (νC=N) depends on the bond strength of the C=N bond as well as coupling to other normal modes of the retinal. The C=N bond strength is directly influenced by molecular interactions with the SB such as hydrogen bonding to water molecules and the presence of nearby counterions (in the case of BR, Asp85 and Asp212).40 As shown in Figure 2, a small band appears at 1639 cm–1 in the resonance Raman spectrum of BR, which has been previously assigned to the SB C=N stretching mode (νC=N = 1639 cm–1).41 In contrast, a band appears at 1646 cm–1 in CaChR1 and at an even higher frequency, 1659 cm–1, in the case of CrChR2.14
To further confirm the assignment of the 1646 cm–1 band in CaChR1, D–H exchange was performed, which is expected to cause a frequency downshift.42 In addition, the magnitude of the downshift increases with the hydrogen bonding strength of the SB.41,43 As seen in Figure 3, in the case of CaChR1, this downshift is 26 cm–1 (from 1646 to 1620 cm–1) compared to 17 cm–1 for BR and 28 cm–1 for CrChR2.14 Thus, we concluded that CaChR1 and CrChR2 have stronger SB hydrogen bonds than BR. Interestingly, NpSRII, which as previously noted has a resonance Raman spectrum very similar to that of CaChR1, also has a similar H–D exchange-induced shift (23 cm–1).44 Other microbial rhodopsins with appreciable H–D exchange-induced shifts include green- and blue-absorbing proteorhodopsins (GPR at 23 cm–1 and BPR at 21 cm–1).29
Figure 3.

Comparison of resonance Raman spectra of BR and CaChR1 recorded in H2O and D2O. Data were recorded using the same conditions that are described in the legend of Figure 2. Additional details are given in Materials and Methods.
Effects of pH and Anions on the Resonance Raman Spectrum of CaChR1
The resonance Raman spectrum of CaChR1 remains largely unaltered over a wide pH range (Figure 4), including the configurationally sensitive fingerprint region. However, curve fitting the main ethylenic band reveals it undergoes a monotonic downshift of ∼2–3 cm–1 with a decrease in pH from pH 9 to 2 (Figure S5 of the Supporting Information), which corresponds to a red shift of λmax of ∼8–12 nm based on the correlation shown in Figure S3 of the Supporting Information. This is fully consistent with the visible absorption changes observed for pH titration of CaChR1 in detergent where three pKa values are found at pH 9, 5.5, and 2.2 Although the pKa values are expected to be somewhat shifted upon comparison of membrane-reconstituted and detergent-solubilized CaChR1, it is likely the red shifts we deduce from the shifts in νC=C of only 8–12 nm correspond to the red shift observed in detergent micelles going from pH 8 to 2 and involve mainly titratable groups with pKa values of 5.5 and 2.
Figure 4.

Resonance Raman spectra of CaChR1 recorded at various pH values ranging from 2 to 9. All conditions used for RRS were the same as those described in the legend of Figure 2. Additional details are given in Materials and Methods.
The relatively small downshift of the ethylenic stretching frequency and insensitivity in other regions such as the fingerprint of the CaChR1 resonance Raman spectrum between pH 9 and 2 are very unusual. For example, the primary counterion, Asp85, in BR undergoes a protonation below pH 3 that causes a pronounced red shift in λmax from 570 to ∼600 nm and a downshift in νC=C from 1527 to 1518 cm–1.45 This effect can be partially explained if the homologous residue Glu169 in CaChR1 is already protonated at pH <9 as recently predicted on the basis of visible absorption pH titration studies.2 However, at lower pH values, one might then expect that a second counterion (i.e., Asp299) undergoing protonation would cause a red shift larger than that observed as discussed below.
The effect of changing the anion species from Cl– to SO42– at pH 3 was also measured. As shown in Figure S6 of the Supporting Information, increasing the NaCl concentration from 10 mM to 2 M or switching to 1 M Na2SO4 has little effect on the ethylenic or fingerprint region, indicating that an anion does not interact closely with the SB proton at this pH (see Discussion). Note that contributions from opsin are also detected in the 2 M NaCl spectrum as apparent from bands appearing at 1652, 1450, and 1003 cm–1 that are assigned to the amide I, methyl, and phenylalanine vibrations, respectively (for example, see ref (39)). In the case of the Na2SO4 spectrum, opsin contributions were partially removed by subtracting the spectrum of CaChR1 opsin obtained after bleaching of the chromophore due to prolonged illumination. In addition, the band at 961 cm–1 is assigned to a sulfate vibration.
Effects of Substitution of Glu169 and Asp299
The CaChR1 residues homologous to the SB counterions Asp85 and Asp212 in BR are Glu169 and Asp299, respectively. These residues are located in helices C and G, respectively (see Figure 1), and comprise along with a nearby water molecule (W402) the SB counterion complex. Conservative substitution of Glu169 with a neutral residue (Glu to Gln), based on effects of such substitutions in BR and other type 1 rhodopsins, would be expected to cause a substantial red shift of λmax and upshift of νC=C. For example, the λmax of the mutant BR D85N (Asp to Asn) is red-shifted ∼30 nm and the νC=C is downshifted 7 cm–1,46 similar to the case for the acidified or deionized blue membrane.45 In addition, the full width at half-maximum of D85N increases significantly from 19 to 31 cm–1, which was attributed to an increase in 13-cis-retinal content.46 Similar effects result from the low pH or deionization-induced purple-to-blue transition of BR in which Asp85 is neutral due to protonation.45 In both cases, a mixture of all-trans- and 13-cis-retinal as in dark-adapted BR was deduced from the resonance Raman spectrum. One exception to this type of effect is Anabaena sensory rhodopsin (ASR), in which the Asp212 homologue is replaced with a neutral threonine.47
In contrast, the νC=C of the ethylenic band for the CaChR1 E169Q mutant upshifts ∼2 cm–1 relative to the WT and does not undergo a change in the intensity of the full width at half-maximum (Figure 5). On the basis of curve fitting (see Figure S3 of the Supporting Information), the full width at half-maximum of the main component band and shoulder-fit band are 21 and 11 cm–1 versus 20 and 15 cm–1 for WT and E169Q, respectively. As predicted by the inverse relationship between λmax and νC=C (Figure S3 of the Supporting Information), in contrast to the significant red shift in BR D85N, a blue shift of λmax by ∼10 nm should occur, which is confirmed by visible absorption measurement in both films and membrane suspensions (data not shown) and also is in agreement with E169Q CaChR1 solubilized in detergent.2
Figure 5.

Resonance Raman spectra of CaChR1 and mutants E169Q and D299N. All conditions used for RRS were the same as those described in the legend of Figure 2. Additional details are given in Materials and Methods.
The C–C stretch fingerprint region indicates that E169Q remains mainly in an all-trans configuration with only a small increase observed in the intensity of the 1184 cm–1 band as compared, for example, to that of acid blue or deionized BR for which significant increases in intensity of a band near 1184 cm–1 are observed.45 We conclude that the small blue shift observed in CaChR1 E169Q is not due to increased 13-cis-retinal content in the mutant masking a red shift of the all-trans component. It is also noted that the SB C=N stretch frequency upshifts to 1652 cm–1 even though neutralization of this homologous residue in other microbial rhodopsins causes a downshift.46 For example, in D85N the SB C=N downshifts 6 cm–148 and in acid blue or deionized BR the SB C=N downshifts approximately 10 cm–1.45.
Interestingly, almost identical changes compared to WT occur in the resonance Raman spectrum of the mutant D299N. For example, the νC=C upshifts ∼3 cm–1, slightly more than that of E169Q, which is confirmed by a slightly greater blue shift of the visible λmax.2 Like that of E169Q, the νC=N upshifts to 1652 cm–1, and the fingerprint region remains substantially unchanged.
Discussion and Conclusions
The light-gated channel activity of heterologously expressed ChRs in neurons has led to significant interest in their structure and molecular mechanisms of action.49 Despite this interest, relatively few studies have focused on the molecular mechanism of ChRs besides CrChR2. However, ChRs display considerable diversity even within the same genus of Chlamydomonas. This includes differences in visible absorption, photocycle and current kinetics, light inactivation, pH sensitivity, and channel conductivity.17
In this work, we used near-IR confocal RRS to study the chromophore and electrostatic interactions near the protonated SB of a ChR1 from C. augustae (CaChR1). On the basis of these measurements and earlier studies, several conclusions about the retinal structure in CaChR1 and the interaction of the nearby counterions Glu169 and Asp299 with the SB have been reached.
Light-Adapted CaChR1 Has an all-trans-Retinal Composition Similar to That of BR and NpSRII in Contrast to That of CrChR2
RRS indicates that the retinal chromophore of CaChR1 is similar to the structure and isomeric composition of light-adapted BR. Recent FTIR difference measurements of the CaChR1 primary phototransition at low temperatures also confirm that CaChR1 has a predominantly all-trans retinylidene chromophore in contrast to a mixed isomeric composition of the retinylidene chromophore in CrChR2 (unpublished experiment). One difference in the chromophore configuration of CaChR1 and BR may be near the C10–C11 portion of the retinal that has a slightly lower frequency for the fingerprint band assigned to that mode in CaChR1 compared to BR (see Figure 2). However, this effect may also be due to differences in the interaction of the protein with other regions of the retinal chromophore, causing mode mixing to which this band is very sensitive.24 Importantly, these results with CaChR1 contrast with RRS measurements of CrChR2, which contains bands in the fingerprint region reflecting a mixture of all-trans- and 13-cis-retinal-containing species (see Figure 2) and earlier results.16,50
Even more striking are the nearly identical resonance Raman spectra of CaChR1 and the phototaxis receptor NpSRII (Figure 2). This spectrum recorded using 785 nm excitation is almost identical to the resonance Raman spectra reported previously using 514 nm excitation and a spinning cell designed to eliminate contributions from long-lived intermediates of the NpSRII photocycle (M, N, and O) and minimize contributions from K (0.1%) and L (1.3%).24 This similarity strongly indicates that both microbial rhodopsins have very similar retinal structures. Furthermore, a combined quantum chemical/normal mode approach indicates that the spectrum of NpSRII best reflects an all-trans 15-anti protonated Schiff base (PSB) structure similar to that of BR. However, differences with the BR resonance Raman spectrum such as shifts in band frequency and intensity in the ethylenic and fingerprint region were attributed to a stronger interaction of the counterion(s) with the SB in NpSRII, thus also explaining the blue-shifted λmax relative to that of BR.24 On this basis, we surmise that the differences between the resonance Raman spectra of BR and CaChR1 are also due to differences mainly near the SB region of the chromophore and its interaction with its counterion(s).
Several other features also suggest the similarity of the CaChR1 and NpSRII retinal chromophores. As discussed below, NpSRII and CaChR1 both have much stronger hydrogen bonding of the SB than BR.24 In addition, the absence of dark adaptation in both proteins indicates that the binding pocket does not easily accommodate a 13-cis-retinal configuration as previously suggested for NpSRII based on measurement of the rate of 13-cis-retinal regeneration.27 It is also noted that like CaChR1, the ethylenic band of NpSRII measured by RRS was fit by two subcomponent ethylenic bands both attributable to the same all-trans-retinal species.24
Confirming the absence of significant light–dark adaptation, we observed no significant resonance Raman spectral changes upon green light illumination during the acquisition of resonance Raman spectra (Figure S2 of the Supporting Information). Furthermore, the 785 nm laser excitation used to record the resonance Raman spectra is far from the visible absorption λmax of CaChR1 near 525 nm and hence not likely to produce photocycle intermediates even in cases where the longest photointermediate decay time is a few seconds. As noted above, the similarity of the resonance Raman spectra of NpSRII that has a slowly decaying O intermediate of a few seconds recorded using photostationary 785 nm excitation here and under conditions where the photointermediates are minimized24 also supports this conclusion.
The Schiff Base Has Hydrogen Bonding Stronger Than That of BR
The RRS-measured H–D exchange-induced downshift of the C=N vibrational mode (νC=N) of the retinylidene SB in CaChR1 indicates that the SB forms a hydrogen bond that is stronger than that of BR. A similar conclusion was also reached on the basis of the H–D exchange-induced shift for the C=N vibrational mode of CrChR2.14 One possible explanation is suggested by the crystal structure of the C1C2 chimera that shows a movement of water molecule W402 found in BR away from the SB15 (Figure 6). In this position, the water closest to the SB in CaChR1 may not be able to act to “soften” the hydrogen bonding interaction of the counterion(s) with the SB (see below).
Figure 6.
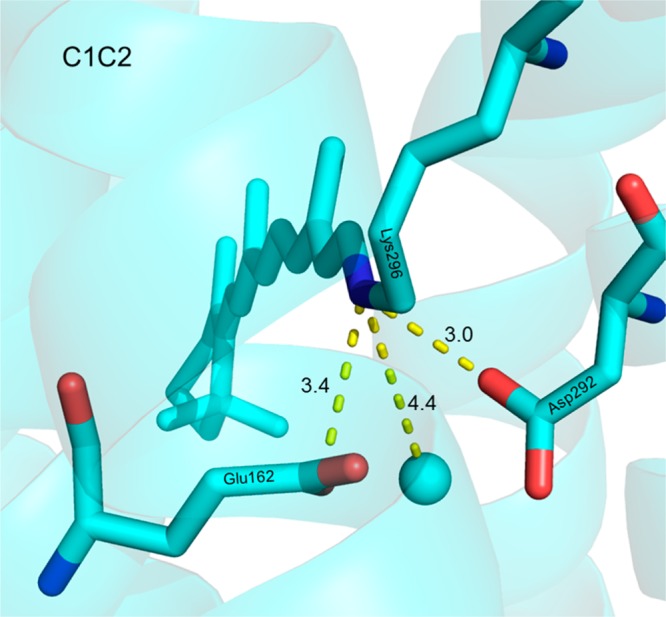
Three-dimensional structure of the C1C2 chimera from ref (15) (Protein Data Bank entry 3UG9) showing an internal water molecule (blue sphere) located 4.4 Å from the SB (blue bond). Residues of CaChR1 are homologous to E162 and D292 in the CrChR1 sequence.
Glu169 Exists in a Neutral Form at Neutral pH
With a decrease in pH from 9 to 2, a red shift in λmax of ∼8–12 nm was deduced. Furthermore, substitution of the neutral residue Gln for Glu169 caused a small upshift in νC=C confirming a reported blue shift in λmax.2 However, on the basis of the effect of neutralizing the homologous residue Asp85 in BR, a significant downshift in νC=C and a red shift in λmax should occur if Glu169 functioned as the predominant SB counterion at neutral pH.40 Furthermore, the absence of a smaller than expected red shift or even a blue shift as observed in the case of E169Q cannot be explained by postulating that the chromophore adopts a non-all-trans configuration (e.g., 13-cis) because the fingerprint region remains substantially unchanged and characteristic of an all-trans chromophore.
An explanation for these effects is that Glu169 has a very high pKa. In this case, substitution with another neutral group (Gln) should not cause a red shift, and pH titration below the pKa would also not cause a substantial change in λmax. In fact, the pKa of Glu169 was determined to be near 9 in detergent micelles by pH titration of the visible absorption of CaChR1 and the mutant E169Q.2CaChR1 reconstituted in E. coli polar lipid membranes may have a pKa even higher than that in detergent micelles because we do not observe a substantial blue shift in λmax deduced from the νC=C. Such a pKa shift would be expected if the surface charge near CaChR1 were altered in these two different environments as is observed in the case the BR for the pKa of the purple-to-blue transition.51
Asp299 Serves as the Predominant SB Counterion over a Broad pH Range
The CaChR1 SB has a hydrogen bond strength that is greater than that of BR (The Schiff Base Has Hydrogen Bonding Stronger Than That of BR), yet Glu169, the residue homologous to Asp85 that in BR acts as the primary counterion, exists in a neutral form (Glu169 Exists in a Neutral Form at Neutral pH) over a wide pH range. This indicates that another counterion or counterion complex interacts strongly with the SB. An attractive candidate is Asp299, which is homologous to Asp212 in BR and exists in an ionized form along with Asp85.
However, one problem with this model is that the pKa for Asp299 was determined on the basis of site-directed mutagenesis and pH titrations to be near 5.2 This would thus indicate that below pH 5, both Glu169 and Asp299 exist in a neutral form, providing no effective counterbalancing negative anionic charge for the positively charged SB. Under these circumstances, we would expect to observe a downshift of νC=C much larger than that observed (∼1–2 cm–1) upon titration from pH 7 to 2 (corresponding to only a 4–8 nm red shift in λmax) (see Figure S3 of the Supporting Information), in good agreement with the reported red shift for CaChR1 in detergent over the same pH range.2 Furthermore, the νC=N does not shift appreciably over this pH range, which would be expected if the SB counterions were neutral. For example, neutralization of the primary BR counterion, Asp85, by either lowering the pH or substituting a neutral residue results in ∼7 and 6–10 cm–1 downshifts in νC=C and νC=N, respectively.45,46
It is likely for this reason that another source(s) of negative charge compensation near the PSB comes into play at very low pH in CaChR1. One possibility is that a negative anion enters the active site of CaChR1 and serves as the counterion to the PSB. FTIR difference studies indicate that movement of a Cl– ion to near the PSB occurs in BR when both counterions are neutral at pH ∼0.52 On the basis of resonance Raman spectra, the retinal chromophore for this acid form of BR has an all-trans-retinal chromophore very similar to light-adapted BR, including similar ethylenic and C=N SB stretching frequencies.45 Entry of an anion has also been reported in sensory rhodopsin I from Salinibacter ruber (SrSRI) but near the β-ionone ring of the retinal chromophore.53,54 However, no spectral changes in the resonance Raman spectra were observed for CaChR1 when measured in 2 M NaCl or 1 M Na2SO4, as described in Results. In addition, no difference in the visible absorption was found between mutants E169Q and D299N for 100 mM NaCl and Na2SO4 solutions.2
A second possibility is that other negatively charged residues located nearby the PSB assume the role of counterion(s). In the case of ChRs, there are several residues with yet unknown pKa values that could serve this role. For example, Glu136 (Glu90 in CrChR2) located on helix B is ∼6 Å from the PSB in the C1C2 structure and may be pulled closer below pH 5 when both Glu169 and Asp299 are expected to be neutral. Other residues such as Glu128 and Glu129 also on helix B are possible candidates but are located >9 Å from the PSB.15
Another possible explanation for the absence of larger changes in the resonance Raman spectra at lower pH is that protonation of Asp299 causes a concerted deprotonation of Glu169, which then becomes the predominant counterion for the SB. Such a deprotonation was also proposed to occur when Asp299 is replaced with Asn, to explain the apparent ability of Glu169 to function as the SB proton acceptor in D299N at neutral pH.2 Such an effect might be caused by a strong mutual electrostatic interaction among Glu169, Asp299, and the SB, which acts to maintain overall change neutrality in the active site between the positively charged SB and the Glu169–Asp299 complex. Such a direct interaction is suggested by the position of an internal water molecule in C1C2 that is similar to that of W402 in BR but is located 4.4 Å from the SB compared to 2.8 Å in BR (see Figure 6).15 Because W402 in BR is in a position to mediate the electrostatic interaction of the SB with Asp85 and Asp212, moving this water farther away may allow more direct interactions of these residues with the SB. In fact, on the basis of low-temperature FTIR measurements of C1C2, it was concluded recently that Glu162, the homologue of Glu169 in CaChR1, interacts directly with the PSB without the intervening water molecule found in BR.55 However, this model contrasts with the one we propose for CaChR1 where Glu169 exists in a protonated form and Asp299 acts as the predominant counterion for the PSB at neutral pH. Further studies are now underway, including low-temperature FTIR measurements of CaChR1, to distinguish these various possibilities.
Acknowledgments
We thank Erica Saint-Claire and Jihong Wang who participated in the early stages of this project.
Glossary
Abbreviations
- ChRs
channelrhodopsins
- RRS
resonance Raman spectroscopy
- FTIR
Fourier transform infrared
- CaChR1
channelrhodopsin-1 from C. augustae
- CrChR2
channelrhodopsin-2 from C. reinhardtii
- BR
bacteriorhodopsin
- H–D exchange
hydrogen–deuterium exchange
- SB
Schiff base
- C1C2
chimera of CrChR1 and CrChR2
- PSB
protonated Schiff base.
Supporting Information Available
Examples of peak fitting for both UV–vis data and RRS data (Figures S1 and S4), a comparison of resonance Raman spectra taken with low laser power and CW illumination (Figure S2), illustration of the inverse linear correlation between the resonance Raman spectral ethylenic frequency and the visible absorption wavelength maximum for various microbial rhodopsins (Figure S3), dependence of the ethylenic frequency on pH obtained by peak fitting RRS data (Figure S5), and RRS data showing the effect of concentration and anion type (Figure S6). This material is available free of charge via the Internet at http://pubs.acs.org.
This work was supported by National Science Foundation Grant CBET-1264434 and National Institutes of Health Grant 5R01EY21022 to K.J.R. and National Institutes of Health Grants R01GM027750 and R21MH098288, the Hermann Eye Fund, and Endowed Chair AU-0009 from the Robert A. Welch Foundation to J.L.S.
The authors declare no competing financial interest.
Funding Statement
National Institutes of Health, United States
Supplementary Material
References
- Sineshchekov O. A.; Govorunova E. G.; Wang J.; Li H.; Spudich J. L. (2013) Intramolecular proton transfer in channelrhodopsins. Biophys. J. 104, 807–817. [DOI] [PMC free article] [PubMed] [Google Scholar]
- Li H.; Govorunova E. G.; Sineshchekov O. A.; Spudich J. L. (2014) Role of a helix B lysine residue in the photoactive site in channelrhodopsins. Biophys. J. 106, 1607–1617. [DOI] [PMC free article] [PubMed] [Google Scholar]
- Zhang F.; Vierock J.; Yizhar O.; Fenno L. E.; Tsunoda S.; Kianianmomeni A.; Prigge M.; Berndt A.; Cushman J.; Polle J.; Magnuson J.; Hegemann P.; Deisseroth K. (2011) The microbial opsin family of optogenetic tools. Cell 147, 1446–1457. [DOI] [PMC free article] [PubMed] [Google Scholar]
- Sharma A. K.; Spudich J. L.; Doolittle W. F. (2006) Microbial rhodopsins: Functional versatility and genetic mobility. Trends Microbiol. 14, 463–469. [DOI] [PubMed] [Google Scholar]
- Boyden E. S.; Zhang F.; Bamberg E.; Nagel G.; Deisseroth K. (2005) Millisecond-timescale, genetically targeted optical control of neural activity. Nat. Neurosci. 8, 1263–1268. [DOI] [PubMed] [Google Scholar]
- Deisseroth K. (2011) Optogenetics. Nat. Methods 8, 26–29. [DOI] [PMC free article] [PubMed] [Google Scholar]
- Alivisatos A. P.; Andrews A. M.; Boyden E. S.; Chun M.; Church G. M.; Deisseroth K.; Donoghue J. P.; Fraser S. E.; Lippincott-Schwartz J.; Looger L. L.; Masmanidis S.; McEuen P. L.; Nurmikko A. V.; Park H.; Peterka D. S.; Reid C.; Roukes M. L.; Scherer A.; Schnitzer M.; Sejnowski T. J.; Shepard K. L.; Tsao D.; Turrigiano G.; Weiss P. S.; Xu C.; Yuste R.; Zhuang X. (2013) Nanotools for neuroscience and brain activity mapping. ACS Nano 7, 1850–1866. [DOI] [PMC free article] [PubMed] [Google Scholar]
- Arenkiel B. R.; Peca J.; Davison I. G.; Feliciano C.; Deisseroth K.; Augustine G. J.; Ehlers M. D.; Feng G. (2007) In vivo light-induced activation of neural circuitry in transgenic mice expressing channelrhodopsin-2. Neuron 54, 205–218. [DOI] [PMC free article] [PubMed] [Google Scholar]
- Abilez O. J.; Wong J.; Prakash R.; Deisseroth K.; Zarins C. K.; Kuhl E. (2011) Multiscale computational models for optogenetic control of cardiac function. Biophys. J. 101, 1326–1334. [DOI] [PMC free article] [PubMed] [Google Scholar]
- Sineshchekov O. A.; Jung K. H.; Spudich J. L. (2002) Two rhodopsins mediate phototaxis to low- and high-intensity light in Chlamydomonas reinhardtii. Proc. Natl. Acad. Sci. U.S.A. 99, 8689–8694. [DOI] [PMC free article] [PubMed] [Google Scholar]
- Nagel G.; Szellas T.; Huhn W.; Kateriya S.; Adeishvili N.; Berthold P.; Ollig D.; Hegemann P.; Bamberg E. (2003) Channelrhodopsin-2, a directly light-gated cation-selective membrane channel. Proc. Natl. Acad. Sci. U.S.A. 100, 13940–13945. [DOI] [PMC free article] [PubMed] [Google Scholar]
- Spudich J. L.; Sineshchekov O. A.; Govorunova E. G. (2014) Mechanism divergence in microbial rhodopsins. Biochim. Biophys. Acta 1837, 546–552. [DOI] [PMC free article] [PubMed] [Google Scholar]
- Smith S. O.; Myers A. B.; Pardoen J. A.; Winkel C.; Mulder P. P.; Lugtenburg J.; Mathies R. (1984) Determination of retinal Schiff base configuration in bacteriorhodopsin. Proc. Natl. Acad. Sci. U.S.A. 81, 2055–2059. [DOI] [PMC free article] [PubMed] [Google Scholar]
- Nack M.; Radu I.; Bamann C.; Bamberg E.; Heberle J. (2009) The retinal structure of channelrhodopsin-2 assessed by resonance Raman spectroscopy. FEBS Lett. 583, 3676–3680. [DOI] [PubMed] [Google Scholar]
- Kato H. E.; Zhang F.; Yizhar O.; Ramakrishnan C.; Nishizawa T.; Hirata K.; Ito J.; Aita Y.; Tsukazaki T.; Hayashi S.; Hegemann P.; Maturana A. D.; Ishitani R.; Deisseroth K.; Nureki O. (2012) Crystal structure of the channelrhodopsin light-gated cation channel. Nature 482, 369–374. [DOI] [PMC free article] [PubMed] [Google Scholar]
- Lorenz-Fonfria V. A.; Resler T.; Krause N.; Nack M.; Gossing M.; Fischer von Mollard G.; Bamann C.; Bamberg E.; Schlesinger R.; Heberle J. (2013) Transient protonation changes in channelrhodopsin-2 and their relevance to channel gating. Proc. Natl. Acad. Sci. U.S.A. 110, E1273–E1281. [DOI] [PMC free article] [PubMed] [Google Scholar]
- Hou S. Y.; Govorunova E. G.; Ntefidou M.; Lane C. E.; Spudich E. N.; Sineshchekov O. A.; Spudich J. L. (2012) Diversity of Chlamydomonas channelrhodopsins. Photochem. Photobiol. 88, 119–128. [DOI] [PMC free article] [PubMed] [Google Scholar]
- Radu I.; Bamann C.; Nack M.; Nagel G.; Bamberg E.; Heberle J. (2009) Conformational changes of channelrhodopsin-2. J. Am. Chem. Soc. 131, 7313–7319. [DOI] [PubMed] [Google Scholar]
- Bamann C.; Gueta R.; Kleinlogel S.; Nagel G.; Bamberg E. (2010) Structural guidance of the photocycle of channelrhodopsin-2 by an interhelical hydrogen bond. Biochemistry 49, 267–278. [DOI] [PubMed] [Google Scholar]
- Saint Clair E. C.; Ogren J. I.; Mamaev S.; Russano D.; Kralj J. M.; Rothschild K. J. (2012) Near-IR resonance Raman spectroscopy of archaerhodopsin 3: Effects of transmembrane potential. J. Phys. Chem. B 116, 14592–14601. [DOI] [PMC free article] [PubMed] [Google Scholar]
- Rothschild K. J.; Marrero H.; Braiman M.; Mathies R. (1984) Primary photochemistry of bacteriorhodopsin: Comparison of Fourier transform infrared difference spectra with resonance Raman spectra. Photochem. Photobiol. 40, 675–679. [DOI] [PubMed] [Google Scholar]
- Smith S. O.; Lugtenburg J.; Mathies R. A. (1985) Determination of retinal chromophore structure in bacteriorhodopsin with resonance Raman spectroscopy. J. Membr. Biol. 85, 95–109. [DOI] [PubMed] [Google Scholar]
- Smith S. O.; Myers A. B.; Mathies R. A.; Pardoen J. A.; Winkel C.; Van den Berg E. M. M.; Lugtenburg J. (1985) Vibrational analysis of the all-trans retinal protonated Schiff base. Biophys. J. 47(45), 653–664. [DOI] [PMC free article] [PubMed] [Google Scholar]
- Neumann H. (2009) NpSRII photocycle and its dependence on the electric field: A combined quantum chemical and Raman spectroscopic study. Ph.D. Thesis, Mathematik und Naturwissenschaften der Technischen Universiẗat Berlin, Berlin. [Google Scholar]
- Smith S. O.; Braiman M. S.; Myers A. B.; Pardoen J. A.; Courtin J. M. L.; Winkel C.; Lugtenburg J.; Mathies R. A. (1987) Vibrational analysis of the all-trans-retinal chromophore in light-adapted bacteriorhodopsin. J. Am. Chem. Soc. 109, 3108–3125. [Google Scholar]
- Smith S. O.; de Groot H. J.; Gebhard R.; Courtin J. M.; Lugtenburg J.; Herzfeld J.; Griffin R. G. (1989) Structure and protein environment of the retinal chromophore in light- and dark-adapted bacteriorhodopsin studied by solid-state NMR. Biochemistry 28, 8897–8904. [DOI] [PubMed] [Google Scholar]
- Hirayma J.; Kamo N.; Imamoto Y.; Shichida Y.; Yoshizawa T. (1995) Reason for the lack of light-dark adaptation in pharaonis phoborhodopsin: Reconstitution with 13-cis-retinal. FEBS Lett. 364, 168–170. [DOI] [PubMed] [Google Scholar]
- Smith S. O.; Hornung I.; Van der Steen R.; Pardoen J. A.; Braiman M. S.; Lugtenburg J.; Mathies R. A. (1986) Are C14-C15 single bond isomerizations of the retinal chromophore involved in the proton-pumping mechanism of bacteriorhodopsin?. Proc. Natl. Acad. Sci. U.S.A. 83, 967–971. [DOI] [PMC free article] [PubMed] [Google Scholar]
- Kralj J. M.; Spudich E. N.; Spudich J. L.; Rothschild K. J. (2008) Raman spectroscopy reveals direct chromophore interactions in the Leu/Gln105 spectral tuning switch of proteorhodopsins. J. Phys. Chem. B 112, 11770–11776. [DOI] [PMC free article] [PubMed] [Google Scholar]
- Smith S. O.; Pardoen J. A.; Lugtenburg J.; Mathies R. A. (1987) Vibrational analysis of the 13-cis-retinal chromophore in dark-adapted bacteriorhodopsin. J. Phys. Chem. 91, 804–819. [Google Scholar]
- Bousche O.; Braiman M.; He Y. W.; Marti T.; Khorana H. G.; Rothschild K. J. (1991) Vibrational spectroscopy of bacteriorhodopsin mutants. Evidence that ASP-96 deprotonates during the M to N transition. J. Biol. Chem. 266, 11063–11067. [PubMed] [Google Scholar]
- Bousche O.; Sonar S.; Krebs M. P.; Khorana H. G.; Rothschild K. J. (1992) Time-resolved Fourier transform infrared spectroscopy of the bacteriorhodopsin mutant Tyr-185 → Phe: Asp-96 reprotonates during O formation; Asp-85 and Asp-212 deprotonate during O decay. Photochem. Photobiol. 56, 1085–1095. [DOI] [PubMed] [Google Scholar]
- Fodor S. P. A.; Ames J. B.; Gebhard R.; Van den Berg E. M. M.; Stoeckenius W.; Lugtenburg J.; Mathies R. A. (1988) Chromophore structure in bacteriorhodopsin’s N intermediate: Implications for the proton-pumping mechanism. Biochemistry 27, 7097–7101. [DOI] [PubMed] [Google Scholar]
- Chizhov I.; Schmies G.; Seidel R.; Sydor J. R.; Luttenberg B.; Engelhard M. (1998) The photophobic receptor from Natronobacterium pharaonis: Temperature and pH dependencies of the photocycle of sensory rhodopsin II. Biophys. J. 75, 999–1009. [DOI] [PMC free article] [PubMed] [Google Scholar]
- Takahashi T.; Yan B.; Mazur P.; Derguini F.; Nakanishi K.; Spudich J. L. (1990) Color regulation in the archaebacterial phototaxis receptor phoborhodopsin (sensory rhodopsin II). Biochemistry 29, 8467–8474. [DOI] [PubMed] [Google Scholar]
- Argade P. V. R.; Kenneth J. (1983) Quantitative analysis of resonance Raman spectra of purple membrane from Halobacterium halobium: L550 intermediate. Biochemistry 22, 3460–3466. [Google Scholar]
- Fodor S. P.; Pollard W. T.; Gebhard R.; van den Berg E. M.; Lugtenburg J.; Mathies R. A. (1988) Bacteriorhodopsin’s L550 intermediate contains a C14-C15 s-trans-retinal chromophore. Proc. Natl. Acad. Sci. U.S.A. 85, 2156–2160. [DOI] [PMC free article] [PubMed] [Google Scholar]
- Rothschild K. J.; Andrew J.; DeGrip W. J.; Stanley H. E. (1976) Opsin Structure Probed by Raman Spectroscopy of Photorecptor Membranes. Science 191, 1176–1178. [DOI] [PubMed] [Google Scholar]
- Honig B.; Dinur U.; Nakanishi K.; Balogh-Nair V.; Gawinowicz M. A.; Arnaboldi M.; Motto M. G. (1979) An external point-charge model for wavelength regulation in visual pigments. J. Am. Chem. Soc. 101, 7084–7086. [Google Scholar]
- Lewis A.; Spoonhower J.; Bogomolni R. A.; Lozier R. H.; Stoeckenius W. (1974) Tunable laser resonance Raman spectroscopy of bacteriorhodopsin. Proc. Natl. Acad. Sci. U.S.A. 71, 4462–4466. [DOI] [PMC free article] [PubMed] [Google Scholar]
- Smith S. O.; Myers A. B.; Mathies R. A.; Pardoen J. A.; Winkel C.; van den Berg E. M.; Lugtenburg J. (1985) Vibrational analysis of the all-trans retinal protonated Schiff base. Biophys. J. 47, 653–664. [DOI] [PMC free article] [PubMed] [Google Scholar]
- Baasov T.; Friedman N.; Sheves M. (1987) Factors affecting the C:N stretching in protonated retinal Schiff base: A model study for bacteriorhodopsin and visual pigments. Biochemistry 26, 3210–3217. [DOI] [PubMed] [Google Scholar]
- Gellini C.; Luttenberg B.; Sydor J.; Engelhard M.; Hildebrandt P. (2000) Resonance Raman spectroscopy of sensory rhodopsin II from Natronobacterium pharaonis. FEBS Lett. 472, 263–266. [DOI] [PubMed] [Google Scholar]
- Smith S. O.; Mathies R. A. (1985) Resonance Raman spectra of the acidified and deionized forms of bacteriorhodopsin. Biophys. J. 47, 251–254. [DOI] [PMC free article] [PubMed] [Google Scholar]
- Rath P.; Marti T.; Sonar S.; Khorana H. G.; Rothschild K. J. (1993) Hydrogen Bonding Interactions with the Schiff Base of Bacteriorhodopsin: Resonance Raman Spectroscopy of the Mutants D85N and D85A. J. Biol. Chem. 268, 17742–17749. [PubMed] [Google Scholar]
- Bergo V. B.; Ntefidou M.; Trivedi V. D.; Amsden J. J.; Kralj J. M.; Rothschild K. J.; Spudich J. L. (2006) Conformational changes in the photocycle of Anabaena sensory rhodopsin: Absence of the Schiff base counterion protonation signal. J. Biol. Chem. 281, 15208–15214. [DOI] [PubMed] [Google Scholar]
- Rath P.; Marti T.; Sonar S.; Khorana H. G.; Rothschild K. J. (1993) Hydrogen bonding interactions with the Schiff base of bacteriorhodopsin. Resonance Raman spectroscopy of the mutants D85N and D85A. J. Biol. Chem. 268, 17742–17749. [PubMed] [Google Scholar]
- Hegemann P.; Nagel G. (2013) From channelrhodopsins to optogenetics. EMBO Mol. Med. 5, 173–176. [DOI] [PMC free article] [PubMed] [Google Scholar]
- Ritter E.; Stehfest K.; Berndt A.; Hegemann P.; Bartl F. J. (2008) Monitoring light-induced structural changes of Channelrhodopsin-2 by UV-visible and Fourier transform infrared spectroscopy. J. Biol. Chem. 283, 35033–35041. [DOI] [PMC free article] [PubMed] [Google Scholar]
- Szundi I.; Stoeckenius W. (1987) Effect of lipid surface charges on the purple-to-blue transition of bacteriorhodopsin. Proc. Natl. Acad. Sci. U.S.A. 84, 3681–3684. [DOI] [PMC free article] [PubMed] [Google Scholar]
- Kelemen L.; Galajda P.; Szaraz S.; Ormos P. (1999) Chloride ion binding to bacteriorhodopsin at low pH: An infrared spectroscopic study. Biophys. J. 76, 1951–1958. [DOI] [PMC free article] [PubMed] [Google Scholar]
- Suzuki D.; Furutani Y.; Inoue K.; Kikukawa T.; Sakai M.; Fujii M.; Kandori H.; Homma M.; Sudo Y. (2009) Effects of chloride ion binding on the photochemical properties of salinibacter sensory rhodopsin I. J. Mol. Biol. 392, 48–62. [DOI] [PubMed] [Google Scholar]
- Reissig L.; Iwata T.; Kikukawa T.; Demura M.; Kamo N.; Kandori H.; Sudo Y. (2012) Influence of halide binding on the hydrogen bonding network in the active site of Salinibacter sensory rhodopsin I. Biochemistry 51, 8802–8813. [DOI] [PubMed] [Google Scholar]
- Ito S.; Kato H. E.; Taniguchi R.; Iwata T.; Nureki O.; Kandori H. (2014) Water-containing hydrogen-bonding network in the active center of channelrhodopsin. J. Am. Chem. Soc. 136, 3475–3482. [DOI] [PubMed] [Google Scholar]
- Ming M.; Lu M.; Balashov S. P.; Ebrey T. G.; Li Q.; Ding J. (2006) pH dependence of light-driven proton pumping by an archaerhodopsin from Tibet: Comparison with bacteriorhodopsin. Biophys. J. 90, 3322–3332. [DOI] [PMC free article] [PubMed] [Google Scholar]
Associated Data
This section collects any data citations, data availability statements, or supplementary materials included in this article.