Abstract
This paper proposes a novel prewhitening eigenspace beamformer suitable for magnetoencephalogram (MEG) source reconstruction when large background brain activities exist. The prerequisite for the method is that control-state measurements, which contain only the contributions from the background interference, be available, and that the covariance matrix of the background interference can be obtained from such control-state measurements. The proposed method then uses this interference covariance matrix to remove the influence of the interference in the reconstruction obtained from the target measurements. A numerical example, as well as applications to two types of MEG data, demonstrates the effectiveness of the proposed method.
Index Terms: Adaptive beamforming, brain noise, magnetoencephalography, prewhitening, source reconstruction
I. Introduction
One major problem with magnetoencephalogram (MEG) measurements is that measured MEG signal generally contains interfering magnetic fields generated from spontaneous brain activities. Such background interference degrades the quality of the source reconstruction results, and often make interpreting the reconstruction results difficult. Therefore, the background interference is sometimes referred to as brain noise or physiological noise. The degradation is particularly severe in adaptive beamformer source reconstruction methods [1], [2] because the high-rank nature of the background spontaneous activity [3], [4] may invalidate the underlying low-rank signal assumption necessary for formulating the adaptive beamformers. We show in Section III that the background brain activity can cause a significant reduction in the source intensity and severe spatial blur in adaptive-beamformer reconstruction results.
This paper proposes a novel prewhitening eigenspace beamformer, which can attain the source reconstruction free from the influence of background interference when a large amount of background activity exists. The prerequisite for the proposed method is that control-state measurements, which contain only the contributions from the background interference, be available, and that the covariance matrix of the background interference can be obtained from such control-state measurements. The proposed method then uses this interference covariance matrix to remove the influence of the interference in the reconstruction results obtained from the target measurements where both signal and interference exist.
The proposed beamformer is particularly useful for reconstructing source activities that are stimulus-evoked but not time-locked to the stimulus. Since signals from such nontime-locked activities are generally averaged out through the epoch-averaging process, the beamformer weight should be derived using a covariance matrix obtained from nonaveraged raw epochs. However, the nonaveraged epochs generally contain a large amount of background interference whose amplitude is usually considerably larger than that of the evoked activity. Therefore, the successful reconstruction of nontime-locked activities requires removing the influence of the background interference. In Section IV-B, we show one such example in which primary hand-motor activation is clearly reconstructed as a result of applying the method to the motor-evoked field with a frequency band of 15–25 Hz. The result of this application demonstrates the effectiveness of the proposed method for reconstructing MEG source activities using nonaveraged raw epochs.
In this paper, we first present the analysis regarding the influence of the background interference on the adaptive beamformer source reconstruction in Section III. Then, the prewhitening eigenspace beamformer is proposed in Section IV. The proposed method is validated first by our computer simulation in Section V and then by applications to auditory and motor responses in Section VI. Throughout this paper, plain italics indicate scalars, lower-case boldface italics indicate vectors, and upper-case boldface italics indicate matrices. The eigenvalues are numbered in decreasing order.
II. Adaptive-Beamformer for Neuromagnetic Reconstruction
A. Definitions
We define the magnetic field measured by the mth detector coil at time t as bm(t), and a column vector b(t) = [b1(t), b2(t), …, bM(t)]T as a set of measured data where M is the total number of detector coils and superscript T indicates the matrix transpose. The spatial location is represented by a three-dimensional (3-D) vector r : r = (x, y, z). The covariance matrix of the measurement is denoted as R, i.e., R = 〈b(t)bT (t)〉 where 〈·〉 indicates the ensemble average, which is replaced with the time average over a certain time window in practice. The moment magnitude of a source at r is denoted as s(r, t). The orientation of the source at r is defined as a 3-D vector η(r) = [ηx(r), ηy(r), ηz(r)]T whose ζ component, (where ζ equals x, y, or z), is equal to the cosine of the angle between the direction of the source moment and the ζ direction. We define as the output of the mth sensor; the output is induced by a unit-magnitude source located at r and directed in the ζ direction. The column vector lζ(r) is defined as . The lead field matrix, which represents the sensitivity of the whole sensor array at r, is defined as L(r) = [lx(r), ly(r), lz(r)]. The lead-field vector in the source-moment direction is defined as l(r) where l(r) = L(r)η(r).
B. Adaptive Beamformer Source Reconstruction
To solve neuromagnetic source reconstruction problems, we focus on the class of methods referred to as the adaptive beamformer, which was originally developed in the field of array signal processing [5]. The beamformer estimates the source current density by computing ŝ(r, t) = wT (r)b(t) where ŝ(r, t) is the estimated source magnitude. The column vector w(r) expresses a set of filter weights. The weight vector of the minimum-variance beamformer, which is the best-known adaptive beamformer, is expressed as
| (1) |
where l(r) is defined as l(r) = L(r)ηopt(r)1. Here, ηopt(r) is the optimum direction determined as the direction that gives the maximum beamformer outputs [7], [8]. Using the above weight, the reconstructed source power is expressed as
| (2) |
because 〈b(t)bT (t)〉 = R
The minimum-variance beamformer can be extended to the eigenspace-projection beamformer, which is known to be tolerant of errors in the forward modeling or the estimation of the data covariance matrix [9]. The extension is attained by projecting the weight vector in (1) onto the signal subspace of the measurement covariance matrix. That is, redefining the weight vector in (1) as wMV(r), the weight vector for the eigenspace-projection beamformer is obtained using
| (3) |
In this equation, ES is a matrix whose columns consist of the signal-level eigenvectors of R, and is the projection matrix that projects a vector onto the signal subspace of R.
III. Influence of Background Brain Activity on Adaptive-Beamformer Reconstruction
We use a model for the measurements b(t) expressed as
| (4) |
where bs(t) is the magnetic field generated from the signal sources of interest, bI(t) is the magnetic field generated by the background activity, and n(t) is the additive sensor noise. The spatial-filter outputs are then expressed as
| (5) |
For nonadaptive spatial filters, the influence of the interference bI(t) is simply the overlap of wT (r)bI(t) onto the reconstruction of the signal of interest, wT (r)bs(t). For adaptive beamformers, however, the interference bI(t) affects the source reconstruction results in a more complex manner because bI(t) also affects the beamformer weight w(r) through the covariance matrix R. In this section, we derive the resolution kernel of the minimum-variance beamformer, taking the background interference into account. Numerical examples of the resolution kernel are presented in Section V-A. These numerically-obtained kernels clearly show that the background activity can cause a significant source-intensity reduction as well as severe spatial blur in the adaptive-beamformer reconstruction results.
We define the background interference activity at the location r and time t as ξ(r, t), and assume that the background sources are continuously distributed. Thus, we have
| (6) |
where the integral is taken over the whole source space. Let us also assume that only a single target source exists at r1 with an orientation equal to η1. The magnitude of the target source is denoted s(r1, t). Then, defining f such that f = L(r1)η1, the measurement b(t) is expressed as
| (7) |
The sensor noise n(t) can be modeled as white Gaussian noise uncorrelated between different sensor channels, and we can generally assume that the relationship holds where is the variance of the sensor noise and I is the identity matrix. Therefore, the covariance matrix of the measurements is given by
| (8) |
where the signal power is defined such that . We also assume that the background source activity is spatially uniform and incoherent, i.e.,
| (9) |
where is the power of the background source activity. Substituting (9) into (8), we obtain
| (10) |
where G is the gram matrix defined as
| (11) |
The resolution kernel of the minimum-variance beamformer for a point source at r1 is expressed as [6]
| (12) |
Therefore, substituting (10) into (12), we can finally derive the explicit form of the kernel such that
| (13) |
where and . In (13), the normalized lead field vector is used as l and the explicit notation of (r) is omitted for simplicity. The generalized cosine in the metric D−1 is defined such that cos2(l, f|D−1) = (lT D−1 f)2/[(lT D−1 l)(fT D−1 f)]. In Section V-A, we present numerical examples of the resolution kernel obtained using (13). These numerical examples show that when large background activities exist, significant reduction in source intensity, as well as the subsequent degradation of the spatial resolution, arises in source reconstruction results.
IV. Proposed Prewhitening Eigenspace Beamformer
A. Definitions
Here, we present the proposed eigenspace beamformer, which can attain the source reconstruction free from the influence of background interference. To describe the method, we first make several definitions. We define the spatio-temporal matrix of the measurement b(t) as B such that
| (14) |
where tj (j = 1, …, K) indicate the time points at which the measurements are performed. The spatio-temporal matrices for bs(t) and bI(t) are defined in exactly the same manner as in (14), i.e.,
| (15) |
and
| (16) |
Then, corresponding to (4), the relationship
| (17) |
holds where N is the noise matrix defined as N = [n(t1), …, n(tK)].
We define the covariance matrix of the signal magnetic field generated from the target sources only as Rs, such that
| (18) |
We also define the signal-plus-sensor-noise covariance matrix Rs+n, such that
| (19) |
and the interference-plus-sensor-noise covariance matrix Ri+n, such that
| (20) |
We further assume that the background interferences are uncorrelated with the target activity. Under this assumption, the relationship
| (21) |
holds. The fundamental assumption in this paper is that control-state measurements, which contain only the contributions from the background interference and sensor noise, are available, and the interference-plus-noise covariance matrix Ri+n can be obtained from such control-state measurements. Under this assumption, we have developed a novel beamformer method, the prewhitening eigenspace beamformer, to extract the target activities from the background interference.
B. Prewhitening Eigenspace Beamformer
The proposed beamformer uses the prewhitened measurement covariance matrix R̃, which is defined as . Thus, from (21), we have the relationship
| (22) |
We define the eigenvalues and eigenvectors of R̃ as γ1, …, γM and u1, …, uM. Because we assume that Q target sources exist, according to (22), the Q largest eigenvalues γ1, …, γQ are greater than 1 and associated with the signal part ; and the other eigenvalues γQ+1, …, γM are equal to 1 and are associated with the interference and noise part. That is, R̃ is expressed as
| (23) |
and, thus, we have
| (24) |
Using these signal-level eigenvectors, we define a matrix US as US = [u1, …, uQ], and calculate , which is the projection matrix that project vectors onto the signal subspace of R̃. Thus, a reasonable estimate of the signal-only covariance matrix, R̂s, can be obtained using
| (25) |
An estimate of the signal-plus-sensor-noise covariance matrix, R̂s+n, can be obtained from
| (26) |
where μ is the regularization constant that should be set close to the variance of the sensor noise . The source power reconstruction free from the influence of the background activity can be obtained from
| (27) |
A reasonable estimate of the spatio-temporal matrix of the signal magnetic field Bs can also be obtained in the same manner as described above. The prewhitened version of B is defined as B̃ such that
| (28) |
The singular value decomposition of the B̂ is expressed as
| (29) |
where indicates the jth temporal singular vector. Here, again, the first Q singular values are greater than 1 and they are associated with the signal part . The other singular values are close to 1 and they are associated with the interference and noise part . Therefore, by applying the projector to B, we have
| (30) |
Thus, we can extract the spatio-temporal matrix of the signal magnetic field Bs such that
| (31) |
Defining ΠS such that , we have the relationship,
| (32) |
and the weight vector of the prewhitening eigenspace beamformer is expressed as
| (33) |
and the interference-free spatio-temporal source reconstruction is obtained using this wp(r), i.e.,
| (34) |
V. Numerical Experiments
A. Numerical Examples of Resolution Kernel
A sensor alignment of the 148-sensor array from Magnes 2500 (4D Neuroimaging Inc., San Diego) neuromagnetometer is used in our experiments. Three signal sources were assumed to exist on a single plane (x = 0 cm). The source-sensor configuration and the coordinate system are illustrated in Fig. 1, and the spherical homogeneous conductor model is used for the forward calculation. We here assume that only the upper-left source is active; the source is located 6 cm below the center of the sensor array (r1 = (0, −1, −6) cm). We calculated the resolution kernel using (13) for five values of σc/σ1. Here, the signal-to-sensor-noise ratio (SSNR), which is defined as , was set equal to 2. Also, in this calculation, the gram matrix G is approximated as
Fig. 1.
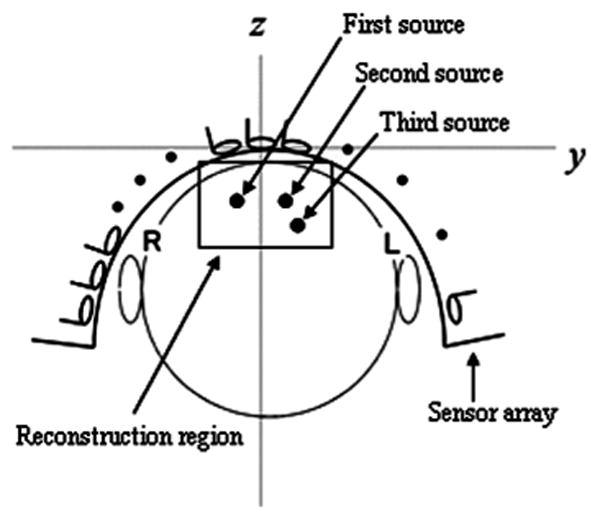
The coordinate system used in the numerical experiments. The coordinate origin was set at the center of the sensor coil located at the center of the array. The plane at x = 0 cm is shown. The coordinate of the upper left, the upper right, and the lower sources are (0, −1, −6), (0, 1, −6), and (0, −1.6, −7.2) cm, respectively. The circle indicates the boundary of the sphere used for the forward calculations. The center of the sphere was set to (0, 0, −12).
where lθ(rj) and lϕ(rj) are the lead field vectors in the directions of the two tangential components, and rj is the coordinate of the jth voxel. Here, the voxel grid has 0.5-cm interval within a volume defined as −8 ≤ x ≤ 8, −8 ≤ y ≤ 8, and −11 ≤ z ≤ −3.
The results plotted in Fig. 2(a) show that, when the power of the background activity, , is increased, the reconstructed intensity of the source rapidly decreases. The peak value of the resolution kernel was plotted with respect to σc/σ1 in Fig. 2(b) for the three values of SSNR. These plots show that large background activities such as those with σc = 0.5σ1 can cause a more than 70% decrease in the reconstructed intensity, and that this decrease is more significant when the SSNR is greater. The same resolution kernels in Fig. 2(a) are plotted in Fig. 2(c) where each kernel was normalized with its peak value. These normalized kernels clearly show that the full-width at half-maximum (FWHM) of the kernels becomes greater when σc is increased. The FWHM of the resolution kernels is plotted with respect to σc/σ1 for three different values of the SSNR. The results show that, compared to a case where background interferences are negligibly small, a large spatial blur can be caused by background activities such as those with σc > 0.5σ1.
Fig. 2.
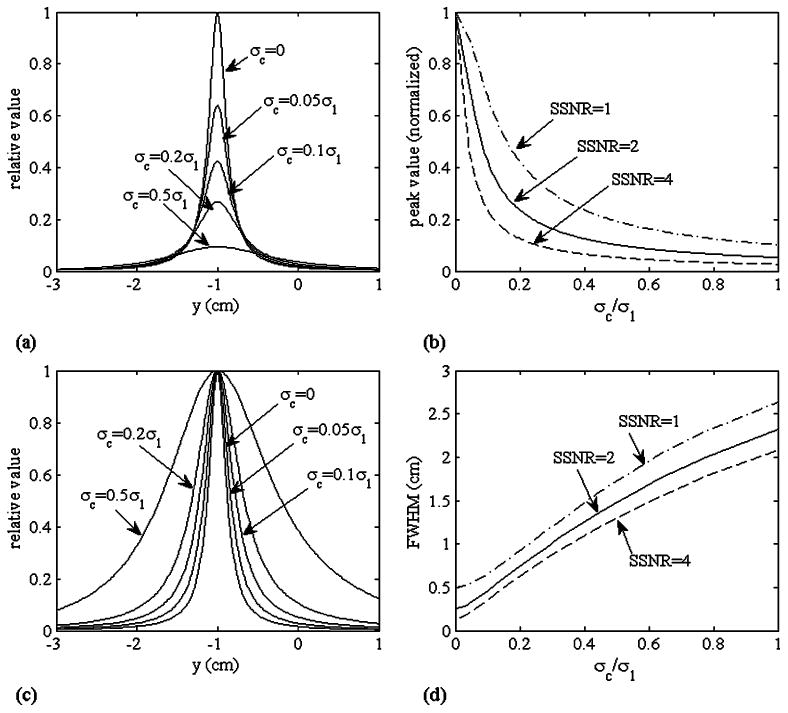
(a) Resolution kernels of the upper-left source located at (0, −1, −6) cm. Five values of σc were used: σc = 0, σc = 0.05σ1, σc = 0.1σ1, σc = 0.2σ1, and σc = 0.5σ1. The SSNR, which is defined as , was set to 2. (b) Plot of the peak value of the kernel, , with respect to σc for three SSNR values. (c) The same resolution kernels as shown in (a) in which each kernel is normalized with its peak value. (d) Plot of the FWHM of the resolution kernel with respect to σc for three SSNR values.
B. Source Reconstruction Experiments
We then performed source reconstruction experiments to validate the effectiveness of the prewhitening beamformer proposed in Section IV. Simulated magnetic recordings were calculated from −1200 to 1200 time points by assigning the three time courses shown in Fig. 3(a) to the three sources. We use the spherically homogeneous conductor model [10] for the forward calculation. In these numerical experiments, we consider the data portion between −1200 and 0 to be the prestimulus period and that between 0 and 1200 to be the poststimulus period. A small amount of white Gaussian noise that simulates the sensor noise was added to the generated recordings, resulting in a SSNR equal to 12, where the SSNR is estimated using the ratio between the Frobenius norms of the signal and noise matrices, i.e., ‖Bs‖/‖N‖. The generated magnetic recordings Bs + N are shown in the upper panel of Fig. 3(b). We then generated the magnetic field due to the background interference BI. In this generation, 100 background sources with random locations and orientations had the same power and random time courses. The background magnetic field BI was added to Bs + N and the resultant simulated magnetic recordings B are shown in the lower panel of Fig. 3(b). Here, the resultant interference-to-signal ratio ‖Bs‖/‖BI‖ was set equal to 2.
Fig. 3.
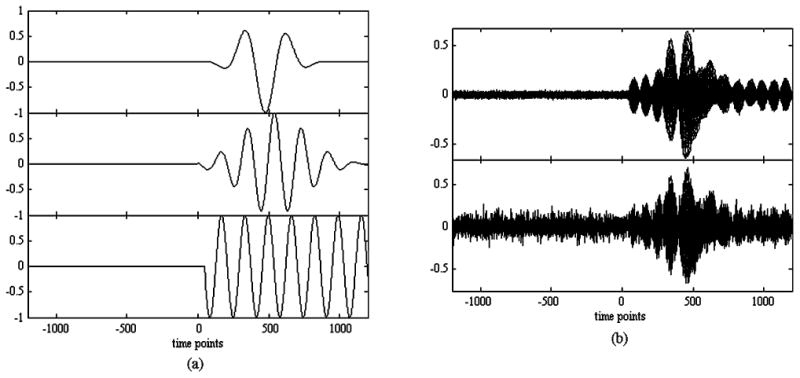
(a) Waveforms of the three sources assumed for the numerical experiments. The waveforms in the top to the bottom panels were assigned to the first to third sources, respectively. (b) Generated magnetic recordings obtained when no background sources exist (upper panel), and when 100 background sources exist (lower panel).
The conventional eigenspace beamformer mentioned in Section II-B was first applied to these two sets of simulated recordings in Fig. 3(b). Here, R was obtained using the whole poststimulus period, and (2) was used to obtain the source-power reconstruction 〈ŝ(r, t)2〉. Fig. 4(a) shows the results for the case with no background interference, and Fig. 4(b) shows the results for the case with the background interference present. Here, the comparison between these two sets of results again confirms that the background interference causes a severe blur in the reconstruction results. We then applied the prewhitening beamformer in (27) to the data with the background interference. The results are shown in Fig. 4(c). In this application, Ri+n was obtained using the whole prestimulus period. In the results in Fig. 4(c), the blur due to the background activity is significantly reduced, and these results clearly demonstrate the effectiveness of the proposed beamformer.
Fig. 4.
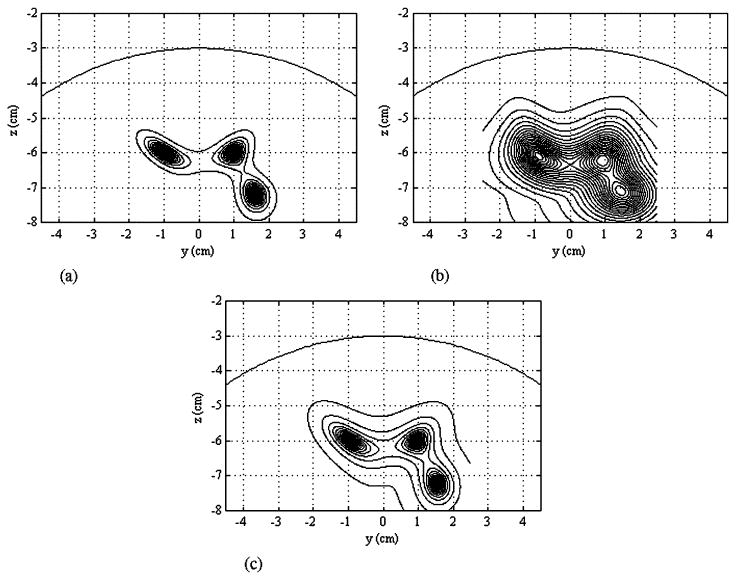
Results of the power reconstruction 〈ŝ(r, t)2〉. (a) Conventional eigenspace beamformer was applied to the recordings with no background interference. (b) Conventional eigenspace beamformer was applied to the recordings with background interference. (c) Prewhitening beamformer reconstruction [see (27)] was applied to the recordings with background interference. In these results, the reconstruction grid has 0.1-cm intervals in the y and z directions.
VI. Experiments
We applied the proposed prewhitening beamformer to two sets of MEG data, measured using the 275-channel Omega-275 (VSM MedTech Ltd., Port Coquitlam, BC, Canada) whole-cortex biomagnetometer installed at the Biomagnetic Imaging Laboratory, University of California, San Francisco. The first data set is the auditory evoked response, and we applied the proposed prewhitening beamformer to demonstrate its capability of spatio-temporal reconstruction free from the influence of background interference. The second data set is the movement-related desynchronization induced by button-press finger movements, and we show that the method can reconstruct a clear, localized activity near the hand-motor area, demonstrating that the proposed method is effective for reconstructing nontime-locked brain activities.
A. Application to Auditory-Evoked Data
The auditory-evoked field was measured with a 1-kHz pure tone presented to the subject's right ear. The average inter-stimulus interval was 2 s, with the interval randomly varied between 1.75 and 2.25 s. The sampling frequency was set at 4 kHz, and an on-line filter with a bandwidth from 1 to 2 kHz was used. A total of 400 epochs were measured and averaged to produce the averaged auditory recordings shown in Fig. 5(a). Here, although clear P50m and N100m peaks can be observed, we can see that these averaged recordings contain a considerable amount of quasi-periodic background activity.
Fig. 5.
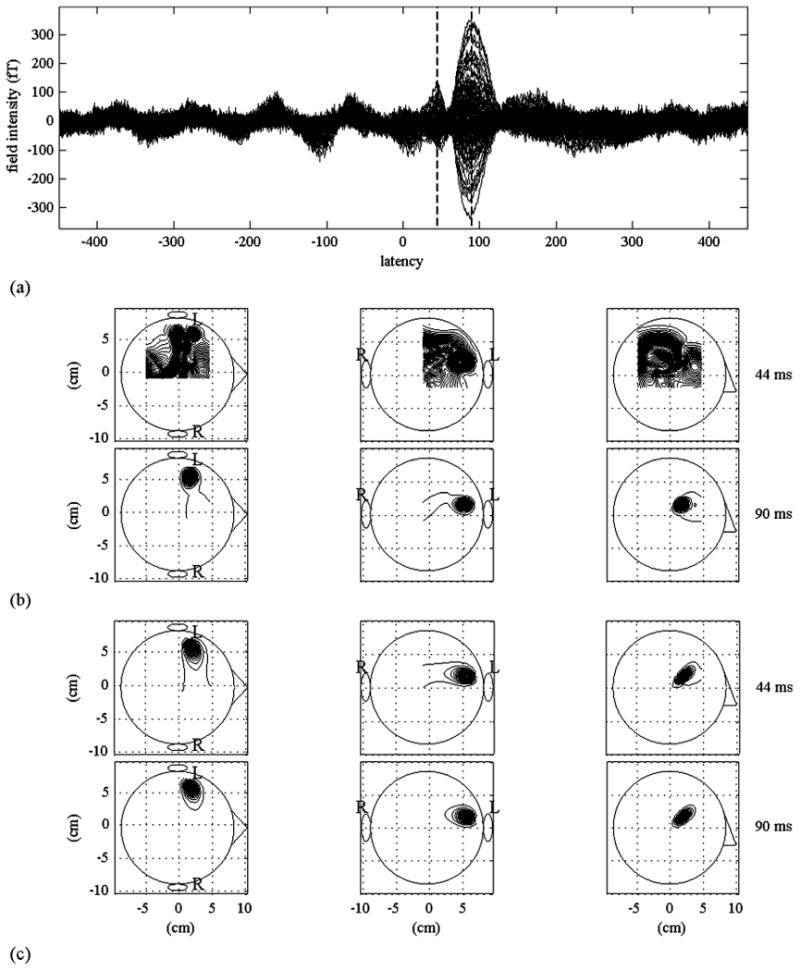
(a) Averaged auditory-evoked field measured using the 275-channel sensor array. Among the 275 sensor recordings, the recordings from 132 sensors covering the subject's left hemisphere are displayed. Two vertical broken lines indicate the time instants 44 and 90 ms. (b) The source reconstruction results obtained using the conventional eigenspace beamformer. (c) Those from the proposed prewhitening beamformer. The left, middle, and right columns show the maximum intensity projections of the 3-D reconstruction onto the axial, coronal, and sagittal planes, respectively. The upper case letters L and R show the left and the right hemispheres, respectively. The upper and lower panels indicate the reconstruction results at 44 and 90 ms, respectively. In these reconstruction results, the reconstruction grid has 0.5-cm intervals in the x, y, and z directions.
The reconstruction experiments were performed using the conventional eigenspace-projected beamformer and the proposed prewhitening beamformer. In these experiments, the left hemisphere was reconstructed using the averaged recordings from 132 sensors covering the left hemisphere. [Only the recordings from these 132 sensors are displayed in Fig. 5(a).] A portion of the averaged recordings between 0 to 200 ms was used to estimate the measurement covariance matrix R, and the interference-plus-noise covariance Ri+n was obtained from the whole prestimulus portion between −400 and 0 ms. Two time points, 44 and 90 ms, are selected for the result comparison. These time points are shown in the two vertical broken lines in Fig. 5(a), and as indicated, one is near the peak vertex of P50m and the other is near the peak vertex of N100m.
The conventional eigenspace-projected beamformer in (1) and (3) was first applied to these averaged recordings. The source reconstruction results at the two time points are shown in Fig. 5(b). The results from the prewhitening beamformer, obtained using (34), are shown in Fig. 5(c). The dimension of the signal subspace was set to 2 for the both cases. At 90–ms latency, which is close to the peak vertex of N100m, both methods can reconstruct a clear localized source in the left temporal lobe probably near the primary auditory area. However, at 44 ms, the reconstruction results of the conventional eigenspace beamformer contain a strong diffuse source, probably caused by the background brain activity. The results from the prewhitening beamformer are free from this diffuse source and clearly detect a localized source in the left temporal lobe, demonstrating the effectiveness of the proposed prewhitening beamformer.
B. Application to Movement-Related Desynchronization Data
Here, a subject was asked to press a button with his right-index finger every 3–4 s. The onset of movement was indicated by a button press and defined as the time-origin. MEG data for200 button presses were continuously acquired at a 1 kHz sampling rate. Because movement-induced magnetic fields are not precisely phase locked to the movement, we estimated the covariance matrices from the raw epoched data. Since, the raw epoch data will be contaminated by background interferences, we applied our proposed prewhitening beamformer. It is well-known that the spectrum of the magnetic field decreases in the beta-band (15–25 Hz) preceding movement [11]. Therefore, co-variance estimates were obtained in the frequency domain.
We set two time windows for covariance matrix estimation: the first from −1200 to −600 ms, and the second from −600 to 0 ms, both preceding the button press. Fourier transforms of the kth nonaveraged epoch data in the first and the second time windows are, respectively, denoted and , and the frequency-domain sample covariance matrices for the first and the second time windows, Ω̂1 and Ω̂2, are obtained using
| (35) |
where j = 1 and 2. In this equation, the notation Σf ∈ Fw indicates the summation over a specific frequency band Fw, and Fw was set to the β-band region between 15 and 25 Hz in our experiments. The power spectra averaged across channels, P1(f) and P2(f), were also calculated for the first and the second time windows such that where j = 1, 2. The power spectrum P1(f) for the frequency band Fw (15 ≥ f ≥ 25 Hz) is plotted by the broken line and P2(f) by the solid line in Fig. 6(a). These plots indicate that P1(f) is larger than P2(f) in this frequency band, confirming the movement-related desynchronization. Consequently, Ω̂1 is used as the target co-variance matrix, and Ω̂2 as the interference-plus-noise covariance matrix.
Fig. 6.
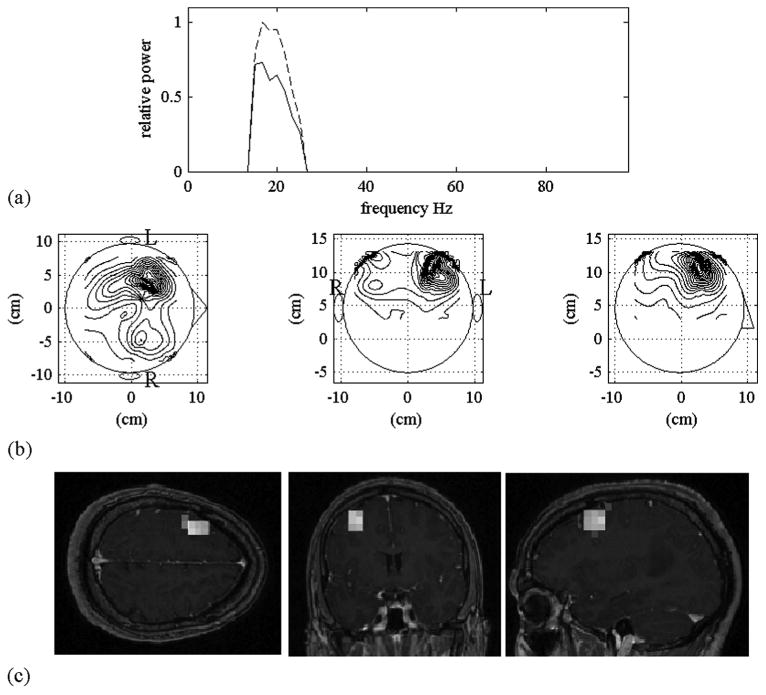
(a) The power spectra P1(f) and P2(f) for the frequency band between 15 and 25 Hz. P1(f) is indicated by the broken line and P2(f) by the solid line. (b) The maximum-intensity projection of the power reconstruction 〈ŝ(r, t)2〉 obtained using the prewhitening beamformer in (27). (c) The MRI overlay of the reconstruction results in (b).
We applied the prewhitening beamformer to obtain the source power reconstruction 〈ŝ(r, t)2〉. The reconstruction results are shown in Fig. 6(b). We can see that the proposed method reconstructs a clear, localized source in the left temporal region. The MRI overlay of the results in Fig. 6(b) is shown in Fig. 6(c). The overlay shows that the center of the reconstructed activity is located in contralateral hand-motor cortex. The results in Fig. 6(b) and (c) demonstrate the capability of the proposed beamformer to successfully reconstruct the nontime-locked source activity by eliminating the influence of background interference.
VII. Discussion and Conclusion
The analysis and numerical experiments in Sections III and V-A show that the background interference causes blurred reconstruction. On the other hand, the sensor noise is known to cause the degradation in the spatial resolution [12]. Let us compare the effects of these two types of noise on the spatial resolution. When the background interference is negligibly small, substituting (10) with σc = 0 into (12), we derive the kernel in this case as
| (36) |
where α is defined such that , and cos2(l, f|I) is denoted cos2(l, f). The SSNR is expressed using α as . In (36), a multiplicative constant is omitted and the peak value is normalized to 1. When the power of background interference is much larger than the power of sensor noise, substituting into (13), we derive
| (37) |
where α′ is defined such that . We define the signal-to-interference ratio (SIR) as , and a multiplicative constant is again omitted in (37).
The results of plotting the point spread functions in (36) and (37) are shown in Fig.7(a) and (b). Here, α in (36) and α′ in (37) were set equal; these values were set to 1 in Fig.7(a) and to 0.5 in Fig.7(b). These calculated results show that the FWHM of the point spread function in (36) is approximately twofold greater than that for the point spread function in (37). That is, the blur caused by the sensor noise is twofold greater than that caused by the interference. The difference between the two point spread functions is caused by the difference between cos(l, f) and cos(l, f|G−1). The decay properties of these generalized cosines are shown in Fig. 7(c), and we can see that cos(l, f|G−1) decays twice as fast as cos(l, f), thus explaining the difference in these two types of point spread functions.
Fig. 7.
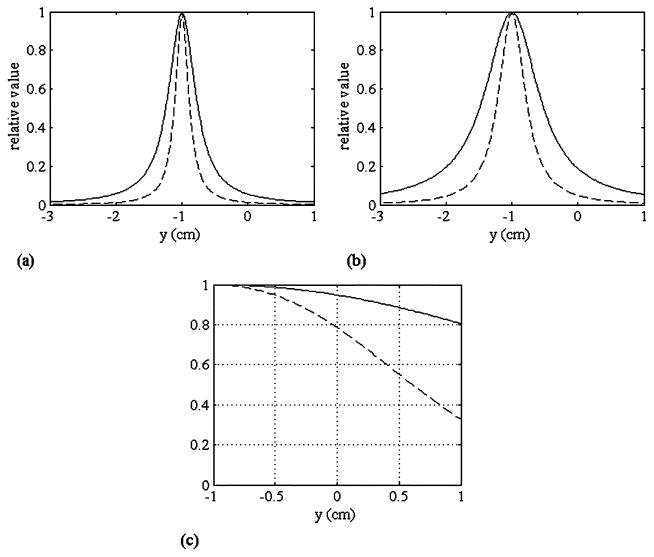
Comparison between the point spread functions in (36) and (37). The solid lines indicate the point spread function in (36) and the broken lines indicate that in (37). The value of α′ in (36) and the value of α′ in (37) were set equal. (a) These values were set to 1, and (b) 0.5. (c) Plot of cos(l, f) (solid line) and cos(l, f|G−1) (broken line). These generalized cosines were calculated on the line x = 0, z = −6 and −1 ≤ y ≤ 1 cm.
In summary, this paper proposes a novel prewhitening beamformer, which can achieve source reconstruction free from the influence of background brain activities. The prerequisite for the method is that control-state measurements, which contain only the contributions from the background interference, be available, and that the covariance matrix of the background interference can be obtained from such control-state measurements. The proposed method uses this interference covariance matrix to suppress the influence of the interference in the source reconstruction results. The proposed method is validated by our computer simulation, as well as by applications to two kinds of MEG data.
Acknowledgments
The authors wish to thank Sarang S. Dalal for his software support.
The work of K. Sekihara was supported in part by the Ministry of Education, Science, Culture and Sports in Japan under Grant-in-Aid C13680948 and Grant-in-Aid C16500296). The work of S. Nagarajan was supported in part by the Whitaker Foundation and in part the National Institute of Health (NIH) under Grant P41RR12553-03 and Grant R01-DC004855-01A1.
Biographies
Kensuke Sekihara (M'88–SM'06) received the M.S. and Ph.D. degrees from the Tokyo Institute of Technology, Tokyo, Japan, in 1976 and 1987, respectively.
From 1976 to 2000, he worked with Central Research Laboratory, Hitachi, Ltd., Tokyo. He was a visiting Research Scientist at Stanford University, Stanford, CA, from 1985 to 1986, and at Basic Development, Siemens Medical Engineering, Erlangen, Germany, from 1991 to 1992. From 1996 to 2000, He worked with “Mind Articulation” research project sponsored by Japan Science and Technology Corporation. From 2000 to 2005, he was a Professor at Department of Engineering, Tokyo Metropolitan Institute of Technology, Tokyo. Since 2006, he has been a Professor with the Department of Systems Design & Engineering, Tokyo Metropolitan University, Tokyo, Japan. His research interests include the neuromagnetic source reconstruction, and statistical signal processing, especially its application to functional neuroimaging.
Dr. Sekihara is a senior member of the IEEE Medicine and Biology Society and the IEEE Signal Processing Society. He is an associate editor for IEEE Transactions on Biomedical Engineering.
Kenneth E. Hild, II (M'90–SM'05) received the B.S. and M.Sc. degrees in electrical engineering, with emphasis in signal processing, communications, and controls, from The University of Oklahoma, Norman, in 1992 and 1996, respectively. He received the Ph.D. degree in electrical engineering from The University of Florida, Gainesville, in 2003, where he studied information theoretic learning and blind source separation in the Computational NeuroEngineering Laboratory. He has also studied biomedical informatics at Stanford University, Palo Alto, CA.
From 1995 to 1999, he was with Seagate Technologies, Inc., Scotts Valley, CA, where he served as an Advisory Development Engineer in the Advanced Concepts group. From 2000 to 2003, he taught several graduate-level classes on adaptive filter theory and stochastic processes at the University of Florida. He is currently with the Biomagnetic Imaging Laboratory, Department of Radiology, University of California at San Francisco, where he is applying variational Bayesian techniques for biomedical signal processing of encephalographic and cardiographic data.
Dr. Hild is a member of Tau Beta Pi, Eta Kappa Nu, and the International Society for Brain Electromagnetic Topography.
Srikantan S. Nagarajan (S'90–M'96) began his research career at the Applied Neural Control Laboratory, Case Western Reserve University (CWRU), Cleveland, OH, where he received the M.S. and Ph.D. degrees in biomedical engineering.
After graduate school, he did a postdoctoral fellowship at the Keck Center for Integrative Neuroscience, University of California, San Francisco, under the mentorship of Dr. M. Merzenich and Dr. C. Schreiner. Subsequently, he was a tenure-track faculty member in the Department of Bioengineering, University of Utah, Salt Lake City. Currently, he is the Director of the Biomagnetic Imaging Laboratory, an Associate Professor in Residence in the Department of Radiology, and a member in the UCSF/UCB Joint Graduate Program in Bioengineering. His research interests are in the area of Neural Engineering where his goal is to better understand dynamics of brain networks involved in processing, and learning, of complex human behaviors such as speech, through the development of functional brain imaging technologies.
Footnotes
References
- 1.Robinson SE, Vrba J. Functional neuroimaging by synthetic aperture magnetometry (SAM) In: Yoshimoto T, et al., editors. Recent Advances in Biomagnetism. Sendai, Japan: Tohoku Univ Press; 1999. pp. 302–305. [Google Scholar]
- 2.van Veen BD, van Drongelen W, Yuchtman M, Suzuki A. Localization of brain electrical activity via linearly constrained minimum variance spatial filtering. IEEE Trans Biomed Eng. 1997 Sep;44(no. 9):867–880. doi: 10.1109/10.623056. [DOI] [PubMed] [Google Scholar]
- 3.de Munck JC, Vijn PCM, da Silva FHL. A random dipole model for spontaneous brain activity. IEEE Trans Biomed Eng. 1992 Aug;39(no. 8):791–804. doi: 10.1109/10.148387. [DOI] [PubMed] [Google Scholar]
- 4.Lütkenhöner B. Magnetic field arising from current dipoles randomly distributed in a homogeneous spherical volume conductor. J Appl Phys. 1994;75:7204–7210. [Google Scholar]
- 5.van Veen BD, Buckley KM. Beamforming: a versatile approach to spatial filtering. IEEE Acoustics, Speech, Signal Processing Mag. 1988 Apr;5:4–24. [Google Scholar]
- 6.Sekihara K, Sahani M, Nagarajan SS. Location bias and spatial resolution of adaptive and non-adaptive spatial filters for meg source reconstruction. NeuroImage. 2005;25:1056–1067. doi: 10.1016/j.neuroimage.2004.11.051. [DOI] [PMC free article] [PubMed] [Google Scholar]
- 7.Sekihara K, Scholz B. Generalized Wiener estimation of three-dimensional current distribution from biomagnetic measurements. In: Aine CJ, editor. Biomag 96: Proc 10th Int Conf Biomagnetism. Santa Fe, NM: 1996. pp. 338–341. [DOI] [PubMed] [Google Scholar]
- 8.Sekihara K, Nagarajan SS, Poeppel D, Marantz A. Asymptotic snr of scalar and vector minimum-variance beamformers for neuromagnetic source reconstruction. IEEE Trans Biomed Eng. 2004 Oct;51(no. 10):1726–1734. doi: 10.1109/TBME.2004.827926. [DOI] [PMC free article] [PubMed] [Google Scholar]
- 9.Sekihara K, Nagarajan SS, Poeppel D, Marantz A, Miyashita Y. Application of an meg eigenspace beamformer to reconstructing spatio-temporal activities of neural sources. Hum Brain Mapp. 2002;15:199–215. doi: 10.1002/hbm.10019. [DOI] [PMC free article] [PubMed] [Google Scholar]
- 10.Sarvas J. Basic mathematical and electromagnetic concepts of the biomagnetic inverse problem. Phys Med Biol. 1987;32:11–22. doi: 10.1088/0031-9155/32/1/004. [DOI] [PubMed] [Google Scholar]
- 11.Pfurtscheller G, Lopes da Silva FH. Event-related EEG/MEG synchronization and desynchronization: basic principles. Clin Neurophysiol. 1999;110:1842–1857. doi: 10.1016/s1388-2457(99)00141-8. [DOI] [PubMed] [Google Scholar]
- 12.Cox H. Resolving power and sensitivity to mismatch of optimum array processors. J Acoust Soc Am. 1973;54:771–785. [Google Scholar]


