

Abstract
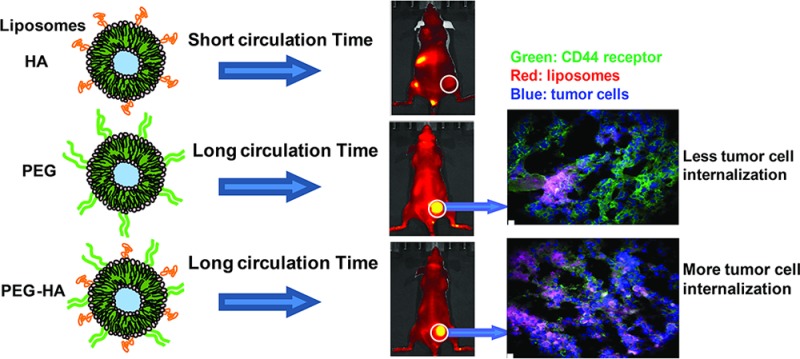
Hyaluronan-grafted liposomes (HA-liposomes) preferentially target CD44-overexpressing tumor cells in vitro via receptor-mediated endocytosis. We investigated the pharmacokinetics and biodistribution of HA-liposomes with various sizes of HA (MW 5–8, 50–60, and 175–350 kDa) in mice. Incorporation of negatively charged HA on the liposome surface compromised its blood circulation time, which led to decreased tumor accumulation in CD44+ human breast cancer MDA-MB-231 xenografts compared to PEGylated liposomes (PEG-5000). Clearance of HA-liposomes was HA polymer length-dependent; high MW (175–350 kDa, highest ligand binding affinity) HA-liposomes displayed faster clearance compared to low MW (5–8, 50–60 kDa) HA-liposomes or PEGylated liposomes. Surface HA ligand density can also affect clearance of HA-liposomes. Thus, HA is not an effective stealth coating material. When dual coating of PEG and HA was used, the PEG-HA-liposomes displayed similar blood circulation time and tumor accumulation to that of the PEGylated liposomes; however, the PEG-HA-liposomes displayed better cellular internalization capability in vivo. Tumor histology showed that PEG-HA-liposomes had a more direct association with CD44+ cancer cells, while PEGylated liposomes located predominantly in the tumor periphery, with less association with CD44+ cells. Flow cytometry analysis of ex vivo tumor cells showed that PEG-HA-liposomes had significantly higher tumor cell internalization compared to PEGylated liposomes. This study demonstrates that a long blood circulation time is critical for active tumor targeting. Furthermore, the use of the tumor-targeting ligand HA does not increase total tumor accumulation of actively targeted liposomes in solid tumors; however, it can enhance intracellular delivery.
Keywords: CD44, hyaluronan liposomes, active tumor targeting, passive tumor targeting, accelerated clearance, HA polymer length, PEG coating
Liposome-based nanocarrier drug delivery systems (DDS) have made an enormous impact in the field of oncology.1−3 A breakthrough in liposomal DDS occurred with coating of the liposomes with hydrophilic polymer poly(ethylene glycol) (PEG), which forms a hydrated shell, acts as a “stealth” steric barrier against nonspecific attachment of plasma protein (opsonin) to the liposome surface, and slows down liposome clearance from circulation in vivo.(4−6) It is well accepted that long-circulating stealth liposomes, with an average diameter of 100–200 nm, are capable of spontaneously accumulating around tumors via the “enhanced permeability and retention” (EPR) effect.7−10 This “passive tumor targeting” is achieved by extravasation of liposomes through more permeable (“leaky”) tumor vasculature within tumors that also have impaired lymphatic drainage.11,12 On the other hand, after localizing at the pathological site, the “PEG dilemma” becomes a concern,13,14 because PEG polymer coating not only reduces the rate of uptake by the reticuloendothelial (RES) system but also reduces interactions between liposomes and the surface of the target cell, hindering entry of liposomes into tumor tissues, thus compromising efficacious drug or gene delivery to target cells and intracellular trafficking to target subcellular organelles.15−17 The “active tumor targeting” strategy serves to functionalize the surface of the nanocarrier with various tumor targeting moieties such as ligands, antibodies, peptides, protein fragments, and nucleic acids to allow for preferential binding to selective receptors or markers on diseased cells. This is often followed by receptor-mediated endocytosis and nanoparticle internalization into cells to improve intracellular drug delivery and therapeutic index.2,18 However, the relative contributions of passive and active tumor targeting are still under debate.19−23 Multiple factors, such as nanocarrier size, shape, charge, and surface chemistry,24,25 dynamic transport of the nanocarrier in blood, tumor spatial and temporal heterogeneity, receptor and ligand affinity, and complexities of the diffusional barrier in solid tumors, may profoundly affect the pharmacokinetics and efficiency of the active tumor targeting approach.11,23,26
Hyaluronan (HA), a hydrophilic and biodegradable polysaccharide, has been the subject of extensive investigation as a superior biomaterial for the formulation of nanoparticles, bioconjugates, hydrogels, and scaffolds for drug delivery and tissue engineering.27−29 HA binds with high affinity to its principal receptor, CD44, which is overexpressed in a wide variety of solid tumors and is involved in cancer progression and metastasis.30−33 Multivalent interactions of endogenous HA with CD44 drive numerous tumor-promoting signaling pathways and transporter activities and are crucial in both malignancy and resistance to therapy.33,34 In recent years, CD44 has attracted significant attention because of its utility as a cancer stem cell marker in several malignancies, and it has surfaced as a promising therapeutic target and prognostic marker for cancer therapy.30 HA polymer has been used as a tumor-targeting ligand and drug delivery carrier to target various anticancer drugs,35−37 genes, RNAi,38,39 and imaging agents40 to CD44-overexpressing cells. HA-modified nanocarriers and HA–drug conjugates have been shown to improve the tumor-targeting potential and enhance the therapeutic index of its payloads.41 For instance, conjugation of HA (MW = 1200 kDa) to mitomycin C and epirubicin was shown to enhance antitumor efficacy in Lewis lung carcinoma mouse models.42 HA–paclitaxel conjugates were demonstrated to enhance the survival of mice bearing ovarian cancer (HA MW = 40–200 kDa),43,44 bladder cancer,45 breast cancer brain metastasis (HA MW = 5 kDa),46 and squamous cell carcinomas of the head and neck (HA MW = 40 kDa).47 HA–butyric acid ester conjugate (HA MW = 85 kDa) inhibited hepatic tumor metastases in vivo.48 HA-grafted liposomes (HA-liposomes, ∼103 kDa HA) encapsulating doxorubicin significantly increased its antitumor activity compared to PEGylated liposome Doxil in syngeneic and human xenograft mouse tumor models.49 Furthermore, mitomycin C-loaded HA-liposomes (HA MW: ∼1000–2000 kDa) enhanced the survival of mice with lung metastasis.36
Despite the promising results of HA-liposomes for targeting of tumors, there is a considerable amount of confusion in the literature on how HA molecular weight variability may influence its tumor-targeting ability. For instance, HAs used for coating liposomes are highly heterogeneous with respect to polymer length, ranging from oligosaccharide HA (oligo HA, ∼10–20 sugars in length)37 to naturally occurring high molecular weight HA (HMW HA, ∼106 Da).36,49 Low molecular weight HA (LMW HA) and HMW HA have quite different CD44 binding affinities and biological effects.50,51 In addition to the CD44 receptor, HA also displays good affinity for several cell surface receptors, such as RHAMM/CD168 (receptor for hyaluronan-mediated motility, extracellular matrix receptor associated with wound healing and cancer),52 HARE (HA receptor for endocytosis, expressed in the sinusoidal endothelial cells of the liver and spleen),53 LYVE-1 (lymphatic vessel endothelial HA receptor),54 and Toll-like receptors 2 and 4.55 Intravenously administered HA has rapid clearance in humans and various other animal species, with a half-life of less than 10 min.56−58 A clear picture of the mechanisms underlying the effects of HA modification on liposomes’ pharmacokinetic profile is still lacking.
We and others have previously shown that HA-liposomes can selectively target CD44-overexpressing cancer cells efficiently and specifically in vitro via receptor-mediated endocytosis.50 The cellular-targeting efficiency of HA-liposomes strongly depends upon HA molecular weight (MW 5–8 < 10–12 < 175–350 kDa), HA grafting density, and cell surface CD44 receptor density.50 Both the size and grafting density of HA need to be fine-tuned when designing an HA-coated nanocarrier system for in vivo use. In the current study, we aimed to address the following questions. Can hydrophilic polymer HA substitute PEG to provide “stealth” properties of liposomes in circulation? Will the polymer length and grafting density of HA play a role in the circulation properties of HA-liposomes in vivo? To what extent will the HA-liposomes accumulate in tumors? What are the relative contribution of passive tumor targeting through the EPR effect and active tumor targeting through the CD44 receptor-mediated active tumor targeting for HA-liposomes?
Using radiotracer- and near-infrared (NIR) dye-labeled HA-liposomes and real-time imaging methods, we have systemically investigated the pharmacokinetics and biodistribution of HA-liposomes of varying polymer length and grafting densities and with or without PEG in healthy mice and immunocompromised mice bearing human breast cancer. We found that, compared to PEGylated liposomes, incorporation of biologically active HA can compromise liposome circulation time in blood due to recognition and clearance by the RES system, leading to decreased passive accumulation in the tumor; therefore, hydrophilic HA is not a suitable stealth coating material. In vivo clearance of HA-liposomes was HA polymer length dependent, with high MW HA-liposomes (175–350 kDa HA, high ligand binding affinity) displaying faster clearance, despite exhibiting higher CD44 receptor-mediated endocytosis in vitro. PEG-HA-liposomes had similar blood circulation time and tumor accumulation to the PEGylated stealth liposomes upon dual coating with PEG and HA; however, PEG-HA-liposomes had better cellular internalization capabilities compared with PEGylated liposomes in vivo.
Results and Discussion
Properties of HA-Liposomes
HA-liposomes with different HA sizes (5–8, 50–60, and 175–350 kDa, CD44 binding affinity: 175–350 kDa > 50–60 kDa > 5–8 kDa HA) were prepared via carbodiimide-conjugation chemistry.50 Particle size, polydispersity index (PDI), and zeta potential (ζ) of plain (unsubstituted) liposomes, PEGylated liposomes (methoxy-PEG, or mPEG, 5 kDa, 5% mol), and HA-liposomes are shown in Table 1. We selected PEG-5000 to match the size of LMW HA (5–8 kDa). In vivo studies have shown that the PEG-5000 liposomes had similar blood circulation time to PEG-2000 liposomes.59−61 We confirmed that PEG-5000 liposomes and PEG-2000 liposomes displayed similar cellular uptake in MDA-MB-231 cells and in vitro phagocytosis in THP-1 cells (Supporting Figure 1). All formulations had sizes around 120 nm with limited variation in particle size (PDI < 0.3). All HA-liposomes had higher negative surface charge (ζ ≈ −50 mV) compared to that of plain liposomes (−38.5 mV) and PEGylated liposomes (−6.6 mV), owing to the presence of anionic polymer HA on the surface of the liposomes and a slightly different lipid composition. The HA to lipids ratio (HA/L, μg HA/μmol lipid) ranged from 20 to 35 μg/μmol. All liposomes were used for in vivo study within 2 weeks after preparation. All formulations were stable with unchanged particle sizes and zeta potentials prior to injection.
Table 1. Physicochemical Characteristics of Liposomal Formulations.
| liposomes | sizea (nm) | PDIb | ζc (mV) | HA:lipidd (μg/μmol) |
|---|---|---|---|---|
| plain | 117 ± 4 | 0.288 | –38.5 ± 1 | NA |
| 5–8 kDa HA | 125 ± 2 | 0.130 | –50.1 ± 2 | 34.4 |
| 50–60 kDa HA | 120 ± 2 | 0.091 | –49.7 ± 5 | 22.3 |
| 175–350 kDa HA | 120 ± 3 | 0.090 | –52.3 ± 4 | 20.0 |
| PEG-175–350 kDa HA | 121 ± 1 | 0.213 | –9.23 ± 3 | 18.5 |
| mPEG-5000 | 113 ± 2 | 0.112 | –6.6 ± 0.3 | NA |
Measured by dynamic light scattering.
Polydispersity index.
HA contents were measured by CTAB precipitation assay.
Pharmacokinetics of 3H-Labeled HA-Liposomes with Different Sizes of HA
To examine the effect of polymer length of the HA ligand on the pharmacokinetics of HA-liposomes in healthy mice with an intact immune system, we incorporated radioactive tracer label 3H-cholesteryl hexadecyl ether into liposomes (3H-liposomes). The nonexchangeable and metabolically inert label is reliable to monitor the fate of liposomes in vivo.62 The blood radioactivity–time profiles of HA-3H-liposomes (5–8, 50–60, and 175–350 kDa HA) or PEGylated 3H-liposomes after intravenous (iv) injection into CD-1 mice are presented in Figure 1A. The radioactivity remaining in the blood was expressed as a percentage of the injected dose (%ID). The blood levels of all liposomes fell rapidly to nearly 20–40% of the injected dose within 3 h postinjection. Higher blood levels of PEGylated liposomes were observed compared to all HA-liposomes at all of the time points measured. The 5–8 kDa HA-liposomes and 50–60 kDa HA-liposomes had overlapping residual blood radioactivity curves, which were modestly lower than that of the PEGylated liposomes. The 175–350 kDa HA-liposomes displayed accelerated clearance from blood, which resulted in lower blood levels compared with those seen with PEGylated liposomes or HA-liposomes with short and medium HA chain lengths (Figure 1A).
Figure 1.
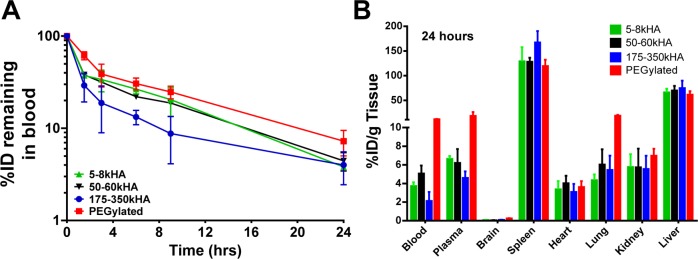
Pharmacokinetics and biodistribution of 3H-labeled PEGylated liposomes versus HA-liposomes (with varying MW of HA) after a single iv bolus injection into CD-1 mice. At different time points, mice were sacrificed; residual blood radioactivity of 3H-liposomes is presented as %ID remaining in total blood (A). The radioactivity in various organs at 24 h (B) postinjection is presented as %ID/g. All values are reported as mean ± SD (n = 3–6 mice per time point).
Pharmacokinetic parameters, which were estimated by noncompartmental analysis of the blood concentration (%ID/mL)–time data, are summarized in Table 2. PEGylated liposomes had significantly higher area under the blood concentration–time curve (AUC) in comparison to 5–8, 50–60, and 175–350 kDa HA-liposomes (p < 0.05). The 175–350 kDa HA-liposomes had significantly lower AUC in comparison to 5–8, 50–60 kDa HA-liposomes and PEGylated liposomes (p < 0.05). The 175–350 kDa HA-liposomes also had significantly higher clearance (CL) and volume of distribution (Vd) compared to that of 5–8, 50–60 kDa HA-liposomes and PEGylated liposomes (p < 0.01). Other parameters, such as elimination half-lives and mean residence time (MRT), were not significantly different among all liposomes tested (p > 0.05).
Table 2. Pharmacokinetic Parameters Derived from Noncompartmental Analysis of 3H-Liposomes Injected into CD-1 Micea.
| formulation | t1/2 (h) | AUC0-∞ (%ID·h/mL) | Vd (mL) | CL (mL/h) | MRT (h) |
|---|---|---|---|---|---|
| 5–8 kDa HA | 6.32 ± 0.69 | 327 ± 53 | 2.87 ± 0.77 | 0.31 ± 0.05 | 8.7 ± 0.6 |
| 50–60 kDa HA | 7.35 ± 0.75 | 324 ± 34 | 3.28 ± 0.21 | 0.31 ± 0.03 | 9.6 ± 1.0 |
| 175–350 kDa HA | 9.14 ± 1.64 | 216 ± 34* | 6.14 ± 0.98** | 0.47 ± 0.07* | 11.5 ± 3.1 |
| mPEG-5000 | 9.60 ± 2.46 | 428 ± 8* | 3.23 ± 0.78 | 0.23 ± 0.01 | 11.5 ± 3.3 |
All values are reported as mean ± SD. AUC0-∞ values were calculated by using trapezoidal integration of radioactivity concentrations (%ID/mL blood) versus time curves from 0 to 24 h and extrapolation from 24 h to infinity. Statistical analyses among HA-liposomes and PEGylated liposomes were conducted using one-way ANOVA followed by Tukey’s multiple comparison test. *p < 0.05; **p < 0.01 significant difference compared to all other groups.
A previous study suggested that surface-bound HMW HA polymer can behave just like PEG, providing a hydrophilic shield and promoting long circulation.49 Another study indicated that LMW HA could be a viable option as a PEG substitute when passive delivery is required.51 We have systemically studied the pharmacokinetics of HA-liposomes with three different HA polymer lengths and compared with that of PEGylated liposomes. Our data show that the addition of HMW HA ligand (175–350 kDa, highest ligand binding affinity) can significantly accelerate liposome blood clearance. The clearance of HA-liposomes is dependent on the polymer length of HA. The surface charge of nanoparticles is also an important factor affecting the corona composition after interaction with plasma proteins;25,63 the higher the particle surface charge density, the more proteins are adsorbed.64 Levchenko etal. reported that the rate of clearance from blood and uptake by the liver were significantly higher for the negatively charged liposomes (ζ ≤ −40 mV) than for the neutral liposomes (ζ = ±10 mV).65 Lee etal. reported that polymersomes with a slightly negative surface charge (ζ = −7.6 mV) have longer circulation time and a higher tumor accumulation in mice than polymersomes with a more negative surface charge (ζ = −38.7 mV).66 The negative surface charge of the HA-liposomes (ζ ≈ −50 mV) may contribute to their shorter blood circulation time in comparison to near neutral PEGylated liposomes (ζ = −6.6 mV). Together, although hydrophilic HA polymer shares a number of similarities with PEG, HA does not appear to be a suitable stealth material in vivo.
Biodistribution of HA-Liposomes in Healthy Mice
At 24 h postinjection of HA-3H-liposomes of various HA polymer length or PEGylated 3H-liposomes, all mice were sacrificed, and radioactivity in the blood, plasma, and major organs was analyzed (Figure 1B). All HA-liposomes and PEGylated liposomes showed high accumulations in RES organs, such as the liver and spleen, which are responsible for active clearance of liposomes from circulation. The 175–350 kDa HA-liposomes exhibited the highest levels in the spleen (167.2%ID/g) and the lowest levels in blood and plasma. Although the %ID/g value for spleen was highest among all organs tested, the overall spleen accumulation (%ID) represented only 10% of the total injected dose due to its small mass. The liver accounted for greater than 50% of clearance of the injected liposomal dose for all formulations used in the study. Uptake of liposomes from all organs did not total 100%, suggesting other possible uptake sites, such as the bone marrow, muscle, skin, and/or gut.
Liver sinusoidal endothelial cells were shown to be involved in the clearance of HA-conjugated quantum dots.67 Liver and spleen are more involved in the clearance of free HA compared to other organs.68,69 The fast clearance and high RES uptake of 175–350 kDa HA-liposomes could potentially be due to their high affinity for other HA receptors such as HARE and LYVE-1, which are abundantly expressed in normal sinusoidal endothelial cells of the liver, spleen, and activated tissue macrophages.70,71
Real-Time Imaging of NIR Dye-Labeled HA-Liposomes in Healthy Mice
To confirm the pharmacokinetic data seen with radiotracer-labeled liposomes, we set up a noninvasive whole-animal fluorescence imaging method to follow the in vivo fate of NIR dye DiD-labeled liposomes (DiD-liposomes) in real time. The DiD dye is highly lipophilic, mimicking some lipophilic drugs that can potentially be loaded in liposomes. The DiD-liposomes displayed bright fluorescence signals in vivo. The average radiance values within the region of interest (ROI) drawn at the skull region (underneath the eyes and between ears, Figure 2A) were used as surrogate representatives of liposome levels in circulation. We did not draw ROIs over major organs or the whole body, as this would introduce fluorescence contributed from organs with high RES uptakes, which do not represent circulation levels. We found that brain ROI fluorescence intensity correlates with systemic circulation levels but not actual brain tissue uptake, since total brain uptake of 3H-liposomes was 100–1000-fold lower than that observed in blood 24 h postinjection of 3H-liposomes (Figure 1B). Thus, the following semiquantitative image analysis in mice was based on the average radiance in the skull ROI of CD-1 mice.
Figure 2.

Real-time imaging of DiD-labeled PEGylated liposomes versus HA-liposomes (with varying MW of HA) after iv bolus injection into CD-1 mice. (A) Representative fluorescence images of mice after iv injection of DiD-free dye (i), 5–8 kDa (ii), 50–60 kDa (iii), 175–350 kDa (iv), HA-liposomes and PEGylated liposomes (v) after normalizing the data to the same scale. (B) Fluorescence kinetic curves of mice over time. The average radiance was generated from the ROIs drawn at the skull region of mice representing systemic exposure of DiD-liposomes in mice. (C) Average radiance AUC0.083–24h values of different treatment groups. The AUC values were calculated from fluorescence kinetic curves and normalized based on 175–350 kDa HA-liposomes value (set as 100%). (D) Ex vivo fluorescence intensities of various organs 24 h postinjection. All images are displayed on the same scale. (E) Image-based evaluation of the biodistribution of DiD-liposomes in various organs at 24 h. The average radiance was generated from ROIs drawn on individual organs. ***Significant difference compared to all other groups (p < 0.001, one-way ANOVA followed by Tukey’s multiple comparison test). N = 3–5 mice per treatment group.
Figure 2A shows representative images of CD-1 mice injected with equivalent doses of DiD-free dye, DiD-HA-liposomes (5–8, 50–60, and 175–350 kDa), or DiD-PEGylated liposomes after normalizing the fluorescence intensity to the same scale. As expected, the free dye was quickly removed from the body. All HA-liposomes showed lower systemic fluorescence intensities compared to PEGylated liposomes, as seen by the pseudo-red color representing the presence of DiD-liposomes in the body. The difference is more pronounced at the terminal time point of 24 h. Kinetic curves of fluorescence intensity were plotted based on the average radiance generated from the ROIs drawn at the skull region at different time points (Figure 2B). The trend of the fluorescence kinetic curves is consistent with the pharmacokinetic curves generated by 3H-liposomes; HA-liposomes had lower fluorescence intensity at all time points compared with PEGylated liposomes. The normalized fluorescence AUC0.083–24h values showed that PEGylated liposomes had significantly higher systemic exposure in comparison to all HA-liposomes (p < 0.001, Figure 2C), suggesting that HA-liposomes were less “stealthy” and could be recognized by the immune system for clearance.
We also monitored the fluorescence intensity of ex vivo organs 24 h postinjection (Figure 2D). Organs with the brightest yellow color represent the highest DiD-liposome accumulation. We have drawn ROIs on each individual organ, and average radiance is presented in Figure 2E. Consistent with the trend of 3H-liposome data, all HA-liposomes and PEGylated liposomes accumulated extensively in the spleen and liver, suggesting involvement of RES organs in the clearance of liposomes. These organs were not perfused with saline; the residual blood in capillaries may contribute to increased plasma and organ fluorescence levels seen with PEGylated liposomes. In comparison to radiotracer analysis, in vivo near-infrared fluorescence imaging data are semiquantitative since the image information is surface-weighted (i.e., anything closer to the surface will appear brighter), and background signals are typically observed due to tissue autofluorescence.72,73 However, the trend of imaging results is consistent with prior pharmacokinetic data, indicating that this noninvasive optical animal imaging method is convenient and useful in monitoring in vivo behavior of nanoparticles in real time.
Effects of HA Grafting Density on Circulation Time of HA-Liposomes
Grafting density of liposomes refers to the amount of ligand or coating polymer present on the liposome surface. In our previous in vitro study, we showed that HA grafting density is crucial for cellular uptake of HA-liposomes; HA-liposomes with higher grafting density had higher cellular uptake.50 We compared the circulation profiles of DiD-labeled 5–8 kDa HA-liposomes with high (HA/L = 78) and low (HA/L = 34) HA grafting densities in CD-1 mice. The fluorescence images of representative mice at different time points are presented in Figure 3A. The fluorescence kinetic curves revealed that DiD-HA-liposomes with high grafting density showed lower systemic exposure and higher splenic uptake (red spot at left abdominal region). The trend is more pronounced at 9 and 24 h (Figure 3A,B). The normalized fluorescence AUC0.083–24h values show that systemic exposure of 5–8 kDa HA-liposomes with low grafting density is significantly higher compared to HA-liposomes with high grafting density (p < 0.05, Figure 3C). The ex vivo organ fluorescence images at 24 h postinjection show the brightest fluorescence signals in the spleen and liver (Figure 3D). The sequence of organ fluorescence intensity is spleen > liver > kidney and lung > heart > brain for both high and low grafting density HA-liposomes, respectively (Figure 3E).
Figure 3.

Circulation and biodistribution of DiD-labeled 5–8 kDa HA-liposomes with high (HA/L = 78) or low (HA/L = 34) grafting densities in CD-1 mice. (A) Representative fluorescence images of mice after iv injection of HA-liposomes with high or low HA grafting density liposomes. Images are presented on the same scale. (B) Kinetic curves of fluorescence intensity of mice over time. The average radiance was generated from ROIs drawn at the skull region of mice representing systemic exposure of DiD-liposomes in mice. (C) Average radiance AUC0.083–24h values of liposomes; results were normalized to high grafting density HA-liposomes (100%). (D) Representative ex vivo fluorescence intensities of various organs 24 h postinjection on the same scale. (E) Fluorescence intensity in various organs at 24 h. The average radiance was generated from ROIs drawn on individual organs. *p < 0.05 after Student’s t test. N = 3 mice per treatment group.
Ligand grafting density is one of the crucial factors that may influence liposome clearance, as it directly affects receptor binding affinity and plasma–protein interactions. Despite the fact that, in vitro, HA-liposomes with higher grafting density had higher CD44-mediated cellular uptake,50 they displayed faster clearance in vivo, presumably due to their higher affinity to macrophages and other HA receptors. A similar observation was also reported that the presence of folic acid on the surface of liposomes compromised their blood circulation time.74 When the folate ligand density was higher than 0.15%, it resulted in lower circulating levels of folate-liposomes.75 Aptamer-targeted nanoparticles with very high (10%) and no (0%) grafting densities had higher hepatic and lower tumor uptake compared to moderate (1% and 5%) ligand densities.76 The optimal ligand density is referred to as the minimum amount of ligand on the nanoparticle surface to confer maximal targeting effect.76 Fine-tuning the HA polymer length and ligand grafting density is important to balance good systemic circulation and maximal target affinity.
Tumor Accumulation of NIR-Labeled HA-Liposomes in MDA-MB-231 Subcutaneous Xenografts
Since receptor-mediated uptake is dependent upon ligand–receptor interactions, we sought to determine whether the presence of tumor-targeting ligand HA on the surface of liposomes would enhance their ability to actively target tumors and overcome the previously observed loss in circulation time. We compared tumor accumulation of the actively targeted HA-liposomes and passively targeted PEGylated liposomes in nude mice bearing CD44-overexpressing MDA-MB-231 tumors. We injected equal doses of DiD-HA-liposomes with different HA polymer lengths or PEGylated DiD-liposomes iv in MDA-MB-231 xenografts and monitored tumor accumulation for up to 96 h using the real-time imaging method (Figure 4A). ROIs were drawn at the subcutaneous tumor region at the right flank of the mice (white circle, Figure 4A). The average radiance of the tumor at different time points is presented in Figure 4B. PEGylated liposomes not only showed higher tumor-associated fluorescence compared to HA-liposomes of all HA sizes (5–8, 50–60, and 175–350 kDa HA) but also had higher overall body fluorescence, suggesting higher systemic exposure at all time points (Figure 4A,B). The normalized tumor fluorescence AUC0.083–96h values show that tumor exposure of PEGylated liposomes was ∼3–5-fold higher than 5–8, 50–60, 175–350 kDa HA-liposomes (p < 0.05), with no statistically significant difference among all HA-liposomes (Figure 4C). Consistent with the grafting density experiment performed in healthy mice, 5–8 kDa HA-liposomes with high HA content (HA/L= 78) showed significantly lower tumor accumulation compared to 5–8 kDa HA-liposome with low HA content (HA/L = 39) in MDA-MB-231 xenografts (Figure 4D,E, p < 0.01).
Figure 4.

Tumor accumulation of DiD-labeled HA-liposomes with varying MW of HA in MDA-MB-231 xenografts. (A) Fluorescence images of mice after iv injection of 5–8 kDa (i), 50–60 kDa (ii), 175–350 kDa (iii), HA-liposomes or PEGylated liposomes (iv). All images were normalized to the same scale; white circles show the location of subcutaneous tumor. (B) Kinetic curves of fluorescence intensity of the tumor during 0.083–96 h (inset, 0.083–2 h) postinjection. Average radiance was generated from the ROIs drawn at the tumor. (C) Normalized tumor fluorescence AUC0.083–96h after treatment with HA-liposomes or PEGylated liposomes. The tumor AUC values were generated from fluorescence kinetic curves and normalized to 175–350 kDa HA-liposomes (100%). Tumor fluorescence intensity–time curves (D) and normalized tumor fluorescence AUC0.083–48h (E) after iv injection of 5–8 kDa HA-liposomes with high (HA/L = 78) or low (HA/L = 34) grafting densities. Tumor fluorescence intensity–time curves (F) and normalized tumor fluorescence AUC0.083–96h (G) of mice that received an iv injection of 175–350 kDa HA-liposomes with or without treatment with chondroitin sulfate A (CsA). Arrows on the x-axis represent time of CsA injection (−1, 4, 23 h). *Significant difference compared to all other groups (p < 0.05, one-way ANOVA followed by Tukey’s multiple comparison tests). **p < 0.01 after t test, ns = not significant. N = 3–6 mice per treatment group.
These results indicate that nanocarrier blood circulation time is critically important for active tumor targeting. Partitioning from blood to tumor through active tumor targeting mechanisms requires sufficient blood residence time and circulating levels before tumor accumulation and receptor-mediated uptake can occur. For passive and active targeting mechanisms, nanoparticles must first move across the leaky vasculature of the tumor and extravasate into the tumor interstitium. Nanoparticle extravasation is directly proportional to the concentration of nanoparticles in blood.9 If fewer targeted nanoparticles are able to reach the tumor site, the gains from active targeting after extravasation into the tumor will be compromised. Our results support the notion that mass transport of nanoparticles across the tumor vasculature is the rate-limiting step for targeted delivery, and the kinetics of this step is largely unaffected by receptor-binding at the target.20 We also observed that the PEGylated liposomes accumulate at the tumor gradually over 96 h, while tumor accumulation of all HA-liposomes dropped within the initial 6 h (Figure 4B,D). We speculate that nonspecific hepatic and splenic HA-receptors quickly removed HA-liposomes from circulation, resulting in decreased delivery to the tumor.
We also determined whether blocking hepatic and splenic receptors for HA clearance would enhance circulation time and tumor accumulation of HA-liposomes. Chondroitin sulfate A (CsA) is a sulfated glycosaminoglycan that binds to hepatic and splenic receptors for HA clearance (HARE) and has weak affinity for CD44.77 We injected CsA (5 mg/mouse) intraperitoneally 1 h prior to and 4 and 23 h postinjection of 175–350 kDa DiD-HA-liposomes in MDA-MB-231 xenografts. The imaging results show that CsA treatment only modestly improved the systemic circulation and tumor accumulation of HA-liposomes (Figure 4F), but the difference in tumor fluorescence AUC values was not statistically significant (p > 0.05, Figure 4G).
Effects of PEGylation of HA-Liposomes on Cancer Cell Uptake and Macrophage Phagocytosis in Vitro
To enhance circulation time of HA-liposomes, we prepared DiD-labeled PEG-175–350kHA-liposomes with dual PEG and HA coating. The PEG-175–350kHA-liposomes (5 mol % PEG-5000) had a mean particle size of 120 nm. PEG coating reduced the surface’s negative charge (ζ −9.23 mV, Table 1) and brought the zeta potential close to that of the nearly neutral charge of PEGylated liposomes (ζ −6.6 mV). We first tested CD44-mediated cellular uptake in MDA-MB-231 cells using flow cytometry analysis (Figure 5A). As expected, PEGylated liposomes displayed the lowest cellular uptake (set as 100%), as the steric and electrostatic hindrance of PEG reduces interactions of liposomes with cells and hampers cellular entrance.14 Plain liposomes, devoid of any surface coating, had significantly higher uptake than PEGylated liposomes (p < 0.0001). Conjugation of HA to liposomes significantly enhanced the CD44-mediated cellular uptake (p < 0.0001). Uptake was HA size dependent (5–8 < 50–60 < 170–350 kDa HA-liposomes), which is in agreement with a previous report showing that longer polymeric HA chains improve ligand accessibility to CD44 and promote multivalent binding to receptor.50 The 175–350 kDa HA-liposomes had a 4.9-fold higher cellular uptake than plain liposomes (p < 0.0001). When incorporating PEG, PEG-175–350kHA-liposomes showed significantly higher uptake than both PEGylated liposomes (4.3-fold, p < 0.0001) and plain liposomes (1.5-fold, p < 0.01), but lower uptake than 175–350 kDa HA-liposomes (31%, p < 0.0001). Therefore, the sequence of in vitro cancer cell uptake was 175–350 kDa HA-liposomes > 50–60 kDa HA-liposomes > 5–8 kDa HA-liposomes > PEG-175–350kHA-liposomes > plain liposomes > PEGylated liposomes.
Figure 5.

Quantitative analysis of in vitro tumor cell uptake and macrophage phagocytosis of DiD-labeled liposomes. (A) Cellular uptake of various liposomes in CD44-overexpressing MDA-MB-231 cells. (B) Phagocytosis of various liposomes in THP-1 macrophages. The uptake of liposomes was measured by flow cytometry, and the mean fluorescence was expressed as a percentage of the PEGylated liposomes (100%). **p < 0.01, ***p < 0.001, ****p < 0.0001 significant difference compared to PEGylated liposomes (one-way ANOVA followed by Dunnett’s multiple comparison test). #p < 0.05, ##p < 0.01, ###p < 0.001, ####p < 0.0001 significant difference compared to plain liposomes (one-way ANOVA followed by Dunnett’s multiple comparison test).
We also performed an in vitro phagocytosis assay using human-derived, differentiated THP-1 macrophages;78 the phagocytic uptake of DiD-liposomes was analyzed by flow cytometry (Figure 5B). PEGylated liposomes displayed the lowest phagocytosis (set as 100%), which is consistent with their “stealth” effect. Plain liposomes had significantly higher levels of phagocytosis than PEGylated liposomes (p < 0.0001). The phagocytosis of HA-liposomes in THP-1 cells was dependent on polymer length of HA with 5–8 ≈ 50–60 < 175–350 kDa HA-liposomes. All HA-liposomes displayed significantly higher phagocytosis than PEGylated liposomes (p < 0.0001). Interestingly, LMW HA-liposomes (5–8 and 50–60 kDa) showed significantly lower phagocytosis than plain liposomes (p < 0.05). PEG-175–350kHA-liposomes showed significantly higher phagocytosis than PEGylated liposomes (1.67-fold, p < 0.001), but lower than plain liposomes (75%, p < 0.0001) and 175–350 kDa HA-liposomes (54%, p < 0.0001) (Figure 5B). Thus, despite modest cancer cell uptake, PEG-175–350kHA-liposomes were selected because of their improved “stealth” properties.
Effects of Dual PEG and HA Coating on Liposome Circulation in Healthy Mice
To determine whether liposomes with dual PEG and HA coating display long circulation properties in vivo, we used a real-time optical imaging method to monitor circulation profiles of DiD-labeled PEG-175–350kHA-liposomes in CD-1 mice after iv injection. As shown in Figure 6, PEG-175–350kHA-liposomes displayed markedly improved systemic circulation compared to 175–350 kDa HA-liposomes, as demonstrated by higher fluorescence intensity in healthy mice at later time points (2–24 h, Figure 6A). Fluorescence kinetic plots generated from the average radiance of ROIs drawn at the skull region further confirmed the enhanced systemic exposure of PEG-175–350kHA-liposomes (Figure 6B). Fluorescence AUC values of PEG-175–350kHA-liposomes were calculated and normalized with respect to 175–350 kDa HA-liposomes (set as 100%) (Figure 6C). These AUC values show that systemic exposure to PEG-175–350kHA-liposomes was significantly higher than that of 175–350 kDa HA-liposomes (p < 0.05). The difference between the PEGylated liposomes and PEG-175–350kHA-liposomes was not significant (p > 0.05) (Figure 6C). The ex vivo organ fluorescence intensity images at 24 h are presented in Figure 6D. Semiquantitative analysis of average radiance of individual organs shows enhanced plasma and organ uptake of PEG-175–350kHA-liposomes compared to 175–350 kDa HA-liposomes (Figure 6E).
Figure 6.

Imaging analysis of circulation and biodistribution of DiD-labeled PEG-175–350kHA-liposomes in healthy mice. (A) Representative fluorescence images of CD-1 mice after iv injection of 175–350kHA (i), PEG-175–350kHA (ii), or PEGylated (iii) liposomes on the same scale. (B) Kinetic curves of fluorescence intensity of mice during 0.083–24 h postinjection. The average radiance was generated from ROIs drawn at the skull region of mice representing systemic exposure of DiD-liposomes in mice. (C) Fluorescence AUC0.083–24h of DiD-liposomes. The AUC values were generated from the average radiance kinetic curves and normalized to control (100%). (D) Representative ex vivo fluorescence intensities of various organs 24 h postinjection of DiD-liposomes on the same scale. (E) Mean fluorescence intensity in various organs at 24 h. *p < 0.05, **p < 0.01 significant difference compared to 175–350kD HA-liposomes (one-way ANOVA followed by Tukey’s multiple comparison test, ns = not significant). N = 3 or 4 mice per treatment group.
PEGylation may minimize opsonization through not only steric hindrance but also charge shielding.17,79 PEG in the PEG-175–350kHA-liposomes (ζ = −9.23 mV) serves to shield excess negative charges exhibited by HA-liposomes (ζ ≈ −50 mV) and promotes steric hindrance against various opsonins, which leads to significantly reduced RES uptake and prolonged blood circulation. Together, these data show that PEG-175–350kHA-liposomes display long circulation properties similar to those of PEGylated liposomes in healthy mice with an intact immune system.
Biodistribution and Tumor Accumulation of PEG-175–350kHA-Liposomes in Tumor-Bearing Mice
To determine whether the actively targeted PEG-175–350 kDaHA-liposomes with dual PEG and HA coating improve tumor accumulation compared to passively targeted PEGylated liposomes, we injected DiD-labeled PEGylated or PEG-175–350kHA liposomes iv to nude mice bearing MDA-MB-231 tumors (∼300 mm3) on both flanks. Fluorescence intensity from optical imaging of representative mice at different time points is presented in Figure 7A. Both formulations showed long circulating properties, consistent with that observed in healthy mice. We drew ROIs at the tumor region to measure tumor liposome levels. Surprisingly, the total tumor accumulation of both formulations was similar despite PEG-175–350kHA-liposomes containing the tumor-targeting moiety, HA (Figure 7B,C). To further confirm these results, 3H-labeled PEGylated liposomes or PEG-175–350kHA-liposomes were injected into MDA-MB-231 tumor-bearing mice. The radioactivity (%ID/g, after heart perfusion) of blood, various organs, and tumor 24 h postinjection is presented in Figure 7D,E. Both formulations had similar blood levels and organ distribution patterns. Although PEG-175–350kHA-liposomes displayed slightly higher accumulation than PEGylated liposomes in tumor, the difference was not significant (p > 0.05, Figure 7E).
Figure 7.

Tumor accumulation of PEG-175–350kHA-liposomes in MDA-MB-231 xenografts. (A) Representative fluorescence images of mice after iv injection of PEGylated liposomes (i) or PEG-175–350kHA-liposomes (ii) on the same scale. White circles represent subcutaneous tumors on left and right flanks. (B) Kinetic curves of fluorescence intensity of tumor during 0.083–24 h postinjection. The average radiance was generated from ROIs drawn at the tumor region. (C) The tumor fluorescence AUC0.083–24h of DiD-liposomes. The AUC values were generated from the fluorescence kinetic curves and normalized to control (100%). (D) Biodistribution of 3H-liposomes in major organs of MDA-MB-231 xenografts at 24 h. (E) Tumor accumulation of 3H-liposomes in MDA-MB-231 xenografts at 24 h. N = 3 or 4 mice per treatment group; ns = not significant.
HA-targeted and nontargeted liposomes had comparable tumor accumulation levels. This result is in agreement with theoretical modeling studies predicting that targeting ligands will not significantly increase tumor uptake relative to untargeted liposomes.80 Several studies also reported similar observations. For instance, the pharmacokinetics profiles of the anti-HER2 and anti-EGFR immunoliposomes and their nontargeted liposomes were almost identical; the immunoliposomes did not significantly increase tumor accumulation at the tumor tissue compared to the nontargeted liposomes.81,82 HER2-coated poly(dl-lactic acid) nanoparticles also showed no difference in biodistribution as compared with nontargeted nanoparticles.83 High-affinity and high-specificity αvβ6 ligand H009 peptide-targeted liposomes displayed similar tumor accumulation patterns to nontargeted PEGylated liposomes.84 We have shown that PEG-175–350 kDaHA-liposomes displayed enhanced CD44-receptor-mediated cellular uptake compared to PEGylated liposomes in vitro (Figure 5A). Others have documented the therapeutic advantage of HA-liposomes encapsulating various anticancer drugs.36,49 Yet, increased total tumor accumulation was ruled out as the mechanism responsible for the HA ligand-targeted liposomes.
Intratumoral Microdistribution and Intracellular Internalization of PEG-HA-Liposomes versus PEGylated Liposomes
To further investigate the above paradox and delineate the relative contributions of passive and active targeting of PEG-HA-liposomes, we compared the intratumoral microdistribution of passively targeted PEGylated liposomes and actively targeted PEG-HA-liposomes within the tumor tissue. We collected MDA-MB-231 tumors after 24 h of systemic circulation of DiD-labeled PEGylated or PEG-175–350kHA liposomes for histology examination. The distribution of DiD-liposomes (pink) in the whole mounted tumor section (DAPI, blue) was visualized by fluorescence microscopy. At low magnification, PEGylated liposomes accumulated mainly at the tumor periphery (Figure 8A, i), whereas PEG-175–350kHA-liposomes showed more penetration inside the tumor (Figure 8B, ii). We also stained for CD44 receptor expression and, as expected, the tumors showed very high expression of CD44 throughout the tumor (green, Figure 8B). PEGylated liposomes showed an uneven or patchy distribution, predominantly in the vicinity of the tumor edge, and less association with CD44-positive cells (Figure 8B, i). In contrast, PEG-175–350kHA-liposomes distributed more uniformly, and in close association with CD44-positive cells (Figure 8B, ii). When visualized using confocal microscopy at high magnification (Figure 8C), PEGylated liposomes (dotted pattern, Figure 8C, i) had less direct co-localization with CD44-positive cells compared to PEG-175–350kHA-liposomes (Figure 8C, ii). The microscopic deposition pattern of PEGylated liposomes is consistent with previous reports that long-circulating stealth liposomes typically accumulate predominantly within tumor stroma, either in the extracellular space or within tumor-resident macrophages, with virtually no tumor cell internalization.81,85
Figure 8.

Microdistribution and internalization of DiD-labeled PEGylated liposomes versus PEG-175–350kHA-liposomes in subcutaneous MDA-MB-231 tumor tissues. (A) Representative image of microdisribution of PEGylated liposomes (i) and PEG-175–350kHA-liposomes (ii) in whole tumors at low magnification (objective = 2× , scale bar = 100 μm) 24 h post iv injection. Tumors were snap frozen and sectioned into 10 μm thick slices. Tumor cell nuclei were stained with DAPI (blue), and DiD-liposomes appear as pink dots. (B) CD44 receptor expression in tumor slices treated with PEGylated liposomes (i) or PEG-175–350kHA-liposomes (ii) (objective = 40 × , scale bar = 10 μm). Green staining represents the presence of CD44 receptor, which is expressed throughout all tumors, pink dots represent the DiD-liposomes, and the overlay shows the receptor association of liposomes. (C) Confocal fluorescence images of CD44 receptor co-localization with DiD-liposomes in tumor slices treated with PEGylated liposomes (i) and PEG-175–350kHA-liposomes (ii) (objective = 40×, numerical aperture = 1.4, scale bar = 20 μm). Green staining represents the CD44 receptor, pink dots represent the DiD-liposomes that are bound to or taken up by cells, and tumor cell nuclei were stained with DAPI (blue). N = 3 or 4 mice per treatment group.
We also performed a quantitative flow cytometry analysis to determine the cellular internalization of passively versus actively targeted liposomes using ex vivo tumor cells. MDA-MB-231 tumors were excised 24 h after iv injection of equal doses of DiD-labeled PEGylated or PEG-175–350 kDaHA-liposomes. Tumors were disaggregated; tumor cell suspensions were harvested (98% cell viability), and mean fluorescence of cells was determined. PEG-175–350kHA-liposome-treated tumor cells had nearly a 2.5-fold higher intracellular fluorescence compared to PEGylated liposome-treated tumor cells (p < 0.05) (Figure 9A). These data are consistent with in vitro observations that PEG-HA-liposomes have higher cellular internalization than PEGylated liposomes (Figure 5A), due to CD44 receptor-mediated endocytosis.50 These results demonstrate that targeted PEG-HA-liposomes had higher intracellular internalization (true tumor targeting) compared to PEGylated stealth liposomes. This result is in agreement with several previous observations. For instance, HER2-targeted immunoliposomes did not increase tumor localization but increased internalization in HER2-overexpressing breast cancer xenografts.81 EGFR-targeted immunoliposomes internalized extensively within tumor cells (92%) compared to nontargeted liposomes (5%), despite the fact that both liposomes had comparable accumulation in EGFR-overexpressing tumors.82 Additionally, transferrin-targeted siRNA nanoparticles enhanced intracellular delivery rather than overall tumor uptake,86,87 and ligand-targeted gold nanocrystals altered intracellular distribution patterns without affecting total gold accumulation in the tumor.20 Taken together, our results, along with other reports, suggest that passively targeted and actively targeted nanocarriers are comparable in overall tumor accumulation, but display distinct intracellular delivery mechanisms.
Figure 9.
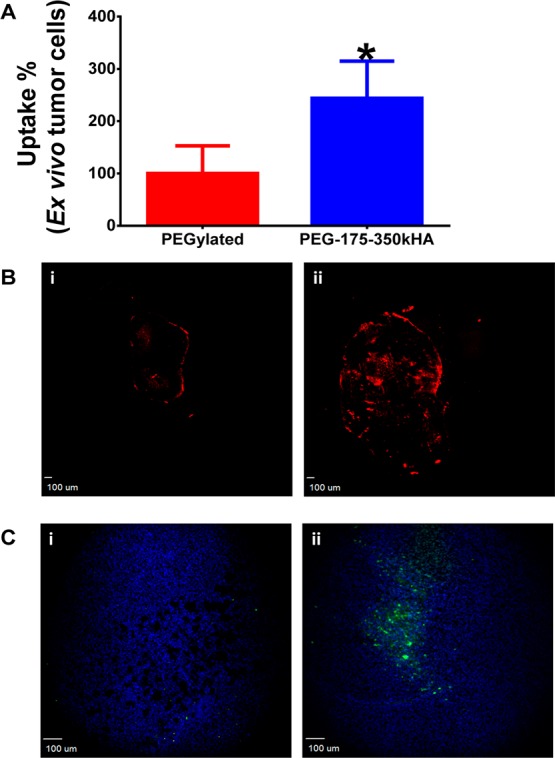
Ex vivo flow cytometry analysis of tumor cellular internalization of liposomes and cleaved caspase-3 staining after liposomal doxorubicin therapy. (A) Ex vivo tumor cellular internalization of DiD-labeled PEGylated liposomes and PEG-175–350kHA-liposomes. The tumor cells were harvested from disaggregated tumor. The internalized formulations were measured by flow cytometry, and mean fluorescence intensity was normalized to control (set as 100%). *Significant difference compared to PEGylated liposomes (p < 0.05, t-test). (B) Distribution of doxorubicin (red) in the entire tumor tissue section (objective = 2×, scale bar = 100 μm) 48 h post iv injection of doxorubicin-encapsulated PEGylated liposomes (i) or PEG-175–350kHA-liposomes (ii). (C) Immunofluorescence staining of cleaved caspase-3 antibody (green) and DAPI (blue) in tumor tissue section (objective = 10×, scale bar = 100 μm) 48 h post iv injection of PEGylated liposomal doxorubicin (i) or PEG-175–350kHA-liposomal doxorubicin (ii).
Next, we replaced DiD dye with the anticancer agent doxorubicin and assessed drug distribution and apoptosis in vivo. Figure 9B shows representative images for the distribution of doxorubicin (red fluorescence) in the entire tumor tissue section 48 h after a single bolus dose of 10 mg/kg of doxorubicin encapsulated in PEGylated (i) or PEG-175–350kHA liposomes (ii). Consistent with the DiD-liposomes, doxorubicin accumulated mainly at the periphery of the PEGylated liposome-treated tumors. In contrast, doxorubicin showed more penetration and internalization in PEG-175–350kHA-liposome-treated tumors (Figure 9B), which produced higher cleaved caspase-3 staining (a marker of apoptosis) (Figure 9C, ii) than that of the PEGylated liposomal doxorubicin-treated tumor (Figure 9C, i). This result indicates that improved cellular internalization of doxorubicin led to enhanced apoptosis in tumors. A previous study showed that HA-targeted liposomal doxorubicin displayed superior therapeutic responses compared to Doxil (commercial PEGylated liposomal doxorubicin) and free doxorubicin in tumor-bearing syngeneic mice (BDF1/P388/ADR ascites, C57BL/6/B16F10.9 lung metastasis, and BALB/c/C-26 solid tumors) and in nude mice bearing PANC-1 solid tumors.49 The present study offers a potential mechanism (i.e., improved intracellular delivery) to account for this improved efficacy. Similarly, doxorubicin-loaded anti-HER2 immunoliposomes were significantly superior to other treatments including free doxorubicin, liposomal doxorubicin, and anti-HER2 antibody in tumor growth inhibition.88 Greater intracellular uptake of immunoliposomes, rather than increased total tumor accumulation, was correlated with improved antitumor activity.81 Anti-EGFR immunoliposomes loaded with various anticancer drugs, such as doxorubicin, epirubicin, and vinorelbine, showed significantly improved antitumor effects compared to the corresponding free or liposomal drug.82 Total accumulations of anti-EGFR immunoliposomes and nontargeted liposomes in EGFR-overexpressing tumors were comparable, but the immunoliposomes internalized extensively within tumor cells,82 suggesting that an improvement in tumor cellular internalization with no difference in total tumor delivery can translate into efficacy in terms of prolonging survival or tumor growth inhibition. Together, our results support the notion that the use of tumor-targeting ligands does not increase the total tumor accumulation of targeted nanocarriers in solid tumors. However, targeting can increase the intracellular internalization of nanocarriers and, thus, potentially contribute to improved therapeutic efficacy.
Conclusion
This study provides mechanistic insights into how CD44 ligand-targeted HA-liposomes work in vivo. Although HA is a hydrophilic biocompatible polymer, incorporation of targeting moiety HA on the surface of liposomes can compromise the liposome’s circulation time in the blood, negatively affecting tumor accumulation compared to PEGylated liposomes. Therefore, HA cannot serve as a substitute for PEG as stealth coating polymer. In vivo clearance of HA-liposomes was dependent upon HA polymer length (HMW HA-liposomes had faster clearance) and HA grafting density (too much HA coating led to faster clearance). Our studies indicate that long blood circulation is critical for active tumor targeting. Mass transport of nanoparticles across the tumor vasculature is the rate-limiting step in tumor accumulation regardless of the presence or absence of tumor-targeting ligand. When dual PEG and HA coating was used, PEGylation reduced the negative surface charge of HA-liposomes, reduced their cellular uptake in vitro, but prolonged their circulation time in vivo. The actively targeted PEG-HA-liposomes displayed equal tumor site accumulation as passively targeted PEGylated liposomes, but PEG-HA-liposomes had better cellular internalization capabilities than PEGylated liposomes in vivo. Our data suggest that the passively targeted EPR effect, rather than active ligand targeting, drives HA-liposome blood circulation, extravasation, and accumulation in tumors. The HA-CD44 ligand–receptor interaction occurs after delivery by blood circulation and extravasation; targeting ligand HA alters the microdistribution of the cargo and facilitates the entry and internalization of the payload into CD44-positive tumor cells.
Methods
Chemicals
1,2-Dipalmitoyl-sn-glycero-3-phosphocholine (DPPC), 1,2-dihexadecanoyl-sn-glycero-3-phosphoethanolamine (DPPE), and cholesterol were purchased from Avanti Polar Lipids (Alabaster, AL, USA). 3H-Cholesteryl hexadecyl ether (3H-CHE) was purchased from PerkinElmer (Boston, MA, USA). DPPE-mPEG5000 sodium salt was a kind gift from Lipoid GmbH (Newark, NJ, USA). Hyaluronan of various MWs (5–8, 50–60, and 175–350 kDa) was purchased from Lifecore Biomedical (Chaska, MN, USA). Hexadecyltrimethylammonium bromide (CTAB), 1-ethyl-3-(3-(dimethylamino)propyl)carbodiimide (EDC), and N-hydroxysulfosuccinamide (NHSS) were purchased from Sigma-Aldrich (St. Louis, MO, USA). The fluorescent dyes DiD (1,1′-dioctadecyl-3,3,3′,3′-tetramethylindodicarbocyanine, 4-chlorobenzenesulfonate salt) and DAPI (4, 6-diamidino-2-phenylindole) were obtained from Invitrogen (Carlsbad, CA, USA). Doxorubicin was obtained from LC Laboratories (Woburn, MA, USA). Scintisafe 30% cocktail scintillation fluid was purchased from Fisher Scientific (Pittsburgh, PA, USA). Solvable was purchased from PerkinElmer. All other chemicals were purchased from Sigma-Aldrich and were of standard analytic grade or higher.
Cell Culture
Human breast cancer cell line MDA-MB-231 and human monocytic cell line THP-1 were obtained from ATCC (Manassas, VA, USA). MDA-MB-231 cells were maintained in RPMI-1640 medium (Mediatech, Inc.; Manassas, VA, USA) supplemented with 10% fetal bovine serum (FBS) (Gibco, Invitrogen), 100 U/mL penicillin, and 100 μg/mL streptomycin. THP-1 cells were cultured as suspension in RPMI-1640 medium with 10% FBS and 0.05 mM 2-mercaptoethanol (Sigma). Cell suspension was maintained at a density of 1 × 10⁶/mL. To differentiate THP-1 monocytes into macrophages, cells were incubated with 200 ng/mL phorbol 12-myristate 13-acetate (PMA, Sigma) for 96 h, and the adherent THP-1 cells were used for phagocytic experiments.78 All cells were incubated at 37 °C in a humidified atmosphere with 5% CO2.
Animals
Female CD-1 mice [Crl: CD1 (ICR), weighing 25–35 g] and athymic female nude mice (Nu/Nu, aged 6–8 weeks) were obtained from Charles River Laboratories. All animal procedures were performed according to the Institutional Animal Care and Use Committee approved protocols. To establish the subcutaneous tumor model, exponentially growing MDA-MB-231 cells were suspended in serum and antibiotic-free RPMI-1640 medium containing 50% Matrigel (BD Biosciences) to a final concentration of 5 × 10⁷ cells/mL. Cell suspensions (5 × 10⁶ cells/100 μL) were injected into the subcutaneous flanks of nude mice near the hind limb. Tumor growth was measured with a caliper, and tumor volume (mm3) was calculated as V = 0.5 × length × width2. Once tumor volumes were at or above 300 mm3, animals were randomly assigned to different groups and injected with various formulations through the lateral tail veins. Mice with ulcerated tumors were excluded from the studies.
Liposome Preparation and Characterization
Liposomes composed of DPPC/DPPE/cholesterol at 55:5:40 molar ratios were prepared by film hydration and size extrusion procedures as previously described.50 Radiolabeled liposomes were prepared by incorporating 3H-CHE at a concentration of 0.5 μCi/μmol phospholipids into a lipid mixture and quantified by liquid scintillation counting (Beckman LS 6500). NIR fluorescent liposomes were prepared by adding DiD oil to the lipid mixture at a final concentration of 0.5 mg/mL liposomes, and unentrapped free dye was removed by Sephadex G-25 gel filtration chromatography (>98% entrapment). The DiD content was quantified by a fluorescence plate reader (Biotek, Winooski, VT, USA, ex/em = 645/665). The leakage of entrapped DiD from liposomes was negligible within 2 weeks. Different MWs of HA (5–8, 50–60, and 175–350 kDa) were covalently conjugated to the surface of liposomes using EDC and NHSS coupling agents.50,51 Unconjugated HA was removed by repeated washing and ultracentrifugation (150000g). HA conjugation increased the particle size, so the HA-liposomes were re-extruded through 100 nm pore size polycarbonate membranes using an extruder (Avestin Inc., Ottawa, Canada). The amount of HA conjugated to the liposomes was determined by CTAB precipitation assay.50 Size-matched PEGylated liposomes were prepared by replacing 5 mol % cholesterol with DPPE-mPEG5000. PEG-HA-liposomes were prepared similarly (DPPC/DPPE/DPPE-mPEG5000/cholesterol at 55:5:5:35 molar ratios) and then conjugated to 175–350 kDa HA. Final lipid concentrations of liposomes were 20 mM. Doxorubicin was encapsulated into liposomes via the ammonium sulfate remote loading method.89 The final doxorubicin concentration was 1.4 mg/mL of liposome. The size and zeta potential of liposomes were determined by a Malvern Zetasizer Nano ZS90 (Malvern Inc., Westborough, MA, USA). Particle size of the liposomes was measured after 100-fold dilution in PBS, and the zeta potential was measured after 100-fold dilution in 0.001 M KCl solution. All liposomes were sterile-filtered through a 0.2 μm filter before animal injection and used within 2 weeks after preparation.
Pharmacokinetics and Biodistribution of 3H-Liposomes
CD-1 mice were randomly divided into four groups with 3–6 animals per group per time point. Mice received a 0.1 μCi/g dose of 3H–CHE-labeled PEGylated or HA-liposomes (5–8, 50–60, and 175–350 kDa HA) as a single iv bolus injection through the tail vein. The lipid dose was approximately 0.14 μmol/g. Blood samples were drawn by cardiac puncture at 1.5, 3, 6, 9, and 24 h, and 20 μL aliquots were transferred into preweighed scintillation glass vials. At 24 h postinjection, mice were euthanized, various organs such as heart, lung, liver, spleen, kidney, and brain were removed, and 20–40 mg of tissue slices were cut and transferred to preweighed scintillation glass vials. Then, 1 mL of Solvable was added to sample vials followed by overnight incubation at 55 °C to digest the tissues. Samples were cooled to room temperature, and 0.25 mL of 30% H2O2 was added to decolorize the samples. Next, 10 mL of Scintisafe scintillation fluid was added, and samples were stored in the dark for 3 h before determining the radioactivity in a liquid scintillation analyzer (Beckmann LS 6500). Sample disintegrations per minute (dpm, 1 μCi = 2.22 × 10⁶ dpm) values were obtained. The total volume of blood was assumed to be 7% of body weight.90 The percent injected dose (%ID) and percent injected dose per gram (%ID/g) values were calculated using the following equations:
Pharmacokinetic parameters were obtained by noncompartmental analysis with iv bolus input using Phoenix WinNonlin software (Pharsight, Sunnyvale, CA, USA). The initial dosing was set at 100% at time zero. A minimum of three data points were used for terminal half-life calculation.
Real-Time Imaging of NIR Dye-Labeled Liposomes
Far red dye DiD-labeled PEGylated and HA-liposome (5–8, 50–60, and 175–350 kDa HA) were administered to CD-1 mice at 0.2 μg of DiD/g as a single iv bolus injection through the tail vein. Mice were anesthetized with a constant supply of 2% isoflurane and imaged at 5, 10, and 30 min and 1, 2, 4, 6, 9, and 24 h postinjection by a Calipers IVIS Lumina XR imager (Caliper Life Sciences Inc., Hopkinton, MA, USA). The fluorescence filters were set at ex 640 nm and em 720 nm. Images were taken under autoexposure setting with high lamp intensity. After the terminal time point, mice were euthanized in a CO2 chamber followed by cervical dislocation. Blood samples were collected from the heart, and plasma was separated. All major organs were removed, washed twice with PBS, blotted dry, and transferred to a Petri dish. Ex vivo organ fluorescence intensities were recorded at similar imaging settings. Living Image Software (Caliper Life Sciences Inc., Hopkinton, MA, USA) was used to analyze the imaging data generated. Regions of interest were drawn at the brain/skull region of CD-1 mice, and average radiance obtained was plotted against time to get the fluorescence kinetic curves of DiD-liposomes. Average radiance ([p/s/cm2/sr]/[μW/cm2]) refers to the sum of the radiance from each pixel inside the ROI divided by the number of pixels. Average radiance AUC values were calculated from the fluorescence kinetic curves and normalized to that of control liposomes (set as 100%). The MDA-MB-231 xenografts were imaged similarly up to 96 h, when treated with various DiD-liposomes. ROIs were drawn around subcutaneous tumor regions to generate the average radiance from tumors. Fluorescence kinetic curves and tumor average radiance AUC values were used to compare the tumor localization of various DiD-liposomes.
Cellular Uptake and Phagocytosis Assay
Exponentially growing CD44-positive MDA-MB-231 cells or PMA differentiated THP-1 macrophages were plated on a 12-well plate (0.2–0.3 million/well) in complete growth media overnight. DiD-labeled plain liposomes, PEGylated liposomes, HA-liposomes, and PEG-175–350kHA-liposomes were diluted in serum-free media to a final concentration of 2.5 μg/mL of DiD and were added to the cells for 2 h at 37 °C. Cells were washed with ice-cold PBS three times and then trypsinized for 10 min to detach them and remove any surface-bound liposomes. Cells were further washed and resuspended in 0.4 mL of ice-cold PBS. Cellular uptake of the DiD-liposomes was measured by an Accuri C6 flow cytometer (BD Biosciences, San Jose, CA, USA) using the FL4 filter. A total of 10 000 events were recorded for each analysis. Mean fluorescence intensity of cells was normalized to that of PEGylated liposomes (set as 100%), and the relative uptake of different treatments was presented as percentage of control.
Histology and Quantitation of Internalized Liposomes
DiD-labeled PEGylated or PEG-175–350kHA liposomes were injected iv into nude mice bearing MDA-MB-231 tumors (3 or 4 animals per group) at 0.2 μg of DiD/g. Mice were euthanized after 24 h; tumors were removed and cut into two equal portions. One half of the tumor was immediately snap-frozen in isopentane at −80 °C for histology analysis. The other half of the tumor was minced in ice-cold complete growth media and passed through the 40 μm cell strainer using a plunger to harvest tumor cells. Cell suspensions obtained were washed twice with ice-cold PBS and resuspended in 400 μL of PBS. Cell viability was analyzed via trypan blue exclusion assay. The fluorescence of DiD-liposomes in ex vivo tumor cells was measured immediately by an Accuri C6 flow cytometer. MDA-MB-231 cells grown in vitro were used as unstained control. Cells were excited with a 488 nm laser, and fluorescence was recorded using the Cy5 (FL-4) channel for DiD-liposomes.
Snap frozen tumors were embedded in optimum cutting temperature compound (OTC) and cut into 10 μm thick sections using a cryostat (Leica CM 30505). Tissue slices were placed on Charged Plus slides, fixed in 4% paraformaldehyde at 4 °C for 30 min, and stained with DAPI solution (2 μg/mL). The distribution of DiD-liposomes in whole tumors was visualized with a 2× objective on an Olympus IX81 inverted fluorescence microscope. Excitation and emission filters were 360 ± 20 and 460 ± 25 nm for the blue channel (DAPI, nucleus) and 620 ± 60 and 700 ± 75 nm for the Cy5 channel (DiD-liposome). To visualize tumor CD44 expression, tumor slices were stained with anti-human CD44H (clone 2C5, R&D Systems) as primary antibody and Alexa Fluor 488-labeled goat anti-human antibody (Invitrogen) as secondary antibody. Images were acquired by using either an IX81 fluorescence microscope (40× objective) equipped with a CCD camera or a Nikon A1R MP confocal microscope (40× oil immersion objective, numerical aperture = 1.4).
Liposomal Doxorubicin Administration
Doxorubicin-encapsulated PEGylated or PEG-175–350kHA liposomes were injected iv via tail vein to MDA-MB-231 xenografts at a dose of 10 mg of doxorubicin/kg. Mice were sacrificed 48 h after injection, and tumors were dissected. The distribution of doxorubicin in the entire tumor tissue sections (10 μm thickness) was imaged using an IX81 fluorescence microscope (2× objective, Texas Red filter). Immediately after imaging, the tumor slices were fixed in 4% paraformaldehyde and incubated with anticleaved caspase-3 antibody (Cell Signaling) at 1/250 dilution at room temperature for 1 h. The slides were washed with PBS and then incubated with species-matched Alexa Fluor 488-labeled secondary antibody at 1/1000 dilution at room temperature for 1 h. Tissues were counterstained with 2 μg/mL DAPI and imaged by the IX81 fluorescence microscope (10× objective, FITC filter).
Statistical Analysis
All values are expressed as mean ± standard deviation (SD). Differences between two group means were compared using an unpaired, two-sided Student’s t-test. Differences between multiple group means were compared by one-way ANOVA followed by Tukey’s or Dunnett’s multiple comparison tests using Graphpad Prism 6.0 (San Diego, CA, USA). Differences with p < 0.05 were considered significant.
Acknowledgments
This work was funded in part by an NIH CTSA NCTCTSI pilot award grant (UL1 RR024982) and a Laura W. Bush Institute for Women’s Health seed grant. The technical support of C. Adkins from TTUHSC on confocal microscopy is greatly appreciated. We thank R. Mehvar from TTUHSC for critically reading the manuscript.
Supporting Information Available
Cellular uptake and macrophage phagocytosis of PEG-5000 and PEG-2000 liposomes. This material is available free of charge via the Internet at http://pubs.acs.org.
The authors declare no competing financial interest.
Funding Statement
National Institutes of Health, United States
Supplementary Material
References
- Schroeder A.; Heller D. A.; Winslow M. M.; Dahlman J. E.; Pratt G. W.; Langer R.; Jacks T.; Anderson D. G. Treating Metastatic Cancer with Nanotechnology. Nat. Rev. Cancer 2012, 12, 39–50. [DOI] [PubMed] [Google Scholar]
- Allen T. M.; Cullis P. R. Liposomal Drug Delivery Systems: From Concept to Clinical Applications. Adv. Drug Delivery Rev. 2013, 65, 36–48. [DOI] [PubMed] [Google Scholar]
- Allen T. M.; Cullis P. R. Drug Delivery Systems: Entering the Mainstream. Science 2004, 303, 1818–1822. [DOI] [PubMed] [Google Scholar]
- Papahadjopoulos D.; Allen T. M.; Gabizon A.; Mayhew E.; Matthay K.; Huang S. K.; Lee K. D.; Woodle M. C.; Lasic D. D.; Redemann C.; et al. Sterically Stabilized Liposomes: Improvements in Pharmacokinetics and Antitumor Therapeutic Efficacy. Proc. Natl. Acad. Sci. U.S.A. 1991, 88, 11460–11464. [DOI] [PMC free article] [PubMed] [Google Scholar]
- Allen T. M.; Hansen C.; Martin F.; Redemann C.; Yau-Young A. Liposomes Containing Synthetic Lipid Derivatives of Poly(Ethylene Glycol) Show Prolonged Circulation Half-Lives in Vivo. Biochim. Biophys. Acta 1991, 1066, 29–36. [DOI] [PubMed] [Google Scholar]
- Klibanov A. L.; Maruyama K.; Torchilin V. P.; Huang L. Amphipathic Polyethyleneglycols Effectively Prolong the Circulation Time of Liposomes. FEBS Lett. 1990, 268, 235–237. [DOI] [PubMed] [Google Scholar]
- Matsumura Y.; Maeda H. A New Concept for Macromolecular Therapeutics in Cancer Chemotherapy: Mechanism of Tumoritropic Accumulation of Proteins and the Antitumor Agent Smancs. Cancer Res. 1986, 46, 6387–6392. [PubMed] [Google Scholar]
- Yuan F.; Leunig M.; Huang S. K.; Berk D. A.; Papahadjopoulos D.; Jain R. K. Microvascular Permeability and Interstitial Penetration of Sterically Stabilized (Stealth) Liposomes in a Human Tumor Xenograft. Cancer Res. 1994, 54, 3352–3356. [PubMed] [Google Scholar]
- Maeda H.; Wu J.; Sawa T.; Matsumura Y.; Hori K. Tumor Vascular Permeability and the EPR Effect in Macromolecular Therapeutics: A Review. J. Controlled Release 2000, 65, 271–284. [DOI] [PubMed] [Google Scholar]
- Fang J.; Nakamura H.; Maeda H. The Epr Effect: Unique Features of Tumor Blood Vessels for Drug Delivery, Factors Involved, and Limitations and Augmentation of the Effect. Adv. Drug Delivery Rev. 2011, 63, 136–151. [DOI] [PubMed] [Google Scholar]
- Alexis F.; Pridgen E.; Molnar L. K.; Farokhzad O. C. Factors Affecting the Clearance and Biodistribution of Polymeric Nanoparticles. Mol. Pharm. 2008, 5, 505–515. [DOI] [PMC free article] [PubMed] [Google Scholar]
- Peer D.; Karp J. M.; Hong S.; Farokhzad O. C.; Margalit R.; Langer R. Nanocarriers as an Emerging Platform for Cancer Therapy. Nat. Nanotechnol. 2007, 2, 751–760. [DOI] [PubMed] [Google Scholar]
- Hatakeyama H.; Akita H.; Harashima H. A Multifunctional Envelope Type Nano Device (Mend) for Gene Delivery to Tumours Based on the Epr Effect: A Strategy for Overcoming the Peg Dilemma. Adv. Drug Delivery Rev. 2011, 63, 152–160. [DOI] [PubMed] [Google Scholar]
- Knop K.; Hoogenboom R.; Fischer D.; Schubert U. S. Poly(Ethylene Glycol) in Drug Delivery: Pros and Cons as Well as Potential Alternatives. Angew. Chem., Int. Ed. 2010, 49, 6288–6308. [DOI] [PubMed] [Google Scholar]
- Mishra S.; Webster P.; Davis M. E. Pegylation Significantly Affects Cellular Uptake and Intracellular Trafficking of Non-Viral Gene Delivery Particles. Eur. J. Cell Biol. 2004, 83, 97–111. [DOI] [PubMed] [Google Scholar]
- Hong R. L.; Huang C. J.; Tseng Y. L.; Pang V. F.; Chen S. T.; Liu J. J.; Chang F. H. Direct Comparison of Liposomal Doxorubicin with or without Polyethylene Glycol Coating in C-26 Tumor-Bearing Mice: Is Surface Coating with Polyethylene Glycol Beneficial?. Clin. Cancer Res. 1999, 5, 3645–3652. [PubMed] [Google Scholar]
- Li S.-D.; Huang L. Pharmacokinetics and Biodistribution of Nanoparticles. Mol. Pharm. 2008, 5, 496–504. [DOI] [PubMed] [Google Scholar]
- Chou L. Y.; Ming K.; Chan W. C. Strategies for the Intracellular Delivery of Nanoparticles. Chem. Soc. Rev. 2011, 40, 233–245. [DOI] [PubMed] [Google Scholar]
- Kinam P. Facing the Truth about Nanotechnology in Drug Delivery. ACS Nano 2013, 7. [DOI] [PMC free article] [PubMed] [Google Scholar]
- Huang X.; Peng X.; Wang Y.; Shin D. M.; El-Sayed M. A.; Nie S. A Reexamination of Active and Passive Tumor Targeting by Using Rod-Shaped Gold Nanocrystals and Covalently Conjugated Peptide Ligands. ACS Nano 2010, 4, 5887–5896. [DOI] [PMC free article] [PubMed] [Google Scholar]
- Pirollo K. F.; Chang E. H. Does a Targeting Ligand Influence Nanoparticle Tumor Localization or Uptake?. Trends Biotechnol. 2008, 26, 552–558. [DOI] [PubMed] [Google Scholar]
- Kwon I.; Lee S.; Han B.; Park K. Analysis on the Current Status of Targeted Drug Delivery to Tumors. J. Controlled Release 2012, 164, 108–114. [DOI] [PMC free article] [PubMed] [Google Scholar]
- Bae Y.; Park K. Targeted Drug Delivery to Tumors: Myths, Reality and Possibility. J. Controlled Release 2011, 153, 198–205. [DOI] [PMC free article] [PubMed] [Google Scholar]
- Perrault S.; Walkey C.; Jennings T.; Fischer H.; Chan W. Mediating Tumor Targeting Efficiency of Nanoparticles through Design. Nano Lett. 2009, 9, 1909–1915. [DOI] [PubMed] [Google Scholar]
- Albanese A.; Tang P.; Chan W. The Effect of Nanoparticle Size, Shape, and Surface Chemistry on Biological Systems. Annu. Rev. Biomed. Eng. 2012, 14, 1–16. [DOI] [PubMed] [Google Scholar]
- Ruenraroengsak P.; Cook J.; Florence A. Nanosystem Drug Targeting: Facing up to Complex Realities. J. Controlled Release 2010, 141, 265–276. [DOI] [PubMed] [Google Scholar]
- Koo H.; Huh M. S.; Sun I. C.; Yuk S. H.; Choi K.; Kim K.; Kwon I. C. In Vivo Targeted Delivery of Nanoparticles for Theranosis. Acc. Chem. Res. 2011, 44, 1018–1028. [DOI] [PubMed] [Google Scholar]
- Oh E. J.; Park K.; Kim K. S.; Kim J.; Yang J. A.; Kong J. H.; Lee M. Y.; Hoffman A. S.; Hahn S. K. Target Specific and Long-Acting Delivery of Protein, Peptide, and Nucleotide Therapeutics Using Hyaluronic Acid Derivatives. J. Controlled Release 2010, 141, 2–12. [DOI] [PubMed] [Google Scholar]
- Prestwich G. D. Hyaluronic Acid-Based Clinical Biomaterials Derived for Cell and Molecule Delivery in Regenerative Medicine. J. Controlled Release 2011, 155, 193–199. [DOI] [PMC free article] [PubMed] [Google Scholar]
- Zoller M. Cd44: Can a Cancer-Initiating Cell Profit from an Abundantly Expressed Molecule?. Nat. Rev. Cancer 2011, 11, 254–267. [DOI] [PubMed] [Google Scholar]
- Naor D.; Sionov R. V.; Ish-Shalom D. Cd44: Structure, Function, and Association with the Malignant Process. Adv. Cancer Res. 1997, 71, 241–319. [DOI] [PubMed] [Google Scholar]
- Toole B. P. Hyaluronan: From Extracellular Glue to Pericellular Cue. Nat. Rev. Cancer 2004, 4, 528–539. [DOI] [PubMed] [Google Scholar]
- Toole B. P. Hyaluronan-Cd44 Interactions in Cancer: Paradoxes and Possibilities. Clin. Cancer Res. 2009, 15, 7462–7468. [DOI] [PMC free article] [PubMed] [Google Scholar]
- Misra S.; Heldin P.; Hascall V. C.; Karamanos N. K.; Skandalis S. S.; Markwald R. R.; Ghatak S. Hyaluronan-Cd44 Interactions as Potential Targets for Cancer Therapy. FEBS J. 2011, 278, 1429–1443. [DOI] [PMC free article] [PubMed] [Google Scholar]
- Yerushalmi N.; Arad A.; Margalit R. Molecular and Cellular Studies of Hyaluronic Acid-Modified Liposomes as Bioadhesive Carriers for Topical Drug Delivery in Wound Healing. Arch. Biochem. Biophys. 1994, 313, 267–273. [DOI] [PubMed] [Google Scholar]
- Peer D.; Margalit R. Loading Mitomycin C inside Long Circulating Hyaluronan Targeted Nano-Liposomes Increases Its Antitumor Activity in Three Mice Tumor Models. Int. J. Cancer 2004, 108, 780–789. [DOI] [PubMed] [Google Scholar]
- Eliaz R. E.; Szoka F. C. Jr. Liposome-Encapsulated Doxorubicin Targeted to Cd44: A Strategy to Kill Cd44-Overexpressing Tumor Cells. Cancer Res. 2001, 61, 2592–2601. [PubMed] [Google Scholar]
- Chono S.; Li S. D.; Conwell C. C.; Huang L. An Efficient and Low Immunostimulatory Nanoparticle Formulation for Systemic siRNA Delivery to the Tumor. J. Controlled Release 2008, 131, 64–69. [DOI] [PMC free article] [PubMed] [Google Scholar]
- Peer D.; Park E. J.; Morishita Y.; Carman C. V.; Shimaoka M. Systemic Leukocyte-Directed siRNA Delivery Revealing Cyclin D1 as an Anti-Inflammatory Target. Science 2008, 319, 627–630. [DOI] [PMC free article] [PubMed] [Google Scholar]
- Esposito G.; Geninatti Crich S.; Aime S. Efficient Cellular Labeling by Cd44 Receptor-Mediated Uptake of Cationic Liposomes Functionalized with Hyaluronic Acid and Loaded with MRI Contrast Agents. ChemMedChem 2008, 3, 1858–1862. [DOI] [PubMed] [Google Scholar]
- Platt V. M.; Szoka F. C. Jr. Anticancer Therapeutics: Targeting Macromolecules and Nanocarriers to Hyaluronan or Cd44, a Hyaluronan Receptor. Mol. Pharm. 2008, 5, 474–486. [DOI] [PMC free article] [PubMed] [Google Scholar]
- Akima K.; Ito H.; Iwata Y.; Matsuo K.; Watari N.; Yanagi M.; Hagi H.; Oshima K.; Yagita A.; Atomi Y.; etal. Evaluation of Antitumor Activities of Hyaluronate Binding Antitumor Drugs: Synthesis, Characterization and Antitumor Activity. J. Drug Target 1996, 4, 1–8. [DOI] [PubMed] [Google Scholar]
- Auzenne E.; Ghosh S. C.; Khodadadian M.; Rivera B.; Farquhar D.; Price R. E.; Ravoori M.; Kundra V.; Freedman R. S.; Klostergaard J. Hyaluronic Acid-Paclitaxel: Antitumor Efficacy against Cd44(+) Human Ovarian Carcinoma Xenografts. Neoplasia 2007, 9, 479–486. [DOI] [PMC free article] [PubMed] [Google Scholar]
- Banzato A.; Bobisse S.; Rondina M.; Renier D.; Bettella F.; Esposito G.; Quintieri L.; Melendez-Alafort L.; Mazzi U.; Zanovello P.; etal. A Paclitaxel-Hyaluronan Bioconjugate Targeting Ovarian Cancer Affords a Potent in Vivo Therapeutic Activity. Clin. Cancer Res. 2008, 14, 3598–3606. [DOI] [PubMed] [Google Scholar]
- Bassi P. F.; Volpe A.; D’Agostino D.; Palermo G.; Renier D.; Franchini S.; Rosato A.; Racioppi M. Paclitaxel-Hyaluronic Acid for Intravesical Therapy of Bacillus Calmette-Guerin Refractory Carcinoma in Situ of the Bladder: Results of a Phase I Study. J. Urol. 2011, 185, 445–449. [DOI] [PubMed] [Google Scholar]
- Mittapalli R. K.; Liu X.; Adkins C. E.; Nounou M. I.; Bohn K. A.; Terrell T. B.; Qhattal H. S.; Geldenhuys W. J.; Palmieri D.; Steeg P. S.; etal. Paclitaxel-Hyaluronic Nanoconjugates Prolong Overall Survival in a Preclinical Brain Metastases of Breast Cancer Model. Mol. Cancer Ther. 2013, 12, 2389–2399. [DOI] [PMC free article] [PubMed] [Google Scholar]
- Galer C. E.; Sano D.; Ghosh S. C.; Hah J. H.; Auzenne E.; Hamir A. N.; Myers J. N.; Klostergaard J. Hyaluronic Acid-Paclitaxel Conjugate Inhibits Growth of Human Squamous Cell Carcinomas of the Head and Neck Via a Hyaluronic Acid-Mediated Mechanism. Oral Oncol. 2011, 47, 1039–1047. [DOI] [PubMed] [Google Scholar]
- Coradini D.; Zorzet S.; Rossin R.; Scarlata I.; Pellizzaro C.; Turrin C.; Bello M.; Cantoni S.; Speranza A.; Sava G.; etal. Inhibition of Hepatocellular Carcinomas in Vitro and Hepatic Metastases in Vivo in Mice by the Histone Deacetylase Inhibitor Ha-But. Clin. Cancer Res. 2004, 10, 4822–4830. [DOI] [PubMed] [Google Scholar]
- Peer D.; Margalit R. Tumor-Targeted Hyaluronan Nanoliposomes Increase the Antitumor Activity of Liposomal Doxorubicin in Syngeneic and Human Xenograft Mouse Tumor Models. Neoplasia 2004, 6, 343–353. [DOI] [PMC free article] [PubMed] [Google Scholar]
- Qhattal H. S.; Liu X. Characterization of Cd44-Mediated Cancer Cell Uptake and Intracellular Distribution of Hyaluronan-Grafted Liposomes. Mol. Pharm. 2011, 8, 1233–1246. [DOI] [PMC free article] [PubMed] [Google Scholar]
- Mizrahy S.; Raz S. R.; Hasgaard M.; Liu H.; Soffer-Tsur N.; Cohen K.; Dvash R.; Landsman-Milo D.; Bremer M. G.; Moghimi S. M.; etal. Hyaluronan-Coated Nanoparticles: The Influence of the Molecular Weight on Cd44-Hyaluronan Interactions and on the Immune Response. J. Controlled Release 2011, 156, 231–238. [DOI] [PubMed] [Google Scholar]
- Maxwell C. A.; McCarthy J.; Turley E. Cell-Surface and Mitotic-Spindle Rhamm: Moonlighting or Dual Oncogenic Functions?. J. Cell Sci. 2008, 121, 925–932. [DOI] [PubMed] [Google Scholar]
- Zhou B.; Weigel J. A.; Saxena A.; Weigel P. H. Molecular Cloning and Functional Expression of the Rat 175-kDa Hyaluronan Receptor for Endocytosis. Mol. Biol. Cell 2002, 13, 2853–2868. [DOI] [PMC free article] [PubMed] [Google Scholar]
- Jackson D. G. Immunological Functions of Hyaluronan and Its Receptors in the Lymphatics. Immunol. Rev. 2009, 230, 216–231. [DOI] [PubMed] [Google Scholar]
- Jiang D.; Liang J.; Fan J.; Yu S.; Chen S.; Luo Y.; Prestwich G. D.; Mascarenhas M. M.; Garg H. G.; Quinn D. A.; etal. Regulation of Lung Injury and Repair by Toll-Like Receptors and Hyaluronan. Nat. Med. 2005, 11, 1173–1179. [DOI] [PubMed] [Google Scholar]
- Lebel L.; Fraser J. R.; Kimpton W. S.; Gabrielsson J.; Gerdin B.; Laurent T. C. A Pharmacokinetic Model of Intravenously Administered Hyaluronan in Sheep. Pharm. Res. 1989, 6, 677–682. [DOI] [PubMed] [Google Scholar]
- Lebel L.; Gabrielsson J.; Laurent T. C.; Gerdin B. Kinetics of Circulating Hyaluronan in Humans. 4. Eur. J. Clin. Invest. 1994, 24, 621–626. [DOI] [PubMed] [Google Scholar]
- Jadin L.; Bookbinder L. H.; Frost G. I. A Comprehensive Model of Hyaluronan Turnover in the Mouse. Matrix Biol. 2012, 31, 81–89. [DOI] [PubMed] [Google Scholar]
- Allen T. M.; Hansen C. B.; Lopes de Menezes D. E. Pharmacokinetics of Long-Circulating Liposomes. Adv. Drug Delivery Rev. 1995, 16, 267–284. [Google Scholar]
- Woodle M.; Matthay K.; Newman M.; Hidayat J.; Collins L.; Redemann C.; Martin F.; Papahadjopoulos D. Versatility in Lipid Compositions Showing Prolonged Circulation with Sterically Stabilized Liposomes. Biochim. Biophys. Acta 1992, 1105, 193–200. [DOI] [PubMed] [Google Scholar]
- Crielaard B.; Yousefi A.; Schillemans J.; Vermehren C.; Buyens K.; Braeckmans K.; Lammers T.; Storm G. An in Vitro Assay Based on Surface Plasmon Resonance to Predict the in Vivo Circulation Kinetics of Liposomes. J. Controlled Release 2011, 156, 307–314. [DOI] [PubMed] [Google Scholar]
- Pool G. L.; French M. E.; Edwards R. A.; Huang L.; Lumb R. H. Use of Radiolabeled Hexadecyl Cholesteryl Ether as a Liposome Marker. Lipids 1982, 17, 448–452. [DOI] [PubMed] [Google Scholar]
- Capriotti A.; Caracciolo G.; Cavaliere C.; Foglia P.; Pozzi D.; Samperi R.; Laganà A. Do Plasma Proteins Distinguish between Liposomes of Varying Charge Density?. J. Proteomics 2012, 75, 1924–1932. [DOI] [PubMed] [Google Scholar]
- Gessner A.; Lieske A.; Paulke B.; Müller R. Influence of Surface Charge Density on Protein Adsorption on Polymeric Nanoparticles: Analysis by Two-Dimensional Electrophoresis. Eur. J. Pharm. Biopharm. 2002, 54, 165–170. [DOI] [PubMed] [Google Scholar]
- Levchenko T.; Rammohan R.; Lukyanov A.; Whiteman K.; Torchilin V. Liposome Clearance in Mice: The Effect of a Separate and Combined Presence of Surface Charge and Polymer Coating. Int. J. Pharm. 2002, 240, 95–102. [DOI] [PubMed] [Google Scholar]
- Lee J.; Ankone M.; Pieters E.; Schiffelers R.; Hennink W.; Feijen J. Circulation Kinetics and Biodistribution of Dual-Labeled Polymersomes with Modulated Surface Charge in Tumor-Bearing Mice: Comparison with Stealth Liposomes. J. Controlled Release 2011, 155, 282–288. [DOI] [PubMed] [Google Scholar]
- Kim K. S.; Hur W.; Park S. J.; Hong S. W.; Choi J. E.; Goh E. J.; Yoon S. K.; Hahn S. K. Bioimaging for Targeted Delivery of Hyaluronic Acid Derivatives to the Livers in Cirrhotic Mice Using Quantum Dots. ACS Nano 2010, 4, 3005–3014. [DOI] [PubMed] [Google Scholar]
- Melendez-Alafort L.; Nadali A.; Zangoni E.; Banzato A.; Rondina M.; Rosato A.; Mazzi U. Biokinetic and Dosimetric Studies of 188re-Hyaluronic Acid: A New Radiopharmaceutical for Treatment of Hepatocellular Carcinoma. Nucl. Med. Biol. 2009, 36, 693–701. [DOI] [PubMed] [Google Scholar]
- Veiseh M.; Breadner D.; Ma J.; Akentieva N.; Savani R. C.; Harrison R.; Mikilus D.; Collis L.; Gustafson S.; Lee T. Y.; etal. Imaging of Homeostatic, Neoplastic, and Injured Tissues by Ha-Based Probes. Biomacromolecules 2012, 13, 12–22. [DOI] [PMC free article] [PubMed] [Google Scholar]
- Harris E. N.; Kyosseva S. V.; Weigel J. A.; Weigel P. H. Expression, Processing, and Glycosaminoglycan Binding Activity of the Recombinant Human 315-kDa Hyaluronic Acid Receptor for Endocytosis (Hare). J. Biol. Chem. 2007, 282, 2785–2797. [DOI] [PubMed] [Google Scholar]
- Wrobel T.; Dziegiel P.; Mazur G.; Zabel M.; Kuliczkowski K.; Szuba A. Lyve-1 Expression on High Endothelial Venules (Hevs) of Lymph Nodes. Lymphology 2005, 38, 107–110. [PubMed] [Google Scholar]
- Weissleder R.; Mahmood U. Molecular Imaging. Radiology 2001, 219, 316–333. [DOI] [PubMed] [Google Scholar]
- James M.; Gambhir S. A Molecular Imaging Primer: Modalities, Imaging Agents, and Applications. Physiol. Rev. 2012, 92, 897–965. [DOI] [PubMed] [Google Scholar]
- Gabizon A.; Horowitz A. T.; Goren D.; Tzemach D.; Shmeeda H.; Zalipsky S. In Vivo Fate of Folate-Targeted Polyethylene-Glycol Liposomes in Tumor-Bearing Mice. Clin. Cancer Res. 2003, 9, 6551–6559. [PubMed] [Google Scholar]
- McNeeley K. M.; Annapragada A.; Bellamkonda R. V. Decreased Circulation Time Offsets Increased Efficacy of Pegylated Nanocarriers Targeting Folate Receptors of Glioma. Nanotechnology 2007, 18. [Google Scholar]
- Gu F.; Zhang L.; Teply B. A.; Mann N.; Wang A.; Radovic-Moreno A. F.; Langer R.; Farokhzad O. C. Precise Engineering of Targeted Nanoparticles by Using Self-Assembled Biointegrated Block Copolymers. Proc. Natl. Acad. Sci. U.S.A. 2008, 105, 2586–2591. [DOI] [PMC free article] [PubMed] [Google Scholar]
- Harris E. N.; Weigel P. H. The Ligand-Binding Profile of Hare: Hyaluronan and Chondroitin Sulfates a, C, and D Bind to Overlapping Sites Distinct from the Sites for Heparin, Acetylated Low-Density Lipoprotein, Dermatan Sulfate, and Cs-E. Glycobiology 2008, 18, 638–648. [DOI] [PMC free article] [PubMed] [Google Scholar]
- Tsuchiya S.; Kobayashi Y.; Goto Y.; Okumura H.; Nakae S.; Konno T.; Tada K. Induction of Maturation in Cultured Human Monocytic Leukemia Cells by a Phorbol Diester. Cancer Res. 1982, 42, 1530–1536. [PubMed] [Google Scholar]
- Ernsting M.; Murakami M.; Roy A.; Li S.-D. Factors Controlling the Pharmacokinetics, Biodistribution and Intratumoral Penetration of Nanoparticles. J. Controlled Release 2013, 172, 782–794. [DOI] [PMC free article] [PubMed] [Google Scholar]
- Schmidt M. M.; Wittrup K. D. A Modeling Analysis of the Effects of Molecular Size and Binding Affinity on Tumor Targeting. Mol. Cancer Ther. 2009, 8, 2861–2871. [DOI] [PMC free article] [PubMed] [Google Scholar]
- Kirpotin D. B.; Drummond D. C.; Shao Y.; Shalaby M. R.; Hong K.; Nielsen U. B.; Marks J. D.; Benz C. C.; Park J. W. Antibody Targeting of Long-Circulating Lipidic Nanoparticles Does Not Increase Tumor Localization but Does Increase Internalization in Animal Models. Cancer Res. 2006, 66, 6732–6740. [DOI] [PubMed] [Google Scholar]
- Mamot C.; Drummond D. C.; Noble C. O.; Kallab V.; Guo Z.; Hong K.; Kirpotin D. B.; Park J. W. Epidermal Growth Factor Receptor-Targeted Immunoliposomes Significantly Enhance the Efficacy of Multiple Anticancer Drugs in Vivo. Cancer Res. 2005, 65, 11631–11638. [DOI] [PubMed] [Google Scholar]
- Cirstoiu-Hapca A.; Buchegger F.; Lange N.; Bossy L.; Gurny R.; Delie F. Benefit of Anti-Her2-Coated Paclitaxel-Loaded Immuno-Nanoparticles in the Treatment of Disseminated Ovarian Cancer: Therapeutic Efficacy and Biodistribution in Mice. J. Controlled Release 2010, 144, 324–331. [DOI] [PubMed] [Google Scholar]
- Gray B.; McGuire M.; Brown K. A Liposomal Drug Platform Overrides Peptide Ligand Targeting to a Cancer Biomarker, Irrespective of Ligand Affinity or Density. PloS One 2013, 8. [DOI] [PMC free article] [PubMed] [Google Scholar]
- Huang S. K.; Lee K. D.; Hong K.; Friend D. S.; Papahadjopoulos D. Microscopic Localization of Sterically Stabilized Liposomes in Colon Carcinoma-Bearing Mice. Cancer Res. 1992, 52, 5135–5143. [PubMed] [Google Scholar]
- Bartlett D. W.; Su H.; Hildebrandt I. J.; Weber W. A.; Davis M. E. Impact of Tumor-Specific Targeting on the Biodistribution and Efficacy of siRNA Nanoparticles Measured by Multimodality in Vivo Imaging. Proc. Natl. Acad. Sci. U.S.A. 2007, 104, 15549–15554. [DOI] [PMC free article] [PubMed] [Google Scholar]
- Choi C. H.; Alabi C. A.; Webster P.; Davis M. E. Mechanism of Active Targeting in Solid Tumors with Transferrin-Containing Gold Nanoparticles. Proc. Natl. Acad. Sci. U.S.A. 2010, 107, 1235–1240. [DOI] [PMC free article] [PubMed] [Google Scholar]
- Park J. W.; Hong K.; Kirpotin D. B.; Colbern G.; Shalaby R.; Baselga J.; Shao Y.; Nielsen U. B.; Marks J. D.; Moore D.; etal. Anti-Her2 Immunoliposomes: Enhanced Efficacy Attributable to Targeted Delivery. Clin. Cancer Res. 2002, 8, 1172–1181. [PubMed] [Google Scholar]
- Haran G.; Cohen R.; Bar L.; Barenholz Y. Transmembrane Ammonium Sulfate Gradients in Liposomes Produce Efficient and Stable Entrapment of Amphipathic Weak Bases. Biochim. Biophys. Acta 1993, 1151, 201–215. [DOI] [PubMed] [Google Scholar]
- Allen T. M.; Chonn A. Large Unilamellar Liposomes with Low Uptake into the Reticuloendothelial System. FEBS Lett. 1987, 223, 42–46. [DOI] [PubMed] [Google Scholar]
Associated Data
This section collects any data citations, data availability statements, or supplementary materials included in this article.