

Isolated congenital absence of the corpus callosum may result in significant social impairments despite intact general intelligence. Paul et al. report that approximately one-third of acallosal adults exhibit an autistic behaviour profile, while another third display social and communication impairments. Findings support a role for the corpus callosum in autism.
Keywords: autism, corpus callosum, developmental neuropathology, connectivity, social cognition
Abstract
The corpus callosum, with its ∼200 million axons, remains enigmatic in its contribution to cognition and behaviour. Agenesis of the corpus callosum is a congenital condition in which the corpus callosum fails to develop; such individuals exhibit localized deficits in non-literal language comprehension, humour, theory of mind and social reasoning. These findings together with parent reports suggest that behavioural and cognitive impairments in subjects with callosal agenesis may overlap with the profile of autism spectrum disorders, particularly with respect to impairments in social interaction and communication. To provide a comprehensive test of this hypothesis, we directly compared a group of 26 adults with callosal agenesis to a group of 28 adults with a diagnosis of autism spectrum disorder but no neurological abnormality. All participants had full-scale intelligence quotient scores >78 and groups were matched on age, handedness, and gender ratio. Using the Autism Diagnostic Observation Schedule together with current clinical presentation to assess autistic symptomatology, we found that 8/26 (about a third) of agenesis subjects presented with autism. However, more formal diagnosis additionally involving recollective parent-report measures regarding childhood behaviour showed that only 3/22 met complete formal criteria for an autism spectrum disorder (parent reports were unavailable for four subjects). We found no relationship between intelligence quotient and autism symptomatology in callosal agenesis, nor evidence that the presence of any residual corpus callosum differentiated those who exhibited current autism spectrum symptoms from those who did not. Relative to the autism spectrum comparison group, parent ratings of childhood behaviour indicated children with agenesis were less likely to meet diagnostic criteria for autism, even for those who met autism spectrum criteria as adults, and even though there was no group difference in parent report of current behaviours. The findings suggest two broad conclusions. First, they support the hypothesis that congenital disruption of the corpus callosum constitutes a major risk factor for developing autism. Second, they quantify specific features that distinguish autistic behaviour associated with callosal agenesis from autism more generally. Taken together, these two findings also leverage specific questions for future investigation: what are the distal causes (genetic and environmental) determining both callosal agenesis and its autistic features, and what are the proximal mechanisms by which absence of the callosum might generate autistic symptomatology?
Introduction
Agenesis of the corpus callosum (AgCC), a failure to develop the large bundle of fibres that connects the cerebral hemispheres, occurs in at least 1:4000 individuals (Glass et al., 2008). Current evidence suggests that a combination of genetic mechanisms, including single gene Mendelian and single gene sporadic mutations, as well as more complex genetics (which may have a mixture of inherited and sporadic mutations) may play a role in the aetiology of AgCC (Paul et al., 2007; Sajan et al., 2013). One highly informative mouse model of the developmental and molecular bases of AgCC, the BTBR inbred strain, is also widely used as a mouse model of autism (Wahlsten et al., 2003). Yet the cause of AgCC is identifiable for only 30–45% of human individuals (∼10% have chromosomal anomalies and the remaining 20–35% have recognizable genetic syndromes; Bedeschi et al., 2006). In these individuals, it is common also to see concomitant structural abnormalities such as polymicrogyria, pachygyria (abnormally broad gyri), heterotopias, and variability of anterior commissure structure (Goodyear et al., 2001; Shevell, 2002; Hetts et al., 2006). In the remaining 55–70% of individuals with AgCC, the cause is unknown and callosal agenesis is often an isolated neurological finding.
In a human foetus, rudimentary callosal fibres cross the midline by the 12th post-conceptual week (Rakic and Yakovlev, 1968; Kier and Truwit, 1996). AgCC results when some or all of the ∼200 million callosal axons fail to cross the midline, and are instead redirected into atypical fibre bundles (so-called Probst bundles) running anterior to posterior just lateral to the interhemispheric fissure and medial to the cingulum bundle (i.e. along the medial wall of each hemisphere) (Probst, 1972). AgCC is also typically accompanied by a characteristic dilatation of posterior lateral ventricles (colpocephaly) (Barkovich and Norman, 1988).
Neural functioning in isolated AgCC demonstrates the remarkable plasticity of the developing human brain, as well as the vulnerability of higher-order cognition. Despite complete absence of callosal connections, functional brain connectivity during rest is remarkably intact in isolated AgCC—indeed, adult brains with AgCC generate a typical, bilateral, set of resting-state functional brain networks (Tyszka et al., 2011). However, interhemispheric functional connectivity in AgCC seems to be more varied during cognitive tasks. For example, EEG recordings of visual evoked potentials demonstrate that visual signals do not propagate across the midline in AgCC (Brown et al., 1999), a pattern also evident in patients with surgical callosotomy. Despite this sensory disconnection, individuals with AgCC are capable of comparing simple visual stimuli such as letters and colours across visual fields and can conduct simple bimanual tasks normally (Brown et al., 1999; Mueller et al., 2009), indicating that simple conceptual and motor information can be transferred between the hemispheres in AgCC, perhaps through other connecting pathways such as the anterior commissure (Barr et al., 2005; Hsu et al., 2013). In general, individuals with AgCC do not exhibit the classic disconnection features found in patients with surgical resection of the corpus callosum, but do seem to have subtle limitations in interhemispheric transfer.
The limits of compensation for callosal disconnection in AgCC become more evident in tasks that require complex cognitive operations, demand rapid processing, and rely less on prior experience (Jeeves, 1979; Meerwaldt, 1983; Sauerwein and Lassonde, 1983; Brown et al., 2001; for review see Paul et al., 2007). Although AgCC does not seem to have a direct or dramatic impact on general cognitive ability (Chiarello, 1980; Sauerwein et al., 1994) or basic language skills (Liederman et al., 1985; Temple et al., 1989, 1990; Sauerwein et al., 1994), subtle deficits are evident in comprehension of syntax and linguistic pragmatics (including idioms, proverbs and vocal prosody) as well as humour and other non-literal language forms. These communicative deficits seem to arise from difficulties in over-riding literal interpretation together with difficulties in using context to infer meaning (Sanders, 1989; Banich and Brown, 2000; Paul et al., 2003; Brown et al., 2005; Huber-Okrainec et al., 2005). Additional deficits in AgCC include impairments in social problem solving (Symington et al., 2010), abstract reasoning (Brown and Paul, 2000), generalization (Solursh et al., 1965) and processing speed (Marco et al., 2012). Overall, AgCC often involves pronounced real-world social impairments similar to those seen in high-functioning people with autism, encompassing diminished social self-awareness (Brown and Paul, 2000), difficulty imagining the social perspective of others (Symington et al., 2010; Turk et al., 2010), poor conversation skills (O'Brien, 1994) and restricted verbal expression of emotional experience (similar to alexithymia; Buchanan et al., 1980; O'Brien, 1994).
Autism spectrum disorder (ASD) is a complex neuropsychiatric disorder whose diagnosis is based on deficits in communication and social interaction, as well as patterns of stereotyped, restricted and repetitive behaviours. Like AgCC, autism is a developmental disorder, and like AgCC it has a considerable, but complex and polygenic, heritable component (Parikshak et al., 2013). A current leading hypothesis is that autism arises from an atypical developmental course of connectivity and synapse formation in the brain, leading to its conceptualization as a category of disconnection disease (Belmonte et al., 2004; Just et al., 2004; Geschwind and Levitt, 2007). There is considerable heterogeneity among individuals with autism, and considerable heterogeneity in research findings of connectivity (Bellani et al., 2013; Keown et al., 2013; Redcay et al., 2013; Tyszka et al., 2013), leaving open the possibility that globally abnormal connectivity, or particular patterns of abnormal connectivity, may apply only to certain subtypes of autism.
There is more specific evidence implicating the corpus callosum in the abnormal connectivity of autism. Although some studies report reduced corpus callosum cross-sectional volume throughout the callosum in autism (Egaas et al., 1995; Manes et al., 1999; Boger-Megiddo et al., 2006; Alexander et al., 2007), others indicate involvement of select callosal regions [anterior (Manes et al., 1999; Vidal et al., 2006; Just et al., 2007; Kilian et al., 2008), midbody (Piven et al., 1997; Manes et al., 1999; Kilian et al., 2008), and posterior regions (Egaas et al., 1995; Piven et al., 1997; Vidal et al., 2006; Just et al., 2007) have all been implicated]. Similarly, one study of ASD found evidence of reduced fractional anisotropy of fibres (a measure of their organization in bundles) throughout the corpus callosum (Keller et al., 2007), whereas others found reductions specifically in the genu (Barnea-Goraly et al., 2004; Alexander et al., 2007) and splenium (Alexander et al., 2007). Complementing these abnormalities in white matter connectivity are their correlations with deficits in processing speed (Alexander et al., 2007), as well as impairments on cognitive tasks thought to require interhemispheric transfer of information (Minshew et al., 1997; Nyden et al., 2004), and decreased functional coupling between specific brain regions during various cognitive activation tasks (Just et al., 2004; Koshino et al., 2005; Kleinhans et al., 2008).
The above observations motivate the prediction that there might be overlap in the cognitive and behavioural difficulties seen in subjects with autism, and in people with AgCC. Indeed, there have been a few published attempts to identify the prevalence of ASD diagnoses in AgCC, although these have relied largely upon parent reports of clinical diagnoses and parent questionnaires about potential autism symptoms, and have typically included a wide range of participants, limiting quantitative characterization and specificity. For instance, surveys completed by caregivers of 720 children and adults with AgCC, indicated that 77% of the individuals with AgCC were considered to have some form of developmental delay (Moes et al., 2009). Seventy-six of 720 subjects were reportedly diagnosed with autism or Asperger’s disorder (10.6%). Follow-up studies in a subset from that survey, consisting of 61 children with AgCC aged 2–11 years, none of whom exhibited significant delays in motor and developmental milestones, showed that 23% had received a diagnosis of autism or Asperger’s syndrome (Badaruddin et al., 2007). In these children with limited developmental delays, the percentages of subjects who met specific autism criteria were highest in the social (34–46%) and communication domains (25–51%). A more recent study used the Autism Quotient questionnaire to screen for autism symptoms in AgCC. Of 106 participants, 45% of children, 35% of adolescents and 18% of adults exceeded the cut-off score on the Autism Quotient suggesting the presence of autism traits, but an autism spectrum diagnosis was not verified by clinical assessment or observation (Lau et al., 2012). Similarly, in an ongoing study of 16 individuals with AgCC, 5 of 10 children in the 6–17-year-old range scored close to or above the cut-off for autism classification on parent report measures (Booth et al., 2011). In the latter sample, the children with autism symptoms were older (13–17 years old) than those who did not show autism symptoms (7–12 years old). Most recently, a detailed case study of an adult male with partial AgCC who was also diagnosed with ASD reported lower performance across a variety of self-referential and social-cognitive measures than either neurotypical controls or adults with ASD who do not have AgCC, although the degree to which he benefitted from self-referencing in a memory task was similar to the ASD group (Lombardo et al., 2012). In sum, although parent reports from before 2000 (when the survey was conducted; Moes et al., 2009) indicate that only ∼10% of individuals with AgCC received a formal ASD diagnosis, more recent results from screening instruments suggest that 35–50% of children and adolescents with AgCC, and ∼20% of adults, exhibit significant autistic symptomatology.
These previous studies provide initial information about possible autism symptomatology in AgCC, but leave open two important topics: (i) the likelihood that individuals with AgCC will meet formal diagnostic criteria for autism and (ii) detailed characterization of similarities between the broader behavioural phenotype in AgCC and autism. The present study addresses both of these issues in a well characterized sample of 26 individuals with isolated AgCC.
Our first aim was to clarify the rate of formal autism diagnosis in adolescents and adults with AgCC. Autism can be diagnosed if an individual exhibits symptoms in two domains: (i) social communication; and (ii) restricted and repetitive behaviours, and if these symptoms are present early in life (typically before age 3) and result in significant functional impairment. The present study characterized current behaviour using (i) the Autism Diagnostic Observation Schedule (ADOS) (Lord et al., 2012), one of the best observational diagnostic measures available and considered to be the gold standard in research studies; and (ii) one or more parent report measures [Social Communication Questionnaire, SCQ (Rutter et al., 2003a) or Autism Diagnostic Interview-Revised, ADI-R (Rutter et al., 2003b)]. Information from clinical interview with the participant and, if available, a parent was also used to augment and validate outcomes of these measures. Diagnostic accuracy of autism is typically improved through use of both an observational and parent-report measure (Risi et al., 2006; Corsello et al., 2007). When assessing adults, parent report provides important diagnostic information regarding symptomatology during early childhood; however, recollective parent reports may be compromised by memory decay or distortion over time. All participants with AgCC received the ADOS, but parent reports (SCQ or ADI-R) were unavailable for four of these individuals, which reduced our sample size for formal autism assessment to 22 participants with AgCC.
Our second aim was to provide detailed characterization of autism symptomatology in AgCC, as well as to quantify the overlap of social skills deficits between AgCC and autism. For this analysis, we included all 26 individuals with AgCC and divided the group according to their observed autism symptomatology, distinguishing those who met ADOS criteria for autism (AgCC+) from those who did not (AgCC−). We first examined the possibility that callosal malformation (partial or complete AgCC) or demographic factors might account for the subgroup distinction. Behavioural variations among these two subgroups and a sample of individuals with a pure diagnosis of an ASD (with no AgCC) were assessed using autism diagnostic measures (ADOS, SCQ, ADI-R) as well as several additional research measures of social and emotional processing. From the pattern of differences across these groups, we sought to discern which, if any, social skills deficits are most strongly associated with callosal disconnection, which appear to be more clearly linked to autism (apart from callosal disconnection), and which might distinguish those people with AgCC who meet behavioural criteria for autism versus those who do not. Our study constitutes the first comprehensive direct comparison of autism and AgCC, and the first detailed characterization of autism symptomatology in AgCC.
Materials and methods
Participants
We studied two distinct groups of participants, one neurologically defined and the second psychiatrically defined: 26 with AgCC, and 28 with ASD. The AgCC group included 21 with complete agenesis of the corpus callosum and five with partial agenesis (Fig. 1). Participants with AgCC were still included if they had structural findings that commonly co-occur with AgCC: colpocephaly, Probst bundles, interhemispheric cysts and occasional small heterotopias. Potential participants with other structural brain abnormalities, such as frontal lobe dysgenesis and large regions of heterotopia, as well as those with known genetic syndromes, were not included. Presence of anterior commissure was confirmed in all participants with AgCC. For the five participants with partial AgCC, the per cent of residual callosum was estimated by visual inspection of callosal cross-sectional area in midline sagittal T1 MRI images. Residual callosum was <10% of normal size in two participants, 10–25% in one participant, and 25–75% in two others. Diffusion MRI studies indicate that structural connectivity of the remnant corpus callosum in partial AgCC can be highly variable (Wahl et al., 2009). Therefore, the location of residual callosum cannot be assumed to represent the same connectivity as that region within an intact corpus callosum. Analysis of individual connectivity patterns in our participants with partial AgCC was beyond the scope of this study.
Figure 1.
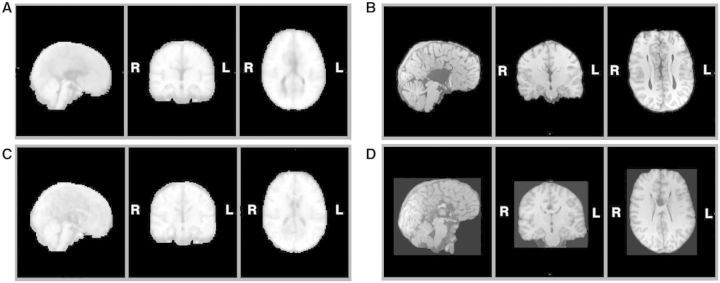
Structural MRI of participants with agenesis of the corpus callosum. Here we divided the entire AgCC group, based on neurological criteria, into those with complete agenesis and those with partial agenesis, and for each constructed a midspace template by iterative non-linear registration to an initial MNI-space target template of all T1-weighted structural images from that group (Tyszka et al., 2011): (A) midspace template for complete AgCC (n = 21); (B) representative anatomy in a participant with complete AgCC; (C) midspace template for partial AgCC (n = 5); and (D) representative anatomy in a participant with partial AgCC. Diffusion studies indicate that structural connectivity of the remnant corpus callosum in partial AgCC can be highly variable (Wahl et al., 2009). Therefore, the location of residual callosum cannot be assumed to represent the same connectivity as that region within an intact corpus callosum.
AgCC participants were recruited through the National Organization for Disorders of the Corpus Callosum and the Caltech Corpus Callosum Research Program and were enrolled into an ongoing research programme on agenesis of the corpus callosum at Caltech. AgCC diagnosis was confirmed by structural MRI, and background information was gathered as part of the larger research programme. Twenty-eight high-functioning individuals with an ASD were recruited from an existing research registry at Caltech. These individuals all had a DSM-IV-TR diagnosis of autism or Asperger’s syndrome, which was confirmed on the ADOS. None of these individuals showed evidence of callosal agenesis, dysgenesis, or other visually apparent malformation on structural MRI.
Exclusionary criteria for both groups included English as a second language, history of moderate-to-severe head injury, major neurological disorder not associated with AgCC, intractable epilepsy, major psychiatric illness other than ASD and comorbid depression/anxiety, and drug abuse as assessed by clinical interview. To avoid confounding effects due to borderline general intellectual function, full-scale IQ ≥70 was required. Full-scale IQ was measured using Wechsler Intelligence Tests [Wechsler Adult Intelligence Scale-III; Fowler et al., 1988) n = 23 AgCC; Wechsler Intelligence Scale for Children-III, (Wechsler, 1991), n = 1 AgCC; Wechsler Abbreviated Scale of Intelligence (Wechsler, 1999), n = 2 AgCC and n = 28 ASD]. The Wechsler Abbreviated Scale of Intelligence and Wechsler Adult Intelligence Scale-III are reliably correlated (full-scale IQ r = 0.87; verbal IQ r = 0.88; performance IQ r = 0.84). Depression and anxiety symptoms are commonly co-morbid with ASD (Mazzone et al., 2012; Matson and Williams, 2013) so rather than excluding participants with these symptoms, we confirmed that groups did not differ on indicators of depression [Beck Depression Inventory-II (Beck et al., 1996), a self-report questionnaire that examines current depressive symptomatology from the previous 2 weeks], anxiety [State-Trait Anxiety Inventory (Spielberger et al., 1983), a self-report questionnaire that differentiates between state and trait anxiety] and current mood [Positive and Negative Affect Schedule (Crawford and Henry, 2004), a self-report measure of state affect].
Demographic data for both groups are available in Table 1. Groups were compared using Student’s t-test (for pairwise parametric contrasts) and Fisher’s exact test (for testing differences in proportions; 3 × 2 for handedness, 2 × 2 for gender, 4 × 2 for education). The AgCC and ASD groups did not differ significantly on age, d = 0.08, gender, P = 0.13, or education, P = 0.07, nor did they differ on basic measures of mood and anxiety: Positive and Negative Affect Schedule (negative, d = 0.02; positive, d = 0.09), State-Trait Anxiety Inventory (trait, d = 0.34; state, d = 0.56) and Beck Depression Inventory-II, d = 0.23. However the ASD group had significantly higher IQ scores: full scale IQ, t(52) = 3.97, P < 0.001, d = 1.10, performance IQ, t(52) = 3.53, P = 0.001, d = 0.98, and verbal IQ, t(52) = 2.97, P = 0.005, d = 0.82. The groups also differed on handedness, P < 0.001.
Table 1.
Demographics and background neuropsychological measures
| AgCC (n = 26) | ASD (n = 28) | |
|---|---|---|
| Age | ||
| Mean ± SD | 28.77 ± 11.25 | 29.61 ± 11.11 |
| Range | 16–54 | 19–56 |
| FSIQ** | ||
| Mean ± SD | 95.46 ± 14.15 | 109.54 ± 11.86 |
| Range | 78–129 | 93–133 |
| PIQ** | ||
| Mean ± SD | 93.92 ± 15.45 | 107.43 ± 12.58 |
| Range | 69–117 | 84–128 |
| VIQ* | ||
| Mean ± SD | 97.35 ± 15.66 | 110.21 ± 16.14 |
| Range | 76–135 | 80–139 |
| Gender | 10F: 16M | 5F: 23M |
| Handedness** | 4A: 7L: 15R | 5A: 1L: 22R |
| Education | 6 in high school | 1 in high school |
| 15 high school graduates | 16 high school graduates | |
| 2 Bachelors degree | 8 Bachelors degree | |
| 3 Masters degree | 3 Masters degree | |
| PANAS positive | ||
| Mean ± SD | 32.62 ± 9.14 | 31.74 ± 9.99 |
| Range | 17–50 | 10–50 |
| PANAS negative | ||
| Mean ± SD | 13.88 ± 6.54 | 14.00 ± 4.57 |
| Range | 10–38 | 10–31 |
| STAI state | ||
| Mean ± SD | 31.88 ± 10.06 | 37.38 ± 9.55 |
| Range | 20–60 | 20–53 |
| STAI trait | ||
| Mean ± SD | 37.96 ± 12.31 | 41.5 ± 10.30 |
| Range | 21–67 | 23–60 |
| BDI-II | ||
| Mean ± SD | 7.85 ± 9.38 | 6.04 ± 5.99 |
| Range | 0–36 | 0 – 21 |
*P < 0.005; **P < 0.001.
FSIQ = full-scale IQ; PIQ = performance IQ; VIQ = verbal IQ; PANAS = Positive and Negative Affect Scale; STAI = State Trait Anxiety Inventory; BDI-II = Beck Depression Inventory-II.
All participants gave informed consent (assent with parent consent for four minors) under a protocol approved by the Human Subjects Protection committee of the California Institute of Technology, and the study adhered to American Psychological Association ethical principles.
Measures
Autism Diagnostic Instruments
The ADOS (Lord et al., 1989, 2001) is a standardized observational diagnostic measure organized into four separate modules, based on the age and expressive language level of the individual being assessed. Module 4, designed for verbally fluent adolescents and adults, was administered to all participants in this study. The ADOS consists of communication and social behaviour items that are scored from 0 (no abnormality) to 3 (severe abnormality). A select subset of items is included in a diagnostic algorithm that results in a classification of autism, autism spectrum, or non-spectrum. A participant meets criteria for a classification of autism or an ASD if the scores in the social and communication domains and the total on the algorithm meet or exceed cut-off scores. Validity of Module 4 of the ADOS is strong, with sensitivity of 90% and specificity of 93% when differentiating autism and ASDs from non-spectrum disorders (Lord et al., 2012).
The ADI-R (Rutter et al., 2003b) is a semi-structured interview containing questions about the three areas of behaviours associated with an ASD (social, communication, and restricted behaviour). Most items are scored from 0 (no abnormality) to 3 (abnormality that interferes with daily life). As with the ADOS, a select subset of items is included in the diagnostic algorithm, with separate cut-off scores for each domain. Most ADI-R diagnostic algorithm items are coded based on past behaviour for adult participants; however, current functioning can also be coded and assessed with a current algorithm scoring system.
The SCQ (Rutter et al., 2003a) is a 40-item, parent-completed, screening questionnaire, based on the initial mandatory probes from the original ADI (LeCouteur et al., 1989) covering the areas of communication, reciprocal social interactions, and restricted and repetitive behaviours and interests. As such, it is sometimes used as proxy for the ADI-R, and is highly correlated with ADI-R scores (Rutter et al., 2003a). Each item is checked as ‘yes’ or ‘no’, and assigned a point rating of ‘1’ (presence of abnormal behaviour) or ‘0’ (absence of abnormal behaviour). The points are summed and yield a total possible score of 0–39. Totals are compared to a cut-off of ≥15 for an ASD. There are two different versions of the SCQ: (i) a ‘current’ version designed for children under the age of 5 years; and (ii) a ‘lifetime’ version designed for children 5 years of age or older, with all questions based on lifetime or past behaviour. The lifetime version was used for all participants in this study.
The SRS-2 (Constantino, 2012) is a questionnaire focusing on social difficulties present in individuals with autism consisting of 65 behaviours organized into five domains. The SRS-2 Adult Form (Self-Report) was completed by our participants and the SRS-2 Adult Form (Relative/Other Report) was completed by a parent or significant other.
Other psychological measures
The Benton Facial Recognition task measures the ability to discriminate identity of faces, thereby assessing basic visuoperceptual ability in relation to face processing; results are reported as standardized T-scores (Benton et al., 1983).
The Reading the Mind in the Eyes (revised version) (Baron-Cohen et al., 2001) task is widely used as a measure of social cognition. It asks participants to make social judgements from the eye region of faces and is known to yield impaired performance in subjects with autism. Results were scored relative to normative data for the revised version gathered from a sample of 122 adults recruited from the community (Baron-Cohen et al., 2001).
The Empathizing Quotient (Baron-Cohen and Wheelwright, 2004) and Systemizing Quotient-Revised (Baron-Cohen et al., 2003) questionnaires are self-report instruments that assess the drive to identify others’ thoughts or emotions (empathizing) and the drive to understand and construct lawful systems for governing behaviour (systemizing). Higher systemizing/empathizing ratios are associated with autism spectrum diagnoses (Wheelwright et al., 2006).
The Liebowitz Social Anxiety Scale (LSAS) (Liebowitz, 1987) is a self-report questionnaire that contains 24 items, 13 concerning performance anxiety and 11 concerning social situations. Each item is rated separately for fear and avoidance behaviour, resulting in overall social anxiety severity rating, and scores on four subscales: (i) performance fear; (ii) performance avoidance; (iii) social fear; and (iv) social avoidance. For the total LSAS score, a diagnostic cut-off of 30 points provides the best balance of sensitivity and specificity for diagnosis (Mennin et al., 2002).
Procedures
The ADOS was administered to all AgCC participants by one of four administrators (three of the authors: L.K.P., D.P.K., C.C; and Deborah Childress, University of North Carolina) who attended training on the measure and achieved inter-rater reliability of at least 80% (mean = 88.25%) on the protocol administration and algorithm scoring. ADI-R was administered by two of the authors (L.K.P. and D.P.K.) who had achieved reliability of 90% on the protocol and algorithm. All other tasks were administered by trained Caltech research staff according to standardized instructions.
For the ASD group, ∼30% of the ADOS administrations were double-coded to ensure consistency in scoring (scoring disagreements were addressed through discussion and video review to reach a consensus) and individuals who did not meet autism spectrum criteria on the ADOS were excluded. As all ASD participants had a prior diagnosis, parent-report criteria were not required for inclusion in this group. When possible, SCQ and/or ADI-R were acquired from parents and used for group comparisons but not for diagnostic classification (SCQ n = 17, ADI-R n = 17; no parent report available n = 7).
For AgCC participants, a formal best-estimate diagnosis was determined by meeting autism or autism spectrum criteria on Module 4 of the ADOS, together with clinical diagnosis based on interviews with participants and parents, and meeting autism spectrum criteria on the SCQ and/or ADI-R. SCQ was completed by parents of 22 participants with AgCC, 14 of whom were additionally interviewed using the ADI-R. Full ASD criteria could not be assessed in four participants with AgCC because parent reports were unavailable.
In all AgCC cases, ADOS was double-coded by at least two of the authors using the aforementioned consensus procedures. In addition to ensuring consistency in scoring, double coding of AgCC cases reduced potential influence of examiner bias. ADOS administrators were not blind to neurological diagnosis; however, only L.K.P. had prior exposure to individuals with AgCC. Therefore all AgCC cases were scored by at least one examiner who was new to research on AgCC and to specific hypotheses regarding its relationship to ASD.
Participant groups and data analysis
Based on the criteria above, to address our first aim we identified participants with AgCC who met full criteria for an ASD diagnosis and compared them with participants with AgCC who met ASD criteria on the ADOS and in recent clinical history but did not meet ASD criteria on parent report (i.e. did not have evidence of ASD during early childhood). A 2 (group) × 3 (communication, social, and restricted behaviour scales) ANOVA was used to examine ADOS scores and ADI-R scores across the two groups. Student’s t-tests and Fisher’s exact test were used to compare these groups on all other measures.
To address our second aim regarding expression of the autism behavioural phenotype and other social impairments in adults with AgCC, participants with AgCC were classified into one of two broad categories based on ADOS scores and recent clinical history: (i) AgCC+ (AgCC ‘plus’ exhibition of current behaviour consistent with an ASD); or (ii) AgCC− (AgCC without current evidence of ASD). Demographic variables for the two AgCC subgroups (AgCC+ and AgCC−) were compared with the ASD group using ANOVA, followed by post hoc comparison of groups using Tukey’s honestly significant diffrerence test with significance set at α = 0.05. For data analysis, the three groups (AgCC+, AgCC− and ASD) were compared using analysis of covariance (ANCOVA) to control for variations in full-scale IQ. Mauchly’s test of sphericity was conducted for each ANCOVA and in cases where sphericity was violated at P < 0.05, the Huynh-Feldt correction was used if ε ≥ 0.75 and Greenhouse-Geisser was used if ε < 0.75. Significant findings from ANCOVA were followed by post hoc between-group contrasts controlling for full-scale IQ with significance set at α = 0.05 and Bonferroni corrected for multiple comparisons (α = 0.0167 unless noted otherwise). Finally, individual performance on each measure was examined relative to published norms and/or clinical cut-off scores. Mehta and Patel’s extension of the Fisher’s exact test was used to compare clinically categorized scores across the three groups. Confidence intervals (CI) for proportions were calculated using 1000 sample bootstrapping.
Results
Formal autism diagnosis in agenesis of the corpus callosum
Three of 22 participants with AgCC met full criteria for an autism spectrum diagnosis (13.6%, 95% CI 0–31.8). Three more met ADOS criteria for an ASD and had a clinical diagnosis on the autism spectrum but did not meet ASD criteria on parent report. These six individuals all had complete AgCC. As expected, comparison of the three who met full ASD criteria with the three who did not meet criteria on parent report confirmed the former group had significantly higher scores on SCQ t(4) = 4.01, P = 0.02. The group difference on ADI-R almost met significance (three ADI-R scales repeated-measures ANOVA P = 0.056,  = 0.75).
The AgCC group who met full ASD criteria also exhibited higher ADOS scores than those who only met ASD criteria on ADOS (repeated-measures ANOVA with three ADOS scores) [F(1,4) = 8.32, P = 0.045,  = 0.68] but the interaction of group by ADOS scale was not significant,
  = 0.36, nor was the overall effect of ADOS scales,
  = 0.67. Post hoc comparisons corrected for multiple comparisons (three ADOS scales) confirmed significantly greater autism symptomatology on the ADOS communication scale in the group who met full autism criteria, t(4) = 4.03, P = 0.016, d = 4.03, with no group differences on the social scale, d = 1.11, or the restricted behaviours scale, d = 0.44. These groups also did not differ on age, d = 0.28, full-scale IQ, d = 0.88, verbal IQ, d = 1.03, performance IQ, d = 0.35, gender, P = 0.40, handedness, P = 1.00, or education, P = 1.00 and did not differ on any additional other experimental measures (Supplementary Table 1).
Autism spectrum behaviours in adults with agenesis of the corpus callosum
Eight out of 26 individuals in the AgCC group met criteria for an ASD on the ADOS and in recent clinical history (AgCC+ = 30.8%, 95% CI 11.5–50). This group includes the six participants from the previous analyses, as well as two individuals for whom parent report was unavailable. All participants in the AgCC+ subgroup had complete AgCC (Table 2); however, type of AgCC diagnosis (complete versus partial) was not a significant predictor of ADOS scores across all participants with AgCC (point bi-serial correlation with non-parametric Wilcoxon rank sum test, P = 0.313). The AgCC+ and AgCC− subgroups did not differ significantly on gender, P = 0.35, handedness, P = 0.11, education P = 0.92, age, d = −0.04, full-scale IQ, d = 0.63, verbal IQ, d = 0.60, or performance IQ, d = 0.40.
Table 2.
Demographics by diagnostic category
| AgCC+ (n = 8) | AgCC− (n = 18) | ASD (n = 28) | |
|---|---|---|---|
| AgCC Type | 8 complete | 13 complete 5 partial | NA |
| Age | |||
| Mean ± SD | 28.38 ± 12.03 | 28.94 ± 11.25 | 29.61 ± 11.11 |
| Range | 16–47 | 16–54 | 19–56 |
| FSIQ* | |||
| Mean ± SD | 89.25 ± 13.08+++ | 98.22 ± 14.07+++ | 109.54 ± 11.86+++ |
| Range | 79–113 | 78–129 | 93–133 |
| PIQ** | |||
| Mean ± SD | 89.5 ± 15.66+++ | 95.89 ± 15.38+++ | 107.43 ± 12.58+++ |
| Range | 69–117 | 73–117 | 84–128 |
| VIQ** | |||
| Mean ± SD | 90.75 ± 15.11+++ | 100.28 ± 15.39 | 110.21 ± 16.14+ |
| Range | 76–115 | 78–135 | 80–139 |
| Gender | 2F: 6M | 8F: 10M | 5F: 23M |
| Handedness | 1L: 7R++ | 4A: 6L: 8R+ | 5A: 1L: 22R |
| Education | 2 in high school | 4 in high school | 1 in high school |
| 4 high school grad | 11 high school grad | 16 high school grad | |
| 1 Bachelors degree | 1 Bachelors degree | 8 Bachelors degree | |
| 1 Masters degree | 2 Masters degree | 3 Masters degree | |
Significant difference in 3-group ANCOVA at *P < 0.001, **P < 0.01. On Tukey’s honestly significant difference at P < 0.05 corrected for multiple comparisons: + differed from AgCC+; ++ differed from AgCC−; +++ differed from ASD.
FSIQ = full-scale IQ; PIQ = performance IQ; VIQ = verbal IQ; SD = standard deviation.
Variations in the behavioural phenotype of AgCC were examined by comparing those who displayed autism symptoms (AgCC+), those who did not (AgCC−), and a separately recruited sample of adults with ASD but no neurological abnormality (see ‘Materials and methods’ section for details). The three groups differed significantly on IQ scores [full-scale IQ, F(2,51) = 9.51, P < 0.001,  = 0.27; performance IQ, F(2,51) = 6.84, P = 0.002,
  = 0.21; verbal IQ F(2,51) = 5.51, P = 0.007,
  = 0.18], but not age [F(2,51) = 0.04, P = 0.96
  = 0.002]. Post hoc Tukey’s tests revealed significantly lower full-scale IQ and performance IQ in both AgCC groups than in the ASD group. Verbal IQ was significantly lower in AgCC+ than ASD, but AgCC− and ASD groups did not differ. Full-scale IQ was introduced as a covariate in all subsequent three-group comparisons. In addition, analyses reported below were repeated with a small subsample of participants selected so as to equate groups with respect to IQ (Supplementary material and Supplementary Table 2).
On measures of mood and affect, the three groups did not vary significantly on either subtest of the Positive and Negative Affect Schedule (negative  = 0.06; positive
  = 0.03), or on either subtest of the State Trait Anxiety Inventory (state
  = 0.06; trait
  = 0.01). Although the three groups varied significantly on Beck’s Depression Inventory-II [F(2,49) = 3.44, P = 0.04,
  = 0.12] post hoc contrasts between groups were not significant.
As ADOS algorithm scores were used for diagnostic categorization, significant between-group differences were expected (Fig. 2A plots  for group contrasts; Fig. 3 plots individual scores for ADOS subscales for all participants in each group). Repeated measures ANCOVA comparing the three groups by three ADOS scales (communication, social, and restricted behaviour) confirmed a significant group difference [F(2,50) = 45.38, P < 0.001,
  = as well as a significant interaction of ADOS by group [F(2.75,68.65) = 11.39, P < 0.001,
  = 0.31] but not a significant effect of ADOS score (
 = 0.07). Post hoc comparisons confirmed that the AgCC− subgroup exhibited significantly less autism symptomatology than both the AgCC+ [F(1,50) = 22.73, P < 0.001,
  = 0.31] and ASD groups [F(1,50) = 86.65, P < 0.001,
  = 0.63] whereas the AgCC+ and ASD groups did not differ (
 = 0.08).
Figure 2.

Effect sizes (partial η2) from between-group comparisons on (A) diagnostic measures and (B) measures of related social skills. Non-significant findings are shown in dark blue. In A measures on the y-axis are listed in order of greatest to smallest effect size in comparisons of AgCC− and ASD. ***P < 0.001, **P < 0.01, *P < 0.05 in three-subgroup univariate ANCOVA.
Figure 3.

ADOS algorithm scores. Individual participants’ data are shown on the (A) communication, (B) social, (C) total (communication + social) and (D) restricted behaviour scales. Higher scores indicate greater symptomatology, with black dotted line denoting the cut-off for autism diagnosis criteria and gray line the cut-off for autism spectrum criteria. Circles represent individual participants, with subgroup indicated by colour (AgCC+ = blue, AgCC− = red, ASD = green) and x-axis location (jittered to show individual circles more clearly). ASD diagnosis on the ADOS requires scoring above the cut-off on all three of the algorithm scales: communication, social and total.
Significant group differences were also found for each ADOS scale [Fig. 3; communication, F(2,50) = 29.33, P < 0.001,  = 0.54; social, F(2,50) = 28.21, P < 0.001,
  = 0.53; total, F(2,50) = 34.60, P < 0.001,
  = 0.58; restricted behaviour, F(2,50) = 11.41, P < 0.001,
  = 0.31]. Post hoc comparisons (Fig. 2A) confirmed that the AgCC− subgroup exhibited significantly less autism symptomatology than both the AgCC+ [communication F(1,50) = 20.775, P < 0.001,
  = 0.29; social F(1,50) = 10.89, P = 0.002,
  = 0.18; total F(1,50) = 16.78, P < 0.001,
  = 0.25; restricted F(1,50) = 6.88, P = 0.012,
  = 0.12] and ASD groups [communication F(1,50) = 52.582, P < 0.001,
  = 0.51; social F(1,50) = 55.24, P < 0.001,
  = 0.52; total F(1,50) = 66.32, P < 0.001,
  = 0.57; restricted F(1,50) = 21.18, P < 0.001,
  = 0.30], but the AgCC+ and ASD groups did not differ (communication
  = 0.01; social
  = 0.08; total
  = 0.07; restricted
  = 0.01). The ADOS analyses reported above were repeated using the total scores for each section (not just the algorithm items), yielding an identical pattern of results. Table 3 presents the number of participants in each subgroup who met autism or ASD criteria.
Table 3.
Autism diagnostic measures
| AgCC+ | AgCC- | ASD | |
|---|---|---|---|
| ADOS communicationa,d | n = 8 | n = 18 | n = 28 |
| Mean ± SD | 4.00 ± 1.6++ | 1.06 ± 0.87* | 4.14 ± 1.60++ |
| Range | 2–6 | 0–3 | 2–7 |
| Autism criteria | 6 | 1 | 24 |
| ASD criteria | 2 | 4 | 4 |
| ADOS sociala,d | |||
| Mean ± SD | 6.13 ± 3.00++ | 1.72 ± 1.81* | 8.5 ± 3.38++ |
| Range | 4–13 | 0–7 | 4–17 |
| Autism criteria | 4 | 1 | 23 |
| ASD criteria | 4 | 1 | 5 |
| ADOS totala,d | |||
| Mean ± SD | 10.13 ± 4.16++ | 2.78 ± 2.13* | 12.64 ± 4.62++ |
| Range | 7–19 | 0–8 | 7–23 |
| Autism criteria | 3 | 0 | 18 |
| ASD criteria | 5 | 1 | 10 |
| ADOS restricteda | |||
| Mean ± SD | 1.38 ± 1.30++ | 0.06 ± 0.24* | 1.64 ± 1.34++ |
| Range | 0–3 | 0–1 | 0–4 |
| SCQb,e | n = 6 | n = 16 | n = 17 |
| Mean ± SD | 12.33 ± 6.12 | 10.31 ± 7.35+++ | 21.00 ± 6.46++ |
| Range | 5–19 | 1–25 | 7–31 |
| ASD criteria | 3 | 5+++ | 15++ |
| ADI-R socialc,d | n = 5 | n = 9 | n = 17 |
| Mean ± SD | 10.60 ± 9.74 | 11.22 ± 8.66+++ | 21.12 ± 5.12++ |
| Range | 2–26 | 2–24 | 12–29 |
| ASD criteria | 2 + ++ | 4+++ | 17* |
| ADI-R communicationa,d | |||
| Mean ± SD | 10.40 ± 5.64+++ | 9.44 ± 4.69+++ | 16.24 ± 3.40* |
| Range | 4–19 | 4–18 | 11–22 |
| ASD criteria | 3 | 4+++ | 17++ |
| ADI-R restricted | |||
| Mean ± SD | 2.60 ± 0.89 | 3.22 ± 2.39 | 5.47 ± 2.24 |
| Range | 2–4 | 0–7 | 2–10 |
| ASD criteria | 2 | 5 | 15 |
aP < 0.001; bP < 0.01; cP < 0.05 in 3-subgroup ANCOVA; dP < 0.001 on 3-group Fisher’s exact test comparing number who met ASD criteria versus those who did not.
Post hoc contrasts controlling for full-scale IQ and multiple comparisons at P < 0.05.
*differed from all other subgroups; + differed from AgCC+; ++ differed from AgCC−; +++ differed from ASD.
SD = standard deviation.
The three groups differed significantly on SCQ scores [F(2,35) = 5.39, P = 0.009, η2 = 0.25] (Table 3, Figs 2A and 4A). In post hoc analyses, the ASD group scored significantly higher than the AgCC− group [F(1,35) = 10.62, P = 0.002,  = 0.24] but scores in the AgCC+ group did not differ from either the AgCC− (
 = 0.03) or ASD group (
 = 0.05). The ratio of participants who met ASD criteria on the SCQ differed significantly across three groups (2 × 3 Fischer’s exact test, P = 0.003), but in post hoc comparisons only the AgCC− and ASD groups differed significantly (P = 0.001). Fifteen of 17 individuals in the ASD group met SCQ criteria for autism spectrum diagnosis (88%, 95% CI 70.6–100), but only 5 of 16 in the AgCC− group (31.3%, 95% CI 12.5–56.3) and three of six in the AgCC+ group (50%, 95% CI 16.7–83.3).
Figure 4.

Parent ratings on autism diagnostic scales. Individual scores for the parent rating scales including (A) SCQ raw score (B) ADI-R communication, (C) ADI-R social, and (D) ADI-R restricted behaviour algorithms. Higher scores indicate greater symptomatology. On ADI-R scales, the black dotted line indicates lower-limit of autism spectrum criteria.
ADI-R raw scores on three scales (communication, social, and restricted behaviours) were compared across the three groups using ANCOVA. We found a significant difference between groups [F(2,27) = 6.98, P = 0.004,  = 0.34] and interaction of ADI-R by group [F(3.50,47.19) = 3.03, P = 0.03,
  = 0.18] but not a significant effect of ADI-R scale (
 = 0.09). In post hoc contrasts ADI-R scores indicated significantly less autism symptomatology in the AgCC− group than ASD [F(1,27) = 12.93, P = 0.001,
  = 0.32] but AgCC+ did not differ from either ASD (
 = 0.19) or AgCC− groups (
 = 0.00).
In separate analyses with raw scores from each ADI-R scale, the three subgroups differed significantly on ADI-R communication [F(2,27) = 9.51, P = 0.001,  = 0.41] and social [F(2,27) = 4.53, P = 0.02,
  = 0.25] but not on restricted behaviours (
 = 0.14) (Table 3 and Fig. 4). In post hoc between-group contrasts, ADI-R scores indicated significantly less autism symptomatology in AgCC− than the ASD group on communication [F(1,27) = 17.55, P < 0.001,
  = 0.39] and social scales [F(1,27) = 8.47, P = 0.007,
  = 0.24]. Although AgCC+ and ASD groups did not differ on ADI-R scores overall (see post hoc contrasts from three group × three ADI-R scale ANCOVA in previous paragraph), post hoc contrasts of raw scores from individual ADI-R scales revealed significantly lower communication scores in AgCC+ than in ASD [F(1,27) = 8.95, P = 0.006,
  = 0.25] but no difference between these groups on social scores (
 = 0.13) (Figs 2A and 4). The AgCC groups did not differ from one another on communication (
 = 0.001) or social scores (
 = 0.000) and no group contrasts were significant for restricted behaviour scores (
 range from 0.004 to 0.01).
ADI-R scores were also analysed with respect to diagnostic cut-offs. Two of five individuals in the AgCC+ group (40%, 95% CI 0–80) and three of nine in the AgCC− group (33%, 95% CI 0–66.7) met ADI-R criteria for an ASD diagnosis, while as expected all 17 ASD participants met ADI-R criteria. Three-group comparisons of diagnostic ratios using 2 × 3 Fischer’s exact test were significant for overall ADI-R diagnosis (P < 0.001) as well as for ADI-R communication (P = 0.001) and social (P < 0.001) scales, with group difference on restricted behaviours just outside of significance (P = 0.055). Post hoc between-group comparisons confirmed ADI-R diagnosis of ASD was significantly more likely in the ASD group than in both AgCC groups (AgCC+, P = 0.006; AgCC−, P < 0.001). Likewise, social scores in the ASD range were significantly more likely in the ASD group than in either AgCC group (AgCC+, P = 0.006, AgCC−, P = 0.002) communication scores in the ASD range were more likely in the ASD group than the AgCC− group (P = 0.002), the ASD and AgCC+ groups did not differ on the ratio of participants with communication scores in the ASD range (P = 0.043). Table 3 presents the number of participants in each subgroup who met ASD criteria on the ADI-R.
In summary, during the ADOS approximately one-third of our AgCC sample exhibited behaviours consistent with an ASD diagnosis (classified in this study as AgCC+), and ADOS scores in the remainder of the AgCC sample (the AgCC− group) were significantly below both the AgCC+ and ASD groups. According to SCQ and ADI-R parent report measures, the AgCC− group exhibited significantly less autism symptomatology during early childhood than the ASD group, with the AgCC+ group scoring in between these groups. On SCQ raw scores and diagnostic ratios, the AgCC+ group did not differ significantly from either the AgCC− or ASD groups. However, on the ADI-R, the AgCC+ diagnostic outcome was similar to the AgCC− group, both being significantly less likely than ASD group to meet overall diagnostic criteria. (For more information on within-subject consistency across parent report scores, see Supplementary material)
Self-awareness in agenesis of the corpus callosum and autism spectrum disorder
SRS-2 Adult Form (Self-Report) scores and SRS-2 Adult Form (Relative/Other Report) scores did not differ significantly across the three groups ( = 0.10 and
  = 0.09, respectively, Fig. 2B). Using published cut-offs, SRS-2 Adult Form scores were converted to an ordinal scale indicating symptom severity (none, mild, moderate, or severe; Table 4). As with the ANCOVA results using raw scores, severity categorization of the three groups did not differ significantly on SRS-2 Adult Form (Self-Report) (P = 0.13) or on SRS-2 Adult Form (Relative/Other Report), (P = 0.45). However, when severity categories were combined into an ‘impaired’ category, the ratio of impaired to non-impaired scores differed significantly across groups on the self-report form, (P = 0.04), but not on other-report (P = 0.51). Post hoc comparisons of self-report scores were not significant after correction for repeated measures (AgCC+ versus ASD, P = 0.04; AgCC+ versus AgCC−
P = 0.36, AgCC− versus ASD P = 0.06).
= 0.09, respectively, Fig. 2B). Using published cut-offs, SRS-2 Adult Form scores were converted to an ordinal scale indicating symptom severity (none, mild, moderate, or severe; Table 4). As with the ANCOVA results using raw scores, severity categorization of the three groups did not differ significantly on SRS-2 Adult Form (Self-Report) (P = 0.13) or on SRS-2 Adult Form (Relative/Other Report), (P = 0.45). However, when severity categories were combined into an ‘impaired’ category, the ratio of impaired to non-impaired scores differed significantly across groups on the self-report form, (P = 0.04), but not on other-report (P = 0.51). Post hoc comparisons of self-report scores were not significant after correction for repeated measures (AgCC+ versus ASD, P = 0.04; AgCC+ versus AgCC−
P = 0.36, AgCC− versus ASD P = 0.06).
Table 4.
Mean scores on psychological measures by diagnostic classification
| AgCC+ | AgCC− | ASD | ||
|---|---|---|---|---|
| SRS-2 Adult (relative/other) | n = 7 | n = 17 | n = 18 | |
| Mean ± SD | 78.14 ± 16.41 | 78.65 ± 37.68 | 95.78 ± 31.47 | |
| Clinically elevated | 1 mild | 4 mild | 3 mild | |
| 3 moderate | 2 moderate | 6 moderate | ||
| 5 severe | 5 severe | |||
| SRS-2 Adult (self report) | n = 8 | n = 17 | n = 24 | |
| Mean ± SD | 45.63 ± 22.87 | 61.59 ± 28.40 | 82.04 ± 27.56 | |
| Clinically elevatedb | 1 moderate | 4 mild | 4 mild | |
| 1 moderate | 8 moderate | |||
| 1 severe | 3 severe | |||
| Benton Facial Recognition | n = 6 | n = 16 | n = 26 | |
| Mean ± SD | 41.67 ± 7.42 | 44.88 ± 4.98 | 45.85 ± 4.10 | |
| Clinically impaired | 3 | 4 | 3 | |
| Eyes | n = 5 | n = 13 | n = 22 | |
| Mean ± SD | 22.00 ± 4.47 | 24.85 ± 3.34 | 24.64 ± 4.50 | |
| Below normal limits | 2 | 0 | 2 | |
| EQa | n = 8 | n = 17 | n = 26 | |
| Mean ± SD | 39.63 ± 10.01+++ | 36.59 ± 13.26+++ | 26.62 ± 9.55* | |
| Outside normal limits | 1 below | 2 below,2 above | 9 below | |
| SQ-R | n = 8 | n = 17 | n = 26 | |
| Mean ± SD | 57.88 ± 30.78 | 58.00 ± 14.34 | 66.69 ± 23.55 | |
| Outside normal limits | 1 below, 1 above | 1 below | 2 below, 6 above | |
| LSAS | n = 8 | n = 18 | n = 22 | |
| LSAS Totala | 32.38 ± 20.25+++ | 42.00 ± 25.14 | 59.82 ± 30.18+ | |
| LSAS Performance Fear | 6.50 ± 3.85+++ | 11.78 ± 6.57 | 13.64 ± 8.35+ | |
| LSAS Performance Avoidancea | 8.50 ± 5.81+++ | 10.44 ± 7.63+++ | 14.41 ± 7.63* | |
| LSAS Social Fear | 8.38 ± 5.45 | 10.11 ± 7.35 | 15.73 ± 8.39 | |
| LSAS Social Avoidance | 9.00 ± 9.38 | 9.67 ± 6.07+++ | 16.05 ± 7.98++ | |
| Clinically elevated | 4 | 13 | 19 | |
aP < 0.05 in 3-group ANCOVA; bP < 0.05 on 3-group × 2-level Fischer’s exact test (comparing impaired with non-impaired).
Post hoc contrasts controlling for full-scale IQ and multiple comparisons at P < 0.05, * differed from all other subgroups; + differed from AgCC+; ++ differed from AgCC−; and +++ differed from ASD.
Eyes = Reading the Mind in the Eyes; EQ = Empathizing Quotient; SQ-R = Systemizing Quotient-Revised.
‘Normal limits’ is defined as within 1.5 standard deviations (SD) of the mean.
If we presume that other-report scores provide a fairly accurate assessment of participants’ social functioning, then comparison of self-report and other-report scores may offer insight regarding participants’ self-awareness about these behaviours. To assess self-awareness using this hypothesis, SRS-2 Adult Form (Relative/Other Report) and (Self-Report) scores were first correlated across the entire sample, while controlling for full-scale IQ. Although there was a weak but significant positive correlation across the entire sample, R2 = 0.16, t(38) = 2.64, P < 0.02, d = 0.86, when examined within groups, this correlation was significant only for AgCC+, R2 = 0.63, t(5) = 2.93, P < 0.05, d = 2.62 (AgCC − d = 1.04; ASD d = 0.16).
To assess self-report accuracy at a group level, we examined the proportion of elevated scores on self- and other-report. Over half of the participants in each group had elevated scores on other-report (AgCC+ 57%, 95% CI 14.3–85.7; AgCC− 64.7%, 95% CI 41.2–88.2; ASD 77.8%, 95% CI 55.6–94.4), but only in the ASD group did over half of the participants also endorse elevations on self-report (AgCC+ 12.5%, 95% CI 0–37.5; AgCC− 35.3%, 95% CI 11.8–58.8; ASD 62.5%, 95% CI 45.8–79.2). Overall, the ASD group exhibited the smallest difference between proportion of elevated scores on self-report and other-report (19.9, 95% CI 9.4–46.2), with the largest difference in the AgCC+ group (44.6, 95% CI −7.1–85.7), followed by the AgCC− group (29.4, 95% CI 5.9–58.8). This suggests a general pattern of greater self-awareness in ASD and lesser awareness in AgCC+.
Finally, on a subject-by-subject basis we identified over- and under-reporting on self-report in comparison to other-report. Participants in the three groups were equally likely to over-endorse symptoms on self-report (i.e. some degree of impairment acknowledged on self-report and normal range score on other report was found in 3 of 18 individuals with ASD, 2 of 17 in the AgCC− group and none in the AgCC+ group; 2 × 3 Fisher exact test P = 0.83). Likewise across groups, participants were equally likely to under-endorse on self-report (normal range scores on self-report and elevated score on other report in three of seven individuals in the AgCC+ group, 7 of 17 participants in the ACC− group, and 6 of 18 in the ASD group; 2 × 3 Fisher exact test P = 0.84).
Characterization of additional social deficits in agenesis of the corpus callosum and autism spectrum disorder
We carried out further exploratory analyses to identify other aspects of social functioning that may distinguish between the AgCC subgroups and the ASD group (results for the following tests are presented in Table 4 and Fig. 2B).
Facial perception scores (Benton Facial Recognition Test) and emotion identification from eyes (Reading the Mind in the Eyes) did not differ across the three subgroups ( = 0.03 and
  = 0.04, respectively). Clinically significant impairment in facial recognition was equally likely in all three groups (2 × 3 Fischer’s exact test, P = 0.08).
The three groups also did not differ on the Systemizing Quotient-Revised, η2 = 0.008, but exhibited significant variability on Empathizing Quotient F(2,47) = 4.86, P = 0.012,  = 0.17. In post hoc contrasts, both AgCC subgroups endorsed greater empathizing than the ASD group [AgCC+
F(1,47) = 6.60, P = 0.013,
= 0.17. In post hoc contrasts, both AgCC subgroups endorsed greater empathizing than the ASD group [AgCC+
F(1,47) = 6.60, P = 0.013,  = 0.12; AgCC−
F(1,47) = 7.27, P = 0.01,
= 0.12; AgCC−
F(1,47) = 7.27, P = 0.01,  = 0.13] but did not differ from one another (
 = 0.009). In one-sample t-tests comparing empathizing scores with published norms (Wheelwright et al., 2006), the AgCC+ group did not differ from expected, d = 0.42, but scores were significantly below normal in AgCC− [t(16) = −2.40, P = 0.029, d = 0.61]; and ASD groups [t(25) = −9.44, P < 0.001, d = 1.61]. On systemizing scores, neither AgCC group differed from norms, (AgCC+
d = 0.09; AgCC−, d = 0.14) but the ASD group’s scores were significantly elevated [t(25) = 2.40, P = 0.02, d = 0.51].
= 0.009). In one-sample t-tests comparing empathizing scores with published norms (Wheelwright et al., 2006), the AgCC+ group did not differ from expected, d = 0.42, but scores were significantly below normal in AgCC− [t(16) = −2.40, P = 0.029, d = 0.61]; and ASD groups [t(25) = −9.44, P < 0.001, d = 1.61]. On systemizing scores, neither AgCC group differed from norms, (AgCC+
d = 0.09; AgCC−, d = 0.14) but the ASD group’s scores were significantly elevated [t(25) = 2.40, P = 0.02, d = 0.51].
Individual Empathizing Quotient and Systemizing Quotient-Revised scores were compared to gender-specific normative data acquired from an adult community-based sample (Wheelwright et al., 2006), with scores greater than 1.5 standard deviations from the mean identified as clinically significant (Table 4). Scores categorized by clinical range (elevated, average, lowered) did not differ across the three groups for Empathizing Quotient (P = 0.15) or Systemizing Quotient-Revised (P = 0.19). Finally, Empathizing Quotient and Systemizing Quotient-Revised scores were used to calculate ‘brain-types’ for each individual (Goldenfeld et al., 2005) as predicted by the E-S theory (Baron-Cohen et al., 2003). The three groups did not differ significantly on ‘brain-type’ score ( = 0.11).
The three subgroups differed significantly on a global measure of social anxiety [total LSAS F(2,44) = 4.04, P = 0.025,  = 0.16]. Post hoc contrasts revealed significantly less anxiety in the AgCC+ group than the ASD group [F(1,44) = 6.75, P = 0.013,
  = 0.13] with AgCC− scoring similarly to both other groups (AgCC+
 = 0.02; ASD
  = 0.11). Despite these group differences in raw score, likelihood of endorsing clinically significant symptoms of social anxiety disorder did not differ across groups (P = 0.11, Table 4).
A 4 Group ×3 LSAS-subscale ANCOVA confirmed a significant difference across groups as was found on total LSAS score, [F(2,44) = 4.04, P = 0.025, η2 = 0.16]. ANCOVA also revealed a significant main effect of subscale [F(2.58,113.39) = 4.11, P = 0.012, η2 = 0.10], but not a group by subscale interaction (η2 = 0.08). Post hoc contrasts found no significant group differences across LSAS subscale scores (AgCC+ and AgCC− η2 = 0.02; AgCC+ and ASD, η2 = 0.13; AgCC− and ASD, η2 = 0.11).
Group differences on the LSAS ANCOVA were further explored by applying ANCOVA separately to each LSAS subscale while controlling for multiple comparisons (α = 0.0125). The three groups varied significantly on performance avoidance [F(2,44) = 4.98. P = 0.011, η2 = 0.19] but not on the other scales (social avoidance, P = 0.02, η2 = 0.16; performance fear, P = 0.04, η2 = 0.13; social fear, P = 0.10, η2 = 0.10). However, as group differences would be significant for social avoidance and performance fear if Bonferroni correction was not used, we examined post hoc contrasts for these measures in addition to performance avoidance.
Post hoc analyses of LSAS performance avoidance, performance fear, and social avoidance found no differences between the AgCC− and AgCC+ groups ( range from 0.003 to 0.08). In contrast, the AgCC+ group endorsed significantly less performance-related anxiety than the ASD group [performance fear, F(1,44) = 6.73, P = 0.013,
  = 0.13; performance avoidance, F(1,44) = 8.31, P = 0.006,
  = 0.16], and the AgCC− group endorsed significantly less avoidance across situations than the ASD group [social avoidance, F(1,44) = 7.07, P = 0.011,
  = 0.14; performance avoidance, F(1,44) = 6.50, P = 0.014,
  = 0.13].
Exploratory correlations across all measures are reported in the Supplementary material and Supplementary Fig. 1.
Discussion
We found that approximately a third of adults with AgCC exhibited current behaviours consistent with ASD, whereas considerably fewer met full formal autism diagnostic criteria once parent report of childhood behaviours was included. This indicates that congenital disruption of the corpus callosum constitutes a specific and major risk factor for developing autism symptomatology in adulthood, and furthermore that the developmental course in such individuals may differ from what is typically observed in ASDs. The findings provide a highly quantitative and detailed assessment of autism in AgCC, additional description of social cognition more broadly, and motivate important hypotheses for future studies.
Autism incidence in agenesis of the corpus callosum
Identifying the subset of AgCC for whom autism develops in a manner typical of ASD, and who meet full formal criteria for an autism diagnosis, was the first aim of this study. Only 3 of 22 individuals in our AgCC sample fit into this group. Additionally, we discovered that this group exhibited more significant communication impairments in adulthood than the group of people with AgCC whose onset of autism symptoms presented only later in life. These two subgroups of AgCC did not differ on any demographic variables, other autism diagnostic instruments, or other social skill measures, and all participants in these groups had complete AgCC. We conclude that approximately a third of adults with AgCC and full-scale IQ ≥70 exhibit a typical autism profile in adulthood, even though only very few meet full diagnostic criteria once developmental history is included. Furthermore, our findings suggest that a pervasive communication impairment may distinguish these two varieties of autism presentation in AgCC.
Autism symptomatology subgroups in agenesis of the corpus callosum
Our second aim was to characterize autism symptoms and other social impairments in adults with AgCC. In addition to the group described in aim one (i.e. people with AgCC who exhibit the full autism syndrome including childhood onset), five additional participants with AgCC exhibited clinically significant symptoms of autism during direct observation (ADOS), totalling 8 of 26 of our AgCC sample. This incidence is consistent with previous autism screening in adolescents and adults with AgCC (Lau et al., 2013). Unlike autism progression in the three individuals meeting full ASD criteria, for the majority of individuals with AgCC, emergence of autism symptoms may occur in differing sequence and at different ages. For example, whereas autism features social and communication abnormalities by around the age of 3 years, in people with AgCC, social and other behavioural disabilities are more likely to reach a clinically relevant threshold between ages 6 and 11 (Badaruddin et al., 2007). Consistent with this developmental pattern, at least three participants with AgCC in our study displayed delayed onset of social autism symptoms (point of onset could not be determined for two additional individuals with AgCC and autism symptoms in adulthood).
Importantly, the individuals with AgCC and autism symptomatology on ADOS all had complete callosal agenesis; however, they were not distinguished from the remaining AgCC subjects by presence or absence of residual callosum, nor by age or IQ. This pattern of findings is consistent with the idea that specific developmental trajectories can give rise to autistic symptoms, independently of the effects of IQ. It also indicates that congenital disruption of the corpus callosum constitutes a specific and major risk factor for developing autism, along with other impairments in the social-communication domain. Among the remaining two-thirds of our AgCC sample, approximately half met autism criteria on either social or communication scales of the ADOS (7 of 18) or ASD diagnosis on the ADI-R (2 of 18), even though they did not reach full criteria for a diagnosis on the ADOS.
This brings us to one additional set of questions: what characteristics, if any, distinguish between individuals with AgCC who develop autistic behaviours and those who will not? Likewise, what characteristics, if any, distinguish between the individuals with significant autism symptoms on ADOS who also have AgCC and those who do not have AgCC? The pattern of similarities and differences across these three groups may provide insight about the relationship between callosal disconnection and autism.
ADOS scores were used to define the three groups and therefore clearly distinguish between them. Likewise, because the ASD group was defined in part by parent-reports of autism symptoms during childhood, that group’s SCQ and ADI-R scores were significantly higher than the AgCC− group’s scores (with the exception of ADI-R restricted behaviours, which did not differ across groups). However, for the AgCC+ group, all diagnostic parent-report scores were similar to the AgCC− group, and they were significantly less likely than the ASD to meet diagnostic criteria on the ADI-R. Taken together, this pattern supports our description of delayed onset of autistic social symptoms in AgCC and early onset of restrictive behaviours, suggesting that limitations of interhemispheric connectivity may contribute specifically to disrupted development of more complex social skills beginning in later childhood, as well as possibly facilitating the generation of restricted and repetitive behaviour patterns characteristic of autism.
Social cognition across groups
In addition to autism diagnostic criteria described above, the three groups exhibited similar impairments on a broader array of social processing skills (Fig. 2B). Discrepancies between self- and other-report scores on the SRS-2 indicated impoverished self-awareness in all three groups, but this limitation was more pronounced in AgCC+ than in ASD (with AgCC− showing an intermediate pattern). Apart from apparently worse self-awareness in AgCC+ than AgCC−, the two AgCC groups did not differ from one another on any other social measures. Compared with the ASD group, both AgCC groups scored significantly higher on the Empathizing Quotient, suggesting that emotional responsiveness and theory of mind may be somewhat more fully developed in AgCC than in ASD (albeit still below normal range). Previous studies have reported a similar pattern of mild theory of mind deficits in AgCC (Symington et al., 2010), as well as limited but intact psychophysiological arousal in response to emotional images (Paul et al., 2006), but a recent case study of AgCC with autism reported lower empathizing performance than in autism without AgCC (Lombardo et al., 2012). Finally, although social anxiety scores were generally elevated in all groups, subtle variations offer additional insights. Relative to ASD, the AgCC+ group endorsed lower levels of social anxiety, primarily due to lower performance anxiety. In contrast, the AgCC− group endorsed less avoidance than ASD, but equivalent amounts of social and performance-related fear. As reported in the Supplementary material, exploratory analyses revealed distinct patterns of correlation between ADOS and LSAS scores across groups. Although these correlations did not reach significance, they suggest that social avoidance and social fear can be decoupled in relation to autism symptomatology, a provocative suggestion which merits further exploration. In sum, ADOS scores provided the only clear and consistent differences between the individuals who displayed autism symptoms (AgCC+ and ASD) and those who did not (AgCC−). All three groups shared similar degrees of impairment on a range of social measures, with subtle variations indicating that relative to ASD, the social dysfunction in AgCC involves less reduction in empathizing and lower levels of social anxiety, regardless of whether or not the AgCC is comorbid with ASD.
Deficits across a range of tasks that tap social cognition in the current study (Fig. 2B), as well as deficits evident in previous work (see ‘Introduction’ section), confirm a profound dysfunction in the social domain in AgCC. Although functional connectivity (Tyszka et al., 2011) and interhemispheric transfer studies (Paul et al., 2007) illustrate the remarkable compensatory development of the acallosal brain, our assessment of adults confirms that social impairments in AgCC remain even after the majority of cortical development is complete. In fact, as we noted, some social impairments seem to emerge later in the course of development. Diversity in the pattern of findings is in line with the known heterogeneity of autism, and points to the need for a more detailed assessment of developmental courses in AgCC involving not only larger samples but also longitudinal studies in infants and children.
Caveats and future directions
It is important to emphasize that our study, while in many respects descriptive, is not circular. For instance, one might reason that since we pre-selected an AgCC subgroup who met autism criteria (i.e. the AgCC+ subgroup), of course these would show social impairments normally found in autism. But the measures used to diagnose autism, and the experimental tasks, were independent. Once autism had been diagnosed, we used a different, and quite wide, range of assessments leaving open—and indeed finding—some patterns also found in autism in general, and some not. It is of course true that, by selection, the AgCC+ group would have higher overall scores on the ADOS than would the AgCC− group—but this says little about the detailed pattern on subscales, and nothing about their similarities or differences on the Empathizing Quotient, Systemizing Quotient-Revised, SRS-2, Benton Faces, or the other tasks which were not used for diagnostic purposes.
Perhaps the strongest conclusion from our study regarding the neurological basis for autism is that developmental absence of the corpus callosum is associated with a higher risk of developing autism, a hypothesis consistent with the current view that disruption of long-range brain connectivity underlies autism (Geschwind and Levitt, 2007). In terms of more microstructural causes, this hypothesis fits with what is known about the array of genetic mutations and copy number variations identified to contribute to autism: many involve genes coding for pathfinding, signalling, or structural proteins known to be involved in synaptogenesis, neuronal migration, and synapse maintenance (Geschwind and Levitt, 2007; Parikshak et al., 2013). At the systems level, this hypothesis fits with deficits in integration of information processing that is spatially distributed (Frith, 1989). In the case of AgCC, this would specifically involve functions that are hemispherically lateralized to either the left (e.g. language) or right (e.g. emotion, visuospatial processing) cerebral hemisphere. In a developmental context, it is likely that normal interaction and competition between hemispheres would be abolished in AgCC, conceivably resulting in more distributed cognitive functions in the adult brain.
It is important to note that the causal relationship between callosal agenesis and autism remains unclear. For instance, the two syndromes could result from a shared set of distal causes including genetic and environmental causes. It is also possible that absence of the corpus callosum, by itself, contributes causally to the development of autism, conferring simply an additive risk. Emerging evidence is beginning to distinguish these possibilities a recent study found overlap in the de novo mutations that contribute to AgCC, and those linked to autism (Sajan et al., 2013). Further studies that combine genetic analyses with ASD assessment in people with AgCC will be required to gain insight into this complex issue.
There are several important future directions from our results. First, as we noted above it will be important to begin to link some of the genes known to contribute to AgCC also to aspects of autism through larger family studies. Several such projects are now beginning; although obviously limited by small sample sizes, accrual over time is likely to yield important confirmations, as well as discoveries, of genes that contribute to autism. A second important direction lies in further validating and describing neurological models of autism. Although inbred mice with callosal agenesis (the BTBR strain) have been studied as mouse models of autism for some time (Silverman et al., 2010), the present findings may provide a human neurological model that could inform, and be used better to translate between, both the mouse model and humans with autism. Finally, a particularly exciting future direction leverages off the fact that AgCC, like autism, is a developmental disorder but that it, unlike autism, can now be diagnosed before birth. High-resolution ultrasound has made possible the routine discovery of AgCC in utero (Santo et al., 2012). Not only does this suggest the possibility of identifying a much larger sample of individuals with AgCC, but it also opens the door for beginning to study their brains and their behaviour at birth (or even before), with the potential to give us valuable insights into the earliest aspects of social development and its dysfunction. The ideal comparison between ASD and AgCC would constitute a longitudinal study in such a population, mapping their developmental trajectory across multiple domains—and continuing across the lifespan.
Funding
This work is supported in part by grants from the National Institutes of Mental Health (R01MH080721) and the Simons Foundation Autism Research Initiative to R.A., a National Alliance for Research on Schizophrenia and Depression Young Investigator Award presented to L.K.P, and a grant from the National Institutes of Mental Health (K99/R00MH094409) and a Brain and Behavior Research Foundation Young Investigator Award to D.P.K.
Supplementary material
Supplementary material is available at Brain online.
Acknowledgements
The authors wish to thank Catherine Holcomb for help in recruiting and testing subjects, Mike Tyszka for help with neuroimaging analyses, and Deborah Childress for help with ADOS administration.
Glossary
Abbreviations
- ADI-R
Autism Diagnostic Interview-Revised
- ADOS
Autism Diagnostic Observation Schedule
- AgCC
agenesis of the corpus callosum
- ASD
autism spectrum disorder
- LSAS
Liebowitz Social Anxiety Scale
- SCQ
Social Communication Questionnaire
- SRS-2
Social Responsiveness Scale-2
References
- Alexander AL, Lee JE, Lazar M, Boudos R, Dubray MB, Oakes TR, et al. Diffusion tensor imaging of the corpus callosum in Autism. Neuroimage. 2007;34:61–73. doi: 10.1016/j.neuroimage.2006.08.032. [DOI] [PubMed] [Google Scholar]
- Badaruddin DH, Andrews GL, Bölte S, Schilmoeller KJ, Schilmoeller G, Paul LK, et al. Social and behavioral problems of children with agenesis of the corpus callosum. Child Psychiatry Hum Dev. 2007;38:287–302. doi: 10.1007/s10578-007-0065-6. [DOI] [PubMed] [Google Scholar]
- Banich M, Brown WS. A life-span perspective on interaction between the cerebral hemispheres. Dev Neuropsychol. 2000;18:1–10. doi: 10.1207/S15326942DN1801_1. [DOI] [PubMed] [Google Scholar]
- Barkovich AJ, Norman D. Anomalies of the corpus callosum: correlation with further anomalies of the brain. AJR Am J Roentgenol. 1988;151:171–9. doi: 10.2214/ajr.151.1.171. [DOI] [PubMed] [Google Scholar]
- Barnea-Goraly N, Kwon H, Menon V, Eliez S, Lotspeich L, Reiss AL. White matter structure in autism: preliminary evidence from diffusion tensor imaging. Biol Psychiatry. 2004;55:323–6. doi: 10.1016/j.biopsych.2003.10.022. [DOI] [PubMed] [Google Scholar]
- Baron-Cohen S, Richler J, Bisarya D. The systemizing quotient: an investigation of adults with Asperger syndrome or high-functioning autism, and normal sex differences. Philos Trans R Soc Lond B Biol. 2003;358:361–74. doi: 10.1098/rstb.2002.1206. [DOI] [PMC free article] [PubMed] [Google Scholar]
- Baron-Cohen S, Wheelwright S. The empathy quotient: an investigation of adults with Asperger syndrome or high-functioning autism, and normal sex differences. J Autism Dev Disord. 2004;34:163–75. doi: 10.1023/b:jadd.0000022607.19833.00. [DOI] [PubMed] [Google Scholar]
- Baron-Cohen S, Wheelwright S, Hill J, Raste Y, Plumb I. The “reading the mind in the eyes” test revised version: a study with normal adults, and adults with asperger syndrome or high-functioning autism. J Child Psychol Psychiatry. 2001;42:241–51. [PubMed] [Google Scholar]
- Barr M, Hamm J, Kirk I, Corballis M. Early visual evoked potentials in callosal agenesis. Neuropsychology. 2005;19:707–27. doi: 10.1037/0894-4105.19.6.707. [DOI] [PubMed] [Google Scholar]
- Beck AT, Steer RA, Brown GK. Manual for the beck depression inventory-II. San Antonio, TX: Psychological Corporation; 1996. [Google Scholar]
- Bedeschi MF, Bonaglia MC, Grasso R, Pellegri A, Garghentino RR, Battaglia MA, et al. Agenesis of the corpus callosum: clinical and genetic study in 63 young patients. Pediatr Neurol. 2006;34:186–93. doi: 10.1016/j.pediatrneurol.2005.08.008. [DOI] [PubMed] [Google Scholar]
- Bellani M, Calderoni S, Muratori F, Brambilla P. Brain anatomy of autism spectrum disorders I. Focus on corpus callosum. Epidemiol Psychiatr Sci. 2013;22:217–21. doi: 10.1017/S2045796013000139. [DOI] [PMC free article] [PubMed] [Google Scholar]
- Belmonte MK, Allen G, Beckel-Mitchener A, Boulanger LM, Carper RA, Webb SJ. Autism and abnormal development of brain connectivity. J Neurosci. 2004;24:9228–31. doi: 10.1523/JNEUROSCI.3340-04.2004. [DOI] [PMC free article] [PubMed] [Google Scholar]
- Benton A, Hamsher K, Varney N, Spreen O. New York, NY: Oxford University Press; 1983. Contributions to neuropsychological assessment. [Google Scholar]
- Boger-Megiddo I, Shaw DW, Friedman SD, Sparks BF, Artru AA, Giedd JN, Dawson G. Corpus callosum morphometrics in young children with autism spectrum disorder. J Autism Dev Disord. 2006;36:733–9. doi: 10.1007/s10803-006-0121-2. [DOI] [PubMed] [Google Scholar]
- Booth R, Wallace G, Happé F. Connectivity and the corpus callosum in autism spectrum conditions: insights from comparison of autism and callosal agenesis. Prog Brain Res. 2011;189:303–17. doi: 10.1016/B978-0-444-53884-0.00031-2. [DOI] [PubMed] [Google Scholar]
- Brown W, Paul L. Cognitive and psychosocial deficits in agenesis of the corpus callosum with normal intelligence. Cogn Neuropsychiatry. 2000;5:135–57. [Google Scholar]
- Brown WS, Jeeves MA, Dietrich R, Burnison DS. Bilateral field advantage and evoked potential interhemispheric transmission in commissurotomy and callosal agenesis. Neuropsychologia. 1999;37:1165–80. doi: 10.1016/s0028-3932(99)00011-1. [DOI] [PubMed] [Google Scholar]
- Brown WS, Symingtion M, Vanlancker-Sidtis D, Dietrich R, Paul LK. Paralinguistic processing in children with callosal agenesis: emergence of neurolinguistic deficits. Brain Lang. 2005;93:135–9. doi: 10.1016/j.bandl.2004.09.003. [DOI] [PubMed] [Google Scholar]
- Brown WS, Thrasher ED, Paul LK. Interhemispheric Stroop effects in partial and complete agenesis of the corpus callosum. J Int Neuropsychol Soc. 2001;7:302–11. doi: 10.1017/s1355617701733048. [DOI] [PubMed] [Google Scholar]
- Buchanan DC, Waterhouse GJ, West SC., Jr A proposed neurophysiological basis of alexithymia. Psychother Psychosom. 1980;34:248–55. doi: 10.1159/000287465. [DOI] [PubMed] [Google Scholar]
- Chiarello C. A house divided? Cognitive functioning with callosal agenesis. Brain Lang. 1980;11:128–58. doi: 10.1016/0093-934x(80)90116-9. [DOI] [PubMed] [Google Scholar]
- Constantino J. Social Responsiveness Scale. 2nd edn. (SRS-2). Los Angeles, CA: Western Psychological Services; 2012. [Google Scholar]
- Corsello C, Hus V, Pickles A, Risi S, Cook EH, Jr, Leventhal BL. Between a ROC and a hard place: decision making and making decisions about using the SCQ. J Child Psychol Psychiatry. 2007;48:932–40. doi: 10.1111/j.1469-7610.2007.01762.x. [DOI] [PubMed] [Google Scholar]
- Crawford JR, Henry JD. The Positive and Negative Affect Schedule (PANAS): Construct validity, measurement properties and normative data in a large non-clinical sample. Br J Clin Psychol. 2004;43(Pt 3):245–65. doi: 10.1348/0144665031752934. [DOI] [PubMed] [Google Scholar]
- Egaas B, Courchesne E, Saitoh O. Reduced size of corpus callosum in autism. Arch Neurol. 1995;52:794–801. doi: 10.1001/archneur.1995.00540320070014. [DOI] [PubMed] [Google Scholar]
- Fowler P, Zillmer E, Newman A. WAIS factor pattern for neuropsychiatric inpatients. J Clin Psychol. 1988;44:398–402. doi: 10.1002/1097-4679(198805)44:3<398::aid-jclp2270440314>3.0.co;2-j. [DOI] [PubMed] [Google Scholar]
- Frith U. Autism: explaining the enigma. Oxford, UK; Cambridge, MA: Basil Blackwell; 1989. [Google Scholar]
- Geschwind DH, Levitt P. Autism spectrum disorders: developmental disconnection syndromes. Curr Opin Neurobiol. 2007;17:103–11. doi: 10.1016/j.conb.2007.01.009. [DOI] [PubMed] [Google Scholar]
- Glass H, Shaw G, Ma C, Sherr EH. Agenesis of the corpus callosum in California 1983-2003: a population-based study. Am J Med Genet A. 2008;146A:2495–500. doi: 10.1002/ajmg.a.32418. [DOI] [PMC free article] [PubMed] [Google Scholar]
- Goldenfeld N, Baron-Cohen S, Wheelwright S. Empathizing and systemizing in males, females and autism. Clinical Neuropsychiatry. 2005;2:338–45. [Google Scholar]
- Goodyear PW, Bannister CM, Russell S, Rimmer S. Outcome in prenatally diagnosed fetal agenesis of the corpus callosum. Fetal Diagn Ther. 2001;16:139–45. doi: 10.1159/000053898. [DOI] [PubMed] [Google Scholar]
- Hetts SW, Sherr EH, Chao S, Gobuty S, Barkovich AJ. Anomalies of the corpus callosum: an MR analysis of the phenotypic spectrum of associated malformations. Am J of Roentgenol. 2006;187:1343–8. doi: 10.2214/AJR.05.0146. [DOI] [PubMed] [Google Scholar]
- Hsu YT, Duann JR, Chen CM, Yang YW, Tsai CH, Lu MK. Anatomical and electrophysiological manifestations in a patient with congenital corpus callosum agenesis. Brain Topogr. 2013;26:171–6. doi: 10.1007/s10548-012-0247-9. [DOI] [PubMed] [Google Scholar]
- Huber-Okrainec J, Blaser SE, Dennis M. Idiom comprehension deficits in relation to corpus callosum agenesis and hypoplasia in children with spina bifida meningomyelocele. Brain Lang. 2005;93:349–68. doi: 10.1016/j.bandl.2004.11.002. [DOI] [PubMed] [Google Scholar]
- Jeeves MA. Some limits to interhemispheric integration in cases of callosal agenesis and partial commissurotomy. In: Russell IS, Van Hof MW, Berlucci G, editors. Structure and function of the cerebral commissures. London: McMillan; 1979. [Google Scholar]
- Just MA, Cherkassky VL, Keller TA, Kana RK, Minshew NJ. Functional and anatomical cortical underconnectivity in autism: evidence from an FMRI study of an executive function task and corpus callosum morphometry. Cereb Cortex. 2007;17:951–61. doi: 10.1093/cercor/bhl006. [DOI] [PMC free article] [PubMed] [Google Scholar]
- Just MA, Cherkassky VL, Keller TA, Minshew N. Cortical activation and synchronization during sentence comprehension in high-functioning autism: evidence of underconnectivity. Brain. 2004;127:1811–21. doi: 10.1093/brain/awh199. [DOI] [PubMed] [Google Scholar]
- Keller TA, Kana RK, Just MA. A developmental study of the structural integrity of white matter in autism. Neuroreport. 2007;18:23–7. doi: 10.1097/01.wnr.0000239965.21685.99. [DOI] [PubMed] [Google Scholar]
- Keown CL, Shih P, Nair A, Peterson N, Mulvey ME, Muller RA. Local functional overconnectivity in posterior brain regions is associated with symptom severity in autism spectrum disorders. Cell Rep. 2013;5:567–72. doi: 10.1016/j.celrep.2013.10.003. [DOI] [PMC free article] [PubMed] [Google Scholar]
- Kier EL, Truwit CL. The normal and abnormal genu of the corpus callosum: an evolutionary, embryologic, anatomic, and MR analysis. AJNR Am J Neuroradiol. 1996;17:1631–41. [PMC free article] [PubMed] [Google Scholar]
- Kilian SC, Brown W, Hallam B, Mcmahon W, Lu J, Johnson M, et al. Regional Callosal Morphology in Autism and Macrocephaly. Dev Neuropsychol. 2008;33:74–99. doi: 10.1080/87565640701729821. [DOI] [PubMed] [Google Scholar]
- Kleinhans NM, Richards T, Sterling L, Stegbauer KC, Mahurin R, Johnson LC, et al. Abnormal functional connectivity in autism spectrum disorders during face processing. Brain. 2008;131:1000–12. doi: 10.1093/brain/awm334. [DOI] [PubMed] [Google Scholar]
- Koshino H, Carpenter PA, Minshew NJ, Cherkassky VL, Keller TA, Just MA. Functional connectivity in an fMRI working memory task in high-functioning autism. Neuroimage. 2005;24:810–21. doi: 10.1016/j.neuroimage.2004.09.028. [DOI] [PubMed] [Google Scholar]
- Lau Y, Hinkley L, Bukshpun P, Strominger Z, Wakahiro M, Baron-Cohen S, et al. Autism traits in individuals with agenesis of the corpus callosum. J Autism Dev Disord. 2013;43:1106–18. doi: 10.1007/s10803-012-1653-2. [DOI] [PMC free article] [PubMed] [Google Scholar]
- Lau YC, Hinkley LB, Bukshpun P, Strominger ZA, Wakahiro ML, Baron-Cohen S, et al. Autism traits in individuals with agenesis of the Corpus Callosum. J Autism Dev Disord. 2012;43:1106–18. doi: 10.1007/s10803-012-1653-2. [DOI] [PMC free article] [PubMed] [Google Scholar]
- Lecouteur A, Rutter M, Lord C. Autism diagnostic interview: a standardized investigator-based instrument. J Autism Dev Disord. 1989;19:363–87. doi: 10.1007/BF02212936. [DOI] [PubMed] [Google Scholar]
- Liebowitz MR. Social phobia. Mod Probl Pharmacopsychiatry. 1987;22:141–73. doi: 10.1159/000414022. [DOI] [PubMed] [Google Scholar]
- Liederman J, Merola J, Martinez S. Interhemispheric collaboration in response to simultaneous bilateral input. Neuropsychologia. 1985;23:673–83. doi: 10.1016/0028-3932(85)90068-5. [DOI] [PubMed] [Google Scholar]
- Lombardo MV, Chakrabarti B, Lai MC, Baron-Cohen S. Self-referential and social cognition in a case of autism and agenesis of the corpus callosum. Mol Autism. 2012;3:14. doi: 10.1186/2040-2392-3-14. [DOI] [PMC free article] [PubMed] [Google Scholar]
- Lord C, Leventhal BL, Cook EH., Jr Quantifying the phenotype in autism spectrum disorders. Am J Med Genet. 2001;105:36–8. [PubMed] [Google Scholar]
- Lord C, Rutter M, Delavore PC, Risi S, Gotham K, Bishop SL. Autism diagnostic observation schedule. 2nd edn. (ADOS-2) Manual (Part 1): Modules 1–4. Torrance, CA: Western Psychological Services; 2012. [Google Scholar]
- Lord C, Rutter M, Goode S, Heemsbergen J, Jordan H, Mawhood L, et al. Autism diagnostic observation schedule: a standardized observation of communicative and social behavior. J Autism Dev Disord. 1989;19:185–212. doi: 10.1007/BF02211841. [DOI] [PubMed] [Google Scholar]
- Manes F, Piven J, Vrancic D, Nanclares V, Plebst C, Starkstein SE. An MRI study of the corpus callosum and cerebellum in mentally retarded autistic individuals. J Neuropsychiatry Clin Neurosci. 1999;11:470–4. doi: 10.1176/jnp.11.4.470. [DOI] [PubMed] [Google Scholar]
- Marco EJ, Harrell KM, Brown WS, Hill SS, Jeremy RJ, Kramer JH, et al. Processing speed delays contribute to executive function deficits in individuals with agenesis of the corpus callosum. J Int Neuropsychol Soc. 2012;18:521–9. doi: 10.1017/S1355617712000045. [DOI] [PMC free article] [PubMed] [Google Scholar]
- Matson JL, Williams LW. Differential diagnosis and comorbidity: distinguishing autism from other mental health issues. Neuropsychiatry. 2013;3:233–43. [Google Scholar]
- Mazzone L, Ruta L, Reale L. Psychiatric comorbidities in asperger syndrome and high functioning autism: diagnostic challenges. Ann Gen Psychiatry. 2012;11:16. doi: 10.1186/1744-859X-11-16. [DOI] [PMC free article] [PubMed] [Google Scholar]
- Meerwaldt JD. Disturbances of spatial perception in a patient with agenesis of the corpus callosum. Neuropsychologia. 1983;21:161–5. doi: 10.1016/0028-3932(83)90083-0. [DOI] [PubMed] [Google Scholar]
- Mennin DS, Fresco DM, Heimberg RG, Schneier FR, Davies SO, Liebowitz MR. Screening for social anxiety disorder in the clinical setting: using the Liebowitz Social Anxiety Scale. J Anxiety Disord. 2002;16:661–73. doi: 10.1016/s0887-6185(02)00134-2. [DOI] [PubMed] [Google Scholar]
- Minshew NJ, Goldstein G, Siegel DJ. Neuropsychologic functioning in autism: profile of a complex information processing disorder. J Int Neuropsychol Soc. 1997;3:303–16. [PubMed] [Google Scholar]
- Moes P, Schilmoeller K, Schilmoeller G. Physical, motor, sensory and developmental features associated with agenesis of the corpus callosum. Child Care Health Dev. 2009;35:656–72. doi: 10.1111/j.1365-2214.2009.00942.x. [DOI] [PubMed] [Google Scholar]
- Mueller KLO, Marion SD, Paul LK, Brown WS. Bimanual motor coordination in agenesis of the corpus callosum. Behav Neurosci. 2009;123:1000–11. doi: 10.1037/a0016868. [DOI] [PubMed] [Google Scholar]
- Nyden A, Carlsson M, Carlsson A, Gillberg C. Interhemispheric transfer in high-functioning children and adolescents with autism spectrum disorders: a controlled pilot study. Dev Med Child Neurol. 2004;46:448–54. doi: 10.1017/s001216220400074x. [DOI] [PubMed] [Google Scholar]
- O'brien G. The behavioral and developmental consequences of callosal agenesis. In: Lassonde M, Jeeves MA, editors. Callosal agenesis: a natural split brain? New York: Plenum Press; 1994. [Google Scholar]
- Parikshak NN, Luo R, Zhang A, Won H, Lowe JK, Chandran V, et al. Integrative functional genomic analyses implicate specific molecular pathways and circuits in autism. Cell. 2013;155:1008–21. doi: 10.1016/j.cell.2013.10.031. [DOI] [PMC free article] [PubMed] [Google Scholar]
- Paul LK, Brown WS, Adolphs R, Tyszka JM, Richards LJ, Mukherjee P, et al. Agenesis of the corpus callosum: genetic, developmental and functional aspects of connectivity. Nat Rev Neurosci. 2007;8:287–99. doi: 10.1038/nrn2107. [DOI] [PubMed] [Google Scholar]
- Paul LK, Lautzenhiser A, Brown WS, Hart A, Neumann D, Spezio M. Emotional arousal in agenesis of the corpus callosum. Int J of psychophysiol. 2006;61:47–56. doi: 10.1016/j.ijpsycho.2005.10.017. [DOI] [PubMed] [Google Scholar]
- Paul LK, Van Lancker-Sidtis D, Schieffer B, Dietrich R, Brown WS. Communicative deficits in agenesis of the corpus callosum: nonliteral language and affective prosody. Brain Lang. 2003;85:313–24. doi: 10.1016/s0093-934x(03)00062-2. [DOI] [PubMed] [Google Scholar]
- Piven J, Bailey J, Ranson BJ, Arndt S. An MRI study of the corpus callosum in autism. Am J Psychiatry. 1997;154:1051–6. doi: 10.1176/ajp.154.8.1051. [DOI] [PubMed] [Google Scholar]
- Probst FP. Anatomic details of the midline structures in agenesis of the corpus callosum [in German] Acta Radiol Diagn (Stockh) 1972;13:449–60. [PubMed] [Google Scholar]
- Rakic P, Yakovlev PI. Development of the corpus callosum and cavum septi in man. J Comp Neurol. 1968;132:45–72. doi: 10.1002/cne.901320103. [DOI] [PubMed] [Google Scholar]
- Redcay E, Moran JM, Mavros PL, Tager-Flusberg H, Gabrieli JD. Whitfield-Gabrieli S Intrinsic functional network organization in high-functioning adolescents with autism spectrum disorder. Front Hum Neurosci. 2013;7:573. doi: 10.3389/fnhum.2013.00573. [DOI] [PMC free article] [PubMed] [Google Scholar]
- Risi S, Lord C, Gotham K, Corsello C, Chrysler C, Szatmari P, et al. Combining information from multiple sources in the diagnosis of autism spectrum disorders. J Am Acad Child Adolesc Psychiatry. 2006;45:1094–103. doi: 10.1097/01.chi.0000227880.42780.0e. [DOI] [PubMed] [Google Scholar]
- Rutter M, Bailey A, Berument S, Lord C, Pickles A. Social Communication Questionnaire (SCQ) Los Angeles, CA: Western Psychological Services; 2003a. [Google Scholar]
- Rutter M, Le Couteur A, Lord C. Autism diagnostic interview—revised. WPS Edition. Los Angeles: Western Psychological Services; 2003b. [Google Scholar]
- Sajan SA, Fernandez L, Nieh SE, Rider E, Bukshpun P, Wakahiro M, et al. Both rare and de novo copy number variants are prevalent in agenesis of the corpus callosum but not in cerebellar hypoplasia or polymicrogyria. PLoS Genet. 2013;9:e1003823. doi: 10.1371/journal.pgen.1003823. [DOI] [PMC free article] [PubMed] [Google Scholar]
- Sanders RJ. Sentence comprehension following agenesis of the corpus callosum. Brain Lang. 1989;37:59–72. doi: 10.1016/0093-934x(89)90101-6. [DOI] [PubMed] [Google Scholar]
- Santo S, D'Antonio F, Homfray T, Rich P, Pilu G, Bhide A. Counseling in fetal medicine: agenesis of the corpus callosum. Ultrasound Obstet Gynecol. 2012;40:513–21. doi: 10.1002/uog.12315. [DOI] [PubMed] [Google Scholar]
- Sauerwein HC, Lassonde M. Intra- and inter-hemispheric processing of visual information in callosal agenesis. Neuropsychologia. 1983;21:167–71. doi: 10.1016/0028-3932(83)90084-2. [DOI] [PubMed] [Google Scholar]
- Sauerwein HC, Nolin P, Lassonde M. Cognitive functioning in callosal agenesis. In: Lassonde M, Jeeves MA, editors. Callosal agenesis: a natural split brain? New York: Plenum Press; 1994. [Google Scholar]
- Shevell MI. Clinical and diagnostic profile of agenesis of the corpus callosum. J Child Neurol. 2002;17:896–900. [PubMed] [Google Scholar]
- Silverman J, Yang M, Lord C, Crawley J. Behavioural phenotyping assays for mouse models of autism. Nat Rev Neurosci. 2010;11:490–502. doi: 10.1038/nrn2851. [DOI] [PMC free article] [PubMed] [Google Scholar]
- Solursh LP, Margulies AI, Ashem B, Stasiak EA. The relationships of agenesis of the corpus callosum to perception and learning. J Nerv Ment Dis. 1965;141:180–9. doi: 10.1097/00005053-196508000-00005. [DOI] [PubMed] [Google Scholar]
- Spielberger CD, Gorssuch RL, Lushene PR, Vagg PR, Jacobs GA. Palo Alto, CA: Consulting Psychologists Press, Inc.; 1983. Manual for the State-Trait Anxiety Inventory. [Google Scholar]
- Symington SH, Paul LK, Symington MF, Ono M, Brown WS. Social cognition in individuals with agenesis of the corpus callosum. Soc Neurosci. 2010;5:296–308. doi: 10.1080/17470910903462419. [DOI] [PubMed] [Google Scholar]
- Temple CM, Jeeves MA, Vilarroya O. Ten pen men: Rhyming skills in two children with callosal agenesis. Brain Lang. 1989;37:548–64. doi: 10.1016/0093-934x(89)90111-9. [DOI] [PubMed] [Google Scholar]
- Temple CM, Jeeves MA, Vilarroya O. Reading in callosal agenesis. Brain Lang. 1990;39:235–53. doi: 10.1016/0093-934x(90)90013-7. [DOI] [PubMed] [Google Scholar]
- Turk A, Brown WS, Symingtion M, Paul LK. Social narratives in agenesis of the corpus callosum: linguistic analysis of the thematic apperception test. Neuropsychologia. 2010;48:43–50. doi: 10.1016/j.neuropsychologia.2009.08.009. [DOI] [PubMed] [Google Scholar]
- Tyszka JM, Kennedy DP, Adolphs R, Paul LK. Intact bilateral resting-state networks in the absence of the corpus callosum. J Neurosci. 2011;31:15154–62. doi: 10.1523/JNEUROSCI.1453-11.2011. [DOI] [PMC free article] [PubMed] [Google Scholar]
- Tyszka JM, Kennedy DP, Paul LK, Adolphs R. Largely typical patterns of resting-state functional connectivity in high-functioning adults with autism. Cereb Cortex. 2013 doi: 10.1093/cercor/bht040. first published online February 20, 2013 doi:10.1093/cercor/bht040. [DOI] [PMC free article] [PubMed] [Google Scholar]
- Vidal CN, Nicolson R, Devito TJ, Hayashi KM, Geaga JA, Drost DJ, et al. Mapping corpus callosum deficits in autism: an index of aberrant cortical connectivity. Biol Psychiatry. 2006;60:218–25. doi: 10.1016/j.biopsych.2005.11.011. [DOI] [PubMed] [Google Scholar]
- Wahl M, Strominger Z, Jeremy RJ, Barkovich AJ, Wakahiro M, Sherr EH. Variability of homotopic and heterotopic callosal connectivity in partial agenesis of the corpus callosum: a 3T diffusion tensor imaging and Q-ball tractography study. AJNR Am J Neuroradiol. 2009;30:282–9. doi: 10.3174/ajnr.A1361. [DOI] [PMC free article] [PubMed] [Google Scholar]
- Wahlsten D, Metten P, Crabbe JC. Survey of 21 inbred mouse strains in two laboratories reveals that BTBR T/+ tf/tf has severely reduced hippocampal commissure and absent corpus callosum. Brain Res. 2003;971:47–54. doi: 10.1016/s0006-8993(03)02354-0. [DOI] [PubMed] [Google Scholar]
- Wechsler D. WASI Administration and Scoring Manual. San Antonio, TX: Psychological Corp. 1999 [Google Scholar]
- Wechsler D. Wechsler Intelligence Scale for Children. 3rd edn. San Antonio, TX: Psychological Corporation; 1991. [Google Scholar]
- Wheelwright S, Baron-Cohen S, Goldenfeld N. Predicting autism spectrum quotient (AQ) from the Systemizing Quotient-Revised (SQ-R) and Empathy Quotient (EQ) Brain Res. 2006;1079:47–56. doi: 10.1016/j.brainres.2006.01.012. [DOI] [PubMed] [Google Scholar]
Associated Data
This section collects any data citations, data availability statements, or supplementary materials included in this article.