

Abstract
Summary: We created a deeply extracted and annotated database of genome-wide association studies (GWAS) results. GRASP v1.0 contains >6.2 million SNP-phenotype association from among 1390 GWAS studies. We re-annotated GWAS results with 16 annotation sources including some rarely compared to GWAS results (e.g. RNAediting sites, lincRNAs, PTMs).
Motivation: To create a high-quality resource to facilitate further use and interpretation of human GWAS results in order to address important scientific questions.
Results: GWAS have grown exponentially, with increases in sample sizes and markers tested, and continuing bias toward European ancestry samples. GRASP contains >100 000 phenotypes, roughly: eQTLs (71.5%), metabolite QTLs (21.2%), methylation QTLs (4.4%) and diseases, biomarkers and other traits (2.8%). cis-eQTLs, meQTLs, mQTLs and MHC region SNPs are highly enriched among significant results. After removing these categories, GRASP still contains a greater proportion of studies and results than comparable GWAS catalogs. Cardiovascular disease and related risk factors pre-dominate remaining GWAS results, followed by immunological, neurological and cancer traits. Significant results in GWAS display a highly gene-centric tendency. Sex chromosome X (OR = 0.18[0.16-0.20]) and Y (OR = 0.003[0.001-0.01]) genes are depleted for GWAS results. Gene length is correlated with GWAS results at nominal significance (P ≤ 0.05) levels. We show this gene-length correlation decays at increasingly more stringent P-value thresholds. Potential pleotropic genes and SNPs enriched for multi-phenotype association in GWAS are identified. However, we note possible population stratification at some of these loci. Finally, via re-annotation we identify compelling functional hypotheses at GWAS loci, in some cases unrealized in studies to date.
Conclusion: Pooling summary-level GWAS results and re-annotating with bioinformatics predictions and molecular features provides a good platform for new insights.
Availability: The GRASP database is available at http://apps.nhlbi.nih.gov/grasp.
Contact: johnsonad2@nhlbi.nih.gov
1 INTRODUCTION
Genome-wide association studies (GWAS) revolutionized the study of human genetics for numerous traits and diseases, but have rarely been used to synthesize results across traits and diseases (Huang et al., 2011; Johnson and O’Donnell, 2009; Sivakumaran et al., 2011). Biomolecular annotations of results from GWAS are not uniformly applied across studies hampering comparisons even for fundamental aspects such as overlap with genes (Johnson and O’Donnell, 2009). Scientists commonly use existing GWAS results databases to provide evidence for association but these databases have significant limitations in annotations applied, and studies and results included (Hindorff et al., 2009; Hong et al., 2012; Li et al., 2013; Palleja et al., 2012; Thorisson et al., 2009). We collected >6.2 million available results from 1390 GWAS papers to create a large results database deeply annotated in a uniform manner. In analysis of collected results, we observe temporal trends across GWAS studies, demonstrate how deep annotation can lead to functional hypotheses often missed in original reports, and show how data mining across diverse phenotypes reveals putative pleiotropic loci and variants. The Genome-wide Repository of Associations between SNPs and Phenotypes (GRASP) is freely available for query and download (http://apps.nhlbi.nih.gov/grasp), and plans to accept submission of additional results for public posting and archiving in future releases.
2 METHODS
2.1 Search strategies and study and SNP-level data extraction
Controlled vocabulary searches of PubMed and GoogleScholar were applied to identify potential studies, and abstracts, and where necessary articles, were reviewed to determine if inclusion criteria were met. Briefly, studies had to be published before January 1, 2012 and report association testing of ≥25 000 SNP markers for ≥1 human trait to be included. Studies which did not report any single SNP testing, or which focused on SNP–SNP, gene–gene or gene–environment effects without reporting single SNP main effects were excluded. All association results with P ≤ 0.05 were extracted from each article including consideration of all article text, figures, tables and Supplemental Materials including external websites. More details on inclusion criteria for studies and results can be found at http://apps.nhlbi.nih.gov/grasp. A web server at this site allows full download of the database, or querying through a variety of mechanisms including phenotypes, SNPids, gene names, chromosomal location and P-value filtering.
Study-level information was annotated for each study. Some information such as sample size and ancestry was extracted from the NHGRI GWAS catalog (Hindorff et al., 2009) and then supplemented and verified. Imputation and number of variants tested for each study was reported post-quality control (QC) filters when described. If exact numbers were unavailable the numbers were estimated based on the genotype platform(s) or imputation description. Each study was reviewed to identify whether any gender-specific samples (male only or female only) were included in the discovery and/or replication phase, and to determine if any studies were exclusively male or female. The number of samples in different ancestry categories in discovery and replication phases was recorded for each study. Reported ethnogeographic categories include: European, African, East Asian, Indian/South Asian, Hispanic, Native American, Aboriginal, Micronesian, Arab/Middle Eastern, Mixed (a mixed sample was reported but specific proportions were not given) or Unknown (an unspecified sample).
2.2 Construction and uniform annotation of GRASP GWAS database
Results for each study were reviewed to eliminate duplicative entries and ensure each result had a statistical P-value assigned. Phenotype descriptions were harmonized at the level of each study, and broad (e.g. cancer) and narrow (e.g. melanoma) phenotype categories were assigned to facilitate search and categorization. SNP identifiers were mapped to a single dbSNP build (Build 134). Where valid SNPids could not immediately be verified, or SNP chromosome and position were given, several informatics strategies were used to recover a valid SNPid if possible. SNP identifiers were used to provide consensus mapping of all results to the same genome build (GR37), and SNPs with poor mapping were discarded (n = 2062).
Consensus gene boundaries in GR37 were established based on UCSC RefSeq genes track, deriving the maximal boundaries (5’ to 3’) for all gene isoforms. This gene set was used to uniformly annotate all results for gene overlaps based on SNP positions. SNPs overlapping multiple genes were annotated as being in all genes they overlapped. Counts of GWAS SNPs tested within genes were estimated based on a European HapMap (release 22) from the Framingham Heart Study (n = 2 543 887 SNPs). Additional SNP-specific annotations were applied including: dbSNP functional category, observed alleles in dbSNP and heterozygosity, global minor allele frequency (MAF) in dbSNP, validation status in dbSNP, clinical annotation in dbSNP and for non-synonymous SNPs, where available, PolyPhen2, SIFT and LS-SNP prediction results. Other functional annotations were added based on SNP position intersections including overlaps with: lincRNAs, miRNA-coding regions from miRbase, miRNA-binding sites from PolymiRTS 2.0, regulatory annotations from ORegAnno, conserved predicted transcription factor binding sites (TFBS) from UCSC and validated human enhancer sequences from VistaEnhancers. Protein functional regions (e.g. post-translational modifications) from UniProtKB were mapped via several bioinformatics approaches to their corresponding codons and 3-base genomic positions and then checked for intersection with each SNP in GRASP.
2.3 Comparison to NHGRI GWAS catalog
The NHGRI GWAS catalog was downloaded on March 27, 2013. All valid SNP associations were retained for studies published through the date of December 31, 2011 to provide a comparable time frame to GRASP. Results from the same MHC region (chr6: 29 000 000 to 33 500 000 GR37) were removed for sub-comparisons. Studies that did not overlap between the NHGRI catalog and GRASP were examined to determine why. We compared GRASP SNP results to the NHGRI catalog SNP results at three different P-value thresholds: P ≤ 5E − 8, a commonly applied genome-wide significance threshold; P < 1E − 5, a moderate threshold applied to the least significant results in the NHGRI catalog; and P ≤ 0.05, the liberal threshold applied for the least significant results in GRASP.
3 RESULTS
3.1 Description of the GRASP database results
At a genome-wide significant level (P ≤ 5E − 8), there is clear enrichment of gene expression eQTL results and MHC class-II region results (Fig. 1). Expression QTL, methylation QTL and metabolomics QTL studies and 6p21.3 results in the MHC class-II region were removed from subsequent analyses, except where noted, in order to focus on primary diseases, risk factors and biomarkers, and to identify pleiotropic regions beyond the MHC region.
Fig. 1.
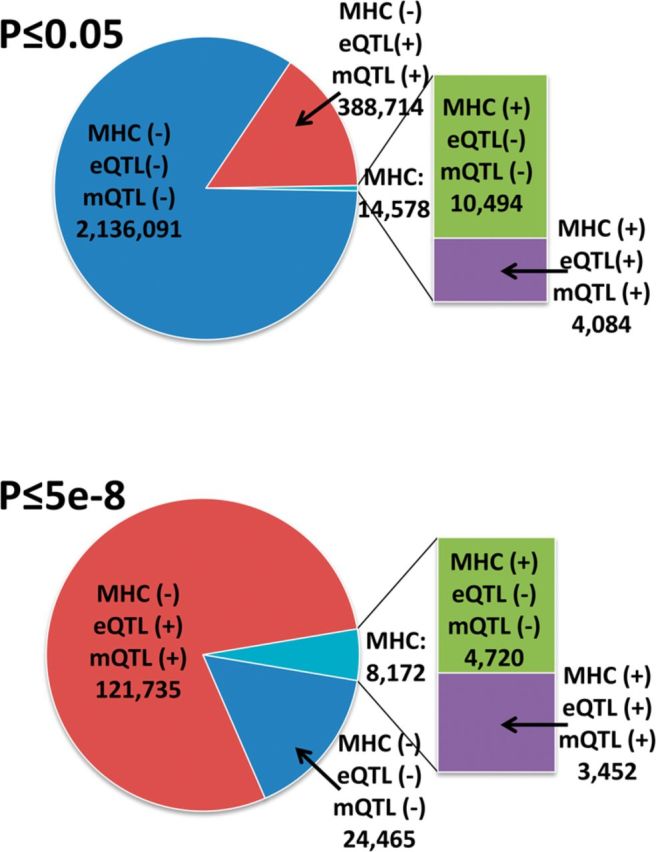
Proportion of unique SNPs with associations at two thresholds [P ≤ 0.05 (top panel), P ≤ 5E − 8 (bottom panel)] either in, or outside of the MHC class-II region (6p21.3), and/or in, or not in, studies of high phenotype number (eQTL, methylation QTL and metabolomics QTL studies)
The studies included in GRASP contribute very different proportions to the overall database. The following are proportions of the 1390 studies in bins for number of results with P ≤ 0.05: 0 results (2.2%), 1–100 results (63.5%), 101–1000 results (26.5%), 1001–10 000 results (4.0%), 10 001–100 000 results (2.7%), >100 000 results (1.1%). Study-level annotations were used to enumerate results in general and specific categories. The top-most represented phenotypes and phenotype categories are shown at P ≤ 0.05 and P ≤ 5E − 8 in Figure 2 for Cardiovascular traits and risk factors including lung and kidney disorders (Fig. 2A), immunological (Fig. 2B), neurological (Fig. 2C) and cancer phenotypes (Fig. 2D). These results distributions provide a rough composition of the body of GWAS results with the most results in the cardiovascular domain and its risk factors, followed by immunological phenotypes, neurological traits and diseases and then cancer phenotypes. The broad phenotype domains are non-exclusive; e.g. brain cancers are counted in both neurological and cancer domains. The distribution of phenotypes in GRASP is obviously influenced by factors including the number of studies in a given phenotype area, sample size (statistical power) of those studies, the number of ‘true’ results for those phenotypes and the extent to which authors’ disclosed results (e.g. full GWAS scan results). In general there were far fewer significant cancer results in GRASP which may reflect fewer studies and less disclosure of results in that domain. Cardiovascular-related results predominate in part due to the availability of full results for GWAS scans of cardiovascular disease and its risk factors (e.g. lipids, blood pressure, body mass index).
Fig. 2.

Pie chart breakdowns of number of results in GRASP by phenotype categories at two statistical threshold (left pies: P ≤ 0.05, right pies: P ≤ 5E − 8). Major categories are cardiovascular traits and risk factors (row A), immunological traits and disorders (row B), neurological traits (row C) and cancer traits (row D)
Unlike other GWAS results catalogs, the GRASP database stores a location for each result allowing estimation of the proportion of results in different manuscript portions. At P ≤ 5E − 8, location of results among 1390 papers was segmented as follows: Supplemental Materials tables or full scan results (87.9%), main article table (11.5%), main text or any figure (0.6%). At nominal significance levels (P ≤ 0.05), 99.6% of results were found in a Supplemental Materials table or full scan. While more significant results tend to occur in main tables, these results distributions demonstrate that across the significance spectrum most results appear in Supplementary Materials. Supplementary Materials are generally unedited, not included in most automated literature download tools and present a wider diversity of information formats than main materials. The data-handling challenges presented by Supplementary Materials, and to a lesser degree figures and text, necessitate that a comprehensive GWAS database requires manual curation and at best semi-automated processing of results is feasible.
3.2 Chronological trends across 1390 GWAS studies
The growth in published GWAS studies through the end of 2011 is best approximated by an exponential function (r2 = 0.956), though the year of 2011 itself demonstrates a strong linear trend (r2 = 0.997) indicating a saturation rate may have been reached and projecting continued linear growth. Journals publishing the most GWAS included in GRASP were Nature Genetics (n = 308), Human Molecular Genetics (HMG) (n = 108), PLoS Genetics (n = 104), PLoS One (n = 68) and American Journal of Human Genetics (AJHG) (n = 55). In 2011, Nature Genetics and AJHG sharply decreased in the number of GWAS published, whereas HMG, PLoS Gen, PLoS One and Human Genetics all sharply increased GWAS publications. The number of studies conducting SNP imputation grew linearly between the period of 2006–2011, though in total still only comprising 29.0% (n = 476) of the studies in GRASP. Modest growth in the number of markers tested in GWAS is similarly observed over time. Affymetrix and Illumina platforms predominate over others with only 6.7% of studies reporting any, or exclusive (4.2%), use of another GWAS platform (Perlegen > Invader > Sequenom). Illumina SNP arrays were applied in the greatest portion of studies (61.0%) versus Affymetrix (42.1%), and showed faster growth over 2008–2011.
The publication bias of GWAS toward European ancestry samples has previously been studied (Need and Goldstein, 2009). In an updated view of this analysis, we find this trend continues and even strengthens through the end of 2011 (Fig. 3). The next fastest growing ancestry classifications in GWAS studies were East Asians, mixed ancestry studies and then African ancestry samples. Even within studies including multiple ancestries, European samples are most common followed by African > East Asian > Hispanic > Indian/South Asian. These results suggest that there remains a large gap in our understanding of worldwide population genetic influences on traits, and there should be continuing opportunity for novel-scientific discoveries to be made by increasing both the sample size and diversity of populations studied.
Fig. 3.

Reported ancestry or ancestries of samples included in GWAS discovery or replication efforts per year from 2002 to 2011
3.3 Genes enriched or depleted for GWAS results
We first reported the gene-centric tendency of significant SNPs in GWAS (Johnson and O’Donnell, 2009). Here we find a strong central tendency of more significant results after excluding eQTLs, mQTLs and the MHC region (Fig. 4). Compared to the background proportion of imputed SNPs outside genes, GWAS results outside genes with P < 1E − 4 are particularly enriched within ∼50 kb 5’ or 3’ of genes (Fig. 4, inset). Gene-centric associations are likely to have the most plausible functional mechanisms (e.g. protein sequence, RNA splicing, processing, degradation or translational efficiency), thus we chose to conduct analysis of genes enriched or depleted for significant GWAS findings within their transcript-coding boundaries.
Fig. 4.

GWAS strength of association (blue points) relative to distance to nearest gene for SNPs with P < 1E − 4 and located outside of RefSeq gene transcript isoform boundaries only. eQTL and mQTL and MHC 6p21.3 results are excluded. The inset (upper right) shows enrichment of the proportion of GWAS associations within ∼50 kb of genes (light blue) relative to the proportion of HapMap European imputed SNPs in FHS (yellow)
There were 3984 out 23 026 UCSC RefSeq genes annotated as lacking any GWAS result within their gene boundary at nominal significance (P ≤ 0.05). Of these genes, 496 were X-mapped and 111 were Y-mapped. Thus, genes having at least one nominally significant GWAS result were extremely depleted on the X chromosome and Y chromosome relative to autosomal genes (X-chromosome OR = 0.179 [0.157-0.204]; Y-chromosome OR = 0.0032 [0.0008-0.013]), matching decreased marker coverage of sex chromosomes on commercial arrays and a tendency not to conduct imputation or analysis for sex chromosomes. Genes with no reported GWAS result were significantly shorter (median size = 1172 bp, mean size = 6130 bp) than those with at least one GWAS result (median size = 24 774 bp, mean size = 62 624 bp). Autosomal gene length was correlated with the number of nominally significant (P ≤ 0.05) GWAS results (r2 = 0.81) (Fig. 5, top panel and Table 1). At more stringent thresholds this correlation attenuated (e.g. r2 = 0.0006 at P < 5E – 8; Fig. 5, bottom panel). There is an inflection point in the gene length to association correlation between –log10(4.0) and –log10(5.0) (Table 1), which suggests a fuzzy boundary where the prior positive of association likely increases significantly, somewhat consistent with several prior studies examining thresholds and indicating weak polygenic effects for many traits (Broer et al., 2013; Evans et al., 2013). For this reason we chose P < 1E − 4 as a midpoint to consider gene enrichment for GWAS results. Since the specific SNPs tested in each study are unknown, we used a set of 2.5 million SNPs from a HapMap European imputed dataset and examined the correlation between number of SNPs tested and GWAS associations in genes. We observe very similar patterns of correlation to the gene length analysis (Table 1).
Fig. 5.

Correlations between gene size and number of GWAS associations for autosomal and sex chromosome SNPs at three statistical thresholds: P ≤ 0.05 (top panel), P ≤ 1E − 4 (middle panel), P ≤ 5E − 8 (bottom panel). Selected gene outliers are labeled for autosomes (black) or sex chromosomes (grey). eQTL and mQTL and MHC 6p21.3 results are excluded
Table 1.
Attenuation in gene length (base pairs) and SNP number correlations to number of GWAS associations across different P-value statistical thresholds in GRASP
| −log10 (P-value) threshold | r2 (autosomes) using gene length | r2 (autosomes) using SNP counts | r2 (autosomes + X + Y) using gene length |
|---|---|---|---|
| 1.30103 | 0.814 | 0.908 | 0.774 |
| 2 | 0.661 | 0.716 | 0.631 |
| 2.30103 | 0.545 | 0.580 | 0.521 |
| 2.60206 | 0.439 | 0.459 | 0.421 |
| 3 | 0.353 | 0.364 | 0.339 |
| 3.12494 | 0.301 | 0.309 | 0.290 |
| 3.30103 | 0.231 | 0.234 | 0.222 |
| 3.60206 | 0.142 | 0.141 | 0.136 |
| 4 | 0.078 | 0.076 | 0.075 |
| 4.12494 | 0.058 | 0.055 | 0.055 |
| 4.30103 | 0.039 | 0.037 | 0.037 |
| 4.60206 | 0.020 | 0.020 | 0.019 |
| 5 | 0.0096 | 0.0086 | 0.0090 |
| 7.30103 | 0.0006 | 0.0007 | 0.0006 |
eQTL and mQTL and MHC 6p21.3 results are excluded.
We identified outlier autosomal genes either most enriched or depleted for GWAS results relative to their gene size at P-value thresholds of 0.05, 1E − 4, and 5E − 8 (Fig. 5), assuming gene length is a rough proxy for the number of haplotypes and variants tested. The largest autosomal gene depleted in GWAS associations was 1.9 Mb EYS, the largest eye-specific gene, well conserved across many species and found to be mutated in retinitis pigmentosa families (Abd El-Aziz et al., 2008). Some genes appear enriched primarily due to single traits or correlated traits, and likely reflect extensive LD and correlated associations (e.g. ADAMTSL3, BRE, CCDC91, DOCK7, FBN1, FTO, PCLO, SIK3 localized near APOA5, UGT cluster). A subjective selection of potentially pleiotropic-enriched genes was made with their GWAS results summarized in Table 2. Several of these gene regions were originally highlighted in a prior analysis of 118 GWAS papers (ABO, CDKAL1, CRHR1-KIAA1267, CSMD1, RBFOX1) (Johnson and O’Donnell, 2009), or later in an analysis of the NHGRI GWAS catalog (BNC2, CDH13, ESR1, PTPRD, THADA) (Sivakumaran et al., 2011).
Table 2.
Selected genes enriched for GWAS associations relative to their length
| Chromosome | Position (Mb, GR37) | Gene | Associated phenotypes (P <1E − 5), ordered from most significant to least |
|---|---|---|---|
| 1 | 72.31 | NEGR1 | BMI, tPA, Crohn’s disease, Hypertension, total cholesterol change with statins, SLE |
| 2 | 43.64 | THADA | Polycystic ovary syndrome, Crohn’s disease, PLT, T2D, Prostate cancer, Cleft lip, Hair morphology, FBG |
| 3 | 41.65 | ULK4 | Blood pressure, multiple myeloma, pulse pressure, intelligence, alcohol dependence, bipolar disorder |
| 4 | 9.97 | SLC2A9 | Uric acid/gout, esophageal cancer, narcolepsy, AD with psychotic symptoms |
| 6 | 20.88 | CDKAL1 | T2D, Cystatin C, Creatinine, Crohn’s disease, Selective IgAD, Insulin response, IBS, Stroke, UACR, Rectal cancer, Idiopathic scoliosis |
| 6 | 152.22 | ESR1 | Height, T2D, MI, bone mineral density, MDD, HDL cholesterol, alcohol dependence, endometriosis |
| 8 | 3.82 | CSMD1 | CAD, psoriasis, schizophrenia, longevity, statin-induced myopathy, HDL cholesterol, HbA1C, post-operative nausea, T2D, LDL cholesterol, HOMA-IR, microalbumineria, weight, PD, cisplatin IC50, MS, alpha-linoleic acid, MDD, Digit span, MCHC, Melanoma, gamma-tocopherol, Height, late-onset AD, asthma, percent body fat, narcotic addiction |
| 9 | 9.46 | PTPRD | Psoriasis, restless leg syndrome, T2D, azoospermia, hearing at 125 Hz, Paclitaxel IC50, asthma, stroke, osteoarthritis, creatnine, lung cancer, HDL cholesterol, metformin response, homocysteine, neutrophil count, partial epilepsy, MS severity |
| 9 | 16.64 | BNC2 | Ovarian cancer, freckles, HbA1C in T1D, paclitaxel IC50, LDL cholesterol, retina complications in T1D, total cholesterol |
| 9 | 136.14 | ABO | vWF, ICAM-1, metabolic syndrome, E-selectin, TNF-a, ALP, venous thrombosis, LDL cholesterol, total cholesterol, T1D, VLDL cholesterol, Phytosterol, ACE activity, MI, pancreatic cancer, MCHC, CAD, Grave’s disease, D-dimer, Simpson–Angus scale |
| 16 | 6.92 | RBFOX1 | BMI, lung cancer, dengue shock syndrome, Combined T2D/HTN/CAD case status, anti-depressant treatment outcomes and side effects, asthma, restless leg syndrome, hearing, bipolar disorder, ALL, schizophrenia, MS in females, vitamin D, triglycerides, parent rating scale in ADHD and conduct disorder |
| 16 | 10.06 | GRIN2A | Chronic hepatitis B progression, PD, Rheumatoid arthritis (CCP-positive), HIV-1 progression, adiponectin |
| 16 | 83.25 | CDH13 | Adiponectin, nicotine dependence, blood pressure, prostate cancer, paclitaxel IC50, CAD, clozapine effect on triglycerides, depression scale test, cognitive tests, stroke, extraversion, MCH, BMI, height, schizophrenia, fasting insulin, Narcolepsy, post-operative nausea, ADHD, ulcerative colitis, RBC |
| 17 | 43.81 | CRHR1 | PSP, PD, bone mineral density |
| 17 | 44.04 | MAPT | PSP, PD, primary biliary cirrhosis, BMI, lung function |
| 17 | 44.21 | KIAA1267 | PD, PSP, ADHD, autism, lung function |
Traits with P < 5E − 8 are bolded. ACE, angiotensin converting enzyme; AD, Alzheimer’s disease; ADHD, attention-deficit hyperactivity disorder; ALL, acute lymphoblastic leukemia; ALP, alkaline phosphatase; BMI, body mass index; CAD, coronary artery disease; FBG, fasting blood glucose; HbA1C, glycated hemoglobin; HTN, hypertension; MDD, major depressive disorder; MCH, mean corpuscular hemoglobin; MI, myocardial infarction; MS, multiple sclerosis; PD, Parkinson’s disease; PLT, platelet count; PSP, progressive supranuclear palsy; RBC, red blood cell count; SLE, systemic lupus erythematosus; tPA, tissue plasminogen activator; T1D, Type 1 diabetes; T2D, Type 2 diabetes
Some of the loci highlighted have plausible phenotype intersections (e.g. ABO, CRHR1-KIAA1267) while others are less intuitive. These may represent true pleiotropic effects, antagonistic pleiotropy, false positive associations or possible confounding. RBFOX1 is interesting as it was associated in GRASP with a range of phenotypes including neural ones (hearing, BD, schizophrenia, ADHD measures, anti-depressant outcomes), and the gene encodes a splicing factor with relative neural specificity (Fogel et al., 2012; Sun et al., 2012), thus, having the potential to effect many target genes and diverse phenotypes. Subsequent to the results included in GRASP, RBFOX1 SNPs and deletions have been associated with other neural phenotypes including glioblastoma (Hu et al., 2013), temporal lobe volume in Alzheimer’s disease (Kohannim et al., 2012), visual refractive error (Stambolian et al., 2013), autism (Davis et al., 2012) and epilepsy (Lal et al., 2013a, b) making it a compelling case for a pleiotropic gene. RBFOX1 is further suggested to have undergone positive selection and as a target for FOXP2, a transcription factor with key roles in brain plasticity and language development (Ayub et al., 2013).
The potential effects of population stratification are rarely discussed in the pleiotropy literature. If a locus or allele shows strong population stratification, given associations across many phenotype studies this may lead to an erroneous conclusion of pleiotropic effects. Common GWAS approaches to control stratification of single or double genomic-control correction and principal components analysis are not uniformly applied, and even when applied may not always be adequate to address stratification (Yan et al., 2013). Thus, caution and further detailed study is warranted for suggested pleiotropic genes.
3.4 Repeatedly associated SNPs across GWAS
We searched for SNPs that were found across many studies. These SNPs, or their correlated variants, may be the most obvious targets for functional assessment of pleiotropy and possible mechanistic inights. Among those reaching genome-wide significance in one or more study, the most frequent SNP was rs1260326 in the GCKR gene causing a Leu446Pro amino acid change (n = 98 associations with P ≤ 0.05; n = 62 associations with P < 5E − 8), associated with traits including lipids, C-reactive-protein levels, HOMA-IR, platelet count, red blood-cell count, eGFR (glomerular filtration rate), uric acid and metabolic syndrome. Many other SNPs were highly repeated at genome-wide significant levels across publications and map to described pleiotropic regions: e.g. MHC SNP rs6457617 (intergenic between HLA-DQB1 and HLA-DQA2, n = 25 times with P < 5E − 8 across studies), rs1800775 (upstream of CETP, n = 42), rs3184504 (in SH2B3, n = 39), rs4420638 (APOE, n = 39), rs646776 (SORT1, n = 38), rs1800562 (HFE, n = 34), rs964184 (ZNF259, n = 33), rs6511720 (LDLR, n = 29), rs7903146 (TCF7L2, n = 28). These examples are well-recognized, in many cases known since candidate gene and linkage studies (Johnson and O’Donnell, 2009).
Also of interest are SNPs repeated many times but which have not reached, or rarely reached, genome-wide significance levels in this build of GRASP. These could represent unappreciated pleiotropic alleles, or alternatively might reflect loci demonstrating significant population stratification. A MUC1 SNP, rs4072037, was found to be strongly associated with decreased serum magnesium levels (P < 2.0E − 36) in a European ancestry sample (Meyer et al., 2010). Only weeks later the same SNP allele was associated with decreased gastric cancer risk in a Chinese sample (P < 4.2E − 7) (Abnet et al., 2010) and later replicated (Shi et al., 2011). MUC1 is a highly spliced gene and a later study shows rs4072037 functionally affects splice variants in the gastric epithelium, causing a 9-amino acid deletion modifying both the signal peptide and N-terminal amino acid of the mature protein (Saeki et al., 2011). MUC1 has been linked to a variety of cancer types and targeted for therapeutics and diagnostics. Thus, the combined genetic and non-genetic studies suggest MUC1 is an important pleiotropic gene with implications for several disorders.
Intronic SNP rs6475082 in BNC2 is modestly associated with a range of glycemic traits in diabetics and non-diabetics, retinal and renal complications in Type I diabetes, LDL and total cholesterol and change with statins, Creutzfield–Jakob disease, coronary artery calcium, height (P-value range of association 0.04 through 1.8E − 7). BNC2 is also notably enriched for GWAS associations at the gene level, reaching genome-wide significance for ovarian cancer, freckles and glycated hemoglobin in T1D (Table 2). Recent papers have replicated associations of BNC2 with human skin color (Jacobs et al., 2013), and the gene influences coat color in mice (Smyth et al., 2006) and pigmentation and fertility in zebrafish (Lang et al., 2009). The human and animal models show a convergence of ovarian and skin-related phenotypes indicating potential causal roles for BNC2 in these traits. Although skin color is a complex trait it is expected to correlate with ethnogeographic status. It is possible that other trait associations at this locus could represent unresolved stratification. A study of BNC2 variants in a Norwegian T2D population cohort did not replicate the GWAS associations with glycated hemoglobin in T1D samples (Hertel et al., 2011).
Another example of possible stratification effects is rs2011946 (and several correlated variants) which map between DARS and CXCR4 in a region with histone and chIP-seq signatures in ENCODE. CXCR4 is a well-studied protein with recognized pleiotropic functions including but not limited to cancer biology and HIV viral entry, making it an appealing candidate for genetic pleiotropy. This single SNP is associated with 16 traits and disorders (P-value range 0.04 through 6.9E − 7), many of which are uncorrelated including melanoma, BMI, arthritis, epilepsy, Alzheimer’s disease and cholesterol. The SNP also maps ∼220 kb 3’ of the lactate dehydrogenase gene (LCT) a known major human population stratification locus (Campbell et al., 2005; Moskvina et al., 2010), raising the question of whether some phenotype associations near CXCR4 may reflect population stratification. Indeed the authors of the strongest association (melanoma, P < 6.8E − 7) showed rs2011946 allele frequencies varied strongly across their geographic samples and eliminated the variant from further study (Bishop et al., 2009). These results indicate that caution may be needed in asserting pleoitropic hypotheses based on GWAS particularly when a large range of relatively uncorrelated phenotypes are observed for a given variant or locus.
3.5 Deep annotation indicates functional hypotheses
Authors of GWAS articles often rely on ‘in-house’ annotations, query tools such as SNAP (Johnson et al., 2008) and LocusZoom (Pruim et al., 2010) and genome browser visualization to interpret associations. They may be limited by available bioinformatics specialists, time to devote to annotation and space in publications to provide detailed descriptions, and are always limited by the historic information available at the time of their analysis. Thus, annotations are relatively non-standardized across studies (Johnson and O’Donnell, 2009). Standardizing and updating annotations to include new information sources may allow for new functional hypotheses and potentially important insights. We annotated GRASP with a variety of annotation sources including predicted functional impact of non-synonymous SNPs, UniProtKB functional domains and post-translational modifications and regulatory annotations in order to identify functional hypotheses for specific loci.
We subjectively selected several interesting annotations of GWAS variants in GRASP from among genome-wide significant findings and present their summary in Table 3. A locus on 11q13.3 has been consistently associated with increased risk for prostate cancer in GWAS and replication studies (Eeles et al., 2008, 2009; Gudmundsson et al., 2009; Kote-Jarai et al., 2008; Thomas et al., 2008). One of the strongest SNPs in common across these studies is rs10896450. Across all the previous studies this locus and associated variants were not annotated, were described as being in ‘a gene desert’, or 67 kb away from MYEOV. This variant was flagged in GRASP for its overlap with known CTCF sites in the ORegAnno database (Griffith et al., 2008) and for proximity to lincRNAs (Cabili et al., 2011). Visualization in UCSC Genome Browser shows the overlap in the ENCODE project with a strong CTCF signal as well as nearby conserved transcription factor binding sites (Fig. 6). Two lincRNA-coding regions appear nearby in head-to-head configuration, with the 5’-most lincRNAs (TCONS_00019682, TCONS_00019683) exhibiting relatively testes-specific gene expression. This evokes a new hypothesis whereby the prostate cancer risk increase may be mediated by cis-effects on one or more of the lincRNA isoforms in the region. Notably, the lincRNA data was not yet available at the time of the original publications, providing an example of how updated annotations such as those in GRASP may shed new light on prior findings.
Table 3.
Selected functional hypotheses from GRASP annotations
| Gene | SNP | Trait associations | Hypothesis |
|---|---|---|---|
| lincRNAsa | rs10896450 | ↑Prostate cancer (P < 7E − 10) | Overlaps CTCF and ENCODE features, lincRNAs with testes expression |
| PLPL3 | rs738409 | ↑Fatty liver disease (P < 2E − 64) | I148M, predicted damaging by two programs, known function to ↓ emulsified TGs, ↑ hepatic fat content |
| ↑Plasma ALT (P < 1E − 45) | |||
| ↑Soluble ICAM-1 (P < 6E − 10) | |||
| WRN1 | rs11574358 | ↑CVD prevalence (P < 1E − 20) | S1133A, possibly damaging by two programs, eliminates phosphoserine site |
| ↑Cancer prevalence (P < 1E − 11) | |||
| ↑Systolic BP (P < 1E − 19) | |||
| ↑Total cholesterol (P < 2E − 11) | |||
| CPNE1 | rs2425068 | ↓Plasma PROC levels (P < 1E − 9) | AA > AG creates new 3′ acceptor splice site, skips 413Q in RefSeq supported isoform, within VWFA domain |
| CRHR1-IT1 | rs393152 | ↑Progressive supranuclear palsy (P < 1E − 120) | SNP in A->I RNA-editing site in cerebellum, predicted Y132C change in primate-conserved amino acid. |
| ↑Parkinson’s disease (P < 2E − 16) | |||
aSNP is in TCONS_00019367 and ∼5.7-kb upstream of TCONS_00019682 and TCONS_00019683. The lowest GWAS P-value in GRASP per trait per SNP is given.
Fig. 6.
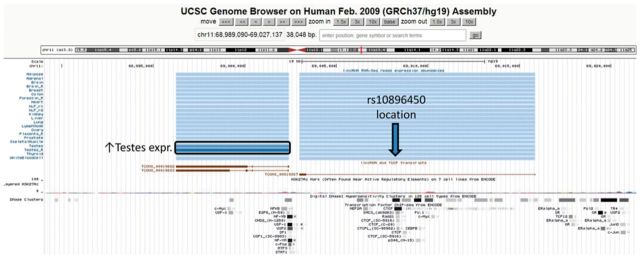
UCSC Genome Browser view of prostate cancer associated region at 11q13.3 and annotated lincRNAs and regulatory factors
Missense variants or other variants affecting protein sequence provide appealing hypotheses, though many such variants are neutral in their impact. Use of multiple prediction tools may improve annotation of putative functional variants. We included three nSNPs prediction annotations in GRASP: PolyPhen2, SIFT and LS-SNP, as well as annotations on splicing effects, and protein function annotations from UniProtKB mapped to SNP codons. Integrating these sources, we find interesting variants through multiple annotations. Three examples are shown in Table 3 for PLPL3, WRN1 and CPNE1. Missense variant rs738409 (PLPL3, I148M) is a good example of GWAS results that converge on a likely functional variant. This SNP is predicted damaging by two programs and known to affect protein function, as captured in UniProtKB annotations, by in vitro assays, decreasing emulsified triglycerides and increasing hepatic fat stores (He et al., 2010). The variant is associated in GWAS with non-alcoholic hepatic statuses, alanine aminotransferase activity and soluble ICAM-1 levels.
A variant in CPNE1, rs2425068 (A > G), was associated with plasma protein C levels, an important anticoagulant whose reduction associates with venous thromboembolism (Tang et al., 2010). While the original authors annotate this variant as synonymous, we find that it alters a consensus 3’ acceptor splice site from AA > AG. In doing so, it is predicted to skip amino acid 413Q amino acid within a VWFA domain of CPNE1, a genetically driven alternative splicing event that is supported by ESTs. However, stronger signals in the region lie within protein C-related genes (PROCR, EPCR.). Thus, whether rs2425068 and CPNE1 play a functional role in determining protein C level, or merely reflect linkage disequilibrium with other functional variants remains unknown.
The variant rs11574358 (WRN, S1133A) was identified in a scan for cardiovascular disease, cancer or premature death and pleiotropy among traits (Kulminski and Culminskaya, 2013). Notably, this gene is mutated in the autosomal recessive Werner syndrome, resulting in premature onset of age-related diseases including cancer and CVD, with death by middle age typically by myocardial infarction. The S1133 amino acid has been shown to be phosphorylated during early embryonic stem-cell differentiation (Rigbolt et al., 2011) as annotated in UniProtKB. The S1133A change would abolish the phosphoserine and potentially effect protein function.
The MAPT region at 17q21.31 has been associated with several neurological movement disorder, Parkinson’s disease (PD) (Do et al., 2011; Pankratz et al., 2009; Saad et al., 2011; Simon-Sanchez et al., 2009; Spencer et al., 2011) and progressive supranuclear palsy (PSP) (Hoglinger et al., 2011). The disease-association signals are also located in one of the largest, common polymorphic genomic inversion sites known in humans. Attempts to characterize the function of variants in the region have not arrived at a clear conclusion, with no known missense variants. MAPT is an obvious candidate in the region since it encodes the human tau protein. Studies of local eQTLs in different brain anatomical regions have yielded controversial results, possibly favoring control of specific MAPT isoform splicing (Hoglinger et al., 2011; Majounie et al., 2013; Trabzuni et al., 2012). Multiple, independent associations in the region have been suggested (Hoglinger et al., 2011; Spencer et al., 2011). Notably, one of the strongest variants in common to PD and PSP, rs393152, is located in the intron of CRHR1, a gene adjacent to MAPT which encodes a critical G-protein coupled receptor that binds corticotropin-releasing hormone neuropeptides and regulates a variety of neurohormonal processes.
Through annotation in GRASP we find rs393152 encodes a variant base in CRHR-IT1 (also known as C17orf69) that undergoes RNA editing in cerebellar tissue (Kiran et al., 2013). The cerebellum is a key brain region in the control of motor activity. The variant would induce a Y132C amino acid change in the predicted protein CRHR-IT1, which may be expressed in cerebellum based on the RNA-editing results. Notably, the cerebellar A-I editing, if truly valid, would also result in a Y132C change. Delta-BLASTp search shows significant matches to predicted proteins in five other species: Pongo abelii (96% identity), Pan troglodytes (95%), Pan paniscus (95%), Nomsascus leucogenys (84%), Macaca fascicularis (83%). Notably, the 132 position encodes a Cysteine in these other species, suggesting CRHR-IT1 may be a recent gene and the Tyrosine 132 amino acid a human-specific sequence. This raises the new hypothesis that CRHR-IT1 may contribute to PD or PSP pathology, possibly in addition to the role of MAPT, through either RNA editing or amino acid differences at position 132 of the predicted protein.
3.6 Increased coverage of GWAS studies over NHGRI catalog
Differences between GRASP and the NHGRI GWAS catalog are summarized in Table 4. There were 245 studies included in GRASP that were not found in the NHGRI catalog. One hundred twenty nine of these studies did not meet one or more of the NHGRI catalog for inclusion: mainly <100 000 SNPs tested (n = 58 studies), gene expression eQTL studies (n = 48), no SNP-specific results were reported (n = 11), paper was not indexed in PubMed (n = 9), methylation QTL studies (n = 2) and metabolomics QTL study (n = 1). The other 116 studies appear to meet inclusion criteria and are presumed not to have been identified for the NHGRI catalog due to differences in search and review strategies. Twenty-four studies were present in the NHGRI catalog but missing in GRASP. Of these 22 were excluded based on our criteria and two were not found presumably due to search and review strategies (Fellay et al., 2010; Karunas et al., 2011).
Table 4.
Key differences between NHLBI GRASP and the NHGRI GWAS catalog
| Feature | NHLBI GRASP | NHGRI GWAS catalog |
|---|---|---|
| Minimum number of markers for inclusion | 25 000 | 100 000 |
| Results P-value threshold | ≤0.05 | <1.00E − 5 |
| Number of studies (through December 31, 2011) | 1390 | 1167 |
| Maximum associations/paper | No maximum | 50 |
| eQTLs/methQTLs/metaboQTLs? | Yes | No |
| Precise location of results indexed? | Yes | No |
| Full scan results processed? | Yes | No |
| Track studies w/N = 0 reported results? | Yes | No |
| Effect allele/effect included? | No/Yesa | Yesb/Yesa |
| CNV only studies included? | No | Yes |
| Multi-marker studies (e.g. G–G, haplotype) without main effects? | No | Yes |
| G–E studies without main effects? | No | Yes |
| Annotations included: | Gene | Gene |
| SNP function (dbSNP) | SNP function (dbSNP) | |
| Global MAF (dbSNP) | Reported Risk MAF | |
| 13 more annotationsc |
aEffects included where available. Effects are not publicly available in GRASP due to potential privacy concerns.
bWhere specified, unknown in some cases.
cAdditional annotations included: SNP validation (dbSNP), Clinical SNP? (dbSNP), miRNA (miRBase), miRNA-binding sites (PolymiRTS), lincRNA, ORegAnno features, UCSC Conserved TFBS, Vista human enhancers, RNA-editing sites (DARNED), PolyPhen2 predictions, SIFT predictions, LS-SNP predictions, UniProt features
3.7 Increased coverage of GWAS results over NHGRI catalog
GRASP contained 76-, 78- and 851-fold greater numbers of results than the NHGRI catalog at the respective thresholds of P ≤ 5E − 8, P < 1E − 5 and P ≤ 0.05. This enrichment of results persisted but was attenuated substantially when eQTL, methylation QTL and metabolomics QTL studies were removed (13-, 14- and 753-fold at P ≤ 5E − 8, P < 1E − 5 and P ≤ 0.05, respectively), and after further removal of the MHC class-II region on chr 6p21.3 (11-, 12- and 770-fold at P ≤ 5E − 8, P < 1E − 5 and P ≤ 0.05, respectively). The results indicate an enrichment of results in GRASP over the NHGRI catalog across the spectrum of significance levels.
3.8 Conclusions and future directions
Access to prior GWAS results is an important tool to modern genetic and molecular biology researchers and may facilitate many avenues of research. Estimates based on prior GWAS and models of increased future marker coverage indicate the GWAS approach is likely to continue to yield a large harvest of new insights (Lindquist et al., 2013). A number of GWAS results catalogs and database exist and each has unique design features which make the breadth of resources collectively more valuable. Beyond generating new research hypotheses, we find these GWAS resources (e.g. GRASP, NHGRI GWAS catalog, GWAS3D, DistiLD, Ricopili) can be useful to establish the novelty of results, identify potential collaborators with similar phenotype and genotype data, quickly find citations in a particular phenotype domain, or identify phenotype areas of opportunity that have not been adequately studied in GWAS. Updating GRASP is labor-intensive, necessitating a lag behind updates to other resources such as the NHGRI GWAS catalog. Work on updates to GRASP is ongoing with future releases and additional annotation planned, including addition of sequencing-based GWAS. In the next version of GRASP we welcome researchers to submit their published or unpublished summary GWAS statistics for annotation, archiving and eventual posting at http://apps.nhlbi.nih.gov/grasp.
ACKNOWLEDGEMENTS
We thank Mina Youssef from NHLBI and Masato Kimura, Ming Xu and Michael Feolo from NCBI for help in creating and maintaining the web server.
Funding: National Heart, Lung and Blood Institute intramural funds to R.L., C.J.O. and A.D.J.
Conflict of Interest: none declared.
REFERENCES
- Abd El-Aziz MM, et al. EYS, encoding an ortholog of Drosophila spacemaker, is mutated in autosomal recessive retinitis pigmentosa. Nat. Genet. 2008;40:1285–1287. doi: 10.1038/ng.241. [DOI] [PMC free article] [PubMed] [Google Scholar]
- Abnet CC, et al. A shared susceptibility locus in PLCE1 at 10q23 for gastric adenocarcinoma and esophageal squamous cell carcinoma. Nat. Genet. 2010;42:764–767. doi: 10.1038/ng.649. [DOI] [PMC free article] [PubMed] [Google Scholar]
- Ayub Q, et al. FOXP2 targets show evidence of positive selection in European populations. Am. J. Hum. Genet. 2013;92:696–706. doi: 10.1016/j.ajhg.2013.03.019. [DOI] [PMC free article] [PubMed] [Google Scholar]
- Bishop DT, et al. Genome-wide association study identifies three loci associated with melanoma risk. Nat. Genet. 2009;41:920–925. doi: 10.1038/ng.411. [DOI] [PMC free article] [PubMed] [Google Scholar]
- Broer L, et al. Distinguishing true from false positives in genomic studies: p values. Eur. J. Epidemiol. 2013;28:131–138. doi: 10.1007/s10654-012-9755-x. [DOI] [PubMed] [Google Scholar]
- Cabili MN, et al. Integrative annotation of human large intergenic noncoding RNAs reveals global properties and specific subclasses. Genes Dev. 2011;25:1915–1927. doi: 10.1101/gad.17446611. [DOI] [PMC free article] [PubMed] [Google Scholar]
- Campbell CD, et al. Demonstrating stratification in a European American population. Nat. Genet. 2005;37:868–872. doi: 10.1038/ng1607. [DOI] [PubMed] [Google Scholar]
- Davis LK, et al. Rare inherited A2BP1 deletion in a proband with autism and developmental hemiparesis. Am. J. Med. Genet. A. 2012;158A:1654–1661. doi: 10.1002/ajmg.a.35396. [DOI] [PMC free article] [PubMed] [Google Scholar]
- Do CB, et al. Web-based genome-wide association study identifies two novel loci and a substantial genetic component for Parkinson's disease. PLoS. Genet. 2011;7:e1002141. doi: 10.1371/journal.pgen.1002141. [DOI] [PMC free article] [PubMed] [Google Scholar]
- Eeles RA, et al. Identification of seven new prostate cancer susceptibility loci through a genome-wide association study. Nat. Genet. 2009;41:1116–1121. doi: 10.1038/ng.450. [DOI] [PMC free article] [PubMed] [Google Scholar]
- Eeles RA, et al. Multiple newly identified loci associated with prostate cancer susceptibility. Nat. Genet. 2008;40:316–321. doi: 10.1038/ng.90. [DOI] [PubMed] [Google Scholar]
- Evans DM, et al. Mining the human phenome using allelic scores that index biological intermediates. PLoS. Genet. 2013;9:e1003919. doi: 10.1371/journal.pgen.1003919. [DOI] [PMC free article] [PubMed] [Google Scholar]
- Fellay J, et al. ITPA gene variants protect against anaemia in patients treated for chronic hepatitis C. Nature. 2010;464:405–408. doi: 10.1038/nature08825. [DOI] [PubMed] [Google Scholar]
- Fogel BL, et al. RBFOX1 regulates both splicing and transcriptional networks in human neuronal development. Hum. Mol. Genet. 2012;21:4171–4186. doi: 10.1093/hmg/dds240. [DOI] [PMC free article] [PubMed] [Google Scholar]
- Griffith OL, et al. ORegAnno: an open-access community-driven resource for regulatory annotation. Nucleic Acids Res. 2008;36:D107–D113. doi: 10.1093/nar/gkm967. [DOI] [PMC free article] [PubMed] [Google Scholar]
- Gudmundsson J, et al. Genome-wide association and replication studies identify four variants associated with prostate cancer susceptibility. Nat. Genet. 2009;41:1122–1126. doi: 10.1038/ng.448. [DOI] [PMC free article] [PubMed] [Google Scholar]
- He S, et al. A sequence variation (I148M) in PNPLA3 associated with nonalcoholic fatty liver disease disrupts triglyceride hydrolysis. J. Biol. Chem. 2010;285:6706–6715. doi: 10.1074/jbc.M109.064501. [DOI] [PMC free article] [PubMed] [Google Scholar]
- Hertel JK, et al. Evaluation of four novel genetic variants affecting hemoglobin A1c levels in a population-based type 2 diabetes cohort (the HUNT2 study) BMC. Med. Genet. 2011;12:20. doi: 10.1186/1471-2350-12-20. [DOI] [PMC free article] [PubMed] [Google Scholar]
- Hindorff LA, et al. Potential etiologic and functional implications of genome-wide association loci for human diseases and traits. Proc. Natl Acad. Sci. USA. 2009;106:9362–9367. doi: 10.1073/pnas.0903103106. [DOI] [PMC free article] [PubMed] [Google Scholar]
- Hoglinger GU, et al. Identification of common variants influencing risk of the tauopathy progressive supranuclear palsy. Nat. Genet. 2011;43:699–705. doi: 10.1038/ng.859. [DOI] [PMC free article] [PubMed] [Google Scholar]
- Hong CB, et al. KAREBrowser: SNP database of Korea Association REsource Project. BMB. Rep. 2012;45:47–50. doi: 10.5483/bmbrep.2012.45.1.47. [DOI] [PubMed] [Google Scholar]
- Hu J, et al. From the Cover: Neutralization of terminal differentiation in gliomagenesis. Proc. Natl Acad. Sci. USA. 2013;110:14520–14527. doi: 10.1073/pnas.1308610110. [DOI] [PMC free article] [PubMed] [Google Scholar]
- Huang J, et al. PRIMe: a method for characterization and evaluation of pleiotropic regions from multiple genome-wide association studies. Bioinformatics. 2011;27:1201–1206. doi: 10.1093/bioinformatics/btr116. [DOI] [PMC free article] [PubMed] [Google Scholar]
- Jacobs LC, et al. Comprehensive candidate gene study highlights UGT1A and BNC2 as new genes determining continuous skin color variation in Europeans. Hum. Genet. 2013;132:147–158. doi: 10.1007/s00439-012-1232-9. [DOI] [PubMed] [Google Scholar]
- Johnson AD, et al. SNAP: a web-based tool for identification and annotation of proxy SNPs using HapMap. Bioinformatics. 2008;24:2938–2939. doi: 10.1093/bioinformatics/btn564. [DOI] [PMC free article] [PubMed] [Google Scholar]
- Johnson AD, O’Donnell CJ. An open access database of genome-wide association results. BMC. Med. Genet. 2009;10:6. doi: 10.1186/1471-2350-10-6. [DOI] [PMC free article] [PubMed] [Google Scholar]
- Karunas AS, et al. Genome-wide association study of bronchial asthma in the Volga-Ural region of Russia. Mol. Biol. (Mosk) 2011;45:992–1003. [PubMed] [Google Scholar]
- Kiran AM, et al. Darned in 2013: inclusion of model organisms and linking with Wikipedia. Nucleic Acids Res. 2013;41:D258–D261. doi: 10.1093/nar/gks961. [DOI] [PMC free article] [PubMed] [Google Scholar]
- Kohannim O, et al. Discovery and replication of gene influences on brain structure using LASSO regression. Front Neurosci. 2012;6:115. doi: 10.3389/fnins.2012.00115. [DOI] [PMC free article] [PubMed] [Google Scholar]
- Kote-Jarai Z, et al. Multiple novel prostate cancer predisposition loci confirmed by an international study: the PRACTICAL Consortium. Cancer Epidemiol. Biomarkers Prev. 2008;17:2052–2061. doi: 10.1158/1055-9965.EPI-08-0317. [DOI] [PMC free article] [PubMed] [Google Scholar]
- Kulminski AM, Culminskaya I. Genomics of human health and aging. Age (Dordr.) 2013;35:455–469. doi: 10.1007/s11357-011-9362-x. [DOI] [PMC free article] [PubMed] [Google Scholar]
- Lal D, et al. RBFOX1 and RBFOX3 mutations in rolandic epilepsy. PLoS. One. 2013a;8:e73323. doi: 10.1371/journal.pone.0073323. [DOI] [PMC free article] [PubMed] [Google Scholar]
- Lal D, et al. Rare exonic deletions of the RBFOX1 gene increase risk of idiopathic generalized epilepsy. Epilepsia. 2013b;54:265–271. doi: 10.1111/epi.12084. [DOI] [PubMed] [Google Scholar]
- Lang MR, et al. Basonuclin-2 requirements for zebrafish adult pigment pattern development and female fertility. PLoS Genet. 2009;5:e1000744. doi: 10.1371/journal.pgen.1000744. [DOI] [PMC free article] [PubMed] [Google Scholar]
- Li MJ, et al. GWAS3D: Detecting human regulatory variants by integrative analysis of genome-wide associations, chromosome interactions and histone modifications. Nucleic Acids Res. 2013;41:W150–W158. doi: 10.1093/nar/gkt456. [DOI] [PMC free article] [PubMed] [Google Scholar]
- Lindquist KJ, et al. The impact of improved microarray coverage and larger sample sizes on future genome-wide association studies. Genet. Epidemiol. 2013;37:383–392. doi: 10.1002/gepi.21724. [DOI] [PMC free article] [PubMed] [Google Scholar]
- Majounie E, et al. Variation in tau isoform expression in different brain regions and disease states. Neurobiol. Aging. 2013;34:1922. doi: 10.1016/j.neurobiolaging.2013.01.017. [DOI] [PMC free article] [PubMed] [Google Scholar]
- Meyer TE, et al. Genome-wide association studies of serum magnesium, potassium, and sodium concentrations identify six Loci influencing serum magnesium levels. PLoS. Genet. 2010;6:e1001045. doi: 10.1371/journal.pgen.1001045. [DOI] [PMC free article] [PubMed] [Google Scholar]
- Moskvina V, et al. Genetic differences between five european populations. Hum. Hered. 2010;70:141–149. doi: 10.1159/000313854. [DOI] [PMC free article] [PubMed] [Google Scholar]
- Need AC, Goldstein DB. Next generation disparities in human genomics: concerns and remedies. Trends Genet. 2009;25:489–494. doi: 10.1016/j.tig.2009.09.012. [DOI] [PubMed] [Google Scholar]
- Palleja A, et al. DistiLD Database: diseases and traits in linkage disequilibrium blocks. Nucleic Acids Res. 2012;40:D1036–D1040. doi: 10.1093/nar/gkr899. [DOI] [PMC free article] [PubMed] [Google Scholar]
- Pankratz N, et al. Genomewide association study for susceptibility genes contributing to familial Parkinson disease. Hum. Genet. 2009;124:593–605. doi: 10.1007/s00439-008-0582-9. [DOI] [PMC free article] [PubMed] [Google Scholar]
- Pruim RJ, et al. LocusZoom: regional visualization of genome-wide association scan results. Bioinformatics. 2010;26:2336–2337. doi: 10.1093/bioinformatics/btq419. [DOI] [PMC free article] [PubMed] [Google Scholar]
- Rigbolt KT, et al. System-wide temporal characterization of the proteome and phosphoproteome of human embryonic stem cell differentiation. Sci. Signal. 2011;4:rs3. doi: 10.1126/scisignal.2001570. [DOI] [PubMed] [Google Scholar]
- Saad M, et al. Genome-wide association study confirms BST1 and suggests a locus on 12q24 as the risk loci for Parkinson's disease in the European population. Hum. Mol. Genet. 2011;20:615–627. doi: 10.1093/hmg/ddq497. [DOI] [PubMed] [Google Scholar]
- Saeki N, et al. A functional single nucleotide polymorphism in mucin 1, at chromosome 1q22, determines susceptibility to diffuse-type gastric cancer. Gastroenterology. 2011;140:892–902. doi: 10.1053/j.gastro.2010.10.058. [DOI] [PubMed] [Google Scholar]
- Shi Y, et al. A genome-wide association study identifies new susceptibility loci for non-cardia gastric cancer at 3q13.31 and 5p13.1. Nat. Genet. 2011;43:1215–1218. doi: 10.1038/ng.978. [DOI] [PubMed] [Google Scholar]
- Simon-Sanchez J, et al. Genome-wide association study reveals genetic risk underlying Parkinson's disease. Nat. Genet. 2009;41:1308–1312. doi: 10.1038/ng.487. [DOI] [PMC free article] [PubMed] [Google Scholar]
- Sivakumaran S, et al. Abundant pleiotropy in human complex diseases and traits. Am. J. Hum. Genet. 2011;89:607–618. doi: 10.1016/j.ajhg.2011.10.004. [DOI] [PMC free article] [PubMed] [Google Scholar]
- Smyth IM, et al. Genomic anatomy of the Tyrp1 (brown) deletion complex. Proc. Natl Acad. Sci. USA. 2006;103:3704–3709. doi: 10.1073/pnas.0600199103. [DOI] [PMC free article] [PubMed] [Google Scholar]
- Spencer CC, et al. Dissection of the genetics of Parkinson’s disease identifies an additional association 5' of SNCA and multiple associated haplotypes at 17q21. Hum. Mol. Genet. 2011;20:345–353. doi: 10.1093/hmg/ddq469. [DOI] [PMC free article] [PubMed] [Google Scholar]
- Stambolian D, et al. Meta-analysis of genome-wide association studies in five cohorts reveals common variants in RBFOX1, a regulator of tissue-specific splicing, associated with refractive error. Hum. Mol. Genet. 2013;22:2754–2764. doi: 10.1093/hmg/ddt116. [DOI] [PMC free article] [PubMed] [Google Scholar]
- Sun S, et al. Mechanisms of activation and repression by the alternative splicing factors RBFOX1/2. RNA. 2012;18:274–283. doi: 10.1261/rna.030486.111. [DOI] [PMC free article] [PubMed] [Google Scholar]
- Tang W, et al. Genome-wide association study identifies novel loci for plasma levels of protein C: the ARIC study. Blood. 2010;116:5032–5036. doi: 10.1182/blood-2010-05-283739. [DOI] [PMC free article] [PubMed] [Google Scholar]
- Thomas G, et al. Multiple loci identified in a genome-wide association study of prostate cancer. Nat. Genet. 2008;40:310–315. doi: 10.1038/ng.91. [DOI] [PubMed] [Google Scholar]
- Thorisson GA, et al. HGVbaseG2P: a central genetic association database. Nucleic Acids Res. 2009;37:D797–D802. doi: 10.1093/nar/gkn748. [DOI] [PMC free article] [PubMed] [Google Scholar]
- Trabzuni D, et al. MAPT expression and splicing is differentially regulated by brain region: relation to genotype and implication for tauopathies. Hum. Mol. Genet. 2012;21:4094–4103. doi: 10.1093/hmg/dds238. [DOI] [PMC free article] [PubMed] [Google Scholar]
- Yan T, et al. Genetic association with multiple traits in the presence of population stratification. Genet. Epidemiol. 2013;37:571–580. doi: 10.1002/gepi.21738. [DOI] [PubMed] [Google Scholar]