

Introduction
Cardiac magnetic resonance imaging (CMR) has emerged as a mature imaging modality and is considered the gold standard for quantification of myocardial mass, volumes and function.(1) Myocardial tagging and phase-contrast velocity imaging have been in use for over 20 years providing quantification of myocardial function and flow. While CMR has been used for tissue characterization for many years, it is only with recent improvements in MRI scanner technology and parallel imaging reconstruction techniques that parametric mapping of perfusion or magnetic relaxation properties (T1, T2, and T2*) has become clinically feasible within a single breath-hold. To generate a parametric map of perfusion or relaxation times, multiple images of the same region of the myocardium are acquired with different sensitivity to the parameter of interest, and the signal intensities of these images are fit to a model which describes the underlying physiology or relaxation parameters. The parametric map is an image of the fitted perfusion parameters or relaxation times. Parametric mapping techniques are extending the range of unique tissue parameters that can be measured by CMR. Quantitative perfusion imaging techniques measure myocardial perfusion and perfusion reserve (MPR), demonstrating improved abilities to assess the extent of myocardial ischemia in multi-vessel disease.(2) Pre and post-contrast T1 mapping techniques can quantify diffuse myocardial fibrosis in hypertrophic and infiltrative cardiomyopathies.(3–5) T2 mapping techniques are improving quantification of myocardial edema.(6,7) Imaging of the T2* relaxation time which is sensitive to magnetic field inhomogeneity has become clinically useful in evaluation of myocardial iron overload and assessment of chelation therapy.(8,9) This article will review the current imaging techniques, emerging applications, as well as the future potential and limitations of CMR for parametric mapping of the myocardium. It will specifically focus of assessment of myocardial perfusion, and magnetic relaxation times (T1, T2, T2*).
Quantification of Myocardial Perfusion
Most clinical perfusion imaging techniques only assess relative differences in myocardial perfusion. The SPECT literature has established that measuring relative perfusion results in reduced sensitivity for the detection of left-main and three vessel coronary artery disease (CAD) as there may be no reference area with normal perfusion.(10,11) Furthermore, there is growing interest in the ability to assess microvascular dysfunction in women and patients with diabetes or chest pain and non-obstructive CAD.(12) PET is considered the current gold standard technique for quantitative perfusion imaging. Studies have shown that quantification of myocardial PET studies improves diagnostic accuracy and provides a useful adjunct to assessment of regional perfusion abnormalities. Abnormal MPR by PET in the absence of obstructive CAD is associated with adverse cardiovascular outcomes.(13) PET has a few disadvantages including high cost, limited ability to obtain tracers, poor spatial resolution, and exposure of patients to ionizing radiation.(14) CMR has demonstrated potential for clinical quantitative perfusion imaging and would overcome some of the aforementioned limitations of PET for this application.(15)
CMR Techniques for Quantitative Perfusion Analysis
In order to perform absolute quantification of myocardial blood flow, a quantifiable relationship must exist between the signal intensity changes in the image and underlying blood flow. First pass myocardial perfusion techniques utilize gadolinium (Gd) chelates that shorten the T1 relaxation time of water (recovery of longitudinal magnetization) in proportion to the concentration of Gd using saturation-recovery (SR) pulse sequences to impart strong T1-weighted (W) image contrast. In regions with normal blood flow there is an increased concentration of Gd resulting in a bright signal in the perfusion image, whereas in regions of reduced perfusion there are lower concentrations of gadolinium resulting in a lower signal intensity. Typically 3–5 slice positions are imaged in a sequential fashion during each heart-beat over the 30–60 seconds of the first-pass of the contrast agent. Multiple pulse sequences have been used for perfusion imaging and each have their advantages and disadvantages.(14) Parallel imaging with acceleration factors of 2–3 are routinely used (16) and multiple highly accelerated techniques have been evaluated in clinical studies. (17) More recent techniques which exploit the spatial-temporal correlations in the series of first-pass perfusion imaging using techniques such as kt-SENSE are enabling true 3D coverage of the ventricle with high spatial resolution.(18) Compressed-sensing techniques, which rely on the compressibility of image data, or image sparsity, hold potential for even more acceleration of perfusion image acquisition.(19) While any of these techniques can be used for quantification of myocardial perfusion, care must be taken to make sure that the techniques used do not disrupt the temporal evolution of the signal intensities.
In order to quantify myocardial perfusion, two essential components must be measured accurately: (1) the arterial input function (AIF) which quantifies the concentration of Gd delivered from the left ventricle and aorta as a function of time and (2) the tissue function (TF) which is related to the accumulation of contrast agent within the myocardium. Quantification of the AIF requires special attention as the high concentration of Gd in the blood pool results in significant signal saturation resulting in improper determination of the AIF. This problem can be overcome using several different strategies. One approach is using a lower dose of contrast agent; however, this results in images with lower signal-to-noise ratio (SNR). Another is the “dual bolus” or “pre-bolus” technique where a low dose of Gd is used for quantification of the AIF and a second higher dose of contrast is used to determine the TF.(20) This technique accurately quantifies both the AIF and TF, but it requires 2 boluses with different contrast concentrations which may be impractical. A third approach involves utilization of a “dual sequence” approach which uses a single high dose of contrast.(21) A low-resolution, low T1 sensitivity acquisition is performed in each heart beat to quantify the AIF, while the standard pulse sequence is used to quantify the TF.
Once an accurate AIF and TF have been obtained, there are two main techniques to quantify perfusion, multi-compartment kinetic modeling and Fermi-function deconvolution. With compartmental modeling, the forward flux of Gd from the blood to the myocardium (Ktrans) is taken to represent absolute myocardial blood flow.(22) An important factor which is usually neglected, is that the extraction of Gd, which is flow-dependent is required to convert Ktrans into a measurement of absolute perfusion. Also, the fact that Gd accumulates in the extravascular space is also not frequently accounted for by this analysis. With Fermi-function deconvolution the central volume principle is used to describe the amount of Gd present within a region of myocardium.(23) An empirical Fermi-function is used for deconvolution and the initial amplitude of the Fermi-function fit is proportional to myocardial perfusion. Figure 1 demonstrates the quantification of perfusion using Fermi-function deconvolution of data acquired with a dual-bolus sequence. This technique is relatively robust to the effects of extracellular accumulation of the contrast agent at least during first pass of the contrast.(24) Multiple other “model-independent techniques” have been used for deconvolution, and recently there have been studies comparing the relative merits of the different techniques.(25) Both of the techniques described above have been shown to correlate with myocardial perfusion over a wide range of flow.
Figure 1. Absolute Quantification of Perfusion using Fermi-function deconvolution from a dual-sequence spiral trajectory acquisition.

(a) The myocardium is segmented to generate time intensity curves for the myocardial tissue function (TF). (b) The signal intensity is converted into concentration of gadolinium for both the arterial input function (AIF) and tissue function prior to deconvolution. (c) a pixel-by-pixel perfusion map shows uniform perfusion of 1mL/g-min in this normal volunteer.
Arterial spin labeling (ASL) is an alternative technique for quantitative perfusion which uses the water in blood as an endogenous contrast agent. The main limitation of ASL is poor SNR due to the small difference between the “labeled” and non-labeled acquisitions. This technique has been used to detect obstructive CAD; however there are still some technical hurdles for the technique to have widespread clinical applicability.(26) ASL may have utility in quantifying perfusion in more diffuse processes such as microvascular dysfunction which may not require high spatial resolution.
Clinical Quantitative Perfusion Imaging
Multiple studies have validated CMR perfusion imaging in experimental animal models with microspheres as the gold standard. CMR has also been validated in human subjects by direct comparison to PET and invasive measures of coronary flow reserve (CFR) and fractional flow reserve (FFR). A study of 19 healthy volunteers demonstrated strong correlation of both absolute perfusion (R=0.86) and MPR (R=0.96) between quantitative CMR using kinetic modeling and 13N-amonia PET. However there was an underestimate of peak perfusion by CMR as compared to PET.(27)
Quantitative MPR was compared to CFR as assessed by coronary flow wire in a study of 20 patients with suspected CAD. This study demonstrated a strong correlation between CMR and CFR (R=0.86) and a sensitivity of 88% and a specificity of 90% for predicting a CFR <2.(28) Quantitative CMR was also prospectively compared to FFR in 37 patients with suspected CAD who underwent FFR and coronary angiography.(29) The study showed a reduced MPR of 1.54 for segments with FFR<0.75 and an MPR of 2.11 for segments with FFR>0.75. A cutoff of 2.04 for MPR was highly sensitive (92.9%), but not specific (56.7%) for predicting an FFR<0.75. Our group studied 41 subjects with known or suspected CAD using quantitative MPR by CMR as compared to x-ray angiography for detection of CAD and delineation of the extent of ischemic myocardium (figure 2).(2) While qualitative and quantitative analysis had similar diagnostic accuracy (83% versus 80%) for detecting significant CAD, MPR detected a significantly higher burden of ischemia in three vessel disease as compared to single vessel disease (60% vs 25% p=0.02). For visual analysis, there was no difference in the extent of detected ischemia between three vessel and single vessel disease (31% vs 21% p=0.26). A recent study has directly compared the performance of quantitative CMR at 1.5T and 3T field strengths to detect an FFR<0.8 in 34 patients with known or suspected CAD. This study demonstrated a higher ROC area under the curve, (0.963 vs. 0.645, p < 0.001), sensitivity (90.5 vs. 61.9 %) and specificity (100 vs. 76.9 %) at 3T vs. 1.5T.(30)
Figure 2. Quantitative Perfusion may be useful in determining extent of ischemia in multi-vessel disease.
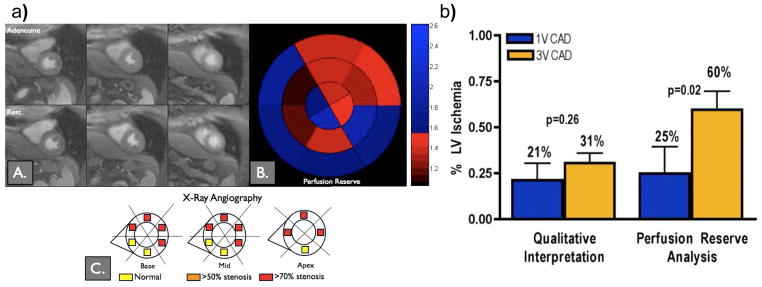
(a) Visual analysis of the stress images does not show a significant perfusion abnormality, however quantification shows a region of reduced perfusion reserve corresponding to an abnormality found in the LAD at cardiac catheterization. (b) Although visual and quantitative analysis had similar diagnostic accuracy, quantitative analysis revealed a larger area of ischemia in 3 vessel disease as compared to single vessel disease and may be important for quantifying the volume of ischemic myocardium. (Adapted from Patel et al. figures 4 and 5(2))
Current limitations and Future Potential
Several factors have hampered the widespread clinical application of quantitative perfusion CMR. One is the limited spatial coverage (typically 3–4 slices) as compared to PET. However new imaging pulse sequences using spatio-temporal parallel techniques have demonstrated the potential for rapid high resolution and 3D coverage of the myocardium.(18) Furthermore spiral or radial techniques hold promise for further acceleration of image acquisition.(31,32) Increased field strength from 1.5T to 3T may also improve SNR and diagnostic performance. The lack of robust automated tools for image registration and quantification has limited the applicability of quantitative analysis to research settings. However, non-rigid registration techniques have recently been applied to perform point-by-point quantification (Figure 3).(33) The final barrier is to demonstrate that perfusion quantification has additional benefit over visual analysis or semi-quantitative techniques. One of the justifications for absolute quantification has been improved detection of 3 vessel disease; however, the improved spatial resolution of CMR may provide sufficient gradient of perfusion to enable adequate visual analysis. Multiple studies have demonstrated a high diagnostic accuracy of CMR stress imaging without the complex data analysis required for quantification, and the incremental benefit of absolute quantification still needs to be established in larger clinical studies.(34)
Figure 3. Pixel-wise CMR perfusion maps at stress and rest from a healthy volunteer (1) and from 3 patients with coronary artery disease.

High quality pixel-wise maps are feasible using non-rigid registration for motion correction. (Adapted from Hsu et. al. figure 7 (33))
Quantification of Myocardial T2* Relaxation Times
Quantification of T2* relaxation times is arguably the most clinically established quantitative CMR tissue characterization technique as it has revolutionized the detection and monitoring of iron-overload cardiomyopathy. T2* is the transverse relaxation time in the presence of static magnetic field inhomogeneities. T2* mapping techniques enable detection of spatially varying differences in T2*relaxation times and can be used to detect the presence of hemorrhage in acute myocardial infarction (MI). T2* mapping techniques also can detect changes in myocardial oxygenation based on the blood oxygen dependent (BOLD) effect which results from the difference in magnetic state between oxyhemoglobin (diamagnetic) and deoxyhemoglobin (paramagnetic) as deoxyhemoglobin reduces the T2* of blood.
CMR techniques for Quantifying Myocardial T2*
To create a myocardial T2* map, multiple images with different sensitivity to T2* must be acquired. This is typically achieved by collecting gradient echo images with different echo times (TE) yielding images with signal intensities which follow a T2* relaxation curve. The most commonly used pulse sequence for data acquisition is a multi-echo segmented gradient echo technique which typically collects data at 8 different echo times ranging from 2ms to 20ms (Figure 4).(35) Image data is acquired directly after the R-wave which further reduces artifacts from blood flow and myocardial motion. T2* measurements have primarily been measured in the intraventricular septum as this area is typically free from magnetic susceptibility artifacts which corrupt the long TE images, particularly in the lateral wall.
Figure 4. Calculation of T2* maps in a normal subject.

(a) A set of gradient echo images acquired with different echo times (TE) from 2ms to 18 ms are acquired. As the TE is increased the signal intensity decreases due to static field inhomogeneities resulting in T2* decay. (b) The data from each pixel is fit to a T2* decay curve. Pixels with longer T2* decay more slowly (red curve) as compared to regions with shorter T2* blue curve). (c) the T2* map shows a region of reduced T2* in the inferolateral wall which is caused by susceptibility artifact and can be seen even in normal subjects.
Clinical Application of T2* mapping techniques
The T2* relaxation time is shortened by magnetic field inhomogeneities induced by myocardial iron deposition. A reduction of T2* to less than 20 ms is consistent with the diagnosis of iron overload cardiomyopathy.(8) The presence of abnormal T2* is the most important predictor of future requirement for chelation therapy. Changes in the myocardial T2* has been used as a surrogate endpoint of several clinical trials of chelation therapy in transfusion dependent thalassaemia major patients.(9) Quantitative T2* mapping has been applied to the detection of myocardial hemorrhage in acute MI. In a study of 62 patients with acute reperfused MI, 62% of subjects had evidence of microvascular obstruction seen on late gadolinium enhanced (LGE) imaging, however only 20% of patient had hemorrhage as indicated by T2*<30 ms.(36) T2* mapping has been used to probe the BOLD effect in ischemic heart disease. An early study of T2* mapping in 16 healthy volunteers and 16 patients with known single vessel CAD demonstrated that volunteers had a T2* of 35ms at rest which increased to 40ms with dipyridamole infusion due to the reduction in deoxygenated hemoglobin during hyperemia. In subjects with single vessel CAD, there were regional reductions in T2* at rest in the regions supplied by stenotic arteries, and these differences increased significantly during dipyridamole.(37) In another study, 46 patients with known or suspected CAD underwent BOLD T2* mapping at rest and during adenosine stress at 3T. BOLD CMR at rest demonstrated significantly lower T2* values for ischemic segments (26.7± 11.6 ms) as compared to normal (31.9± 11.9 ms) segments. A stress T2* less than 33.8 had 78% sensitivity and 68% specificity on a per patient basis to detect significant CAD.(38)
Potential Clinical Pitfalls and Solutions
Care must be taken when interpreting regional differences in T2* from maps as the T2* can be abnormally short in certain regions of the heart even in normal subjects due to macroscopic magnetic field inhomogeneity. This is particularly problematic in the inferolateral wall. For assessment of iron overload which diffusely affects the myocardium, measurement of the T2* time in the intraventricular septum is preferred.
Quantification of Myocardial T2 Relaxation Times
It has been long recognized that T2 relaxation times are sensitive to myocardial edema and are known to be elevated in acute MI(39), myocarditis(40), sarcoidosis(41) and in cardiac allograft rejection(42). T2 is the relaxation time for transverse magnetization and is prolonged in regions of edema or inflammation. The current standard T2-weighted dark-blood turbo spin echo sequences (DB-TSE) have significant limitations, particularly for semi-quantitative evaluation. Factors such as incomplete blood suppression with dark-blood techniques, regional variations in signal intensity from coil inhomogeneities, and signal loss from myocardial contraction and relaxation during acquisition are significant challenges for this technique in clinical practice. In addition, as T2-weighted images are inherently non-quantitative, semi-quantitative techniques have relied on defining abnormal T2 by a number of standard deviations of signal intensity over that of remote myocardium which can be problematic when there is no remote “normal” reference region. In the last few years, techniques capable of rapid measurement of the myocardial T2 relaxation time have emerged and may have important advantages over the prior semi-quantitative techniques.
CMR techniques for Quantifying T2 relaxation times
In order to quantify myocardial T2 relaxation times, multiple images with different sensitivity to T2 need to be acquired. This is typically achieved by collecting spin-echo images with different echo times yielding images with signal intensities that follow a T2 decay curve (figure 5). For cardiac T2 mapping applications two different types of sequences have been employed: (1) Dark-blood turbo-spin echo based pulse sequences (DB-TSE) and (2) Bright-Blood T2 magnetization-preparation (T2-Prep) based pulse sequences. Both free-breathing navigator-gated acquisition and breath-hold strategies have been utilized.
Figure 5. Calculation of T2 maps using a T2-PREP pulse sequence in a patient with atypical Takusubo cardiomyopathy.

(a) Multiple images with T2-Prepations with different TE are acquired. As the TE is increased for this spin-echo-based preparation, the myocardial signal intensity decreases due to T2 decay. (b) The data from each pixel is fit to a T2 decay curve, pixels with longer T2 (red curve) decay more slowly than regions with shorter T2 (blue curve). (c) The T2 map shows a region of edema (Yellow arrows and Red ROI) in this patient. (d) The absence of LGE confirms the diagnosis of atypical Takusubo cardiomyopathy.
TSE-based T2-mapping techniques collect images at multiple echo times providing multiple points along the T2 relaxation curve for data fitting. TSE pulse sequences are sensitive to ghosting artifacts due to blood flow and dark-blood preparation must be utilized with these strategies. Furthermore, these sequences have some inherent sensitivity to motion which needs to be accounted for to accurately quantify T2. The effects of coil inhomogeneity are eliminated during the T2 fitting procedure. The T2-prep pulse sequence consists of a spin-echo like-preparation module to impart the T2-weighted contrast and a readout scheme to rapidly collect the image data.(43) Typically a rapid steady-state free precession (SSFP) readout is used, which is less sensitive to some of the artifacts which limit TSE-based techniques. By acquiring multiple images, each with a different T2-prep duration, a T2 map can be determined (Figure 5). (44,45) These techniques demonstrate an approximately 10% overestimate of T2 relative to reference techniques, likely due to the SSFP readout which induces mixed T1 and T2 contrast.(44)
Clinical Application of T2 mapping Techniques
T2 mapping techniques have demonstrated utility for evaluation of a variety of cardiac pathologies. The edematous territory measured by T2-weighted imaging and T2 mapping has been shown to correlate with the region of ischemic injury in a canine model of MI.(46,47) This has stimulated considerable clinical interest in using T2-weighted imaging to assess myocardial salvage.(48) A T2-Prep SSFP based mapping technique was used to evaluate 27 patients with acute MI and 21 normal volunteers, demonstrating that the average T2 in edematous myocardium was 69ms compared to 56ms in remote (Figure 6) and 55 ms in normal volunteers. (6) Importantly, edema was detected in 26 of 27 patients with T2 mapping, whereas conventional STIR images were negative in 7 patients and uninterpretable in 2 cases.
Figure 6.

(a) T2 maps, T2-weighted and LGE images from patients with acute myocardial infarction. (b) The T2 relaxation time was significantly increased in the region of the infarct as compared to remote and healthy myocardium. (Adapted from Verhaert et. al. figures 1 and 2 (6))
In a study of 30 patients, T2 mapping techniques have also demonstrated increased T2 in the involved segments of myocardium in patients with acute inflammatory diseases including myocarditis and Takotsubo cardiomyopathy (Figure 7).(7) In both pathologies there was no difference in the T2 of the remote myocardium as compared to controls. A T2 cutoff of 59 ms had a sensitivity of 94% and specificity of 97% for identifying affected myocardium. Conventional T2-weighted images were uninterpretable in 7 subjects because of artifacts and did not demonstrate abnormalities in 2 subjects with abnormal T2 values by T2 mapping. Bright blood T2-prep SSFP images did not show a clear region of increased signal intensity in 13 of 30 subjects. This study demonstrates that T2 mapping may improve the ability to differentiate edematous myocardium over T2-weighted techniques.
Figure 7. T2 maps, T2-weighted and LGE images from 3 patients with acute myocarditis.

T2 is increased in multiple regions of the myocardium and may show more diffuse involvement than is evident on T2-weighted images. (Adapted from Thavendiranathan et. al. figure #(7))
T2 mapping has also been used for the assessment of iron-overload cardiomyopathy.(49) The superparamagnetic properties of iron result in a shortening of both T2 and T2* relaxation times resulting in more rapidly decaying transverse magnetization which can be detected by CMR. T2 mapping has two potential advantages over T2* mapping in that pulse sequences for determination of T2 are less sensitive to static magnetic field inhomogeneities and typically produce images of higher SNR. In a study of 136 patients with thalassaemia, a linear relationship has been demonstrated between T2 and T2* (R=0.89) in subjects with iron overload with similar diagnostic utility for detecting iron overload.(49)
Potential Clinical Pitfalls and Solutions
Care must be taken when comparing absolute T2 relaxation times between data acquired with different techniques as biases in the absolute numbers may occur between different sequences or patient-related factors. For the T2-Prep mapping sequence, in a tachycardiac patient, incomplete T1 relaxation between each image acquisition may introduce some bias to the measured T2-weighted images. This effect can be minimized by increasing the number of heart beats between images (i.e. from 3 to 4 relaxation beats to enable more time for T1 relaxation. TSE-based pulse sequences can also have some errors in accurate T2 determination by introducing some T1 dependence to the values. An additional problem is that current mapping sequences have limited spatial resolution as compared to T2-weighted images; however, this problem is likely to be overcome by improved pulse sequences and reconstruction techniques.
Quantification of T1 relaxation times and Volume of Distribution (Vd) of Gadolinium
LGE imaging has become the gold standard technique for imaging focal myocardial fibrosis in CAD and non-ischemic cardiomyopathies.(50,51) However cardiac pathologies characterized by diffuse myocardial fibrosis cannot be evaluated adequately by LGE as there are no reference regions of normal myocardium. Figure 8 shows LGE images and histology from MI and dilated cardiomyopathy. In MI, LGE images show focal enhancement corresponding to the dense focal fibrosis in the infarct, whereas in dilated cardiomyopathy LGE images may not show any enhancement despite the presence of significant interstitial fibrosis. T1 mapping techniques following Gd injection have demonstrated potential for evaluation of diffuse myocardial fibrosis and myocardial infiltration. However, the T1 of the myocardium is a function not only of the amount of fibrosis, but also of Gd dose, clearance rate, and time after injection. There has been growing interest in assessing the volume of distribution of Gd, or extracellular volume (ECV), as a noninvasive marker of fibrosis by performing T1 mapping before and after either a continuous infusion or bolus injection of Gd. The volume of distribution of Gd has also been used as a noninvasive marker of cardiac amyloidosis.(52) Non-contrast T1 mapping, also referred to as native-T1 mapping, has demonstrated potential for assessing myocardial edema in MI similar to work that has been done with T2 -weighted techniques.(47) Non-contrast T1 values are increased in hypertrophic and dilated cardiomyopathy reflecting fibrosis(53), and in cardiac amyloidosis reflecting the presence of infiltration by amyloid protein.(52,54,55) T1 mapping and Vd measurements may also have potential for better delineation of peri-infarct zones and for providing a more quantitative assessment of myocardial scarring.
Figure 8. Calculation of post contrast T1 maps using a modified MOLLI pulse sequence in a patient with myocarditis.

Following an inversion pulse, images are obtained in subsequent heart beats to obtain images at multiple different inversion times during the same phase of the cardiac cycle. As the inversion time increases the longitudinal magnetization increases due to T1 recovery. (b) The data are sorted by inversion time and fit to T1 relaxation curves. Pixels with inflammation have shorter T1-s post contrast and recover more rapidly (red curve) than regions of normal myocardium. (d) T1 mapping shows two epicardial regions with inflammation (yellow arrows and red ROI). (e) By inverting the pixel values an R1 map can be generated which has a contrast appearance similar to conventional LGE images.
CMR techniques for Quantifying T1 Relaxation Times
There have been a variety of techniques that have been used to quantify myocardial T1 values.(3–5,56–58). The simplest but least efficient method is to collect a single image with a given sensitivity to T1 on each of multiple separate breath-holds and fit the signal intensities to the T1 recovery curve as shown schematically in figure 9. This allows a T1 map to be determined during a specific phase of the cardiac cycle but is time consuming since it requires multiple breath-holds and may be subject to image misregistration between breath-holds. Two techniques are available which acquire all of the data for a T1 map in a single breath-hold. The traditional Look-Locker technique collects image data continuously to create images at different time points following a T1-weighted inversion preparation. A limitation of the traditional Look-Locker techniques is that the heart is in a different phase of the cardiac cycle on each image, precluding mapping of a specific slice as there may be significant through plane motion.(59) The Modified Look-Locker (MOLLI) pulse sequence is a modification to the Look-Locker sequence in which single-shot images are obtained in diastole with 11 different T1 sensitivities over 17 heart beats. The data from these diastolic source images are fit to the T1 recovery function to create a T1 map (figure 9). The MOLLI technique is reproducible, and produces source images with high signal-to-noise ratio.(60,61) A limitation of the standard MOLLI pulse sequence is the requirement of 17 heartbeats for data acquisition which may result in a breath-hold that is too long for some patients. Several modifications have been proposed to reduce the breath-hold duration needed to collect the data and to reduce the heart-rate dependence.(62,63) Furthermore, robust non-rigid registration has been introduced which minimizes the effect of motion between the images collected on different heartbeats.(64) The majority of recently published T1 mapping research has utilized one of the three techniques, or some variation thereof.
Figure 9. Diffuse fibrosis is not apparent on conventional LGE images. (a) LGE images from an ischemic cardiomyopathy demonstrate a focal region of LGE corresponding to prior myocardial infarction.

(b) This region of increased signal intensity corresponds to focal fibrosis in the infarct on H&E stained myocardium. (c) LGE images from a patient with dilated cardiomyopathy do not demonstrate any focal LGE, however (d) histological evaluation would demonstrate diffuse interstitial fibrosis this is not identifiable by LGE imaging.
CMR protocols for determining the volume of distribution of Gd
By measuring T1 before and after either a bolus injection or equilibrium infusion of Gd, the apparent volume of the extracellular space (ECV) can be determined by calculating the volume of distribution of Gd.(3,5,58,65) For the continuous infusion method, Gd is given as a continuous low dose infusion until the T1 in the myocardium and blood pool are constant. The Vd can then be directly determined from the T1 values obtained pre-contrast and at equilibrium according to the following equation.(5,65)
The bolus injection method relies on the assumption that the exchange between the blood pool and myocardium is fast with respect to Gd clearance from the blood such that there is equilibrium between the concentration of Gd in the blood pool and myocardium at each time point following Gd administration.(3,58) The equivalence of these two approaches has been demonstrated.(62,66)
Clinical Application of T1 mapping Techniques
The reported normal T1 relaxation times for the myocardium at 1.5 T range between 900 and 1100ms with some variation based on technique.(59–61,63,66,67) Pre-contrast measurement of T1 should be increased in myocardial edema similar to T2 due to the increase in free water content of the tissue. A study of 8 patients who underwent pre-contrast T1 mapping demonstrated an 18% increase in T1 in infarcted regions.(68) The area of increased T1 pre-contrast had a larger spatial extent as compared to the region of LGE.(68) Pre-contrast T1 measurements have been compared to T2 measurements as an alternative for assessing the “area at risk” following acute ischemic injury and produce results similar to microsphere measurements.(47) Pre-contrast T1 times are prolonged in both the myocardium and blood pool of subjects with amyloidosis as compared to normal volunteers.(52,55). A recent study of 53 patients with AL amyloidosis demonstrated a significant prolongation of non-contrast T1 time in cardiac AL amyloidosis patients (1,140±61ms) as compared to 36 normal subjects (958±20ms). A T1 cutoff of 1020 yielded 92% accuracy for identifying patients with possible or definite cardiac involvement.(54) There was no significant difference in non-contrast T1 values between the controls and 17 subjects with aortic stenosis (979±51ms). Native T1 was also shown to be prolonged in cardiomyopathy in a study of 25 patients with known hypertrophic cardiomyopathy and 27 subjects with non-ischemic dilated cardiomyopathy as compared to 30 control subjects.(53)
T1 mapping post-contrast has demonstrated potential for evaluation of MI. In the same aforementioned study of 8 subjects with MI who underwent T1 mapping pre-contrast, there was a 27% reduction in post Gd contrast T1, with a spatial extent which correlated well with LGE, demonstrating that T1 mapping could be an alternative for quantifying MI.(68) An image of R1, which is defined as 1/T1, will have an appearance similar to conventional LGE images where regions of fibrosis or infiltration are bright (Figure 9c–d)
T1 mapping has demonstrated the potential for assessing diffuse fibrosis and infiltration. In a study of 25 patients with heart failure, the T1 times in the myocardium after Gd contrast were reduced compared to 20 normal controls, and the post-contrast T1 times were correlated with the histological severity of fibrosis in 9 subjects who underwent myocardial biopsy.(4) This study demonstrated that post-contrast T1 mapping could potentially be used to evaluate diffuse fibrosis in cardiomyopathy. A study of 54 heart failure patients undergoing endomyocardial biopsy demonstrated a reduction in the 10-minute post contrast T1 time in the heart failure subjects as compared to 13 controls. In heart failure, the post-contrast T1 time was inversely correlated with the histological severity of fibrosis.(69) T1 mapping post-contrast has also shown potential for the evaluation of cardiac amyloidosis.(70) In 29 patients with proven cardiac amyloidosis a T1 difference of 23 ms between the subepicardium and subendocardium at two minutes after Gd administration predicted mortality in amyloidosis with 85% accuracy.(70) In a study of 5 patients with amyloidosis, there was also a smaller difference in T1 relaxation times between the blood pool and myocardium 17.1±54.3ms vs 136.1 ± 18.4 ms at 20 minutes after contrast administration as compared to 8 controls.(52)
By measuring T1 before and after either a bolus or equilibrium infusion of Gd, the partition coefficient and volume of distribution of Gd can be assessed, and they are proportional to the extracellular volume (ECV) (Figure 10). The ECV of normal myocardium has been reported to be in the range of 24–28%.(56,62,66,71) Assessment of Vd or the partition coefficient lambda has been used to assess diffuse fibrosis in different cardiac pathologies. In 9 patients with dilated cardiomyopathy, the volume of distribution of Gd was found to be significantly increased in patients with both familial and dilated cardiomyopathy.(3) Similar findings were demonstrated in congenital heart disease with myocardial dysfunction.(56) Validation of the correlation between the Vd and histological evidence of myocardial fibrosis has been performed in 18 subjects with aortic stenosis undergoing aortic valve replacement and in 18 patients with HCM undergoing surgical myectomy using a multi-breath-hold equilibrium infusion T1 technique.(5) Given the prognostic data available in HCM for the evaluation of focal fibrosis with LGE, it is likely that T1 mapping may provide additional disease in this disease as it reflects both focal and diffuse fibrosis.(72)
Figure 10.
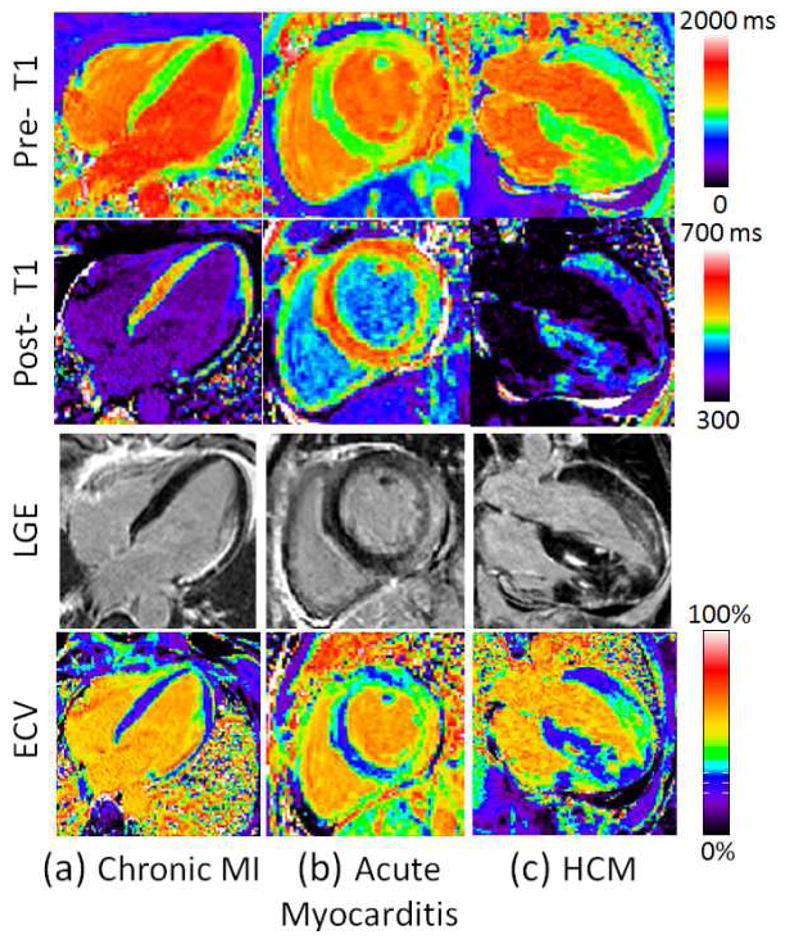
(a) Examples illustrating excellent agreement between LGE and ECV in cases of focal abnormalities in myocardial ECV. Pre-contrast T1-maps (top row), post-contrast T1-maps (2nd row), late gadolinium enhancement (3rd row), and ECV maps (bottom row) for patients with: (a) chronic MI, (b) acute myocarditis, and (c) HCM. (Adapted from Kellman et al. figure 4 (71))
The volume of distribution and the partition coefficient of Gd are markedly increased in amyloid cardiomyopathy with expansion of the extracellular space due to amyloid protein deposition.(55,73) The degree of change in Vd is much larger than the changes in the individual T1 measurements of the blood pool and myocardium. This may serve as a new marker for determining disease burden in amyloid cardiomyopathy.
A direct comparison of ECV determined at 1.5T and 3T in 31 patients demonstrated similar ECV measurements between these two field strengths. However, the investigators noted differences in ECV between the septum and lateral wall which may be related to susceptibility and will likely be more problematic at higher field strengths.(74)
Using the pre and post contrast T1-maps, one can generate parametric images of Vd which reflect the extracellular volume (ECV) (Figure 10), thus providing a new type of image contrast which may provide insight into diseases characterized by regional differences in fibrosis.(71) ECV mapping may also have important prognostic significance in different cardiac pathologies.(75)
The development of robust techniques for non-rigid registration has greatly improved the clinical applicability of T1 mapping, as T1 maps can be generated without the need for user interaction (64). Further developments in parallel and compressed sensing techniques will further improve the spatial and temporal resolution of parametric mapping.
Potential Clinical Pitfalls and Solutions
It is important to note that the MOLLI T1 mapping pulse sequences have some heart rate dependence which may bias measured T1 relaxation times particularly in patients with fast heart rates. As this bias is T1 dependent, the effect is worse for pre-contrast T1 times where the T1 relaxation times are on the order of 1–1.5 seconds. For the MOLLI pulse sequence this effect can be mitigated to an extent by increasing the number of relaxation heart beats; however, this directly increases the required breath-hold. Secondly, the specific parameters of the SSFP readout module can also introduce some T2 dependence to the measured T1 values. Thus, some caution is warranted when comparing T1 measurements acquired by different methodologies.
Conclusions
Quantitative techniques for myocardial perfusion and parametric mapping of magnetic relaxation times are extending the unique potential of CMR for characterization of cardiac structure and physiology. There is a growing body of evidence for the clinical utility of quantitative assessment of perfusion and relaxation times, although current techniques still have some important limitations. There are significant differences in the techniques used for both image acquisition and image analysis between MRI vendors and different sites. Standardization of acquisition and analysis will be important for the wider clinical applicability of these techniques. Improved scanner technology and reconstruction and image processing techniques are rapidly evolving which will further improve the available techniques for CMR parametric mapping. Further research will be necessary to demonstrate that these new techniques will offer incremental diagnostic and prognostic utility and robustness as compared to current visual and semi-quantitative CMR techniques.
Acknowledgments
Funding Sources: NIH K23 HL112910-01, Siemens Medical Solutions
The authors would like to acknowledge Robin LeGallo for help with the histological sections.
Footnotes
Publisher's Disclaimer: This is a PDF file of an unedited manuscript that has been accepted for publication. As a service to our customers we are providing this early version of the manuscript. The manuscript will undergo copyediting, typesetting, and review of the resulting proof before it is published in its final citable form. Please note that during the production process errors may be discovered which could affect the content, and all legal disclaimers that apply to the journal pertain.
References
- 1.Lorenz CH, Walker ES, Morgan VL, Klein SS, Graham TP., Jr Normal human right and left ventricular mass, systolic function, and gender differences by cine magnetic resonance imaging. J Cardiovasc Magn Reson. 1999;1:7–21. doi: 10.3109/10976649909080829. [DOI] [PubMed] [Google Scholar]
- 2.Patel AR, Antkowiak PF, Nandalur KR, et al. Assessment of advanced coronary artery disease: advantages of quantitative cardiac magnetic resonance perfusion analysis. J Am Coll Cardiol. 2010;56:561–9. doi: 10.1016/j.jacc.2010.02.061. [DOI] [PMC free article] [PubMed] [Google Scholar]
- 3.Jerosch-Herold M, Sheridan DC, Kushner JD, et al. Cardiac magnetic resonance imaging of myocardial contrast uptake and blood flow in patients affected with idiopathic or familial dilated cardiomyopathy. Am J Physiol Heart Circ Physiol. 2008;295:H1234–H1242. doi: 10.1152/ajpheart.00429.2008. [DOI] [PMC free article] [PubMed] [Google Scholar]
- 4.Iles L, Pfluger H, Phrommintikul A, et al. Evaluation of diffuse myocardial fibrosis in heart failure with cardiac magnetic resonance contrast-enhanced T1 mapping. J Am Coll Cardiol. 2008;52:1574–80. doi: 10.1016/j.jacc.2008.06.049. [DOI] [PubMed] [Google Scholar]
- 5.Flett AS, Hayward MP, Ashworth MT, et al. Equilibrium contrast cardiovascular magnetic resonance for the measurement of diffuse myocardial fibrosis: preliminary validation in humans. Circulation. 2010;122:138–44. doi: 10.1161/CIRCULATIONAHA.109.930636. [DOI] [PubMed] [Google Scholar]
- 6.Verhaert D, Thavendiranathan P, Giri S, et al. Direct T2 quantification of myocardial edema in acute ischemic injury. JACC Cardiovasc Imaging. 2011;4:269–78. doi: 10.1016/j.jcmg.2010.09.023. [DOI] [PMC free article] [PubMed] [Google Scholar]
- 7.Thavendiranathan P, Walls M, Giri S, et al. Improved detection of myocardial involvement in acute inflammatory cardiomyopathies using T2 mapping. Circ Cardiovasc Imaging. 2012;5:102–10. doi: 10.1161/CIRCIMAGING.111.967836. [DOI] [PMC free article] [PubMed] [Google Scholar]
- 8.Anderson LJ, Holden S, Davis B, et al. Cardiovascular T2-star (T2*) magnetic resonance for the early diagnosis of myocardial iron overload. Eur Heart J. 2001;22:2171–9. doi: 10.1053/euhj.2001.2822. [DOI] [PubMed] [Google Scholar]
- 9.Tanner MA, Galanello R, Dessi C, et al. A randomized, placebo-controlled, double-blind trial of the effect of combined therapy with deferoxamine and deferiprone on myocardial iron in thalassemia major using cardiovascular magnetic resonance. Circulation. 2007;115:1876–84. doi: 10.1161/CIRCULATIONAHA.106.648790. [DOI] [PubMed] [Google Scholar]
- 10.Berman DS, Kang X, Slomka PJ, et al. Underestimation of extent of ischemia by gated SPECT myocardial perfusion imaging in patients with left main coronary artery disease. J Nucl Cardiol. 2007;14:521–8. doi: 10.1016/j.nuclcard.2007.05.008. [DOI] [PubMed] [Google Scholar]
- 11.Christian TF, Miller TD, Bailey KR, Gibbons RJ. Noninvasive identification of severe coronary artery disease using exercise tomographic thallium-201 imaging. Am J Cardiol. 1992;70:14–20. doi: 10.1016/0002-9149(92)91382-e. [DOI] [PubMed] [Google Scholar]
- 12.Patel AR, Epstein FH, Kramer CM. Evaluation of the microcirculation: advances in cardiac magnetic resonance perfusion imaging. J Nucl Cardiol. 2008;15:698–708. doi: 10.1016/j.nuclcard.2008.07.002. [DOI] [PMC free article] [PubMed] [Google Scholar]
- 13.Murthy VL, Naya M, Foster CR, et al. Association Between Coronary Vascular Dysfunction and Cardiac Mortality in Patients with and without Diabetes Mellitus. Circulation. 2012 doi: 10.1161/CIRCULATIONAHA.112.120402. [DOI] [PMC free article] [PubMed] [Google Scholar]
- 14.Salerno M, Beller GA. Noninvasive assessment of myocardial perfusion. Circ Cardiovasc Imaging. 2009;2:412–24. doi: 10.1161/CIRCIMAGING.109.854893. [DOI] [PubMed] [Google Scholar]
- 15.Morton G, Chiribiri A, Ishida M, et al. Quantification of absolute myocardial perfusion in patients with coronary artery disease: comparison between cardiovascular magnetic resonance and positron emission tomography. J Am Coll Cardiol. 2012;60:1546–55. doi: 10.1016/j.jacc.2012.05.052. [DOI] [PMC free article] [PubMed] [Google Scholar]
- 16.Kellman P, Derbyshire JA, Agyeman KO, McVeigh ER, Arai AE. Extended coverage first-pass perfusion imaging using slice-interleaved TSENSE. Magn Reson Med. 2004;51:200–4. doi: 10.1002/mrm.10663. [DOI] [PMC free article] [PubMed] [Google Scholar]
- 17.Manka R, Vitanis V, Boesiger P, Flammer AJ, Plein S, Kozerke S. Clinical feasibility of accelerated, high spatial resolution myocardial perfusion imaging. JACC Cardiovasc Imaging. 2010;3:710–7. doi: 10.1016/j.jcmg.2010.03.009. [DOI] [PubMed] [Google Scholar]
- 18.Manka R, Jahnke C, Kozerke S, et al. Dynamic 3-dimensional stress cardiac magnetic resonance perfusion imaging: detection of coronary artery disease and volumetry of myocardial hypoenhancement before and after coronary stenting. J Am Coll Cardiol. 57:437–44. doi: 10.1016/j.jacc.2010.05.067. [DOI] [PubMed] [Google Scholar]
- 19.Otazo R, Kim D, Axel L, Sodickson DK. Combination of compressed sensing and parallel imaging for highly accelerated first-pass cardiac perfusion MRI. Magn Reson Med. 2010;64:767–76. doi: 10.1002/mrm.22463. [DOI] [PMC free article] [PubMed] [Google Scholar]
- 20.Christian TF, Aletras AH, Arai AE. Estimation of absolute myocardial blood flow during first-pass MR perfusion imaging using a dual-bolus injection technique: comparison to single-bolus injection method. J Magn Reson Imaging. 2008;27:1271–7. doi: 10.1002/jmri.21383. [DOI] [PubMed] [Google Scholar]
- 21.Gatehouse PD, Elkington AG, Ablitt NA, Yang GZ, Pennell DJ, Firmin DN. Accurate assessment of the arterial input function during high-dose myocardial perfusion cardiovascular magnetic resonance. J Magn Reson Imaging. 2004;20:39–45. doi: 10.1002/jmri.20054. [DOI] [PubMed] [Google Scholar]
- 22.Larsson HB, Fritz-Hansen T, Rostrup E, Sondergaard L, Ring P, Henriksen O. Myocardial perfusion modeling using MRI. Magn Reson Med. 1996;35:716–26. doi: 10.1002/mrm.1910350513. [DOI] [PubMed] [Google Scholar]
- 23.Jerosch-Herold M, Wilke N, Stillman AE. Magnetic resonance quantification of the myocardial perfusion reserve with a Fermi function model for constrained deconvolution. Med Phys. 1998;25:73–84. doi: 10.1118/1.598163. [DOI] [PubMed] [Google Scholar]
- 24.Jerosch-Herold M, Wilke N, Wang Y, et al. Direct comparison of an intravascular and an extracellular contrast agent for quantification of myocardial perfusion. Cardiac MRI Group. Int J Card Imaging. 1999;15:453–64. doi: 10.1023/a:1006368619112. [DOI] [PubMed] [Google Scholar]
- 25.Pack NA, DiBella EV. Comparison of myocardial perfusion estimates from dynamic contrast-enhanced magnetic resonance imaging with four quantitative analysis methods. Magn Reson Med. 2010;64:125–37. doi: 10.1002/mrm.22282. [DOI] [PMC free article] [PubMed] [Google Scholar]
- 26.Zun Z, Varadarajan P, Pai RG, Wong EC, Nayak KS. Arterial spin labeled CMR detects clinically relevant increase in myocardial blood flow with vasodilation. JACC Cardiovasc Imaging. 2011;4:1253–61. doi: 10.1016/j.jcmg.2011.06.023. [DOI] [PubMed] [Google Scholar]
- 27.Fritz-Hansen T, Hove JD, Kofoed KF, Kelbaek H, Larsson HB. Quantification of MRI measured myocardial perfusion reserve in healthy humans: a comparison with positron emission tomography. J Magn Reson Imaging. 2008;27:818–24. doi: 10.1002/jmri.21306. [DOI] [PubMed] [Google Scholar]
- 28.Kurita T, Sakuma H, Onishi K, et al. Regional myocardial perfusion reserve determined using myocardial perfusion magnetic resonance imaging showed a direct correlation with coronary flow velocity reserve by Doppler flow wire. Eur Heart J. 2009;30:444–52. doi: 10.1093/eurheartj/ehn521. [DOI] [PubMed] [Google Scholar]
- 29.Costa MA, Shoemaker S, Futamatsu H, et al. Quantitative magnetic resonance perfusion imaging detects anatomic and physiologic coronary artery disease as measured by coronary angiography and fractional flow reserve. J Am Coll Cardiol. 2007;50:514–22. doi: 10.1016/j.jacc.2007.04.053. [DOI] [PubMed] [Google Scholar]
- 30.Bernhardt P, Walcher T, Rottbauer W, Wohrle J. Quantification of myocardial perfusion reserve at 1.5 and 3. 0 Tesla: a comparison to fractional flow reserve. Int J Cardiovasc Imaging. 2012;28:2049–56. doi: 10.1007/s10554-012-0037-1. [DOI] [PubMed] [Google Scholar]
- 31.Salerno M, Sica C, Kramer CM, Meyer CH. Improved first-pass spiral myocardial perfusion imaging with variable density trajectories. Magn Reson Med. 2012 doi: 10.1002/mrm.24569. [DOI] [PMC free article] [PubMed] [Google Scholar]
- 32.Salerno M, Sica CT, Kramer CM, Meyer CH. Optimization of spiral-based pulse sequences for first-pass myocardial perfusion imaging. Magn Reson Med. 2011;65:1602–10. doi: 10.1002/mrm.22746. [DOI] [PMC free article] [PubMed] [Google Scholar]
- 33.Hsu LY, Groves DW, Aletras AH, Kellman P, Arai AE. A quantitative pixel-wise measurement of myocardial blood flow by contrast-enhanced first-pass CMR perfusion imaging: microsphere validation in dogs and feasibility study in humans. JACC Cardiovasc Imaging. 2012;5:154–66. doi: 10.1016/j.jcmg.2011.07.013. [DOI] [PMC free article] [PubMed] [Google Scholar]
- 34.Nandalur KR, Dwamena BA, Choudhri AF, Nandalur MR, Carlos RC. Diagnostic performance of stress cardiac magnetic resonance imaging in the detection of coronary artery disease: a meta-analysis. J Am Coll Cardiol. 2007;50:1343–53. doi: 10.1016/j.jacc.2007.06.030. [DOI] [PubMed] [Google Scholar]
- 35.Westwood M, Anderson LJ, Firmin DN, et al. A single breath-hold multiecho T2* cardiovascular magnetic resonance technique for diagnosis of myocardial iron overload. J Magn Reson Imaging. 2003;18:33–9. doi: 10.1002/jmri.10332. [DOI] [PubMed] [Google Scholar]
- 36.Zia MI, Ghugre NR, Connelly KA, et al. Characterizing myocardial edema and hemorrhage using quantitative T2 and T2* mapping at multiple time intervals post ST-segment elevation myocardial infarction. Circ Cardiovasc Imaging. 2012;5:566–72. doi: 10.1161/CIRCIMAGING.112.973222. [DOI] [PubMed] [Google Scholar]
- 37.Wacker CM, Hartlep AW, Pfleger S, Schad LR, Ertl G, Bauer WR. Susceptibility-sensitive magnetic resonance imaging detects human myocardium supplied by a stenotic coronary artery without a contrast agent. J Am Coll Cardiol. 2003;41:834–40. doi: 10.1016/s0735-1097(02)02931-5. [DOI] [PubMed] [Google Scholar]
- 38.Manka R, Paetsch I, Schnackenburg B, Gebker R, Fleck E, Jahnke C. BOLD cardiovascular magnetic resonance at 3. 0 tesla in myocardial ischemia. J Cardiovasc Magn Reson. 2010;12:54. doi: 10.1186/1532-429X-12-54. [DOI] [PMC free article] [PubMed] [Google Scholar]
- 39.Abdel-Aty H, Zagrosek A, Schulz-Menger J, et al. Delayed enhancement and T2-weighted cardiovascular magnetic resonance imaging differentiate acute from chronic myocardial infarction. Circulation. 2004;109:2411–6. doi: 10.1161/01.CIR.0000127428.10985.C6. [DOI] [PubMed] [Google Scholar]
- 40.Abdel-Aty H, Boye P, Zagrosek A, et al. Diagnostic performance of cardiovascular magnetic resonance in patients with suspected acute myocarditis: comparison of different approaches. J Am Coll Cardiol. 2005;45:1815–22. doi: 10.1016/j.jacc.2004.11.069. [DOI] [PubMed] [Google Scholar]
- 41.Vignaux O, Dhote R, Duboc D, et al. Detection of myocardial involvement in patients with sarcoidosis applying T2-weighted, contrast-enhanced, and cine magnetic resonance imaging: initial results of a prospective study. J Comput Assist Tomogr. 2002;26:762–7. doi: 10.1097/00004728-200209000-00017. [DOI] [PubMed] [Google Scholar]
- 42.Lund G, Morin RL, Olivari MT, Ring WS. Serial myocardial T2 relaxation time measurements in normal subjects and heart transplant recipients. J Heart Transplant. 1988;7:274–9. [PubMed] [Google Scholar]
- 43.Foltz WD, Al-Kwifi O, Sussman MS, Stainsby JA, Wright GA. Optimized spiral imaging for measurement of myocardial T2 relaxation. Magn Reson Med. 2003;49:1089–97. doi: 10.1002/mrm.10467. [DOI] [PubMed] [Google Scholar]
- 44.Huang TY, Liu YJ, Stemmer A, Poncelet BP. T2 measurement of the human myocardium using a T2-prepared transient-state TrueFISP sequence. Magn Reson Med. 2007;57:960–6. doi: 10.1002/mrm.21208. [DOI] [PubMed] [Google Scholar]
- 45.Giri S, Chung YC, Merchant A, et al. T2 quantification for improved detection of myocardial edema. J Cardiovasc Magn Reson. 2009;11:56. doi: 10.1186/1532-429X-11-56. [DOI] [PMC free article] [PubMed] [Google Scholar]
- 46.Aletras AH, Tilak GS, Natanzon A, et al. Retrospective determination of the area at risk for reperfused acute myocardial infarction with T2-weighted cardiac magnetic resonance imaging: histopathological and displacement encoding with stimulated echoes (DENSE) functional validations. Circulation. 2006;113:1865–70. doi: 10.1161/CIRCULATIONAHA.105.576025. [DOI] [PubMed] [Google Scholar]
- 47.Ugander M, Bagi PS, Oki AJ, et al. Myocardial edema as detected by pre-contrast T1 and T2 CMR delineates area at risk associated with acute myocardial infarction. JACC Cardiovasc Imaging. 2012;5:596–603. doi: 10.1016/j.jcmg.2012.01.016. [DOI] [PMC free article] [PubMed] [Google Scholar]
- 48.Eitel I, Desch S, Fuernau G, et al. Prognostic significance and determinants of myocardial salvage assessed by cardiovascular magnetic resonance in acute reperfused myocardial infarction. J Am Coll Cardiol. 2010;55:2470–9. doi: 10.1016/j.jacc.2010.01.049. [DOI] [PubMed] [Google Scholar]
- 49.He T, Smith GC, Gatehouse PD, Mohiaddin RH, Firmin DN, Pennell DJ. On using T2 to assess extrinsic magnetic field inhomogeneity effects on T2* measurements in myocardial siderosis in thalassemia. Magn Reson Med. 2009;61:501–6. doi: 10.1002/mrm.21874. [DOI] [PubMed] [Google Scholar]
- 50.Assomull RG, Prasad SK, Lyne J, et al. Cardiovascular magnetic resonance, fibrosis, and prognosis in dilated cardiomyopathy. J Am Coll Cardiol. 2006;48:1977–85. doi: 10.1016/j.jacc.2006.07.049. [DOI] [PubMed] [Google Scholar]
- 51.Kim RJ, Wu E, Rafael A, et al. The use of contrast-enhanced magnetic resonance imaging to identify reversible myocardial dysfunction. N Engl J Med. 2000;343:1445–53. doi: 10.1056/NEJM200011163432003. [DOI] [PubMed] [Google Scholar]
- 52.Brooks J, Kramer CM, Salerno M. Markedly increased volume of distribution of gadolinium in cardiac amyloidosis demonstrated by T1 mapping. J Magn Reson Imaging. 2013 doi: 10.1002/jmri.24078. [DOI] [PMC free article] [PubMed] [Google Scholar]
- 53.Puntmann VO, Voigt T, Chen Z, et al. Native t1 mapping in differentiation of normal myocardium from diffuse disease in hypertrophic and dilated cardiomyopathy. JACC Cardiovasc Imaging. 2013;6:475–84. doi: 10.1016/j.jcmg.2012.08.019. [DOI] [PubMed] [Google Scholar]
- 54.Karamitsos TD, Piechnik SK, Banypersad SM, et al. Noncontrast t1 mapping for the diagnosis of cardiac amyloidosis. JACC Cardiovasc Imaging. 2013;6:488–97. doi: 10.1016/j.jcmg.2012.11.013. [DOI] [PubMed] [Google Scholar]
- 55.Salerno M, Kramer CM. Evaluation of Cardiac Amyloidosis with T1 Mapping. Proceedings of the 20th ISMRM; 2012. p. 3780. [Google Scholar]
- 56.Broberg CS, Chugh SS, Conklin C, Sahn DJ, Jerosch-Herold M. Quantification of diffuse myocardial fibrosis and its association with myocardial dysfunction in congenital heart disease. Circ Cardiovasc Imaging. 2010;3:727–34. doi: 10.1161/CIRCIMAGING.108.842096. [DOI] [PMC free article] [PubMed] [Google Scholar]
- 57.Flacke S, Allen JS, Chia JM, et al. Characterization of viable and nonviable myocardium at MR imaging: comparison of gadolinium-based extracellular and blood pool contrast materials versus manganese-based contrast materials in a rat myocardial infarction model. Radiology. 2003;226:731–8. doi: 10.1148/radiol.2263020151. [DOI] [PubMed] [Google Scholar]
- 58.Klein C, Nekolla SG, Balbach T, et al. The influence of myocardial blood flow and volume of distribution on late Gd-DTPA kinetics in ischemic heart failure. J Magn Reson Imaging. 2004;20:588–93. doi: 10.1002/jmri.20164. [DOI] [PubMed] [Google Scholar]
- 59.Nacif MS, Turkbey EB, Gai N, et al. Myocardial T1 mapping with MRI: comparison of look-locker and MOLLI sequences. J Magn Reson Imaging. 2011;34:1367–73. doi: 10.1002/jmri.22753. [DOI] [PMC free article] [PubMed] [Google Scholar]
- 60.Messroghli DR, Greiser A, Frohlich M, Dietz R, Schulz-Menger J. Optimization and validation of a fully-integrated pulse sequence for modified look-locker inversion-recovery (MOLLI) T1 mapping of the heart. J Magn Reson Imaging. 2007;26:1081–6. doi: 10.1002/jmri.21119. [DOI] [PubMed] [Google Scholar]
- 61.Messroghli DR, Radjenovic A, Kozerke S, Higgins DM, Sivananthan MU, Ridgway JP. Modified Look-Locker inversion recovery (MOLLI) for high-resolution T1 mapping of the heart. Magn Reson Med. 2004;52:141–6. doi: 10.1002/mrm.20110. [DOI] [PubMed] [Google Scholar]
- 62.Schelbert EB, Testa SM, Meier CG, et al. Myocardial extravascular extracellular volume fraction measurement by gadolinium cardiovascular magnetic resonance in humans: slow infusion versus bolus. J Cardiovasc Magn Reson. 2011;13:16. doi: 10.1186/1532-429X-13-16. [DOI] [PMC free article] [PubMed] [Google Scholar]
- 63.Piechnik SK, Ferreira VM, Dall’Armellina E, et al. Shortened Modified Look-Locker Inversion recovery (ShMOLLI) for clinical myocardial T1-mapping at 1. 5 and 3 T within a 9 heartbeat breathhold. J Cardiovasc Magn Reson. 2010;12:69. doi: 10.1186/1532-429X-12-69. [DOI] [PMC free article] [PubMed] [Google Scholar]
- 64.Xue H, Shah S, Greiser A, et al. Motion correction for myocardial T1 mapping using image registration with synthetic image estimation. Magn Reson Med. 2012;67:1644–55. doi: 10.1002/mrm.23153. [DOI] [PMC free article] [PubMed] [Google Scholar]
- 65.Flacke SJ, Fischer SE, Lorenz CH. Measurement of the gadopentetate dimeglumine partition coefficient in human myocardium in vivo: normal distribution and elevation in acute and chronic infarction. Radiology. 2001;218:703–10. doi: 10.1148/radiology.218.3.r01fe18703. [DOI] [PubMed] [Google Scholar]
- 66.Salerno M, Janardhanan R, Jiji RS, et al. Comparison of methods for determining the partition coefficient of gadolinium in the myocardium using T(1) mapping. J Magn Reson Imaging. 2012 doi: 10.1002/jmri.23875. [DOI] [PMC free article] [PubMed] [Google Scholar]
- 67.Piechnik SK, Ferreira VM, Lewandowski AJ, et al. Normal variation of magnetic resonance T1 relaxation times in the human population at 1. 5 T using ShMOLLI. J Cardiovasc Magn Reson. 2013;15:13. doi: 10.1186/1532-429X-15-13. [DOI] [PMC free article] [PubMed] [Google Scholar]
- 68.Messroghli DR, Niendorf T, Schulz-Menger J, Dietz R, Friedrich MG. T1 mapping in patients with acute myocardial infarction. J Cardiovasc Magn Reson. 2003;5:353–9. doi: 10.1081/jcmr-120019418. [DOI] [PubMed] [Google Scholar]
- 69.Sibley CT, Noureldin RA, Gai N, et al. T1 Mapping in Cardiomyopathy at Cardiac MR: Comparison with Endomyocardial Biopsy. Radiology. 2012;265:724–732. doi: 10.1148/radiol.12112721. [DOI] [PMC free article] [PubMed] [Google Scholar]
- 70.Maceira AM, Prasad SK, Hawkins PN, Roughton M, Pennell DJ. Cardiovascular magnetic resonance and prognosis in cardiac amyloidosis. J Cardiovasc Magn Reson. 2008;10:54. doi: 10.1186/1532-429X-10-54. [DOI] [PMC free article] [PubMed] [Google Scholar]
- 71.Kellman P, Wilson JR, Xue H, et al. Extracellular volume fraction mapping in the myocardium, part 2: initial clinical experience. J Cardiovasc Magn Reson. 2012;14:64. doi: 10.1186/1532-429X-14-64. [DOI] [PMC free article] [PubMed] [Google Scholar]
- 72.Green JJ, Berger JS, Kramer CM, Salerno M. Prognostic value of late gadolinium enhancement in clinical outcomes for hypertrophic cardiomyopathy. JACC Cardiovasc Imaging. 2012;5:370–7. doi: 10.1016/j.jcmg.2011.11.021. [DOI] [PubMed] [Google Scholar]
- 73.Mongeon FP, Jerosch-Herold M, Coelho-Filho OR, Blankstein R, Falk RH, Kwong RY. Quantification of Extracellular Matrix Expansion by CMR in Infiltrative Heart Disease. JACC Cardiovasc Imaging. 2012;5:897–907. doi: 10.1016/j.jcmg.2012.04.006. [DOI] [PMC free article] [PubMed] [Google Scholar]
- 74.Kawel N, Nacif M, Zavodni A, et al. T1 mapping of the myocardium: intra-individual assessment of post-contrast T1 time evolution and extracellular volume fraction at 3T for Gd-DTPA and Gd-BOPTA. J Cardiovasc Magn Reson. 2012;14:26. doi: 10.1186/1532-429X-14-26. [DOI] [PMC free article] [PubMed] [Google Scholar]
- 75.Wong TC, Piehler K, Meier CG, et al. Association between extracellular matrix expansion quantified by cardiovascular magnetic resonance and short-term mortality. Circulation. 2012;126:1206–16. doi: 10.1161/CIRCULATIONAHA.111.089409. [DOI] [PMC free article] [PubMed] [Google Scholar]