

Abstract
Optical Coherence Tomography (OCT) has revolutionized ophthalmology. Since its introduction in the early 1990s it has continuously improved in terms of speed, resolution and sensitivity. The technique has also seen a variety of extensions aiming to assess functional aspects of the tissue in addition to morphology. One of these approaches is Doppler OCT (DOCT), which aims to visualize and quantify blood flow. Such extensions were already implemented in time domain systems, but have gained importance with the introduction of Fourier domain OCT. Nowadays phase-sensitive detection techniques are most widely used to extract blood velocity and blood flow from tissues. A common problem with the technique is that the Doppler angle is not known and several approaches have been realized to obtain absolute velocity and flow data from the retina. Additional studies are required to elucidate which of these techniques is most promising. In the recent years, however, several groups have shown that data can be obtained with high validity and reproducibility. In addition, several groups have published values for total retinal blood flow. Another promising application relates to non-invasive angiography. As compared to standard techniques such as fluorescein and indocyanine-green angiography the technique offers two major advantages: no dye is required and depth resolution is required is provided. As such Doppler OCT has the potential to improve our abilities to diagnose and monitor ocular vascular diseases.
Keywords: Optical Coherence Tomography, Retinal vasculature, Doppler effect, Blood flow, Angiography, Perfusion
1. Introduction
Optical Coherence Tomography (OCT) has become a gold standard in ophthalmic imaging. Technological developments pushed the performance of OCT by several orders of magnitude: improvement of resolution towards the level of histopathology, improvement of sensitivity by switching from time domain to Fourier domain OCT, improvement of acquisition speed, up to several hundred thousands of A-scans per second due to new light sources and fast sensors. Those developments opened exciting perspectives to tissue structure imaging and visualization of tissue dynamics. As such applications of OCT in ophthalmology are nowadays wide including diagnosis and treatment monitoring of several major ocular diseases. When talking about clinical needs, OCT, however, falls short in diagnostic specificity. In classical OCT the contrast in the images is obtained by light scattering differences. Hence, OCT contains information on the morphology of ocular tissues only, which is an unspecific biomarker of diseases. In particular for the neural retina, visible structural changes may already reflect permanent damages and irreversible vision loss. As such there is a need for techniques that allow for early diagnosis and thus enable the allowing to start of treatment when it is most effective. This is why functional extensions of OCT gained importance during the last years associated with the hope to enhance the early diagnostic capabilities of OCT.
One of the functional extensions of OCT relates to the visualization of the ocular vasculature and quantification of blood flow at the posterior pole of the eye. Given that many ocular diseases are associated with vascular abnormalities, quantitative blood flow assessment as well as qualitative vascular imaging are attractive extensions of OCT. The strength of optical techniques is the unprecedented level of resolution even for small capillary structures or microaneurysms. In addition, the possibility to combine OCT with different techniques such as tissue spectroscopy may provide valuable insight into tissue metabolism. Nowadays the gold standard for retinal vascular imaging is fluorescein or indocyanine green (ICG) angiography with the need to administer contrast agents (Yannuzzi, 2011). ICG absorbs light in the infrared region where tissue scattering is lower, and therefore allows imaging of deeper vessels in the choroid, whereas fluorescein is applied for contrasting retinal vessels. No technique has, however, been realized that allows to distinguish flow signatures of different vascular beds in depth.
A variety of ocular diseases were found to be linked to alterations in retinal blood flow including diabetic retinopathy (Clermont and Bursell, 2007; Durham and Herman, 2011; Pemp and Schmetterer, 2008; Schmetterer and Wolzt, 1999), age-related macular degeneration (Ehrlich et al., 2009; Feigl, 2009; Pemp and Schmetterer, 2008) and glaucoma (Cherecheanu et al., 2013; Costa et al., 2013; Mozaffarieh and Flammer, 2013; Schmidl et al., 2011). Quantification of retinal blood flow, however, is a major challenge and although several approaches have been realized, none of them has found its way into clinical praxis. Nevertheless significant advances in our understanding of the ocular circulatory supply have been obtained in the recent years (Pournaras and Riva, 2013; Pournaras et al., 2008; Riva and Schmetterer, 2008; Schmetterer and Kiel, 2012). Attempts have been made to extract quantitative retinal and choroidal blood flow information from fluorescein and ICG angiograms, but due to the invasive nature of these investigations they cannot be performed routinely (Rechtman et al., 2003). A non-contact and label-free method for tissue perfusion assessment is laser Doppler flowmetry (LDF). This method uses coherent laser illumination and detects the beating frequency between light scattered by moving blood cells that experience a Doppler shift and those light components that are scattered from static tissue (Riva et al., 2010). Fourier analysis of the beating frequencies gives relative quantitative information about flow and particle concentration. Alternatively speckle fluctuations can be used as an indicator of blood flow, allowing for quantification of blood flow in the retina, choroid and optic nerve head (Sugiyama et al., 2010). Laser Doppler velocimetry (LDV) is a related method that has been applied to study retinal blood velocities in arteries and veins (Riva et al., 1972). For local assessment of blood velocity in selected vessels, bidirectional LDV has been successfully applied, analyzing the beating frequency spectrum to extract the absolute blood velocity (Riva et al., 1979). Combining this technique with measurements of retinal vessel diameters from fundus photographs has for a long time been the only method applicable for the measurement of total retinal blood flow (Garhofer et al., 2012; Riva et al., 1985), but cannot be applied in a clinical setting because of the time-consuming procedure.
Another technique uses ultrasound to extract blood velocities in retrobulbar vessels, but due to the limited resolution of the technique no data on cross-sectional area is available (Dimitrova and Kato, 2010; Stalmans et al., 2011). Measurement of retinal vessel calibers has in the recent years found wide application because of its potential to predict the risk of cardiovascular disease. A major advantage of this approach is that it can be assessed with high sensitivity and reproducibility (Garhofer et al., 2010). Large-scale studies have shown clear associations between alterations in retinal vessel diameters and incident stroke (Kawasaki et al., 2012; McGeechan et al., 2009), systemic hypertension (Cheung et al., 2012a), diabetic retinopathy (Nguyen and Wong, 2009) and glaucoma (Kawasaki et al., 2013).
Nevertheless retinal vascular caliber is only a small part of the complex vascular supply of the retina and there is a considerable need for more sophisticated technologies. Indeed there is a need for a high resolution, label-free, tissue angiography and flow assessment that in addition allows for precise depth gating of flow information. The most promising candidate is Doppler Optical Coherence Tomography (DOCT), which shares the advantage with laser Doppler technology of being non-contact, label-free, and without employing hazardous radiation. Contrary to LDV, DOCT provides, however, fully quantitative volumetric information about blood flow together with the vascular and structural anatomy. Segmentation and visualization of blood vessels from OCT measurements, called also as “OCT angiography”, acts directly on the standard OCT data sets. It is only a matter of post-processing in combination with dedicated scanning patterns that determines whether one reconstructs the OCT intensity or angiography images. Having both intensity and angiography information available with the same data set potentially reduces the shortcoming of DOCT being only sensitive to blood at motion, not sensing static leakage sites. Also systemic vascular diseases may be visible through studying the integrity and perfusion properties of vasculature networks in the eye. For example, the irregular vascular network of tumor tissue in mouse skin has been imaged and characterized with an impressive level of detail. DOCT has furthermore great potential for treatment monitoring, e.g. during anti-VEGF therapy. Because of the huge potential of DOCT for diagnosis, the last years saw a rapid increase of publications in this field with many different approaches.
1.1. Phase resolved DOCT
1.1.1. Time domain
The history of measuring blood velocities using OCT-based technology started in the mid 1990s. These early approaches were based on time domain techniques. OCT uses the short coherence length of the employed broad bandwidth light source for axial sectioning (Drexler and Fujimoto, 2008). Interference fringes are detected only if the sample arm distance in an interferometer matches the reference arm length within the temporal coherence length. This defines the axial resolution, which is inversely related to the spectral bandwidth of the light source. A reflectivity profile called A-scan contains information about the anatomical location of structures within the investigated tissue analogue to ultrasound techniques. A cross-sectional image called B-scan is achieved by laterally combining a series of axial A-scans. In time domain systems the reference arm length is scanned at a constant speed vref. The recorded signal is then characterized by a heterodyne frequency fhet = 2vref/λ, where λ is the central wavelength. The actual depth profile is obtained via demodulation of the recorded heterodyne signal. If a sample interface moves axially at constant speed vS, the signal experiences a Doppler shift fD, and the instantaneous modulation frequency becomes f = fhet + fD = fhet + 2vref/λ. In case the sample velocity vector vS encloses an angle with the illumination direction and the surrounding medium has refractive index n, the actual speed vS is (Chen et al., 1997; Izatt et al., 1997; Wang et al., 1995):
| (1) |
A simple method to detect the Doppler shifted time-domain OCT signal is to record the full fringe signal and calculate the local frequency shift within a small window that is slid across an A-scan. This approach is, however, computationally expensive and thus cannot be employed for in-vivo real-time flow measurements. In addition, the spatial or temporal resolution to axially localize flow is dependent on the velocity resolution of the Doppler system. Dependent on the size of the window one can either select a better frequency resolution, if it is chosen larger, or a better depth resolution, if is chosen smaller. The technique is, however, not suitable for measuring lower velocities in capillaries or venules of the retina, which are typically below 1 mm/s (Kulkarni et al., 1998).
An alternative method uses phase-sensitive Doppler analysis, offering the advantage of decoupling of spatial and frequency resolution (Pierce et al., 2002; Zhao et al., 2002). Conventional OCT is based on the measurement of the amplitude of the backscattered light. In DOCT depth localized phase difference between adjacent A-scans at all lateral positions x is measured. Measuring the phase changes between two A-scans (Δφ) yields a quantitative value for the velocity if the time between the two measurements T is known.
| (2) |
Several techniques were employed to allow for phase resolved measurements of the time domain OCT signal (Westphal et al., 2002; Yazdanfar et al., 2003; Yang et al., 2003) to calculate the velocity. Using these approaches it was possible to measure the pulsatility of retinal blood velocity in larger retinal vessels in humans (Yazdanfar et al., 2003). Nevertheless, even with those systems a natural border on system speed for retinal imaging is set by the maximum power of the laser light which is determined by laser safety regulations. The introduction of Fourier domain based OCT systems brought a paradigm change in achievable acquisition speed without compromising sensitivity or image quality (Leitgeb et al., 2003). Functional extensions like Doppler tomography experienced new impetus towards clinical applications.
1.1.2. Fourier domain Doppler tomography
After recognizing that Fourier or spectral Domain OCT (FDOCT) has unprecedented advantages with respect to imaging speed and sensitivity (Leitgeb et al., 2003), it has largely replaced time domain OCT. The introduction of FDOCT has also immediately led to increased research for functional extensions of OCT. First functional extensions of FDOCT for measuring blood flow were presented already in 2002 and gave a demonstration of the high phase sensitivity of the method (Leitgeb et al., 2002). This stability is due to the fact that the full depth structure is encoded in parallel by the recorded spectral interference pattern and no reference arm scanning is needed. The technique is called FDOCT, because the interference pattern is recorded in the spectral Domain for each lateral position and the full complex valued tomogram is reconstructed via Fourier transform (Fercher et al., 1995):
There are two variants of FDOCT: spectrometer based FDOCT and swept source OCT. In the first case the spectral interference pattern is recorded with a spectrometer in a parallel way, whereas in the second, the interferogram is acquired as a function of time using a wavelength-tuning source at the interferometer entrance. The second method has certain advantages in the near infrared region above 1 μm where detector arrays are expensive (Lexer et al., 1997). In addition, swept source OCT systems may improve acquisition speed. The introduction of Fourier domain mode locked (FDML) swept sources made for the first time A-scan rates of several hundreds of kHz available (Huber et al., 2007, 2006). Acquisition speed in spectrometer based OCT systems can on the other hand be improved by employing fast and sensitive CMOS technology (Potsaid et al., 2008; Schmoll et al., 2009) (see Figs. 1 and 2).
Fig. 1.
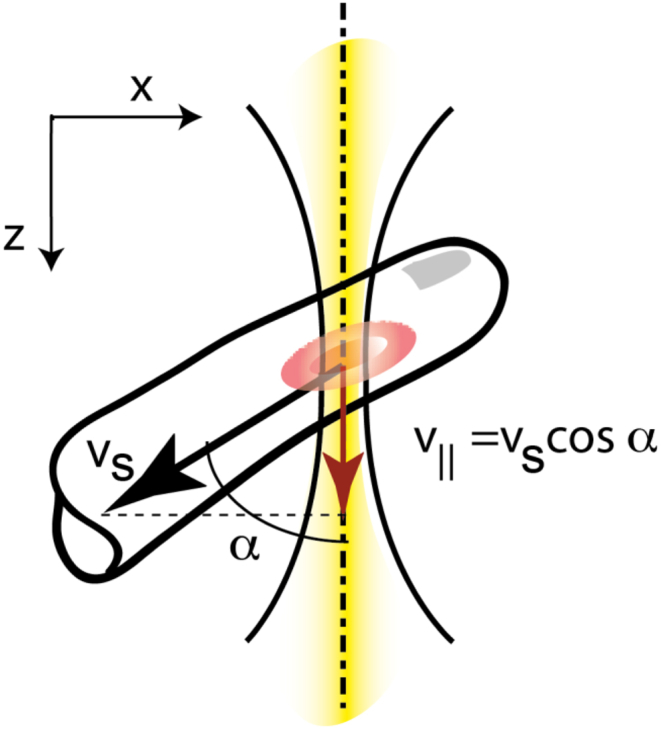
Doppler OCT measures the axial velocity component v‖. The yellow line represents the OCT beam.
Fig. 2.

Upper panel: Measured time domain OCT A-scan of two static interface. middle panel: Time domain OCT signal of static interfaces with flow in-between causing a Doppler shift of the heterodyne carrier frequency. Sliding a time window (gray area) along the A-scan and calculating the centroid frequency allows extracting the local Doppler shift fD (lower panel).
Analogous to time domain OCT axial sample motion is extracted via calculation of the phase difference between adjacent depth profiles for each depth position. For unambiguous velocity determination the phase difference Δϕ(x, z) needs to be confined to [−π, π]. If the phase difference exceeds π the longitudinal velocity component v‖ = vScosα = Δφλ/(4nT) cannot be unambiguously determined anymore. According to the Nyquist theorem the maximum quantifiable speed is yielding a velocity range of Δv‖ = λ/(2nT). Averaging filters are applied for analyzing cross sectional flow profiles within vessels. Care has to be taken for speeds close to the maximum detectable velocity. The reason is the statistical broadening of the phase distribution. The distribution for values close to π becomes wrapped by −2π and appears in part as negative phase differences (Fig. 3). Averaging over several phase values from the wrapped distribution will therefore result in a lower mean value of the velocity. The width of the distribution has been analyzed in detail by Szkulmowska et al. (2008).
Fig. 3.
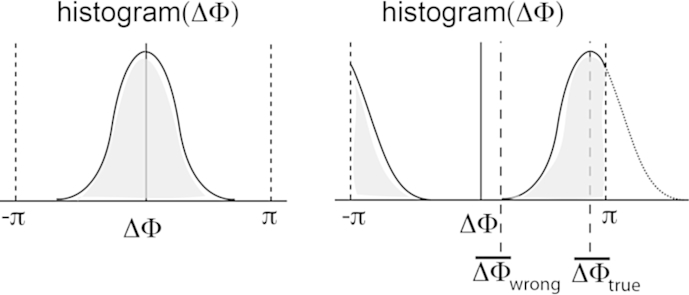
(lhs) Histogram of phase difference plot of static tissue. (rhs) Histogram of Doppler shifted phase differences. If the distribution comes close to the limits of ±π the distribution will be wrapped by 2π causing and phase difference averaging leads to incorrect velocity values.
On the other hand, averaging will in general increase the phase resolution of the system resulting in higher velocity sensitivity. Phase fluctuations are mainly attributable to two factors (Park et al., 2005): a signal-to-noise ratio (SNR) dependent term and a term that depends on the lateral sampling. If lateral oversampling is increased it may therefore be possible to hit the boundary set by SNR of the OCT system. Hence the velocity sensitivity can be increased if phase averaging is employed thereby reducing phase fluctuations. The minimum detectable velocity in a DOCT system usually depends on the scan rate 1/T. This has strong implications for the performance of DOCT since faster image acquisition will reduce the velocity sensitivity.
Obviously it is important to quantify the minimum resolvable velocity of an OCT Doppler system, but there is currently no standardized procedure. Often a mirror is used as sample and the system phase noise is measured at a single position without scanning. With such a configuration phase noise values in the order of 0.01 rad were measured. This situation is, however, not representative for actually measuring flow within scattering structures employing lateral scanning. First, the signal from the mirror has much higher SNR than that from scattering samples, but even more important, lateral scanning across a reflecting surface will not contribute to the phase error. The contribution of scanning across a scattering surface is usually the dominating term. A reliable performance figure is obtained by plotting the histogram of phase difference values taken from an actual tomogram of static scattering structure. The fluctuations will manifest as broadening of the phase difference distribution. The full-width-at half-maximum value of this distribution is a figure that characterizes quantitatively the sensitivity of the DOCT system (Fig. 4).
Fig. 4.
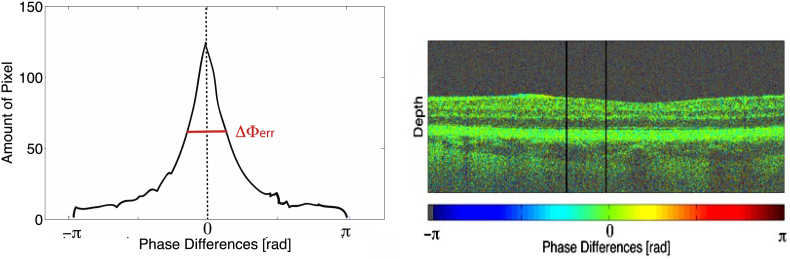
Histogram (lhs) of the region confined by the black bars in phase difference tomogram (rhs). The region does not show any flow signal and can be used to quantify the phase difference fluctuations and thus the velocity sensitivity by the full-width-at-half-maximum of the histogram plot.
1.1.3. Angle ambiguity and bi-directional Doppler OCT systems
As in all techniques that employ the Doppler effect for measuring blood velocity DOCT is in principle only capable to measure the axial flow component (cf. Fig. 5 and Eq. (1)). One immediately observes that for α = 90°, i.e., for optical axis and flow vector being perpendicular, the velocity cannot be measured because the Doppler shift or the phase difference becomes zero. Indeed the velocities in a DOCT system can only be determined within a certain range of Doppler angles, called angle bandwidth that depends on the absolute blood speed within the vessel. Hence, there is a certain angular range for which structures moving at a given speed are visible depending on the minimally resolvable velocity. The angle bandwidth dependence on velocity is highly non-linear and can be obtained from Eq. (1) as
| (3) |
Fig. 5.
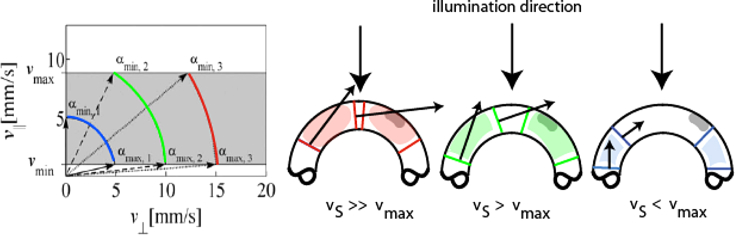
Angle bandwidth for different absolute velocities and a given velocity bandwidth vmax − vmin (lhs). (rhs) schematic visualization of flow in dependence of flow velocities vs and angle bandwidths.
The situation is shown in Fig. 5. Angular bandwidth needs to be considered in particular for vascularization geometries with varying angles of incidence like in the region of the optic nerve head. This discussion also makes clear that if we do not know the angle it is impossible to obtain the true value for the absolute blood velocity. There have been many different approaches to obtain the missing lateral flow component.
Straightforward ways for angle determination were only available after the establishment of FDOCT, which allowed for high-speed volumetric in-vivo imaging of structure and flow. A variety of post-processing approaches have been published allowing for the extraction of three-dimensional vessel geometry. The local vessel gradients with respect to the optical axis give the missing angle correction factor to determine absolute velocity. One approach is to measure the local vessel gradient between tomograms taken at adjacent vessel cross-sections. Wang et al. (2007) demonstrated the use of circular scanning patterns with different radii centered at the optic nerve head to extract total blood perfusion of the retina and to extract the vessel orientation. Other techniques have been proposed yielding the full velocity vectors of retinal flow based on high-speed Fourier domain DOCT data (Makita et al., 2008; Michaely et al., 2007). The main problem with this approach is the excessive amount of data that has to be processed associated with long computation time. Another approach uses the en face image (frontal sections of layers at the posterior pole of the eye also called C-scans) to extract the velocity vector (Makita et al., 2008). Two representative cross-sectional flow images of the vessel are taken to extract vessel diameter, orientation, and position. Using this approach the authors were able to extract the volumetric blood flow rate of retinal arteries before and after a bifurcation thereby validating this technique in a healthy human eye. One of the problems of all the techniques that aim to determine the angle from consecutive images is that they are dependent on movements of the eye.
As such several investigators proposed systems that use multiple beam illumination to overcome this problem. Dave and Milner (2000) were the first to demonstrate a bi-directional system for absolute flow measurement in vitro illuminating the sample from two angles with orthogonally polarized beams. Other investigators showed that the two beams can also be distinguished by path-length encoding (Pedersen et al., 2007). Pedersen and co-workers introduced a glass plate into the OCT beam pathway to delay one part of the probe beam. The sample beam is then divided into several components with different group delays and different Doppler angles. By combining the Doppler shifts measured in each of these component interferograms the authors were able to fully determine the velocity vector in in vitro experiments. Iftimia and co-workers (2008) employed a technique with two probe beams and two spectrometers to image zebrafish larvae. Fly-through videos of an entire fish as well as through the head, heart, and upper tail of the fish were acquired and absolute flow rates could be measured in larger vessels.
None of the above bi-directional DOCT methods was, however, applicable for measurements of human retinal flow. We have designed a dual beam bi-directional OCT system capable of measuring retinal blood flow independent of the angle of incidence as long as it is close to 90° (Werkmeister et al., 2008). The geometry at the back of the eye is depicted in Fig. 6. The vessel is illuminated by one laser beam at the Doppler angle α1 and by another laser beam at the Doppler angle α2. The two probe beams are separated by the angle Δα. The angle between the velocity vector and the plane perpendicular to the optical axis of the illuminating beams is termed γ, while the angle between the velocity vector and the plane spanned by the two illuminating beams is named β. The advantage of this configuration is the easy extraction of the out of plane flow direction (angle β) from either fundus images or en face images (Fig. 7). The latter is readily available from axial projection of 3D OCT data (Fig. 7). Applying some basic trigonometry it can be shown that the absolute flow velocity can be extracted independently of the angle of incidence. The sin Δ can be replaced by Δα if the angle is small. By measuring the phase differences ΔΦ1 and ΔΦ2 in each channel the absolute flow velocity can be calculated as v = λ. (Φ1 − Φ2)/(4πτncosβΔα). Using a parallel displacement of the two probe beams of 2 mm at the cornea, the separation angle Δα at the ocular fundus for the Gullstrand standard eye is approximately 4.7° or 0.082 rad.
Fig. 6.

Geometrical situation at the posterior pole of the eye. K1 and K2 are the probe beam wave vectors, v is the velocity vector. α1 and α2 are the Doppler angles of the two laser beams and Δα is the separation angle between the two probe beams. γ is the angle between and the plane perpendicular to the detection plane; and δ is the change in illumination angle due to eye movement (reproduced with permission from Werkmeister et al., 2012b).
Fig. 7.

Phase Doppler tomograms of two orthogonal polarization channels corresponding to illumination directions along the indicated blue line. The fundus projection of a 3D data set allows extracting the angle β.
Several experiments were performed to test the validity of the technique and to study the feasibility to measure retinal blood flow. In vitro experiments showed good agreement between dual beam bi-directional Doppler measurements and perfusion rates in glass capillaries (Werkmeister et al., 2012a) as set with calibrated pumps and velocities of a rotating disc (Werkmeister et al., 2008). In vivo validation of the technique is not easy, because as pointed out above no currently available technique can be considered as gold standard. One approach is to study volumetric flow rates before and after bifurcations (Fig. 8). According to the law of mass conservation volumetric blood flow in the trunk vessel needs to equal the sum of volumetric blood flow in the two daughter vessels. As can be seen from correlation analysis, good agreement is achieved indicating for the validity of the technique. Another proof of validity relates to Murray's law. Indeed there is a linear correlation between blood flow and blood vessel diameter in a log–log scale (Fig. 9).
Fig. 8.

Left panel: Fundus image and OCT en face image of a bifurcation measured with bidirectional Doppler OCT. The blue lines indicate the measurement locations. Right panel: Correlation between blood flow in trunk vessel and sum of blood flow in daughter vessels (R = 0.95; p < 0.001). (reproduced with permission from Werkmeister et al., 2012a).
Fig. 9.

Blood flow versus blood vessel diameter on a log–log scale. Solid line: best fit result of linear regression (R = 0.72, p < 0.001). Dotted lines: 95% confidence interval. (reproduced with permission from Werkmeister et al., 2012a).
Another set of experiments was performed to study the agreement between data as obtained with bi-directional laser Doppler velocimetry and those obtained with dual beam bi-directional Doppler OCT. This study was done in healthy subjects during normoxia or hyperoxia as obtained with 100% oxygen breathing (Werkmeister et al., 2012b). The data are summarized in Fig. 10. Generally good agreement was found between the data with higher degrees of correlation during normoxia than during hyperoxia. This is most likely caused by problems with laser Doppler velocimetry during states of vasoconstriction during 100% oxygen breathing, because there is no control whether the laser beam hits the center of the blood vessels.
Fig. 10.

Correlation analysis for velocity measurements. Correlation between velocity and blood flow as assessed with LDV and DOCT, respectively, during baseline conditions and during hyperoxia. Dotted lines: 95% confidence interval. (reproduced with permission from Werkmeister et al., 2012b).
This is also evident from a further analysis of the data from the 2 channels. The phase shift in the 2 channels can be approximated as
| (4) |
In this equation the angle ε was introduced defined as α1 − γ, and the value 0.082 denotes for the separation angle of the two probe beams at the ocular fundus in radiant. To calculate absolute velocity in a blood vessel knowledge of ε is not required as mentioned above. Once the absolute velocity is, however, calculated the angle ε can be calculated based on Eq. (3) for both channels independently. Obviously the degree of association between the values for ε as obtained by the data from channel 1(ε(ch1)) and those from channel 2 (ε(ch2)) is an index for the validity of data. This angle can also be calculated accordingly from the data as obtained with laser Doppler velocimetry (Werkmeister et al., 2012b). As shown in Fig. 11 calculation of ε is more consistent when Doppler OCT data are used as compared to laser Doppler velocimetry data.
Fig. 11.

Calculation of angle ε. Angle ε as calculated from measurements using OCT (left panel) and LDV (right panel) from the two channels. Calculations were done at baseline (blue) conditions as well as during hyperoxia (red). (reproduced with permission from Werkmeister et al., 2012b).
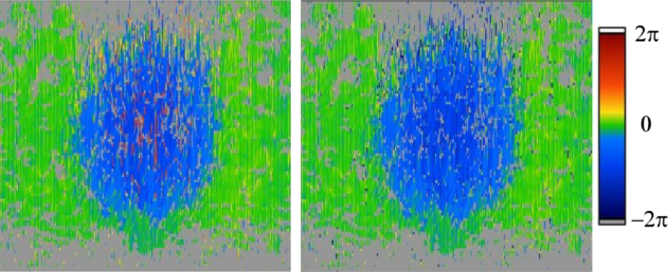
A critical issue in Doppler OCT is related to eye movements. From Fig. 6 it is clear that any eye movement that changes angle δ will also change the Doppler angle. This is a critical issue, particularly because α is usually close to 90°. Fig. 12 shows the time course of a measurement during which the eye showed a small movement. Although the Doppler angle in this example changes only by a few degrees relying on a single channel would lead to erroneous results evening implying a change in the direction of blood flow. By contrast, ΔΦ = Φ1 − Φ2 remains almost unchanged indicating for constant blood flow during the measurement. Fig. 13 shows the effect of an eye movement (angle δ) on the error in extracting the phase (phase shift Φm). Obviously the error is the higher the larger δ and the closer α to 90°. This also holds true for any error in the determination of the Doppler angle for other reasons, which directly introduces an error of the absolute blood velocity.
Fig. 12.

Sample phase extraction of a baseline measurement. Over the measurement period of 12 s the eye moved relative to the incoming laser beams resulting in pronounced changes in Φ1 and Φ2, but almost unchanged ΔΦ. (reproduced with permission from Werkmeister et al., 2012b).
Fig. 13.

Relative error induced by an eye movement of the angle δ between −3 and +3° on Φm/Φ depending on the angle of incidence.
Recently we have introduced a technique allowing for the direct calculation of flow out of bidirectional Doppler cross sections perpendicular to the illumination plane, which is independent of the angle β and of the Doppler angle. For this purpose the illumination plane orientation was set and remained perpendicular to the slow axis scanning direction. Calculation of the flow from phase difference tomograms cancels out the dependence of absolute velocity and vessel cross-section on the vessel angles (Blatter et al., 2013b). Bi-directional approaches can even be extended to systems with more than 2 beams, thereby improving reconstruction of the full velocity vector (Fig. 14, Trasischker et al., 2013). Obviously such an approach does, however, add to system complexity and difficult alignment. Nevertheless such an approach holds promise and validity has been shown in vivo at retinal bifurcations.
Fig. 14.

Schematic diagram of a three-beam measurement geometry to extract the full Doppler angle: top- and side-view on the left, three-dimensional (3-D) model on the right. (reproduced with permission from Trasischker et al., 2013).
1.1.4. Measuring total retinal blood flow
When measuring total retinal blood flow using Doppler OCT, all retinal vessels entering the optic nerve need to be measured. Total blood flow can then simply be obtained by summing up all flow values in the arteries or veins. Importantly blood velocity shows significant pulsatility during the cardiac cycle particularly in arteries. As such total blood flow can only be measured if blood velocity is averaged over several pulse periods resulting in relatively long acquisition times. When measuring total retinal blood flow, values can either be obtained from all retinal arteries or all retinal veins. Measuring both total retinal arterial and venous blood flow offers the advantage of an internal control since the values need to equal. Care must, however, be taken that the system is capable of measuring the different phase shifts that relate to the different velocity ranges in arteries and veins.
One critical issue that is often overseen relates to the extraction of the diameter information. Errors in vessel diameters are of particular importance, because they enter the blood flow calculation quadratic. Determination of the vessel diameter using OCT can either be done from amplitude or from phase images. Obviously only the z-direction can be used for extraction of vessel diameter, because the transversal resolution of OCT systems is not sufficient if not coupled to an adaptive optics system. A major problem in diameter measurement using OCT is that blood is highly scattering and absorptive, resulting in shadowing effects behind the vessel and obscuring the rear vessel boundary. In the phase image, an additional problem relates to low velocity values at the border of the vessel. Depending on the phase noise of the system, this will lead to erroneously underestimated vessel diameter vessels. As such some investigators used fundus photographs to extract vessel diameters (Werkmeister et al., 2012a,b). A systematic investigation on the errors as introduced from measurement of vessel diameters using OCT is still lacking.
Wang and co-workers (2007, 2009b) were the first to measure total retinal blood flow employing Doppler OCT. Using double circular scans around the optic nerve heads total retinal blood flow values of 45.6 ± 3.8 μl/min were reported. The coefficient of variation was 10.5% for repeated measurements. Based on circular scans the angle can also be extracted directly from the volume if a reference volume scan is employed (Singh et al., 2010). If techniques are employed that use bi-directional system the problem of avoiding large angles β, which lead to large deviations in velocity calculation when wrongly estimated, have to be overcome. One approach is to use a rotating Dove prism to always align the probe beams detection plane parallel to the velocity vector. Using this technique Blatter and co-workers (2013b) measured blood velocities in all vessels entering the optic nerve head with a swept source based system. A measurement as obtained with this approach is presented in Fig. 15.
Fig. 15.

Time course of blood flow velocity evolution in all vessels scanned by a rotating Dove prism. Red and blue represent the axial velocity measured for the two channels, left scale. It permits to calculate the absolute velocity (black line) and its mean value (dotted line), right scale. (e) is a ∼15° fundus view centered at the ONH obtained by calculating the en-face mean projection of an OCT 3D data set. (reproduced with permission from Blatter et al., 2013a).
Alternatively total retinal blood flow can also be obtained using a rectangular scanning pattern around the optic nerve head (Fig. 16). At a rotational position of 0° the two probe beams are aligned vertically. At 90°, however, the two beams are aligned horizontally ensuring that β is in a range allowing for blood velocity extraction in all retinal vessels. Extracting retinal vessel diameter information from fundus recordings using a Retinal Vessel Analyzer (RVA, IMEDOS GmbH, Jena, Germany) allows for quantification of retinal blood flow. In 4 healthy subjects total retinal blood flow values between 29.7 and 42.4 μl/min were obtained (Doblhoff-Dier et al., 2014).
Fig. 16.

Scanning pattern around the optic nerve head. The scanning positions denoted by lines in the fundus image (left panel) and the corresponding OCT phase images for each scanning position (right panel) are presented.
Another bi-directional approach was recently reported by Dai and co-workers (2013). Here, the two probing beams are separated and guided to the retina by two independent 2D optical scanners. For the measurement of retinal blood velocity and retinal blood flow, the Doppler angle of each blood vessel segment is calculated from the relative coordinates of the centers of the blood vessel in the two simultaneously acquired OCT images. To obtain total retinal blood flow, circular scan pattern centered at the optic disc are preformed. In two subjects blood flow values of 47.0 μL/min and 51.4 μL/min were obtained, respectively.
Absolute blood flow can also be directly measured using en face cross-sections (Baumann et al., 2011). The angle-independence is a major advantage of this technique, but it requires a high-speed OCT platform. The vessels within the volume are scanned consecutively and only at very high speeds full data over the entire cardiac cycle can be obtained. This obviously results in a very high amount of data recorded for each blood flow measurement. Measurements can only be performed close to the optic nerve head. Using this approach a total retinal blood flow of 43.2 μl/min was reported in one subject (Choi et al., 2012). The system was also applied for total retinal blood flow measurements in rats, but no reproducibility data have been reported so far.
1.2. Optical Angiography
Optical Angiography based on OCT aims at contrasting blood vessels against static tissue in a full depth resolved and label-free manner. This differentiates it from the gold standard being fluorescence angiography, which requires administration of intravenous markers such as fluorescein or ICG. OCT angiography experienced a breakthrough during the last years with the development of high speed OCT technology, such as fast sensors as well as ultra-fast swept sources. The speed is of particular advantage for functional OCT imaging, since the demands concerning sampling are in general higher and more critical as for pure intensity based OCT. This is not only true for quantitative DOCT, but also for DOCT angiography.
Similar to quantitative DOCT a multitude of different approaches for contrasting tissue vasculature exist, including phase resolved and pure intensity based modalities. Developments include speckle and phase variance imaging (Zhao et al., 2000), phase power Doppler imaging (Makita et al., 2006; Park et al., 2005; Yang et al., 2003), resonant Doppler imaging (Bachmann et al., 2007), optical microangiography (An and Wang, 2008), joint frequency and time domain Doppler OCT (Szkulmowski et al., 2008), and other different flow filtering methods (Kolbitsch et al., 2009; Tao et al., 2008) to characterize and contrast perfusion of tissue volumes. Enhanced and flexible velocity sensitivity has been achieved by employing dual beam setups. Two beams are laterally offset, and scan the same spot after an adjustable time interval, given by the lateral displacement and the scanning speed (Jaillon et al., 2011, 2012; Zotter et al., 2011). Furthermore post processing algorithms to filter vessel structures out of intensity tomograms work well in the retina. This is due to the strong contrast of highly backscattering blood to the embedding transparent retinal tissue (Dittrich et al., 2009; Schmoll et al., 2011). Excellent results have been achieved by measuring the amount of signal decorrelation, which is a result of structural changes over time. Such structural changes over time occur when erythrocytes change its position during the time between consecutive images. Techniques analyzed the change in speckle structure (Mariampillai et al., 2008), phase (Kim et al., 2011), or the full complex signal over time (An et al., 2010), by calculating signal differences, or variances. In order to observe signal decorrelation even of small capillary flow relatively long time intervals between acquisitions are required, typically more than a few milliseconds. They are equivalent to a few hundred scans per second. Obviously, having such A-scan rate is too slow for in-vivo volumetric imaging. On the other hand, with high speed OCT, it is possible to achieve B-scan rates of several hundred scans per second, which is exactly the timing needed for high sensitive flow contrasting down to the level of smallest retinal capillaries. Thus instead of calculating signal decorrelation between A-scans, one considers successive B-scans or parts of B-scans (Braaf et al., 2012; Grulkowski et al., 2009). Another important factor is the oversampling ratio. Clearly, if the oversampling is too low, signal decorrelation will occur for all structures even without bulk motion, again degrading the blood flow contrast. This imposes important restrictions concerning the covered angular extent on the retina, as typical imaging times for a full volume should be kept to a few seconds. This is of course different if a tracking system is employed allowing for stitching of several recorded volumes of smaller areas. In this case, the B-scan rate might even be slower, as long as the proper correlation between two acquisitions for the static bulk tissue is maintained.
High speed OCT has been realized either using a spectrometer based OCT equipped with fast CMOS sensors, or by swept source OCT. An advantage of the latter is the use of higher central wavelengths – just above 1 μm – that offer better penetration into choroidal structures (Hong et al., 2013; Povazay et al., 2003; Yasuno et al., 2007). Imaging choroidal perfusion and vasculature is of particular interest for retinal diseases involving choroidal neovascularization.
Fig. 17 demonstrates the strategy for calculating high motion sensitive DOCT angiographies. Several B-scans are recorded at each vertical position at a rate of one to a few hundred Hz (Fig. 17(a)). The signal changes over time are then analyzed in post-processing, and used for calculating a motion contrast volume (Blatter et al., 2012). Most appropriate for swept source OCT is to analyze changes in the intensity signal rather than the phase signal. In order to contrast moving structures one calculates intensity differences between successive logarithmically scaled tomograms. Static tissue will ideally cancel out, whereas dynamically changing structures, that cause fluctuations in intensity, remain (Fig. 17 (b)). Averaging over the difference tomograms obtained at the same vertical position y can enhance the motion contrast. It is, however, important to exclude the difference tomograms with excessive bulk motion artifacts, due to involuntary patient motion. The contrasted vascular network is usually best appreciated from en-face views. They are easily obtained by integrating the difference signatures over selected depth ranges. Fig. 17(d) shows a resulting OCT angiogram from the inner retina integrated over the retinal nerve fiber layer down to the outer nuclear layer. Even small capillaries are visible in the parafoveal region, allowing for precise assessment of the size of the foveal avascular zone.
Fig. 17.

(a) Recording scheme for DOCT angiography; (b) Calculated 3D DOCT angiogram; (c) taking the en-face projection by e.g. plotting the maximum intensity results in comprehensive en-face angiography maps; (d) zoomed region of dotted box in (b) showing the signal decorrelation tails below vessels.
For 3D visualization of the vascular structure one needs, however, to deal with axial shadowing artifacts. The appearance of speckle decorrelation tails below a vessel is a distinct feature of highly sensitive motion contrast techniques. The light scattered below the vessel needs to cross the strongly scattering blood volume. Multiple scattering together with the dynamic inhomogeneous refractive index distribution within the vessel lumen causes phase as well as speckle decorrelation even for light backscattered from static structures below the vessel. The difference tomogram in Fig. 17(d) gives an impression, how those artifacts appear and how they obscure signatures from lower tomogram regions. Using the intensity information for weighting or even masking can reduce this artifact and allows displaying 3D rendered angiograms.
An interesting feature of using the phase variance for motion contrast is to have a rough estimate about the blood velocity in these small vessels. We have already seen in chapter 1.1 that the phase difference is proportional to the axial flow velocity. Calculating the phase variance is even independent of the Doppler angle for flat vessel beds, which cover most of the inner retina, including also the choriocapillaris. Quantitative assessment of the velocity needs, however, fast scan rates in order to avoid complete decorrelation of flow signals. Recent developments demonstrated wide field quantitative DOCT angiographies with large velocity bandwidths for well-fixated samples (Lee et al., 2012). Those methods are not yet easily applicable for retinal imaging, due to the required B-scan speeds of more than 1 kHz, but can be expected to gain a major role for future technological developments in DOCT.
1.3. Noise and artifacts in Doppler OCT
Noise is a limiting factor for both the velocity resolution and motion sensitivity in DOCT. As mentioned above the minimal resolvable Doppler velocity is proportional to the phase noise of the OCT system, which depends on the SNR of the OCT system and on the scanning procedure. For the latter the phase noise will depend on the amount of signal correlation between considered scans (Park et al., 2005). Standard OCT scanning of commercial platforms uses typically 256 or 512 sampling points or A-scans for one B-scan. Covering 20° (equal to approximately 6 mm) on the retina results in a distance between scanning points of about 12 μm–25 μm. This is in the order of the laser spot size on the retina. Thus the signals of two adjacent scanning points will be mostly decorrelated independent of whether static or dynamic structures are considered. When performing DOCT measurements it is therefore important to keep a good degree of lateral oversampling. As mentioned above the oversampling determines the amount of phase noise introduced by scanning that usually dominates over the previously mentioned SNR limited phase noise. On the other hand, measurement times need to be kept small for in-vivo imaging to avoid large motion artifacts. Hence there is a balancing between DOCT sensitivity and measurement time. This can also be put as balancing between DOCT sensitivity and covered field of view.
An intrinsic artifact of spectrometer based DOCT is interference fringe wash-out (Bachmann et al., 2007; Yun et al., 2004). The Fourier domain OCT signal is recorded with a spectrometer and the modulation frequency of this signal is determined by the axial position of the scattering structure. In case this structure, e.g. red blood cells, moves axially, the frequency of these interference fringes changes. Clearly, if those changes appear during exposure of the camera that records the spectral interference pattern blurring takes place. This is analogous to blurring in photography, when moving objects are imaged. Obviously, the amount of blurring depends on the relation between exposure time and object velocity. Signal blurring, or fringe wash-out, causes in the extreme case complete vanishing of fast moving structures in the OCT intensity tomograms. At those positions, the velocity cannot be assessed anymore. Thus, in particular for arteries with high systolic peak velocities, the central part of the assessed velocity profile is often dominated by noise. Calculating the average velocity across the vessel area will then result in underestimation. If one assumes parabolic flow profiles, the missing velocity values can be reconstructed (Singh et al., 2010), although it is unclear whether parabolic flow profiles can be expected in all retinal vessel. This fringe wash-out artifact is, however, not present with swept source OCT systems, leading in general to more reliable flow calculation (Hendargo et al., 2011).
For quantitative DOCT the velocity is in general determined from phase differences (chap 1.1). The phase difference however is only unambiguous within [−π, π], which sets the limit for the maximum velocity as mentioned above. Beyond this range, phase wrapping appears. This is demonstrated in Fig. 18. As the velocity across the vessel increases it finally crosses the unambiguous velocity range. As a result it re-appears wrapped at the lower velocity boundary. If the initial direction of the velocity profile is known, one can easily unwrap single phase wraps by adding or subtracting 2π. With multiple phase wraps this simple method fails, and more sophisticated approaches are needed. Proper selection of the scanning rate or the analysis interval can, however, in general avoid multiple phase wrapping artifacts (Blatter et al., 2013a; Meemon and Rolland, 2010).
Fig. 18.
Correction for phase-wrapping artifacts. (lhs) Phase tomogram with wrapping artifacts in positive phase shift direction in the vessel center. (rhs) Phase tomogram after unwrapping (reproduced with permission from Werkmeister et al., 2012a).
2. Applications
2.1. Applications of measuring blood flow using Doppler OCT
As mentioned in the introduction section, there is a significant interest in quantifying blood flow in the retina in a variety of ocular diseases. So far only few studies looked into blood flow alterations in pathological situations, but results are promising. Wang et al. (2009a) reported reduced total retinal blood flow in a patient with type 2 diabetes with no retinopathy as well as in a patient with type 1 diabetes with quiescent proliferative diabetic retinopathy after vitrectomy and panretinal photocoagulation. Reduced retinal blood flow was also observed in 5 patients with proliferative diabetic retinopathy after laser photocoagulation (Wang et al., 2011b).
In patients with glaucoma, reduced retinal blood flow was reported, with a strong degree of correlation between the reduction in blood flow and the loss of visual field (Wang et al., 2011b). Recently, it was reported that local retinal blood flow is significantly reduced in the abnormal retinal hemifield of glaucomatous eyes with single-hemifield damage and associated with structural changes in this region (Sehi et al., 2014). Reduced retinal blood flow was also reported in patients with nonarteritic ischemic optic neuropathy (NAION) and branch retinal vein occlusion (BRVO), with more pronounced reductions in the more affected hemisphere (Wang et al., 2011b).
In the retina, blood flow and neural activation are tightly coupled. This is a phenomenon that is well known in the brain and called neurovascular coupling (Attwell et al., 2010). When neurons become active a local increase in blood flow is observed. The mechanisms underlying this response are not fully explored, but involve the release of vasoactive mediators from neurons and astrocytes (Attwell et al., 2010). In the retina, this phenomenon exists as well (Kur et al., 2012; Newman, 2013; Riva et al., 2005) and can for instance be investigated when the retina is stimulated with diffuse luminance flicker. The increase in retinal blood flow is pronounced and values in the order of 45%–60% were reported using different methodologies (Garhofer et al., 2004a; Michelson et al., 2002). Interestingly, flicker-induced changes in retinal hemodynamics appear to be disturbed early in patients with diabetes (Bek et al., 2008; Garhofer et al., 2004c; Lasta et al., 2013; Lecleire-Collet et al., 2011; Nguyen et al., 2009a,b; Pemp et al., 2009a; Pemp et al., 2009b) as well as in patients with glaucomatous optic neuropathy (Garhofer et al., 2004b; Gugleta et al., 2012, 2013a,b; Mroczkowska et al., 2013; Riva et al., 2004). An increase in retinal vessel diameter, retinal blood velocity and retinal blood flow was also observed using DOCT during flicker stimulation (Leitgeb, 2007). An average increase in total retinal blood flow of 22% was reported after flicker stimulation with 8 Hz (Wang et al., 2011a).
2.2. Application of lable-free retinal Optical Angiography
In chapter 1.2 we have seen how to obtain high sensitive 3D angiographic maps using the concept of signal decorrelation. The present chapter aims at outlining the potential applications of OCT angiography and its advantages and drawbacks when compared to the gold standard – fluorescein angiography. Let's start with the most critical point: OCT angiography is a motion contrast technique. Vascular leakage is one of the most important features of retinal vascular pathology that can be observed by FA, but is difficult to be seen at early stages with OCT angiography. As soon as those leakage areas are detected in intensity based OCT tomograms, this advantage of fluorescein angiography is, however, lost. Many pathologies of the eye go along with other vascular alterations in parallel to leakage, which can be monitored using DOCT technology and its different sub-modalities. A main advantage of DOCT technology relates to the ability of OCT to provide depth resolved tissue architecture. This allows for rendering a 3-dimensional representation of the retinal and choroidal vascular architecture in the recorded field of view with high axial and lateral resolution. Retinal vascular pathologies, which involve changes to the vascular network itself, can therefore be recorded and monitored. Furthermore different vascular beds are separately accessible. In the posterior pole of the eye the retinal vasculature receives its input from the central retinal artery. On the other hand, the choroidal perfusion receives its input through the posterior ciliary arteries. Adequate separation of these vascular structures is of importance because they supply different retinal structures, follow different perfusion control mechanisms and are differentially affected by retinal diseases.
The most important advantage of OCT angiography is the property of being label-free. Given the risk associated with the administration of dyes in fluorescence angiography and the significant workload associated with this procedure a truly non-invasive procedure such as DOCT is highly welcome. Another advantage of DOCT relates to its easy operation and short measurement time, a feature that was already important when classical OCT found its way into clinical routine. This allows for both cutting down costs as well as opening the possibility of screening large populations. The latter may have a strong socioeconomic benefit although further studies on the specificity and sensitivity are required.
In order to maintain competitiveness of OCT angiography with fluorescein angiography, the field of view (FOV) should at least be the comparable. As outlined in chapter 1.2, dense sampling is important for high contrast of the vasculature with respect to static tissue. With commercially available swept sources that operate at 100 kHz, patches of slightly more than 10° can be covered. Larger FOV requires stitching of small patches. This is time consuming and works best in conjunction with retinal tracking. The only free parameter to overcome this limitation is imaging speed, i.e., to increase the A-scan rate. In order to achieve a standard FOV of 30° and more with a single recording it is necessary to achieve A-scan rates close to 1 MHz and more. The fastest swept source OCT systems employ Fourier domain mode locked (FDML) laser sources. Retinal imaging has been demonstrated with up to 3 MHz A-scan rates at a center wavelength of 1060 nm. Such a system operating at a frame rate of 1.68 Hz has recently been employed to perform OCT angiography (Blatter et al., 2012). The resulting contrasted vasculature within a patch of close to 50° FOV is shown in Fig. 19. A standard OCT intensity fundus projection in Fig. 19(a) demonstrates the achieved wide field of view. Applying the decorrelation contrasting scheme to the intensity data and using a depth encoded color representation as indicated in Fig. 19(b), the vascular architecture over the full wide field of view can be appreciated (Fig. 19(c)). Within the indicated boxes both inner retinal vasculature but also deeper choroidal vessels are well visible.
Fig. 19.

50 × 50° wide field OCT angiography: (a) OCT intensity fundus projection; (b) tomogram cross section at indicated (white line) vertical position in (a). the colors denote the depth sections for which OCT angiogram projections are taken, and combined for the RGB representation in (c). (c) OCT angiogram with color-coded depth; boxes I and II indicate large and small choroidal vasculature, respectively, (green, blue) visible together with inner retinal vasculature (red). (reproduced with permission from Blatter et al., 2012).
Reducing the scanned FOV allows a detailed map of small capillaries in the parafoveal region as shown in Fig. 20(b). Fig. 20(c) shows the projection en-face view of the choriocapillaris which exhibits a dense vascular network architecture that compares well to results obtained in-vitro with confocal microscopy.
Fig. 20.

(a) OCT fundus projection of 12 × 12° Field of view. (b) OCT angiogram of the same patch. The projection is taken from the retinal nerve fiber layer down to the outer nuclear layer. (c) Projection from just below retinal pigment epithelium down to the choroid. The dense choriocapillaris network is well appreciated (reproduced from Blatter et al., 2012 with permission).
From Fig. 20(b) one can clearly recognize the shape of the foveal avascular zone. A widening of this area has been described as a sign of diabetic retinopathy (Alipour et al., 2012; Conrath et al., 2005). Currently, the assessment of the foveal avascular zone is performed by fluorescein angiography or fundus photography (Ahmad Fadzil et al., 2010; Shin et al., 2012; Zheng et al., 2010), providing a two-dimensional projection of the vessel structure only. OCT angiography, however, provides a high-resolution three-dimensional representation of this zone. The clinical advantage of this application of DOCT needs to be evaluated in further studies.
Another quantitative parameter that can be assessed is the fractal index of the vascular tree, which has for example been used for quantitative assessment of diabetic retinopathy (Cheung et al., 2012b, 2009). Characteristic features are vascular closure, vessel dropout and capillary bed defects leading to ischemia. Those features are also present in other retinal pathologies and the clinical use of fractal analysis has been shown in different contexts (Schmoll et al., 2011). It has recently been applied to parafoveal retinal capillary structure that was extracted from OCT intensity data using a vessel filter algorithm. Preliminary results are promising showing a difference in fractal index between healthy and telangiectasia-affected structures. Apart from the fractal index further angiographic parameters are accessible through motion contrast. Such conditions include missing capillary signatures due to blockage and ischemia, increased vascular tortuosity, increased branching angles, narrowing of arterioles and venules, displacement and deformation (arteriovenous nicking) at arteriovenous crossings. Some of those signs might be already available through fundus photography, or scanning laser ophthalmoscopy and further studies are required to elucidate how much OCT angiography can add to this. For the choroidal vessels and the choriocapillaris, which are difficult to visualize with standard techniques including intensity-based OCT, OCT angiography holds specific promise. Undoubtedly, non-invasive visualization of the choroid would dramatically improve the diagnostic capabilities of OCT. Hence, even though current DOCT angiographic methods fail to show vascular leakage as compared to FA, there are a multitude of other parameters based on the vessel morphology which may serve as early indicators for retinal, systemic and general vascular diseases.
In Fig. 21 the capability of OCT angiography for contrasting the perfusion of the optic nerve head region, and in particular of the lamina cribrosa is demonstrated. The latter has been hypothesized to play a central role in the development of glaucoma (Burgoyne, 2011). Fig. 21 (a) shows a 3D rendered angiogram of the full optic nerve head region. Changes of the optic nerve head vessel structure are furthermore common for central neuropathies such as multiple sclerosis. The detailed vascular architecture of the lamina cribrosa region is displayed in Fig. 21(b).
Fig. 21.
(a) 3D rendered OCT angiogram of optic nerve head region, with an OCT fundus projection image below; (b) Zoomed OCT angiogram of lamina cribrosa architecture; Field of View 8 × 8°.
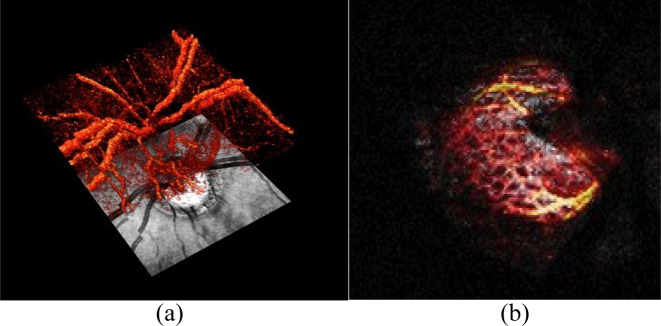
Angiographic techniques based on OCT have also been used to image macular pathologies (Hong et al., 2013). Images of a patient with myopic choroidal neovascularization are shown in Fig. 22. In the en face structural OCT image the region of RPE elevation is characterized by hyperscattering (Fig. 22(d)). In the DOCT angiogram hyper-Doppler signals are observed in this area as indicated by the arrows (Fig. 22(e)).
Fig. 22.

Right macular images of a 45-year-old man with choroidal neovascularization secondary to myopia. (a) Color fundus image. (b) Fluorescein angiography (late-phase). (c) indocyanine green angiography (mid-phase). (d) En face projections of structural OCT. (e) En face projections of high-sensitive OCT angiography (reproduced from Hong et al., 2013 with permission).
Another example is presented in Fig. 23. The left eye of a patient with age-related macular degeneration is presented. The active choroidal neovascularization is evident from both the fluorescein angiogram and the ICG angiogram. In the OCT en face projection (Fig. 4(d)), drusen can be identified as hyperscattering spots. The choroidal vasculature around the choroidal neovascularization appears as a hyperscattering signal (red arrow inside a circle), while other choroidal vessels in non-pathologic regions generally appeared with hypo scattering, as indicated by a yellow arrow. The latter is caused by the deeper penetration beneath the choroidal vessels around the choroidal neovascularization. The DOCT angiogram (Fig. 4(e)) shows structures that are similar to those shown in the mid-phase of the ICG angiogram (Fig. 4(c)) even with higher contrast.
Fig. 23.

Left macular images of a 62-year-old man with age-related macular degeneration. (a) Color fundus image. (b) Fluorescein angiography (late-phase). (c) ICG angiography (mid-phase). (d) En face projection of structural OCT. (e) En face projections of high-sensitive OCT angiography (reproduced from Hong et al., 2013 with permission).
3. Conclusions and future directions
The history of DOCT dates back to the late 1990s. In the last years the development has increased rapidly due to technical innovations and sophisticated acquisition procedures. Phase sensitive analysis of the OCT signal bears significant potential for quantifying blood flow in the retina. Several techniques were proposed to overcome the problem of Doppler angle ambiguity. With those approaches values of total retinal blood flow were published that are in the range of those reported previously. Another major achievement of OCT relates to the improvement in acquisition speed, which was mainly achieved via the introduction of swept source OCT. This has particularly changed our ability to record retinal angiograms with DOCT. Recent innovations have, however, allowed the recording of wide field angiograms, providing in contrast to fluorescein angiography three-dimensional information of the vasculature without the need of any dye.
What can we expect from DOCT in the future? Obviously the technique holds promise for quantifying retinal blood flow. Which of the proposed techniques is best for clinical applications remains unclear to date. Further studies on reproducibility and validity are required to answer this question. Whereas the former can easily be studied the later is more difficult due to the lack of a gold standard technique. In the next years we also may expect a large variety of studies in patients with ocular disease. Quantifying retinal blood flow may have a role in diagnostics, risk stratification, disease monitoring and assessing the effects of therapeutic interventions. Longitudinal studies are, however, required to proof these hypotheses.
Will OCT angiography replace classical fluorescence angiography? The answer is most likely yes. Advantages related to acquisition speed and the omission of the fluorescent dye are striking. Reducing the time required for angiography will be associated with reduced costs and avoiding potentially toxic dyes will decrease the risk for the patient and reduce the time per patient for the physician. The problem that leakage is currently not accessible using DOCT may limit the application, but approaches may exist to overcome this problem. A significant advantage of OCT angiography is that it provides three-dimensional information. The clinical advantages of this approach will most likely be fully explored in the next years.
Acknowledgments
Part of the experimental work mentioned in this article was supported by the following grants: Fonds zur Förderung der Wissenschaftlichen Forschung (FWF), Projects No. P21570FW and P21406FW, Die Österreichische Forschungsförderungsgesellschaft (FFG) project FA 607A0502, Christian Doppler Laboratory for Laser Development and their Application in Medicine. The authors thank Dr. Doreen Schmidl for her help in preparing this manuscript.
References
- Ahmad Fadzil M.H., Izhar L.I., Nugroho H.A. Determination of foveal avascular zone in diabetic retinopathy digital fundus images. Comput. Biol. Med. 2010;40:657–664. doi: 10.1016/j.compbiomed.2010.05.004. [DOI] [PubMed] [Google Scholar]
- Alipour S.H., Rabbani H., Akhlaghi M., Dehnavi A.M., Javanmard S.H. Analysis of foveal avascular zone for grading of diabetic retinopathy severity based on curvelet transform. Graefes Arch. Clin. Exp. Ophthalmol. 2012;250:1607–1614. doi: 10.1007/s00417-012-2093-6. [DOI] [PubMed] [Google Scholar]
- An L., Qin J., Wang R.K. Ultrahigh sensitive optical microangiography for in vivo imaging of microcirculations within human skin tissue beds. Opt. Express. 2010;18:8220–8228. doi: 10.1364/OE.18.008220. [DOI] [PMC free article] [PubMed] [Google Scholar]
- An L., Wang R.K. In vivo volumetric imaging of vascular perfusion within human retina and choroids with optical micro-angiography. Opt. Express. 2008;16:11438–11452. doi: 10.1364/oe.16.011438. [DOI] [PubMed] [Google Scholar]
- Attwell D., Buchan A.M., Charpak S., Lauritzen M., Macvicar B.A., Newman E.A. Glial and neuronal control of brain blood flow. Nature. 2010;468:232–243. doi: 10.1038/nature09613. [DOI] [PMC free article] [PubMed] [Google Scholar]
- Bachmann A.H., Villiger M.L., Blatter C., Lasser T., Leitgeb R.A. Resonant Doppler flow imaging and optical vivisection of retinal blood vessels. Opt. Express. 2007;15:408–422. doi: 10.1364/oe.15.000408. [DOI] [PubMed] [Google Scholar]
- Baumann B., Potsaid B., Kraus M.F., Liu J.J., Huang D., Hornegger J., Cable A.E., Duker J.S., Fujimoto J.G. Total retinal blood flow measurement with ultrahigh speed swept source/Fourier domain OCT. Biomed. Opt. Express. 2011;2:1539–1552. doi: 10.1364/BOE.2.001539. [DOI] [PMC free article] [PubMed] [Google Scholar]
- Bek T., Hajari J., Jeppesen P. Interaction between flicker-induced vasodilatation and pressure autoregulation in early retinopathy of type 2 diabetes. Graefes Arch. Clin. Exp. Ophthalmol. 2008;246:763–769. doi: 10.1007/s00417-008-0766-y. [DOI] [PubMed] [Google Scholar]
- Blatter C., Coquoz S., Grajciar B., Singh A.S.G., Bonesi M., Werkmeister R.M., Schmetterer L., Leitgeb R.A. Dove prism based rotating dual beam bidirectional Doppler OCT. Biomed. Opt. Express. 2013;4:1188–1203. doi: 10.1364/BOE.4.001188. [DOI] [PMC free article] [PubMed] [Google Scholar]
- Blatter C., Grajciar B., Schmetterer L., Leitgeb R.A. Angle independent flow assessment with bidirectional Doppler optical coherence tomography. Opt. Lett. 2013;38:4433–4436. doi: 10.1364/OL.38.004433. [DOI] [PubMed] [Google Scholar]
- Blatter C., Klein T., Grajciar B., Schmoll T., Wieser W., Andre R., Huber R., Leitgeb R.A. Ultrahigh-speed non-invasive widefield angiography. J. Biomed. Opt. 2012;17:070505. doi: 10.1117/1.JBO.17.7.070505. [DOI] [PubMed] [Google Scholar]
- Braaf B., Vermeer K.A., Vienola K.V., de Boer J.F. Angiography of the retina and the choroid with phase-resolved OCT using interval-optimized backstitched B-scans. Opt. Express. 2012;20:20516–20534. doi: 10.1364/OE.20.020516. [DOI] [PubMed] [Google Scholar]
- Burgoyne C.F. A biomechanical paradigm for axonal insult within the optic nerve head in aging and glaucoma. Exp. Eye Res. 2011;93:120–132. doi: 10.1016/j.exer.2010.09.005. [DOI] [PMC free article] [PubMed] [Google Scholar]
- Chen Z., Milner T.E., Srinivas S., Wang X., Malekafzali A., van Gemert M.J., Nelson J.S. Noninvasive imaging of in vivo blood flow velocity using optical Doppler tomography. Opt. Lett. 1997;22:1119–1121. doi: 10.1364/ol.22.001119. [DOI] [PubMed] [Google Scholar]
- Cherecheanu A.P., Garhofer G., Schmidl D., Werkmeister R., Schmetterer L. Ocular perfusion pressure and ocular blood flow in glaucoma. Curr. Opin. Pharmacol. 2013;13:36–42. doi: 10.1016/j.coph.2012.09.003. [DOI] [PMC free article] [PubMed] [Google Scholar]
- Cheung C.Y., Ikram M.K., Sabanayagam C., Wong T.Y. Retinal microvasculature as a model to study the manifestations of hypertension. Hypertension. 2012;60:1094–1103. doi: 10.1161/HYPERTENSIONAHA.111.189142. [DOI] [PubMed] [Google Scholar]
- Cheung C.Y., Lamoureux E., Ikram M.K., Sasongko M.B., Ding J., Zheng Y., Mitchell P., Wang J.J., Wong T.Y. Retinal vascular geometry in Asian persons with diabetes and retinopathy. J. Diabetes Sci. Technol. 2012;6:595–605. doi: 10.1177/193229681200600315. [DOI] [PMC free article] [PubMed] [Google Scholar]
- Cheung N., Donaghue K.C., Liew G., Rogers S.L., Wang J.J., Lim S.W., Jenkins A.J., Hsu W., Li Lee M., Wong T.Y. Quantitative assessment of early diabetic retinopathy using fractal analysis. Diabetes Care. 2009;32:106–110. doi: 10.2337/dc08-1233. [DOI] [PMC free article] [PubMed] [Google Scholar]
- Choi W., Baumann B., Liu J.J., Clermont A.C., Feener E.P., Duker J.S., Fujimoto J.G. Measurement of pulsatile total blood flow in the human and rat retina with ultrahigh speed spectral/Fourier domain OCT. Biomed. Opt. Express. 2012;3:1047–1061. doi: 10.1364/BOE.3.001047. [DOI] [PMC free article] [PubMed] [Google Scholar]
- Clermont A.C., Bursell S.E. Retinal blood flow in diabetes. Microcirculation. 2007;14:49–61. doi: 10.1080/10739680601072164. [DOI] [PubMed] [Google Scholar]
- Conrath J., Giorgi R., Raccah D., Ridings B. Foveal avascular zone in diabetic retinopathy: quantitative vs qualitative assessment. Eye (Lond.) 2005;19:322–326. doi: 10.1038/sj.eye.6701456. [DOI] [PubMed] [Google Scholar]
- Costa V.P., Harris A., Anderson D., Stodtmeister R., Cremasco F., Kergoat H., Lovasik J., Stalmans I., Zeitz O., Lanzl I., Gugleta K., Schmetterer L. Ocular perfusion pressure in glaucoma. Acta Ophthalmol. 2013 Nov 18 doi: 10.1111/aos.12298. [Epub ahead of print] [DOI] [PubMed] [Google Scholar]
- Dai C., Liu X., Zhang H.F., Puliafito C.A., Jiao S. Absolute retinal blood flow measurement with a dual-beam Doppler optical coherence tomography. Investig. Ophthalmol. Vis. Sci. 2013;54:7998–8003. doi: 10.1167/iovs.13-12318. [DOI] [PMC free article] [PubMed] [Google Scholar]
- Dave D.P., Milner T.E. Doppler-angle measurement in highly scattering media. Opt. Lett. 2000;25:1523–1525. doi: 10.1364/ol.25.001523. [DOI] [PubMed] [Google Scholar]
- Dimitrova G., Kato S. Color Doppler imaging of retinal diseases. Surv. Ophthalmol. 2010;55:193–214. doi: 10.1016/j.survophthal.2009.06.010. [DOI] [PubMed] [Google Scholar]
- Dittrich E., Neji R., Schmoll T., Schriefl S., Ahlers C., Leitgeb R., Langs G. Detection of Capillary Vessels in Optical Coherence Tomography Based on a Probabilistic Kernel. In: Dehmeshki J., Hoppe A., D.Greenhill, editors. Proc. 13th Annual Meeting, Medical Image Understanding and Analysis. Kingston University UK; 2009. pp. 37–41. [Google Scholar]
- Doblhoff-Dier V., Schmetterer L., Vilser W., Garhofer G., Gröschl M., Leitgeb R.A., Werkmeister R.M. Measurement of the total retinal blood flow using dual beam Fourier-domain Doppler optical coherence tomography with orthogonal detection planes. Biomed. Opt. Express. 2014 Jan 28;5(2):630–642. doi: 10.1364/BOE.5.000630. [DOI] [PMC free article] [PubMed] [Google Scholar]
- Drexler W., Fujimoto J.G. State-of-the-art retinal optical coherence tomography. Prog. Retin Eye Res. 2008;27:45–88. doi: 10.1016/j.preteyeres.2007.07.005. [DOI] [PubMed] [Google Scholar]
- Durham J.T., Herman I.M. Microvascular modifications in diabetic retinopathy. Curr. Diabetes Rep. 2011;11:253–264. doi: 10.1007/s11892-011-0204-0. [DOI] [PubMed] [Google Scholar]
- Ehrlich R., Kheradiya N.S., Winston D.M., Moore D.B., Wirostko B., Harris A. Age-related ocular vascular changes. Graefes Arch. Clin. Exp. Ophthalmol. 2009;247:583–591. doi: 10.1007/s00417-008-1018-x. [DOI] [PubMed] [Google Scholar]
- Feigl B. Age-related maculopathy – linking aetiology and pathophysiological changes to the ischaemia hypothesis. Prog. Retin Eye Res. 2009;28:63–86. doi: 10.1016/j.preteyeres.2008.11.004. [DOI] [PubMed] [Google Scholar]
- Fercher A.F., Hitzenberger C.K., Kamp G., El-Zaiat S.Y. Measurement of intraocular distances by backscattering spectral interferometry. Opt. Commun. 1995;117:43–48. [Google Scholar]
- Garhofer G., Bek T., Boehm A.G., Gherghel D., Grunwald J., Jeppesen P., Kergoat H., Kotliar K., Lanzl I., Lovasik J.V., Nagel E., Vilser W., Orgul S., Schmetterer L. Use of the retinal vessel analyzer in ocular blood flow research. Acta Ophthalmol. 2010;88:717–722. doi: 10.1111/j.1755-3768.2009.01587.x. [DOI] [PubMed] [Google Scholar]
- Garhofer G., Werkmeister R., Dragostinoff N., Schmetterer L. Retinal blood flow in healthy young subjects. Investig. Ophthalmol. Vis. Sci. 2012;53:698–703. doi: 10.1167/iovs.11-8624. [DOI] [PubMed] [Google Scholar]
- Garhofer G., Zawinka C., Resch H., Huemer K.H., Dorner G.T., Schmetterer L. Diffuse luminance flicker increases blood flow in major retinal arteries and veins. Vis. Res. 2004;44:833–838. doi: 10.1016/j.visres.2003.11.013. [DOI] [PubMed] [Google Scholar]
- Garhofer G., Zawinka C., Resch H., Huemer K.H., Schmetterer L., Dorner G.T. Response of retinal vessel diameters to flicker stimulation in patients with early open angle glaucoma. J. Glaucoma. 2004;13:340–344. doi: 10.1097/00061198-200408000-00013. [DOI] [PubMed] [Google Scholar]
- Garhofer G., Zawinka C., Resch H., Kothy P., Schmetterer L., Dorner G.T. Reduced response of retinal vessel diameters to flicker stimulation in patients with diabetes. Br. J. Ophthalmol. 2004;88:887–891. doi: 10.1136/bjo.2003.033548. [DOI] [PMC free article] [PubMed] [Google Scholar]
- Grulkowski I., Gorczynska I., Szkulmowski M., Szlag D., Szkulmowska A., Leitgeb R.A., Kowalczyk A., Wojtkowski M. Scanning protocols dedicated to smart velocity ranging in Spectral OCT. Opt. Express. 2009;17:23736–23754. doi: 10.1364/OE.17.023736. [DOI] [PubMed] [Google Scholar]
- Gugleta K., Kochkorov A., Waldmann N., Polunina A., Katamay R., Flammer J., Orgul S. Dynamics of retinal vessel response to flicker light in glaucoma patients and ocular hypertensives. Graefes Arch. Clin. Exp. Ophthalmol. 2012;250:589–594. doi: 10.1007/s00417-011-1842-2. [DOI] [PubMed] [Google Scholar]
- Gugleta K., Turksever C., Polunina A., Orgul S. Effect of ageing on the retinal vascular responsiveness to flicker light in glaucoma patients and in ocular hypertension. Br. J. Ophthalmol. 2013;97:848–851. doi: 10.1136/bjophthalmol-2012-302779. [DOI] [PubMed] [Google Scholar]
- Gugleta K., Waldmann N., Polunina A., Kochkorov A., Katamay R., Flammer J., Orgul S. Retinal neurovascular coupling in patients with glaucoma and ocular hypertension and its association with the level of glaucomatous damage. Graefes Arch. Clin. Exp. Ophthalmol. 2013;251:1577–1585. doi: 10.1007/s00417-013-2276-9. [DOI] [PubMed] [Google Scholar]
- Hendargo H.C., McNabb R.P., Dhalla A.-H., Shepherd N., Izatt J.A. Doppler velocity detection limitations in spectrometer-based versus swept-source optical coherence tomography. Biomed. Opt. Express. 2011;2:2175–2188. doi: 10.1364/BOE.2.002175. [DOI] [PMC free article] [PubMed] [Google Scholar]
- Hong Y.J., Miura M., Makita S., Ju M.J., Lee B.H., Iwasaki T., Yasuno Y. Noninvasive investigation of deep vascular pathologies of exudative macular diseases by high-penetration optical coherence angiography. Investig. Ophthalmol. Vis. Sci. 2013;54:3621–3631. doi: 10.1167/iovs.12-11184. [DOI] [PubMed] [Google Scholar]
- Huber R., Adler D.C., Srinivasan V.J., Fujimoto J.G. Fourier domain mode locking at 1050 nm for ultra-high-speed optical coherence tomography of the human retina at 236,000 axial scans per second. Opt. Lett. 2007;32:2049–2051. doi: 10.1364/ol.32.002049. [DOI] [PubMed] [Google Scholar]
- Huber R., Wojtkowski M., Fujimoto J.G. Fourier Domain Mode Locking (FDML): a new laser operating regime and applications for optical coherence tomography. Opt. Express. 2006;14:3225–3237. doi: 10.1364/oe.14.003225. [DOI] [PubMed] [Google Scholar]
- Iftimia N.V., Hammer D.X., Ferguson R.D., Mujat M., Vu D., Ferrante A.A. Dual-beam Fourier domain optical Doppler tomography of zebrafish. Opt. Express. 2008;16:13624–13636. doi: 10.1364/oe.16.013624. [DOI] [PubMed] [Google Scholar]
- Izatt J.A., Kulkarni M.D., Yazdanfar S., Barton J.K., Welch A.J. In vivo bidirectional color Doppler flow imaging of picoliter blood volumes using optical coherence tomography. Opt. Lett. 1997;22:1439–1441. doi: 10.1364/ol.22.001439. [DOI] [PubMed] [Google Scholar]
- Jaillon F., Makita S., Min E.-J., Lee B.H., Yasuno Y. Enhanced imaging of choroidal vasculature by high-penetration and dual-velocity optical coherence angiography. Biomed. Opt. Express. 2011;2:1147–1158. doi: 10.1364/BOE.2.001147. [DOI] [PMC free article] [PubMed] [Google Scholar]
- Jaillon F., Makita S., Yasuno Y. Variable velocity range imaging of the choroid with dual-beam optical coherence angiography. Opt. Express. 2012;20:385–396. doi: 10.1364/OE.20.000385. [DOI] [PubMed] [Google Scholar]
- Kawasaki R., Wang J.J., Rochtchina E., Lee A.J., Wong T.Y., Mitchell P. Retinal vessel caliber is associated with the 10-year incidence of glaucoma: the Blue Mountains Eye Study. Ophthalmology. 2013;120:84–90. doi: 10.1016/j.ophtha.2012.07.007. [DOI] [PubMed] [Google Scholar]
- Kawasaki R., Xie J., Cheung N., Lamoureux E., Klein R., Klein B.E., Cotch M.F., Sharrett A.R., Shea S., Wong T.Y. Retinal microvascular signs and risk of stroke: the Multi-Ethnic Study of Atherosclerosis (MESA) Stroke. 2012;43:3245–3251. doi: 10.1161/STROKEAHA.112.673335. [DOI] [PMC free article] [PubMed] [Google Scholar]
- Kim D.Y., Fingler J., Werner J.S., Schwartz D.M., Fraser S.E., Zawadzki R.J. In vivo volumetric imaging of human retinal circulation with phase-variance optical coherence tomography. Biomed. Opt. Express. 2011;2:1504–1513. doi: 10.1364/BOE.2.001504. [DOI] [PMC free article] [PubMed] [Google Scholar]
- Kolbitsch C., Schmoll T., Leitgeb R.A. Histogram-based filtering for quantitative 3D retinal angiography. J. Biophot. 2009;2:416–425. doi: 10.1002/jbio.200910026. [DOI] [PubMed] [Google Scholar]
- Kulkarni M.D., van Leeuwen T.G., Yazdanfar S., Izatt J.A. Velocity-estimation accuracy and frame-rate limitations in color Doppler optical coherence tomography. Opt. Lett. 1998;23:1057–1059. doi: 10.1364/ol.23.001057. [DOI] [PubMed] [Google Scholar]
- Kur J., Newman E.A., Chan-Ling T. Cellular and physiological mechanisms underlying blood flow regulation in the retina and choroid in health and disease. Prog. Retin Eye Res. 2012;31:377–406. doi: 10.1016/j.preteyeres.2012.04.004. [DOI] [PMC free article] [PubMed] [Google Scholar]
- Lasta M., Pemp B., Schmidl D., Boltz A., Kaya S., Palkovits S., Werkmeister R., Howorka K., Popa-Cherecheanu A., Garhofer G., Schmetterer L. Neurovascular dysfunction precedes neural dysfunction in the retina of patients with type 1 diabetes. Investig. Ophthalmol. Vis. Sci. 2013;54:842–847. doi: 10.1167/iovs.12-10873. [DOI] [PubMed] [Google Scholar]
- Lecleire-Collet A., Audo I., Aout M., Girmens J.F., Sofroni R., Erginay A., Le Gargasson J.F., Mohand-Said S., Meas T., Guillausseau P.J., Vicaut E., Paques M., Massin P. Evaluation of retinal function and flicker light-induced retinal vascular response in normotensive patients with diabetes without retinopathy. Investig. Ophthalmol. Vis. Sci. 2011;52:2861–2867. doi: 10.1167/iovs.10-5960. [DOI] [PubMed] [Google Scholar]
- Lee J., Wu W., Jiang J.Y., Zhu B., Boas D.A. Dynamic light scattering optical coherence tomography. Opt. Express. 2012;20:22262–22277. doi: 10.1364/OE.20.022262. [DOI] [PMC free article] [PubMed] [Google Scholar]
- Leitgeb R., Hitzenberger C., Fercher A. Performance of Fourier domain vs. time domain optical coherence tomography. Opt. Express. 2003;11:889–894. doi: 10.1364/oe.11.000889. [DOI] [PubMed] [Google Scholar]
- Leitgeb R., Schmetterer L.F., Wojtkowski M., Hitzenberger C.K., Sticker M., Fercher A.F. Flow velocity measurements by frequency domain short coherence interferometry. Proc. SPIE. 2002;4619:16–21. [Google Scholar]
- Leitgeb R.A. Engineering in Medicine and Biology Society, 2007. EMBS 2007. 29th Annual International Conference of the IEEE. IEEE; 2007. Optical Coherence Tomography-high resolution imaging of structure and function; pp. 530–532. [DOI] [PubMed] [Google Scholar]
- Lexer F., Hitzenberger C.K., Fercher A.F., Kulhavy M. Wavelength-tuning interferometry of intraocular distances. Appl. Opt. 1997;36:6548–6553. doi: 10.1364/ao.36.006548. [DOI] [PubMed] [Google Scholar]
- Makita S., Fabritius T., Yasuno Y. Quantitative retinal-blood flow measurement with three-dimensional vessel geometry determination using ultrahigh-resolution Doppler optical coherence angiography. Opt. Lett. 2008;33:836–838. doi: 10.1364/ol.33.000836. [DOI] [PubMed] [Google Scholar]
- Makita S., Hong Y., Yamanari M., Yatagai T., Yasuno Y. Optical coherence angiography. Opt. Express. 2006;14:7821–7840. doi: 10.1364/oe.14.007821. [DOI] [PubMed] [Google Scholar]
- Mariampillai A., Standish B.A., Moriyama E.H., Khurana M., Munce N.R., Leung M.K.K., Jiang J., Cable A., Wilson B.C., Vitkin I.A., Yang V.X.D. Speckle variance detection of microvasculature using swept-source optical coherence tomography. Opt. Lett. 2008;33:1530–1532. doi: 10.1364/ol.33.001530. [DOI] [PubMed] [Google Scholar]
- McGeechan K., Liew G., Macaskill P., Irwig L., Klein R., Klein B.E., Wang J.J., Mitchell P., Vingerling J.R., de Jong P.T., Witteman J.C., Breteler M.M., Shaw J., Zimmet P., Wong T.Y. Prediction of incident stroke events based on retinal vessel caliber: a systematic review and individual-participant meta-analysis. Am. J. Epidemiol. 2009;170:1323–1332. doi: 10.1093/aje/kwp306. [DOI] [PMC free article] [PubMed] [Google Scholar]
- Meemon P., Rolland J.P. Swept-source based, single-shot, multi-detectable velocity range Doppler optical coherence tomography. Biomed. Opt. Express. 2010;1:955–966. doi: 10.1364/BOE.1.000955. [DOI] [PMC free article] [PubMed] [Google Scholar]
- Michaely R., Bachmann A.H., Villiger M.L., Blatter C., Lasser T., Leitgeb R.A. Vectorial reconstruction of retinal blood flow in three dimensions measured with high resolution resonant Doppler Fourier domain optical coherence tomography. J. Biomed. Opt. 2007;12:041213. doi: 10.1117/1.2771553. [DOI] [PubMed] [Google Scholar]
- Michelson G., Patzelt A., Harazny J. Flickering light increases retinal blood flow. Retina. 2002;22:336–343. doi: 10.1097/00006982-200206000-00013. [DOI] [PubMed] [Google Scholar]
- Mozaffarieh M., Flammer J. New insights in the pathogenesis and treatment of normal tension glaucoma. Curr. Opin. Pharmacol. 2013;13:43–49. doi: 10.1016/j.coph.2012.10.001. [DOI] [PubMed] [Google Scholar]
- Mroczkowska S., Benavente-Perez A., Negi A., Sung V., Patel S.R., Gherghel D. Primary open-angle glaucoma vs normal-tension glaucoma: the vascular perspective. JAMA Ophthalmol. 2013;131:36–43. doi: 10.1001/2013.jamaophthalmol.1. [DOI] [PubMed] [Google Scholar]
- Newman E.A. Functional hyperemia and mechanisms of neurovascular coupling in the retinal vasculature. J. Cereb. Blood Flow Metab. 2013;33:1685–1695. doi: 10.1038/jcbfm.2013.145. [DOI] [PMC free article] [PubMed] [Google Scholar]
- Nguyen T.T., Kawasaki R., Kreis A.J., Wang J.J., Shaw J., Vilser W., Wong T.Y. Correlation of light-flicker-induced retinal vasodilation and retinal vascular caliber measurements in diabetes. Investig. Ophthalmol. Vis. Sci. 2009;50:5609–5613. doi: 10.1167/iovs.09-3442. [DOI] [PubMed] [Google Scholar]
- Nguyen T.T., Kawasaki R., Wang J.J., Kreis A.J., Shaw J., Vilser W., Wong T.Y. Flicker light-induced retinal vasodilation in diabetes and diabetic retinopathy. Diabetes Care. 2009;32:2075–2080. doi: 10.2337/dc09-0075. [DOI] [PMC free article] [PubMed] [Google Scholar]
- Nguyen T.T., Wong T.Y. Retinal vascular changes and diabetic retinopathy. Curr. Diab Rep. 2009;9:277–283. doi: 10.1007/s11892-009-0043-4. [DOI] [PubMed] [Google Scholar]
- Park B., Pierce M.C., Cense B., Yun S.H., Mujat M., Tearney G., Bouma B., de Boer J. Real-time fiber-based multi-functional spectral-domain optical coherence tomography at 1.3 microm. Opt. Express. 2005;13:3931–3944. doi: 10.1364/opex.13.003931. [DOI] [PubMed] [Google Scholar]
- Pedersen C.J., Huang D., Shure M.A., Rollins A.M. Measurement of absolute flow velocity vector using dual-angle, delay-encoded Doppler optical coherence tomography. Opt. Lett. 2007;32:506–508. doi: 10.1364/ol.32.000506. [DOI] [PubMed] [Google Scholar]
- Pemp B., Garhofer G., Weigert G., Karl K., Resch H., Wolzt M., Schmetterer L. Reduced retinal vessel response to flicker stimulation but not to exogenous nitric oxide in type 1 diabetes. Investig. Ophthalmol. Vis. Sci. 2009;50:4029–4032. doi: 10.1167/iovs.08-3260. [DOI] [PubMed] [Google Scholar]
- Pemp B., Schmetterer L. Ocular blood flow in diabetes and age-related macular degeneration. Can. J. Ophthalmol. 2008;43:295–301. doi: 10.3129/i08-049. [DOI] [PubMed] [Google Scholar]
- Pemp B., Weigert G., Karl K., Petzl U., Wolzt M., Schmetterer L., Garhofer G. Correlation of flicker-induced and flow-mediated vasodilatation in patients with endothelial dysfunction and healthy volunteers. Diabetes Care. 2009;32:1536–1541. doi: 10.2337/dc08-2130. [DOI] [PMC free article] [PubMed] [Google Scholar]
- Pierce M.C., Hyle Park B., Cense B., de Boer J.F. Simultaneous intensity, birefringence, and flow measurements with high-speed fiber-based optical coherence tomography. Opt. Lett. 2002;27:1534–1536. doi: 10.1364/ol.27.001534. [DOI] [PubMed] [Google Scholar]
- Potsaid B., Gorczynska I., Srinivasan V.J., Chen Y., Jiang J., Cable A., Fujimoto J.G. Ultrahigh speed spectral/Fourier domain OCT ophthalmic imaging at 70,000 to 312,500 axial scans per second. Opt. Express. 2008;16:15149–15169. doi: 10.1364/oe.16.015149. [DOI] [PMC free article] [PubMed] [Google Scholar]
- Pournaras C.J., Riva C.E. Retinal blood flow evaluation. Ophthalmologica. 2013;229:61–74. doi: 10.1159/000338186. [DOI] [PubMed] [Google Scholar]
- Pournaras C.J., Rungger-Brandle E., Riva C.E., Hardarson S.H., Stefansson E. Regulation of retinal blood flow in health and disease. Prog. Retin Eye Res. 2008;27:284–330. doi: 10.1016/j.preteyeres.2008.02.002. [DOI] [PubMed] [Google Scholar]
- Povazay B., Bizheva K., Hermann B., Unterhuber A., Sattmann H., Fercher A., Drexler W., Schubert C., Ahnelt P., Mei M., Holzwarth R., Wadsworth W., Knight J., Russell P.S.J. Enhanced visualization of choroidal vessels using ultrahigh resolution ophthalmic OCT at 1050 nm. Opt. Express. 2003;11:1980–1986. doi: 10.1364/oe.11.001980. [DOI] [PubMed] [Google Scholar]
- Rechtman E., Harris A., Kumar R., Cantor L.B., Ventrapragada S., Desai M., Friedman S., Kagemann L., Garzozi H.J. An update on retinal circulation assessment technologies. Curr. Eye Res. 2003;27:329–343. doi: 10.1076/ceyr.27.6.329.18193. [DOI] [PubMed] [Google Scholar]
- Riva C., Ross B., Benedek G.B. Laser Doppler measurements of blood flow in capillary tubes and retinal arteries. Investig. Ophthalmol. 1972;11:936–944. [PubMed] [Google Scholar]
- Riva C.E., Feke G.T., Eberli B., Benary V. Bidirectional LDV system for absolute measurement of blood speed in retinal vessels. Appl. Opt. 1979;18:2301–2306. doi: 10.1364/AO.18.002301. [DOI] [PubMed] [Google Scholar]
- Riva C.E., Geiser M., Petrig B.L. Ocular blood flow assessment using continuous laser Doppler flowmetry. Acta Ophthalmol. 2010;88:622–629. doi: 10.1111/j.1755-3768.2009.01621.x. [DOI] [PubMed] [Google Scholar]
- Riva C.E., Grunwald J.E., Sinclair S.H., Petrig B.L. Blood velocity and volumetric flow rate in human retinal vessels. Investig. Ophthalmol. Vis. Sci. 1985;26:1124–1132. [PubMed] [Google Scholar]
- Riva C.E., Logean E., Falsini B. Visually evoked hemodynamical response and assessment of neurovascular coupling in the optic nerve and retina. Prog. Retin Eye Res. 2005;24:183–215. doi: 10.1016/j.preteyeres.2004.07.002. [DOI] [PubMed] [Google Scholar]
- Riva C.E., Salgarello T., Logean E., Colotto A., Galan E.M., Falsini B. Flicker-evoked response measured at the optic disc rim is reduced in ocular hypertension and early glaucoma. Investig. Ophthalmol. Vis. Sci. 2004;45:3662–3668. doi: 10.1167/iovs.04-0100. [DOI] [PubMed] [Google Scholar]
- Riva C.E., Schmetterer L. Microcirculation of the ocular fundus. In: Tuma R.F., Durán W.N., Ley K., editors. Handbook of Physiology: Microcirculation. second ed. Academic Press; Amsterdam: 2008. pp. 735–765. [Google Scholar]
- Schmetterer L., Kiel J. Springer; 2012. Ocular Blood Flow. [Google Scholar]
- Schmetterer L., Wolzt M. Ocular blood flow and associated functional deviations in diabetic retinopathy. Diabetologia. 1999;42:387–405. doi: 10.1007/s001250051171. [DOI] [PubMed] [Google Scholar]
- Schmidl D., Garhofer G., Schmetterer L. The complex interaction between ocular perfusion pressure and ocular blood flow – relevance for glaucoma. Exp. Eye Res. 2011;93:141–155. doi: 10.1016/j.exer.2010.09.002. [DOI] [PubMed] [Google Scholar]
- Schmoll T., Kolbitsch C., Leitgeb R.A. Ultra-high-speed volumetric tomography of human retinal blood flow. Opt. Express. 2009;17:4166–4176. doi: 10.1364/oe.17.004166. [DOI] [PubMed] [Google Scholar]
- Schmoll T., Singh A.S., Blatter C., Schriefl S., Ahlers C., Schmidt-Erfurth U., Leitgeb R.A. Imaging of the parafoveal capillary network and its integrity analysis using fractal dimension. Biomed. Opt. Express. 2011;2:1159–1168. doi: 10.1364/BOE2.001159. [DOI] [PMC free article] [PubMed] [Google Scholar]
- Sehi M., Goharian I., Konduru R., Tan O., Srinivas S., Sadda S.R., Francis B.A., Huang D., Greenfield D.S. Retinal blood flow in glaucomatous eyes with single-hemifield damage. Ophthalmology. 2014 Mar;121(3):750–758. doi: 10.1016/j.ophtha.2013.10.022. [DOI] [PMC free article] [PubMed] [Google Scholar]
- Shin Y.U., Kim S., Lee B.R., Shin J.W., Kim S.I. Novel noninvasive detection of the fovea avascular zone using confocal red-free imaging in diabetic retinopathy and retinal vein occlusion. Investig. Ophthalmol. Vis. Sci. 2012;53:309–315. doi: 10.1167/iovs.11-8510. [DOI] [PubMed] [Google Scholar]
- Singh A.S., Kolbitsch C., Schmoll T., Leitgeb R.A. Stable absolute flow estimation with Doppler OCT based on virtual circumpapillary scans. Biomed. Opt. Express. 2010;1:1047–1058. doi: 10.1364/BOE.1.001047. [DOI] [PMC free article] [PubMed] [Google Scholar]
- Stalmans I., Vandewalle E., Anderson D.R., Costa V.P., Frenkel R.E., Garhofer G., Grunwald J., Gugleta K., Harris A., Hudson C., Januleviciene I., Kagemann L., Kergoat H., Lovasik J.V., Lanzl I., Martinez A., Nguyen Q.D., Plange N., Reitsamer H.A., Sehi M., Siesky B., Zeitz O., Orgul S., Schmetterer L. Use of colour Doppler imaging in ocular blood flow research. Acta Ophthalmol. 2011;89:e609–630. doi: 10.1111/j.1755-3768.2011.02178.x. [DOI] [PubMed] [Google Scholar]
- Sugiyama T., Araie M., Riva C.E., Schmetterer L., Orgul S. Use of laser speckle flowgraphy in ocular blood flow research. Acta Ophthalmol. 2010;88:723–729. doi: 10.1111/j.1755-3768.2009.01586.x. [DOI] [PubMed] [Google Scholar]
- Szkulmowska A., Szkulmowski M., Kowalczyk A., Wojtkowski M. Phase-resolved Doppler optical coherence tomography–limitations and improvements. Opt. Lett. 2008;33:1425–1427. doi: 10.1364/ol.33.001425. [DOI] [PubMed] [Google Scholar]
- Szkulmowski M., Szkulmowska A., Bajraszewski T., Kowalczyk A., Wojtkowski M. Flow velocity estimation using joint spectral and time domain optical coherence tomography. Opt. Express. 2008;16:6008–6025. doi: 10.1364/oe.16.006008. [DOI] [PubMed] [Google Scholar]
- Tao Y.K., Davis A.M., Izatt J.A. Single-pass volumetric bidirectional blood flow imaging spectral domain optical coherence tomography using a modified Hilbert transform. Opt. Express. 2008;16:12350–12361. doi: 10.1364/oe.16.012350. [DOI] [PubMed] [Google Scholar]
- Trasischker W., Werkmeister R.M., Zotter S., Baumann B., Torzicky T., Pircher M., Hitzenberger C.K. In vitro and in vivo three-dimensional velocity vector measurement by three-beam spectral-domain Doppler optical coherence tomography. J. Biomed. Opt. 2013;18:116010. doi: 10.1117/1.JBO.18.11.116010. [DOI] [PubMed] [Google Scholar]
- Wang X.J., Milner T.E., Nelson J.S. Characterization of fluid flow velocity by optical Doppler tomography. Opt. Lett. 1995;20:1337–1339. doi: 10.1364/ol.20.001337. [DOI] [PubMed] [Google Scholar]
- Wang Y., Bower B.A., Izatt J.A., Tan O., Huang D. In vivo total retinal blood flow measurement by Fourier domain Doppler optical coherence tomography. J. Biomed. Opt. 2007;12:041215. doi: 10.1117/1.2772871. [DOI] [PubMed] [Google Scholar]
- Wang Y., Fawzi A., Tan O., Gil-Flamer J., Huang D. Retinal blood flow detection in diabetic patients by Doppler Fourier domain optical coherence tomography. Opt. Express. 2009;17:4061–4073. doi: 10.1364/oe.17.004061. [DOI] [PMC free article] [PubMed] [Google Scholar]
- Wang Y., Fawzi A.A., Tan O., Zhang X., Huang D. Flicker-induced changes in retinal blood flow assessed by Doppler optical coherence tomography. Biomed. Opt. Express. 2011;2:1852–1860. doi: 10.1364/BOE.001852. [DOI] [PMC free article] [PubMed] [Google Scholar]
- Wang Y., Fawzi A.A., Varma R., Sadun A.A., Zhang X., Tan O., Izatt J.A., Huang D. Pilot study of optical coherence tomography measurement of retinal blood flow in retinal and optic nerve diseases. Investig. Ophthalmol. Vis. Sci. 2011;52:840–845. doi: 10.1167/iovs.10-5985. [DOI] [PMC free article] [PubMed] [Google Scholar]
- Wang Y., Lu A., Gil-Flamer J., Tan O., Izatt J.A., Huang D. Measurement of total blood flow in the normal human retina using Doppler Fourier-domain optical coherence tomography. Br. J. Ophthalmol. 2009;93:634–637. doi: 10.1136/bjo.2008.150276. [DOI] [PMC free article] [PubMed] [Google Scholar]
- Werkmeister R.M., Dragostinoff N., Palkovits S., Told R., Boltz A., Leitgeb R.A., Groschl M., Garhofer G., Schmetterer L. Measurement of absolute blood flow velocity and blood flow in the human retina by dual-beam bidirectional Doppler Fourier-domain optical coherence tomography. Investig. Ophthalmol. Vis. Sci. 2012;53:6062–6071. doi: 10.1167/iovs.12-9514. [DOI] [PubMed] [Google Scholar]
- Werkmeister R.M., Dragostinoff N., Pircher M., Gotzinger E., Hitzenberger C.K., Leitgeb R.A., Schmetterer L. Bidirectional Doppler Fourier-domain optical coherence tomography for measurement of absolute flow velocities in human retinal vessels. Opt. Lett. 2008;33:2967–2969. doi: 10.1364/ol.33.002967. [DOI] [PubMed] [Google Scholar]
- Werkmeister R.M., Palkovits S., Told R., Groschl M., Leitgeb R.A., Garhofer G., Schmetterer L. Response of retinal blood flow to systemic hyperoxia as measured with dual-beam bidirectional Doppler Fourier-domain optical coherence tomography. PLoS One. 2012;7:e45876. doi: 10.1371/journal.pone.0045876. [DOI] [PMC free article] [PubMed] [Google Scholar]
- Westphal V., Yazdanfar S., Rollins A.M., Izatt J.A. Real-time, high velocity-resolution color Doppler optical coherence tomography. Opt. Lett. 2002;27:34–36. doi: 10.1364/ol.27.000034. [DOI] [PubMed] [Google Scholar]
- Yang V., Gordon M., Qi B., Pekar J., Lo S., Seng-Yue E., Mok A., Wilson B., Vitkin I. High speed, wide velocity dynamic range Doppler optical coherence tomography (part I): system design, signal processing, and performance. Opt. Express. 2003;11:794–809. doi: 10.1364/oe.11.000794. [DOI] [PubMed] [Google Scholar]
- Yannuzzi L.A. Indocyanine green angiography: a perspective on use in the clinical setting. Am. J. Ophthalmol. 2011;151:745–751e741. doi: 10.1016/j.ajo.2011.01.043. [DOI] [PubMed] [Google Scholar]
- Yasuno Y., Hong Y., Makita S., Yamanari M., Akiba M., Miura M., Yatagai T. In vivo high-contrast imaging of deep posterior eye by 1-um swept source optical coherence tomography and scattering optical coherence angiography. Opt. Express. 2007;15:6121–6139. doi: 10.1364/oe.15.006121. [DOI] [PubMed] [Google Scholar]
- Yazdanfar S., Rollins A.M., Izatt J.A. In vivo imaging of human retinal flow dynamics by color Doppler optical coherence tomography. Arch. Ophthalmol. 2003;121:235–239. doi: 10.1001/archopht.121.2.235. [DOI] [PubMed] [Google Scholar]
- Yun S.H., Tearney G.J., de Boer J.F., Bouma B.E. Motion artifacts in optical coherence tomography with frequency-domain ranging. Opt. Express. 2004;12:2977–2998. doi: 10.1364/opex.12.002977. [DOI] [PMC free article] [PubMed] [Google Scholar]
- Zhao Y., Chen Z., Ding Z., Ren H., Nelson J.S. Real-time phase-resolved functional optical coherence tomography by use of optical Hilbert transformation. Opt. Lett. 2002;27:98–100. doi: 10.1364/ol.27.000098. [DOI] [PubMed] [Google Scholar]
- Zhao Y., Chen Z., Saxer C., Xiang S., de Boer J.F., Nelson J.S. Phase-resolved optical coherence tomography and optical Doppler tomography for imaging blood flow in human skin with fast scanning speed and high velocity sensitivity. Opt. Lett. 2000;25:114–116. doi: 10.1364/ol.25.000114. [DOI] [PubMed] [Google Scholar]
- Zheng Y., Gandhi J.S., Stangos A.N., Campa C., Broadbent D.M., Harding S.P. Automated segmentation of foveal avascular zone in fundus fluorescein angiography. Investig. Ophthalmol. Vis. Sci. 2010;51:3653–3659. doi: 10.1167/iovs.09-4935. [DOI] [PubMed] [Google Scholar]
- Zotter S., Pircher M., Torzicky T., Bonesi M., Goetzinger E., Leitgeb R.A., Hitzenberger C.K. Visualization of microvasculature by dual-beam phase-resolved Doppler optical coherence tomography. Opt. Express. 2011;19:1217–1227. doi: 10.1364/OE.19.001217. [DOI] [PMC free article] [PubMed] [Google Scholar]