Abstract
Purpose
Hospital length of stay (LOS) is important to administrators and families of neonates admitted to the intensive care unit (NICU). A prediction model for NICU LOS was developed using as predictors birth weight, gestational age, and two severity of illness tools, the Score for Neonatal Acute Physiology (SNAPPE) and the Morbidity Assessment Index for Newborns (MAIN).
Materials and Methods
Consecutive admissions (n=293) to a New England regional level III NICU were retrospectively collected in 1999. Multiple predictive models were compared for complexity and goodness-of-fit, coefficient of determination (R2) and predictive error. The optimal model was validated prospectively with consecutive admissions (n=615) in 2002. Observed and expected LOS was compared.
Results
LOS was longer in the 2002 cohort than the 1999 cohort, without differences in birth weight, gestational age, MAIN or SNAPPE. The MAIN models had best AIC, highest R2 (0.786) and lowest predictive error. The best SNAPPE model underestimated LOS, with substantial variability, yet was fairly well calibrated by birthweight category.
Conclusions
Length of stay prediction is improved by accounting for severity of illness in the first week of life beyond factors known at birth. Prospective validation of both MAIN and SNAPPE models is warranted.
Keywords: Neonatal Intensive Care Units, Length of Stay, Severity of Illness Index, Benchmarking, Projections and Predictions, Score for Neonatal Acute Physiology
Introduction
A variety of generic clinical scoring systems have been developed to measure severity of illness and to predict mortality (1-3). Despite a recognized interest in predicting morbidity and quality of life measures (4), mortality remains the most common outcome for these scoring systems. Nonetheless, they have driven a wide range of applications, including quality assurance programs (5), triaging patients to appropriate services (6), cost effectiveness analyses (7,8), and benchmarking ICU performance (9). Scoring systems have been used in clinical decision making (10), stratification for research trials (11) and pediatric trauma outcomes (12-14). Length of hospital stay (LOS) is often reported as an ancillary or intermediate outcome, but it has merit in its own right.
Among scores developed specifically for neonatal medicine (15-16), two that have demonstrated sound LOS prediction are the Morbidity Assessment Index for Newborns (MAIN) score (17) and the Score for Neonatal Acute Physiology, Perinatal Extension (SNAPPE)(18). SNAPPE and MAIN were derived from different populations. The MAIN score was designed to compare outcomes among high risk maternal populations or obstetric healthcare delivery systems (19). It was developed as a discriminative index for neonates greater than 28 weeks gestation, born 1995-1996 with minimal to moderate neonatal morbidities. In contrast, the Score for Neonatal Acute Physiology was a physiologic organ system-based illness severity score developed to predict mortality in the Neonatal Intensive Care Unit (NICU) (20). SNAPPE parses the original 26 variables into the six most relevant, augmented with three other variables: birth weight, small for gestational age status, and five-minute Apgar score (21). SNAPPE scoring requires less extensive record keeping than the MAIN score.
The goal of the present study is to develop a single LOS prediction model valid across the full spectrum of gestational ages using first week of life data from which MAIN and SNAPPE were validated. The relative contributions from birth weight, gestational age and each severity of illness score are unknown. Accurately modeling individual patient LOS would help manage family expectations, as well as contribute vitally to NICU resource allocation. Team assignment cohorts, staff scheduling, resource costs and revenues correlate with NICU census. Census, as the accumulation of current patients, is affected by how long each neonate stays in the NICU. Understanding variation in individual LOS may enable NICU census projections, with resultant organizational and financial benefits from effective resource management.
Materials and Methods
The training set consisted of 293 consecutive NICU admissions, ranging in morbidity from minimal to severe. With IRB approval, the medical records of all newborns born between August and October 1999 and admitted to our NICU were obtained retrospectively for manual data extraction. The prospectively collected validation dataset included 615 consecutive admissions as well as 61 existing NICU patients from April through September 2002.
Eligibility
Every viable newborn admitted to the NICU at Women and Infants’ Hospital within 24 hours of birth was recruited. Newborns were excluded if they: 1) died prior to NICU admission; 2) were admitted for pre-terminal comfort care (defined as neither intubation nor cardio-respiratory resuscitation); 3) had a major congenital anomaly.
Scoring and Data Collection
Data were manually extracted for MAIN and SNAPPE scores for the training dataset, as was SNAPPE for the validation dataset. We collected the 47 items representing 24 neonatal attributes identified as most relevant in the MAIN validation dataset (19) over the first day and first 7 days of life. The SNAPPE score was also assessed for all neonates during the 1st and 3rd 24 hour periods of life. Examples of our MAIN and SNAPPE data collection sheets are available on request. Missing data for severity of illness scores were reconciled according to the original MAIN and SNAPPE protocols. For example, if a child did not have a blood gas on day 3, then s/he received a ‘0’ for that SNAPPE element. For transported infants, the SNAPPE on day one of life was calculated for the actual day of life one, even if the child was in a normal infant nursery or in an outlying hospital.
The gestational age was recorded as completed gestational weeks. An infant who was born at 32 6/7 was recorded as 32 weeks. An infant who was 33 0/7 was recorded as 33 weeks. Fractional days were discarded due to uncertainty of the best obstetrical estimate,or, if not available, the pediatric assessment of gestational age. Weight was taken from documentation in the operating room, delivery room or NICU, whichever was recorded first. Newborns dying during the first 24 hour scoring period were scored, but were analyzed separately. Length of stay reflects total primary hospitalization following admission to a Neonatal Intensive Care Unit (NICU), incrementing at midnight. Time spent in other facilities prior to discharge home was included in LOS.
Statistical Methods
One-way frequencies were used to summarize the distribution of MAIN score items. Accelerated failure time parametric survival models (22) were used to assess the relationship between LOS and birth weight, gestational age, and their second order terms, as well as the MAIN and SNAPPE morbidity scores. To distinguish the superior scoring system, separate regressions were considered involving MAIN and SNAPPE. SNAPPE scores were modeled both as quantitative and categorical factors (≤8, 9 to 12, ≥13). Neonates discharged prior to day 3 of life had a presumed SNAPPE of zero. To avoid estimation bias, analysis was repeated with a regression imputation approach predicting SNAPPE on day 3 of life for these patients (23). Regression models were used to identify the most relevant variables and their contribution to length of stay, based on a retrospective dataset. Parametric nested model development is described in more detail in Supplement III. Generalized coefficients of determination (R2), the Akaike’s Information Criterion (AIC) and K-fold cross-validation were used for model comparison. R2 estimates how much of outcome variability is accounted for by the model. AIC penalizes models with excess logistic regression variables that fail to improve prediction error (24). K-fold cross-validation partitions the data to compare each model’s inherent predictive ability.
Models were examined for subpopulations of very brief hospital stays, for birth weight categories and for disposition destination. The effect of missing data was explored by repeating analyses on all admissions, by imputing missing data and by excluding patients for whom complete data were not available. Imputing day 3 SNAPPE scores for patients discharged prior to day 3 was done by regression on the population with complete data. LOS by weight categories were compared with one-tailed Student’s t test. Low and VLBW groups were compared to the normal birth weight group with marginal generalized R2.
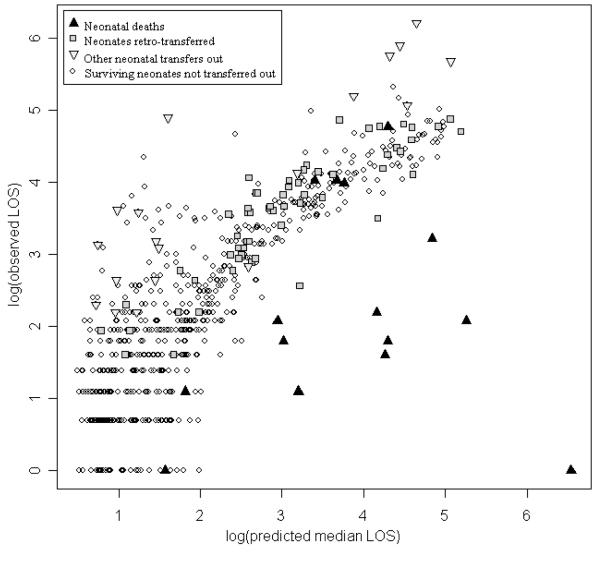
Irrespective of which model demonstrated best predictive power, external validation was planned for the optimal SNAPPE model. An independent dataset was available which had SNAPPE but no MAIN data elements. At a minimum, the potential for census prediction using individual LOS could be established. Calibration by patient disposition and birth weight category was done using observed minus expected LOS (OMELOS), with expected being the predicted median LOS using the best SNAPPE model. Observed and predicted median LOS was plotted on a logarithmic (base 10) scale for the overall validation population. Patients who died, were retro-transferred to a level II facility or were transferred out to a level III facility were identified.
Census projections were calculated from the validation dataset. Observed census on a given day was the accumulation of all neonates whose admit date was in the past and discharge date in the future. Expected census on a given day includes those neonates who would still be present in the NICU by their predicted individual LOS. Observed and expected census (mean +/− standard deviation) was compared using Student’s t test, and graphed to identify focal trends and outliers. Pearson’s correlation was used to quantify the association between observed and expected daily census and was followed by hierarchal linear regression to identify variation due to daily admissions. Seasonality was examined by controlling for census date.
Results
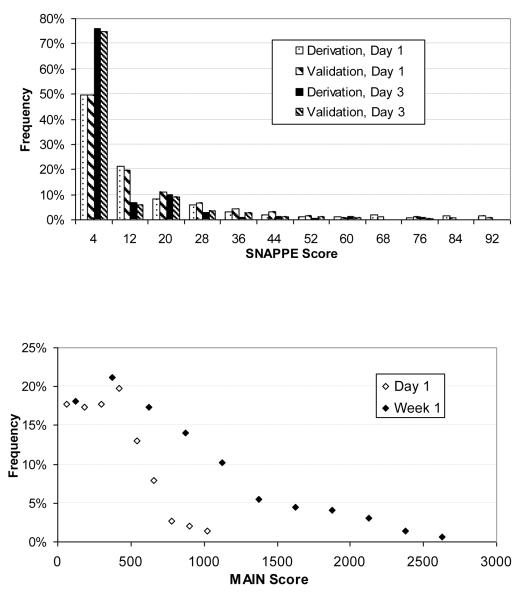
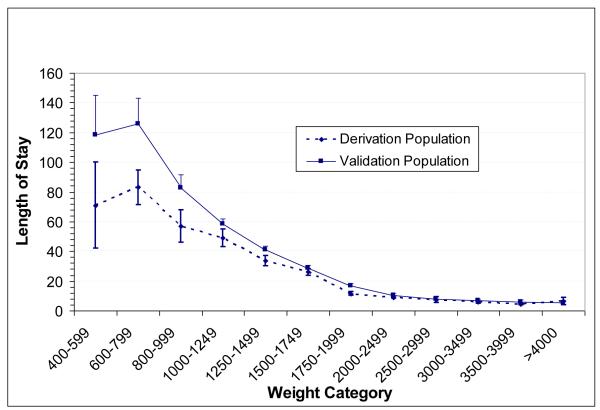
Length of stay, birth weight, gestational age, discharge type, SNAPPE scores and MAIN scores for the training (3 months, 1999) and validation (6 months, 2002) populations are available in Supplement I. Illness severity score distributions are shown in Figure 1. The distribution of Day 1 SNAPPE score demonstrated low acuity for the majority of neonates, with increasing physiologic stability by Day 3. MAIN scores increased from day 1 to day 7 as expected for a cumulative scoring system. Infants discharged with home health services had longer LOS. Average LOS was higher in the validation population (p<0.04), primarily due to longer upper quartile LOS (28 vs. 19 days). Associated factors include very low birthweight (p<0.05, see Figure 2) and older postnatal age among those who died (23.8 +/− 8.5 versus 2.5 +/− 1.4 days). The mortality rate jumped to 45% among neonates with SNAPPE greater than 70 on day of life one, consistent with Richardson et al’s original population observations (21). Correlation analysis shows significant interrelationship between MAIN scores on days 1 and 7, SNAPPE scores on day 1 and 3, birth weight, gestational age, and length of stay (Supplement II).
Figure 1.
Distributions for severity of illness scores: 1a) SNAPPE scores on days one and three show increasing proportion of stable neonates in both derivation and validation populations. 1b) Cumulative MAIN scores increase over 1st week
Figure 2.
Length of stay by birthweight category. The difference between derivation and validation populations was not statistically significant.
Regression models (Supplement III) developed using data from 278 admissions found a log-logistic distribution fit best for SNAPPE as a quantitative variable and Weibull fit best for MAIN. Table 1 shows model constituent variables and predictive ability. Superior models have high R2, low AIC and low prediction error by cross validation. Models have incrementally greater explanatory power by adding a weight-by-age interaction term, MAIN or SNAPPE scores and a SNAPPE day one-by-day three interaction term. MAIN model 6a explained the highest proportion of the variance in LOS (R2 0.786, AIC 556, cross validation 0.524), as compared to the best SNAPPE model 4a (R2 of 0.709, AIC 623, cross validation 0.575). Analysis of birth weight subgroups identified the same pattern, with generalized R2 on MAIN and SNAPPE models for normal (birth weight >2500g, n=126) of 0.563 and 0.271, for low birthweight (1500-2500g, n=102) of 0.641 and 0.612, and for very low birthweight (<1500g, n=50) of 0.679 and 0.608, respectively. To account for short stays in the training dataset, the analyses were repeated either imputing or setting SNAPPE day of life 3 to zero for the 50 patients discharged prior to that day. Neither the variable estimates, model AIC, R2 or prediction error changed notably.
Table 1.
Model Constituent Variables and Predictive Ability
| Model | |||||||||||
|---|---|---|---|---|---|---|---|---|---|---|---|
|
| |||||||||||
| Coefficient Variables | 1 | 2 | 3 | 4a | 4b | 5a | 5b | 6a | 6b | 7a | 7b |
| Birthweight (BW) | ✓ | ✓ | ✓ | ✓ | ✓ | ✓ | ✓ | ✓ | ✓ | ✓ | ✓ |
| Gestational Age (GA) | ✓ | ✓ | ✓ | ✓ | ✓ | ✓ | ✓ | ✓ | ✓ | ✓ | ✓ |
| BW × GA | ✓ | ✓ | ✓ | ✓ | ✓ | ||||||
| BW × BW | ✓ | ✓ | ✓ | ✓ | ✓ | ||||||
|
|
|||||||||||
| SNAPPE DOL1 | ✓ | ✓ | ✓ | ✓ | |||||||
| SNAPPE DOL3 | ✓ | ✓ | ✓ | ✓ | |||||||
| SNAPPE DOL1 × DOL3 | ✓ | ✓ | |||||||||
|
|
|||||||||||
| MAIN 1 | ✓ | ✓ | ✓ | ✓ | |||||||
| MAIN 7 | ✓ | ✓ | ✓ | ✓ | |||||||
| MAIN 1 × MAIN 7 | ✓ | ✓ | |||||||||
|
| |||||||||||
| Predictive Ability | |||||||||||
| AIC | 663 | 652 | 642 | 623 | 639 | 632 | 650 | 556 | 558 | 560 | 563 |
| R2 | 0.66 | 0.67 | 0.68 | 0.71 | 0.79 | ||||||
| Cross Validation | 0.58 | 0.52 | |||||||||
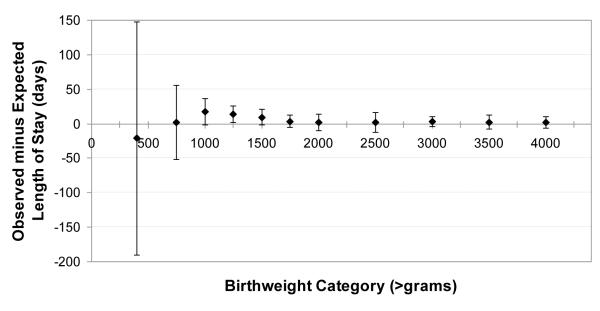
External validation was feasible for the SNAPPE models. Observed minus expected LOS (OMELOS) was calculated for each individual in the validation population based on SNAPPE model 4a. On average, the best SNAPPE model underestimated LOS (OMELOS 3.3 +/− 41 days, n=675), even after removing the outliers who died or were transferred (2.6 +/− 14, n=580). This finding may reflect higher observed LOS in the validation population, particularly among ELBW (born less than 750 gram birth weight) neonates. The wide OMELOS variability among neonates who died (−88 +/− 195 days, n=15) reflects their exclusion in development of the original prediction models. There is substantial variability in OMELOS for patients who were transferred to other level III units (78 +/−106 days, n= 19), or were retro-transferred (9 +/−23 day, n= 61). Fair model calibration is demonstrated in Figure 3, examining OMELOS by birth weight subgroup. A log-linear relationship between observed and predicted LOS is shown in Figure 4, by type of hospital disposition.
Figure 3.
Calibration of SNAPPE model by birthweight category, observed minus expected length of stay. The model overestimated length of stay in the smallest neonates, but underestimated length of stay for those neonates with birth weight between 1000 and 1750 grams.
Figure 4.
Observed versus predicted length of stay by hospital disposition, logarithm10 (days), validation population. Notable outliers include neonates who died or were transferred to level III facilities, but level II retro-transfers were similar to survivors who were not transferred.
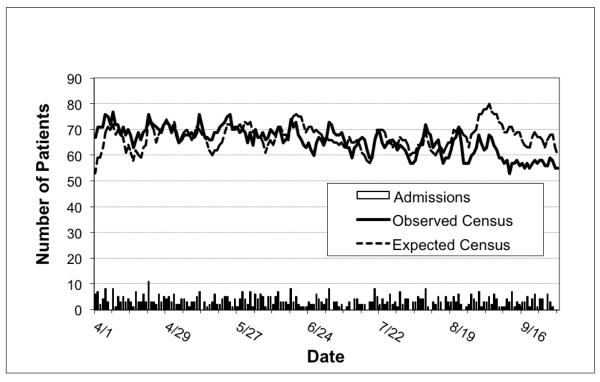
Calculated census fluctuations are shown in Figure 5. Observed census (65.6 +/− 5.37) was lower than expected census (67.1 +/−4.60, p < 0.001), primarily due to discrepancies on days in September. Census predictions using individual LOS predictions were significantly correlated with observed census (r = 0.25, p < 0.01). The correlation between observed and expected census increased (r = 0.46, p < 0.001) when controlling for date, suggesting a seasonal effect not accounted for in the prediction. Hierarchal linear regression showed that daily admissions accounted for additional 10% of observed census variation over and above the impact of expected census (ΔR½ = .10, F (1, 180) = 21.03, p < 0.001).
Figure 5.
NICU Daliy Census Validation Dataset, Observed versus Predicted
Discussion
NICU resource allocation, staffing, costs and revenues all pivot around one measure: census. Variability in census requires persistent attention by administrators, since inefficient resource allocation incurs costs. While stochastic fluctuations in birth rates greatly impact census, other factors also contribute to census variability. Once admitted to the NICU, a neonate contributes to census for the duration of his or her stay. Quantifying variation in individual LOS with moderate accuracy would thereby facilitate NICU resource allocation. It would also help families directly by reducing some uncertainty in the response to their most consistent question, “when will the baby be able to go home?”
We sought a single model that might best predict LOS across our entire population in the first week of life. MAIN had been developed in a population of larger neonates (<1% VLBW), and SNAPPE has demonstrated its best relationship to LOS among populations of smaller neonates (>45% VLBW) (17, 18). We found that models including MAIN were statistically superior to those with SNAPPE overall as well as within our normal, low birth weight and VLBW populations. This relative performance may result from information detail (incorporating 47 versus 9 perinatal factors) or time span (covering 7 days versus 3 days), or both. The density of information detail has practical implications. The superior model was chosen with Aikake’s Information Criterion, which adjusts for the number of predictors, but not for the complexity inherent to each predictor. SNAPPE elements may be captured automatically from some electronic medical record systems. The clinical utility of MAIN may be limited unless informatics strategies are developed to acquire these data.
Severity of illness scoring in the first week of life improves LOS prediction beyond gestational age and birth weight alone, from 65.5% of the variance in hospital LOS for this population to 70.9% (using SNAPPE) and to 78.6% (using MAIN). Individual LOS prediction is less certain, being notably shorter than expected among neonates who died and longer than expected among neonates transferred to another level III facility. While these sickest neonates represented fewer than 5% of the overall population, they (as well as those excluded for congenital anomalies) detract from the strength of single model LOS prediction. Some LOS variance in the large proportion of healthier neonates (week 1 discharges, Figure 4 lower left corner) is an artifact of extra day accrual at midnight. A neonate born just before midnight has a measured LOS one greater than an equivalent neonate born at 1AM. Rounding of hospital days or gestational weeks also create noise in LOS measurement. Avoiding fractions of days to align with hospital accounting systems affects observed LOS, with progressively less impact on longer stays. Rounding down gestational age implies that up to six days in utero has no physiologic impact on severity of illness, which for the youngest neonates is a source of variance in expected LOS.
Other sources of bias were sought. Seasonal variations cannot be excluded given the three- and six-month data collection periods. Discharge practice patterns may not align among neonatal attending physicians even with a single institution. Tracking LOS at other facilities allowed correlation of complete hospitalization to physiologic stability (retro-transfer squares in Figure 4), reducing measurement bias. Inclusion of all admitted neonates at the initial assessment reduces sampling bias. Exclusion of neonates with congenital anomalies may limit application of a single model. Mortality rates may have introduced bias, since non-survival truncates observed LOS, but the results were similar in our overall (2.1% vs. 2.2%) as well as in the ELBW (23.1% vs.18.8%) population, consistent with published neonatal mortality trends in the 1995-2002 epoch (25). We did note a shift towards later postnatal age at death, also consistent with the literature (26, 27). There were no other identifiable populations or clinical practice differences in these epochs. Repeating these analyses with a more recent dataset, one that includes the MAIN variables, may give insight to the source or persistence of these differences.
Prolonged NICU stays are associated with intermediate clinical outcomes and social factors that affect LOS. Bannwart et al (28) showed LOS prediction models using the entire hospital stay were superior to those using only the first three days (R2 0.81 versus 0.60). Cotton et al (29) identified specific morbidities (necrotizing enterocolitis requiring surgery, chronic lung disease at 36 weeks, late onset sepsis, severe retinopathy of prematurity), treatments (multiple doses surfactant, H2 blockers, postnatal steroids) and nutritional variables (lower weight gain, longer time to full feeds) that increased the odds of prolonged hospital stay. We sought to develop a predictive model using week one data, wherein SNAPPE and MAIN were validated. The predictions might be enhanced by integrating morbidities from later in the hospital stay or possibly by using the early data to profile risk for these intermediate clinical outcomes. These LOS prediction models should be generalized with caution until tested in other settings. Severity of illness measures partially compensate for case mix, but differing populations and treatment practices may significantly affect LOS.
Census projections built upon individual SNAPPE LOS predictions correlated well with observed census. Since markedly better variance was explained using MAIN LOS predictions, we conclude census projections using these data would be even more accurate. Census was progressively overestimated during the study period, even though the individual SNAPPE model underestimated LOS on average. The offset in September may suggest discharge practice variation between providers. Our data confirm the correlation between daily admissions and census fluctuation. Other variables likely affect census trends, including seasonality of admissions and changing discharge practices when approaching bed capacity. Biasing early and late census populations, either by excluding short stay neonates or over-representing sicker neonates, was minimized by tracking patients for many weeks before and after the study. Modeling NICU census with inclusive admission and discharge functions may contribute as much to census projections as individual LOS based on physiologic abnormalities. Timely update of individual morbidities, mortality, or unexpected early discharges or transfers would make census prediction even more robust.
Conclusions
Length of stay prediction is improved by accounting for severity of illness in the first week of life, further than factors known at birth. Models including MAIN outperformed those with SNAPPE in all populations. Our findings of poor LOS prediction for individuals but moderately accurate LOS prediction for populations are consistent with reports in the adult and neonatal literature. In our study populations, the difference between observed and expected LOS varied less when neonates who died or were transferred were excluded. The model may be improved further by modeling categorical diagnoses (e.g., necrotizing enterocolitis, sepsis) and interventions (e.g., surgery) after the first week of life. Prospective comparison of MAIN and SNAPPE using more recent, inclusive, multiyear datasets is warranted. With recalibration of prediction equations and validation of individual LOS predictions, modeling NICU census may yet be realized.
Supplementary Material
Acknowledgments
Financial support: Department of Pediatrics, Women & Infants’ Hospital of Rhode Island
Glossary
Abbreviations
- NICU
Neonatal intensive care unit
- AIC
Aikake information criteria
- SNAPPE
Score for neonatal acute physiology, perinatal extension
- MAIN
Morbidity assessment index for newborns
- LOS
Length of stay
- OMELOS
Observed minus expected length of stay
- VLBW
Very low birthweight
- ELBW
Extremely low birthweight
References
- 1.Knaus W, Zimmerman J, Wagner D, Draper E, Lawrence D. APACHE-acute physiology and chronic health evaluation: a physiologically based classification system. Crit Care Med. 1981;9(8):591–7. doi: 10.1097/00003246-198108000-00008. [DOI] [PubMed] [Google Scholar]
- 2.LeGall J, Loirat P, Alperovitch A. A simplified acute physiology score for ICU patients. Crit Care Med. 1984;12:975–7. doi: 10.1097/00003246-198411000-00012. [DOI] [PubMed] [Google Scholar]
- 3.Lemeshow S, Teres D, Avrunin J. Refining intensive care unit outcome prediction by using changing probabilities of mortality. Crit Care Med. 1988;16 doi: 10.1097/00003246-198805000-00002. [DOI] [PubMed] [Google Scholar]
- 4.Herridge M. Prognostication and intensive care unit outcome: the evolving role of scoring systems. Clin Chest Med. 2003;24:751–62. doi: 10.1016/s0272-5231(03)00094-7. [DOI] [PubMed] [Google Scholar]
- 5.Rafkin H, Hoyt J. Objective data and quality assurance programs. Current and future trends. Crit Care Clin. 1994;10(1):157–77. [PubMed] [Google Scholar]
- 6.Zupancic J, Richardson D. Characterization of the Triage Process in Neonatal Intensive Care. Pediatrics. 1998;102:1432–6. doi: 10.1542/peds.102.6.1432. [DOI] [PubMed] [Google Scholar]
- 7.Glance L, Osler T, Shinozaki T. Intensive care unit prognostic scoring systems to predict death: A cost-effectiveness analysis. Crit Care Med. 1998;26(11):1842–9. doi: 10.1097/00003246-199811000-00026. [DOI] [PubMed] [Google Scholar]
- 8.García S, Ruza F, Alvarado F, Madero R, Delgado M, Dorao P, et al. Analysis of costs in a pediatric ICU. Intensive Care Med. 1997;23(2):218–25. doi: 10.1007/s001340050320. [DOI] [PubMed] [Google Scholar]
- 9.Zimmerman J, Kramer A, McNair D. Intensive care unit length of stay: Benchmarking based on Acute Physiology and Chronic Health Evaluation (APACHE) IV*. Crit Care Med. 2006;34:2517–29. doi: 10.1097/01.CCM.0000240233.01711.D9. [DOI] [PubMed] [Google Scholar]
- 10.Müller-Berndorff H, Haas P, Kunzmann R, Schulte-Mönting J, Lübbert M. Comparison of five prognostic scoring systems, the French-American-British (FAB) and World Health Organization (WHO) classifications in patients with myelodysplastic syndromes: Results of a single-center analysis. Ann Hematol. 2006;85(8):502–13. doi: 10.1007/s00277-005-0030-z. [DOI] [PubMed] [Google Scholar]
- 11.Valeur N, Clemmensen P, Grande P, Saunamäki K, Investigators D- Prognostic evaluation by clinical exercise test scores in patients treated with primary percutaneous coronary intervention or fibrinolysis for acute myocardial infarction. Am J Cardiol. 2007;100(7):1074–80. doi: 10.1016/j.amjcard.2007.05.026. [DOI] [PubMed] [Google Scholar]
- 12.Yeh T, Pollack M, Ruttimann U, Holbrook P, Fields A. Validation of a physiologic stability index for use in critically ill infants and children. Pediatr Res. 1984;18(5):445–51. doi: 10.1203/00006450-198405000-00011. [DOI] [PubMed] [Google Scholar]
- 13.Pollack M, Ruttimann U, Getson P. Pediatric risk of mortality (PRISM) score. Crit Care Med. 1988;16(11):1110–6. doi: 10.1097/00003246-198811000-00006. [DOI] [PubMed] [Google Scholar]
- 14.Klem S, Pollack M, Glass N, Spohn W, Kanter R, Zucker A, et al. Resource use, efficiency, and outcome prediction in pediatric intensive care of trauma patients. J Trauma. 1990;30(1):32–6. doi: 10.1097/00005373-199001000-00005. [DOI] [PubMed] [Google Scholar]
- 15.Cockburn F, Cooke R. The CRIB (clinical risk index for babies) score: A tool for assessing initial neonatal risk. Lancet. 1993;342(8865):193–8. [PubMed] [Google Scholar]
- 16.Gray J, Richardson D, McCormick M, Workman-Daniels K, Goldmann D. Neonatal Therapeutic Intervention Scoring System: A Therapy-Based Severity-of-Illness Index. Pediatrics. 1992;90:561–7. [PubMed] [Google Scholar]
- 17.Verma A, Weir A, Drummond J, Mitchell B. Performance profile of an outcome measure: morbidity assessment index for newborns. J Epidemiol Commun Health. 2005;59:420–6. doi: 10.1136/jech.2003.019109. [DOI] [PMC free article] [PubMed] [Google Scholar]
- 18.Escobar G, Fischer A, Li D, Kremers R, Armstrong M. Score for Neonatal Acute Physiology: Validation in Three Kaiser Permanente Neonatal Intensive Care Units. Pediatrics. 1995;96:918–22. [PubMed] [Google Scholar]
- 19.Verma A, Okun N, Maguire T, Mitchell B. Morbidity Assessment Index for Newborns: A composite tool for measuring newborn health. Am J Obstet Gynecol. 1999;181:701–8. doi: 10.1016/s0002-9378(99)70516-8. [DOI] [PubMed] [Google Scholar]
- 20.Richardson D, Gray J, McCormick M, Workman K, Goldmann D. Score for Neonatal Acute Physiology: A Physiologic Severity Index for Neonatal Intensive Care. Pediatrics. 1993;91:617–23. [PubMed] [Google Scholar]
- 21.Richardson D, Corcoran J, Escobar G, Lee S. SNAP-II and SNAPPE-II: Simplified newborn illness severity and mortality risk scores. J Pediatr. 2001;138:92–100. doi: 10.1067/mpd.2001.109608. [DOI] [PubMed] [Google Scholar]
- 22.Shulman J. Studying determinants of length of hospital stay. J Perinatol. 2006;26:243–5. doi: 10.1038/sj.jp.7211478. [DOI] [PubMed] [Google Scholar]
- 23.Nakagawa S, Freckleton R. Missing inaction: the dangers of ignoring missing data. Trends Ecol Evol. 2008;23(11):592–6. doi: 10.1016/j.tree.2008.06.014. [DOI] [PubMed] [Google Scholar]
- 24.Akaike H. A new look at the statistical model identification. IEEE Trans Automatic Control. 1974;19(6):716–23. [Google Scholar]
- 25.Fanaroff AA, Stoll BJ, Wright LL, Carlo WA, Ehrenkranz RA, Stark AR, et al. Trends in neonatal morbidity and mortality for very low birthweight infants. Am J Obstet Gynecol. 2007;196:147.e141–147.e148. doi: 10.1016/j.ajog.2006.09.014. [DOI] [PubMed] [Google Scholar]
- 26.Meadow W, Reimshisel T, Lantos J. Birth weight-specific mortality for extremely low birth weight infants vanishes by four days of life: epidemiology and ethics in the neonatal intensive care unit. Pediatrics. 1996;97(5):636–643. [PubMed] [Google Scholar]
- 27.Singh Jaideep, Lantos John, Meadow William. End-of-Life After Birth: Death and Dying in a Neonatal Intensive Care Unit. Pediatrics. 2004;114:1620–1626. doi: 10.1542/peds.2004-0447. [DOI] [PubMed] [Google Scholar]
- 28.Bannwart D, Rebello C, Sadek L, Pontes M, Ramos J, Leone C. Prediction of Length of Hospital Stay in Neonatal Units for Very Low Birthweight Infants. J Perinatol. 1999;19(2):92–6. doi: 10.1038/sj.jp.7200134. [DOI] [PubMed] [Google Scholar]
- 29.Cotten C, Oh W, McDonald S, Carlo W, Fanaroff A, Duara S, et al. Prolonged hospital stay for extremely premature infants: Risk factors, center differences, and the impact of mortality on selecting a best-performing center. J Perinatol. 2005;25:650–5. doi: 10.1038/sj.jp.7211369. [DOI] [PubMed] [Google Scholar]
Associated Data
This section collects any data citations, data availability statements, or supplementary materials included in this article.


