

Abstract
Background
Childhood cancer survivors treated with anthracyclines are at high risk for asymptomatic left ventricular dysfunction (ALVD), subsequent heart failure (HF), and death. The consensus-based Children’s Oncology Group (COG) Long-Term Follow-Up Guidelines recommend lifetime echocardiographic screening for ALVD.
Objective
To evaluate the efficacy and cost-effectiveness of the COG Guidelines and to identify more cost-effective screening strategies.
Design
Simulation of life-histories using Markov health states.
Data Sources
Childhood Cancer Survivor Study; published literature.
Target Population
Childhood cancer survivors.
Time Horizon
Lifetime.
Perspective
Societal.
Intervention
Echocardiographic screening, followed by angiotensin-converting enzyme (ACE) inhibitor and beta-blocker therapies after ALVD diagnosis.
Measurements
Quality-adjusted life years (QALYs), costs, incremental cost-effectiveness ratios (ICERs) in dollars per QALY, and the cumulative incidence of HF.
Results of Base-Case Analysis
The COG Guidelines versus no screening have an ICER of $61,500, extend life expectancy by 6 months and QALYs by 1.6 months, and reduce the cumulative incidence of HF by 18% at 30 years after cancer diagnosis. However, less-frequent screenings are more cost-effective than the Guidelines, and maintain 80% of the health benefits.
Results of Sensitivity Analysis
The ICER was most sensitive to the magnitude of ALVD treatment efficacy; higher treatment efficacy resulted in lower ICER.
Limitation
Lifetime non-HF mortality and the cumulative incidence of HF more than 20 years after diagnosis were extrapolated; the efficacy of ACE inhibitor and beta-blocker therapy in childhood cancer survivors with ALVD is undetermined (or unknown).
Conclusion
The COG Guidelines could reduce the risk of HF in survivors at less than $100,000/QALY. Less-frequent screening achieves most of the benefits and would be more cost-effective than the COG Guidelines.
Primary Funding Source
Lance Armstrong Foundation, National Cancer Institute.
INTRODUCTION
Anthracyclines are a class of highly effective chemotherapeutic agents incorporated into more than half of all childhood cancer treatments (1, 2). However, they are associated with a dose-dependent cardiotoxicity, which manifests along a continuum from asymptomatic left ventricular dysfunction (ALVD) to clinical heart failure (HF) (1). Five-year survival after HF diagnosis is generally poor (3-5).
The Children’s Oncology Group Long-Term Follow-Up Guidelines (COG Guidelines) (6) recommend lifelong serial echocardiographic screening for survivors of childhood cancer to identify anthracycline-related ALVD and to delay the onset of HF with ALVD treatment (e.g., angiotensin-converting enzyme [ACE] inhibitors and/or beta-blockers) (7). The Guidelines recommend screening frequencies of 1 to 5 years, depending on 12 risk profiles defined by lifetime anthracycline dose, age at cancer diagnosis, and history of chest irradiation (8). These frequencies take into account the evidence for clinical and demographic modifiers of the dose-dependent risk of ALVD or HF, but are essentially consensus-based.
Excessive screening wastes scarce financial resources, whereas inadequate screening delays ALVD treatment. The purpose of this study was to determine the efficacy and cost-effectiveness of the COG Guidelines and to explore alternative screening schedules that might be more cost-effective.
METHODS
We developed a Markov state transition model (TreeAge Software, Inc., Waltham, MA, USA) and simulated the life histories of 10 million childhood cancer survivors from 5 years after cancer diagnosis until death for each risk profile described in the COG Guidelines (Appendix 1; Appendix Table 1). Survivors included children with cancer diagnosed and treated between ages 0 and 20 years. The simulated populations mirrored the Childhood Cancer Survivor Study (CCSS) cohort (described below) in terms of sex, age at cancer diagnosis, chest irradiation, and cumulative anthracycline dose.
We compared lifetime costs and health outcomes (expected life-years, quality-adjusted life-years [QALYs], and the cumulative incidence of HF at 20, 30, and 50 years after cancer diagnosis) achieved by following the screening schedules against no screening (standard of care before the institution of the COG Guidelines) and calculated the incremental cost-effectiveness ratio (ICER) for the schedule recommended for each risk profile. The ICER of the COG Guidelines for the entire at-risk cohort was calculated by averaging the costs and QALYs calculated for each risk profile weighted by their prevalence. A 3% annual discount rate for costs and QALYs was used. The study was conducted as a reference case from the societal perspective (9).
Children’s Oncology Group Long-Term Follow-Up Guidelines
The COG Guidelines recommend screening frequencies for 12 risk profiles (6). However, we excluded the first risk profile (age at diagnosis <1 year, chest irradiation, any anthracycline dose) for lack of data on HF.
Childhood Cancer Survivor Study Cohort
The CCSS data included information on 4,635 anthracycline-exposed childhood cancer survivors treated during 1970-1986 in the US and Canada and followed to December 31, 2002 (Appendix 1). Males comprised 54.5%; median age at cancer diagnosis was 7 years (range 0-20); median cumulative anthracycline dose was 292.8 mg/m2; 22% received chest radiation; and the median follow-up after cancer diagnosis was 20 years (10, 11).
Model Structure
The model comprised 4 health states (no ALVD, ALVD, HF, death) (Appendix Figure 1), which closely resembled the American Heart Association and American College of Cardiology definitions of HF (7): Stage A (No ALVD), Stage B (ALVD), and Stage C/D (HF). Individuals were ALVD-free at the start of simulation. They underwent life-time echocardiographic screening according to the COG Guidelines with 100% adherence. The model used a 1-year cycle length.
The correct diagnosis of ALVD depended on the sensitivity and specificity of the screening echocardiography. After echocardiographic screening, individuals with ALVD were true-positive or false-negative; those without ALVD were false-positive or true-negative. True-positive cases underwent cardiac Magnetic Resonance Imaging (MRI) to confirm ALVD, followed by treatment (ACE inhibitor and beta blocker) with 76% compliance (12). Those in whom HF developed received an ACE inhibitor and a beta blocker. They could remain stable (no disease progression), become hospitalized for HF, or die of HF or of non-cardiac causes. False-positive cases underwent cardiac MRI to rule out ALVD and continued with screening per the COG Guidelines, as did the false- and true-negative cases. Survivors in any health state could die of non-HF causes.
Model Inputs
Echocardiography Performance Characteristics
Medical literature review showed the range of sensitivity and specificity for echocardiography to be 75%-94% and 90%-100%, respectively, when radionuclide angiography is the reference standard (13-18) (Table 1; Appendix 1). Thus, we used conservative values of 75% for sensitivity and 90% for specificity.
Table 1.
Model Inputs for Base-Case and Sensitivity Analyses
| Characteristics of the 12 Risk Profiles in the Children’s Oncology Group Guidelines | |||||||||||||
|---|---|---|---|---|---|---|---|---|---|---|---|---|---|
| Risk Profile group | 1 | 2 | 3 | 4 | 5 | 6 | 7 | 8 | 9 | 10 | 11 | 12 | |
|
| |||||||||||||
| Age at cancer diagnosis, y | <1 | <1 | <1 | 1-4 | 1-4 | 1-4 | 1-4 | ≥5 | ≥5 | ≥5 | ≥5 | ≥5 | |
|
| |||||||||||||
| Chest irradiation | Yes | No | No | Yes | No | No | No | Yes | Yes | No | No | No | |
|
| |||||||||||||
| Anthracycline dose, mg/m2 | Any | <200 | ≥200 | Any | <100 | 100–299 | ≥300 | <300 | ≥300 | <200 | 200–299 | ≥300 | |
|
| |||||||||||||
| Variable (references) | Base-Case Values [range used in sensitivity analysis] | ||||||||||||
| Cumulative incidence of HF by age† (3, 21-28) | [±20% of HF incidence at age 20y], see Appendix Figures 2A, 2B (for annual incidence) | ||||||||||||
| Men | 30y | * | 0.026 | 0.076 | 0.113 | 0.019 | 0.024 | 0.077 | 0.017 | 0.046 | 0.004 | 0.008 | 0.020 |
|
| |||||||||||||
| 60y | * | 0.134 | 0.287 | 0.322 | 0.121 | 0.128 | 0.313 | 0.138 | 0.273 | 0.072 | 0.106 | 0.206 | |
|
| |||||||||||||
| Women | 30y | * | 0.028 | 0.114 | 0.153 | 0.021 | 0.030 | 0.113 | 0.019 | 0.064 | 0.005 | 0.008 | 0.029 |
|
| |||||||||||||
| 60y | * | 0.139 | 0.371 | 0.382 | 0.128 | 0.145 | 0.404 | 0.157 | 0.360 | 0.073 | 0.114 | 0.271 | |
|
| |||||||||||||
| Cumulative incidence of ALVD by age† (see Appendix) | [not varied] | ||||||||||||
| Men | 30y | * | 0.066 | 0.172 | 0.208 | 0.055 | 0.071 | 0.178 | 0.054 | 0.120 | 0.021 | 0.034 | 0.063 |
|
| |||||||||||||
| 60y | * | 0.243 | 0.422 | 0.423 | 0.225 | 0.254 | 0.445 | 0.226 | 0.377 | 0.169 | 0.214 | 0.314 | |
|
| |||||||||||||
| Women | 30y | * | 0.070 | 0.238 | 0.263 | 0.060 | 0.081 | 0.246 | 0.064 | 0.168 | 0.023 | 0.039 | 0.090 |
|
| |||||||||||||
| 60y | * | 0.246 | 0.509 | 0.486 | 0.230 | 0.269 | 0.542 | 0.258 | 0.486 | 0.173 | 0.234 | 0.394 | |
|
| |||||||||||||
| Cumulative mortality from non-HF by age† (30) | [not varied], see Appendix Figure 3 (for annual mortality) | ||||||||||||
| Men | 35y | * | 0.073 | 0.089 | 0.351 | 0.131 | 0.139 | 0.180 | 0.259 | 0.310 | 0.112 | 0.116 | 0.128 |
|
| |||||||||||||
| 65y | * | 0.266 | 0.311 | 0.688 | 0.312 | 0.324 | 0.390 | 0.659 | 0.726 | 0.347 | 0.366 | 0.404 | |
|
| |||||||||||||
| Women | 35y | * | 0.055 | 0.073 | 0.292 | 0.102 | 0.110 | 0.152 | 0.210 | 0.267 | 0.088 | 0.088 | 0.104 |
|
| |||||||||||||
| 65y | * | 0.266 | 0.321 | 0.688 | 0.303 | 0.317 | 0.390 | 0.602 | 0.683 | 0.304 | 0.319 | 0.366 | |
| Annual HF mortality after years since HF diagnosis (31-33) | [not varied] |
|
| |
| 1, 2, 3, 4, 5, 6, 7, 8, 9, ≥10y | 0.300, 0.080, 0.050, 0.040, 0.030, 0.025, 0.020, 0.015, 0.010, 0.005, respectively |
|
| |
| ALVD treatment efficacy (12, 19, 20) | |
|
| |
| Percentage reduction in annual HF incidence | 30% [10%, 50%] |
|
| |
| Probability of hospitalization after HF diagnosis (12, 37) | [not varied] |
|
| |
| First year; subsequent years | 0.33; 0.11 |
|
| |
| Adherence to ALVD treatment (12) | 76% [50%, 100%] |
| Utilities, for age<26y, 26-45y, 46-65y, >65y (34-36) | |
| No ALVD | 0.98, 0.947, 0.913, 0.86 [not varied] |
|
| |
| ALVD, without treatment | 0.96, 0.834, 0.697, 0.51 [not varied] |
|
| |
| ALVD, with treatment | 0.95, 0.7925, 0.6212, 0.3875 [not varied] |
|
| |
| HF | 0.5, 0.427, 0.366, 0.27 [(0.13, 0.065, 0, 0), (0.82, 0.79, 0.66, 0.48)]‡ |
|
| |
| Echocardiography characteristics (13-18) | |
| Sensitivity / Specificity | 75% / 90% [50% / 50%, 100% / 100% ] |
| Annual discounting rate for effects and costs (9) | 3% [0%, 5%] |
ALVD = asymptomatic left ventricular dysfunction; HF = heart failure.
Excluded for lack of data regarding their HF risks. This group comprises 1.3% of the anthracycline-exposed Childhood Cancer Survivor Study cohort.
Sample points are shown.
Values used for sensitivity analysis, shown in brackets, are mean ±1 standard deviation (sd) reported in reference (34) for age 26-45y and 46-65y. We assumed the sd for the extrapolated values at age <26y and age >65y to be the same as those for 26-45y and 46-65y, respectively. Negative lower bounds were set to 0.
Efficacy of ALVD Treatment
Treatment for ALVD was assumed to reduce the annual HF incidence by 30% (12, 19, 20) (Table 1; Appendix 1).
Incidence of HF and ALVD
The annual incidence of HF from 5 to 30 years after cancer diagnosis was synthesized from published studies (Table 1; Appendix 1; Appendix Figure 2) (3, 21-28). Given sparse data, HF incidence beyond 20 years after diagnosis was held at the 20-year rate, but incorporated the age- and sex-specific HF incidence of the general population (29). The annual ALVD incidence was assumed to be three times that of HF (Appendix 1 for rationale). The cumulative incidences of ALVD and lifetime mortality from HF are shown in Appendix Table 2.
Annual Mortality
Non-HF mortality was estimated from 4,635 anthracycline-exposed CCSS participants (30) up to age 30 years for age at cancer diagnosis <5 years and up to age 40 years for age at cancer diagnosis ≥5 years. Mortality rates beyond these ages were estimated from the age- and sex-appropriate U.S. general population, by applying the multiplicative assumption and the relative risks estimated at ages 30 and 40 years (Table 1; Appendix 1; Appendix Figure 3). The annual HF mortality was derived from data in children (approximated by the rate of HF death or progression to heart transplantation) (31) and adults with HF (32, 33).
Utilities
We used health state values estimated from healthy men and women for the four heart disease classifications of the New York Heart Association for our three alive health-states (34). For ages 26-45 and 46-65 years, sex-specific means were used. For ages less than 26 or over 65 years, linearly extrapolated values at 15 and 85 years, respectively, were used. To account for side effects of ALVD treatment (35), the decrement in ALVD utility relative to no ALVD was increased by 25% in 20% of ALVD patients (36) (Table 1; Appendix 1).
Costs
Costs (Table 2; Appendix 1) were adjusted to 2010 U.S. dollars using the medical portion of the Consumer Price Index, U.S. Bureau of Labor Statistics. Costs of a two-dimensional screening echocardiogram and a cardiac MRI were obtained from the 2010 Medicare Physician Fee Schedule (38). We used the average wholesale price for ACE inhibitors and beta blockers (39). Healthcare costs included age-dependent general health care (40), hospitalization leading to non-HF death (41), hospitalization for HF ending in discharge or death (41), and outpatient HF management (38). Patient time was valued at $143 per day based on 2010 U.S. median annual earning (42).
Table 2.
Costs Used for Base-Case and Sensitivity Analyses
| Variable | Value, 2010 US $ | Reference‡ |
|---|---|---|
| Two-dimensional echocardiography | 38 | |
| First time screening | 438 [halved, doubled]* | |
|
| ||
| Subsequent screening | 343 [halved, doubled]* | |
|
| ||
| Cardiac MRI for confirmatory diagnosis | 38 | |
| First time screening | 757 | |
|
| ||
| Subsequent screening | 702 | |
|
| ||
| ACE inhibitor (annual cost) † | 39 | |
| Lisinopril, 10 mg/day | 347 | |
| Beta-blocker (annual cost) † | 39 | |
| Carvedilol, 25 mg pill, twice/day for HF | 1,509 | |
|
| ||
| Carvedilol, 25 mg pill, once/day for ALVD | 755 | |
|
| ||
| General health care (annual cost) | 40 | |
| Age-dependent | 790 - 5,111 | |
| Hospitalization for HF (ending in discharge) | 41 | |
| Age < 20 years | 15,471 | |
|
| ||
| Age ≥ 20 years | 8,850 | |
|
| ||
| Hospitalization for HF (ending in death) | 41 | |
| Age < 20 years | 45,518 | |
|
| ||
| Age ≥ 20 years | 11,662 | |
|
| ||
| Outpatient management of HF | 38 | |
| First year of HF diagnosis | 1,049 | |
|
| ||
| Subsequent years after HF diagnosis | 620 | |
|
| ||
| Hospitalization leading to non-HF death | 40 | |
| Age-dependent | 15,964 - 75,529 | |
| Patient time | See Appendix | |
| ALVD screening, per screen | 38 | |
|
| ||
| General health care, per year (age-dependent) | 58 – 206 | |
|
| ||
| Hospitalization for HF ending in discharge, per episode, age < 20 years | 857 | |
|
| ||
| Hospitalization for HF ending in discharge, per episode, age ≥ 20 years | 714 | |
|
| ||
| Outpatient management of HF, per clinical visit | 29 | |
ACE = angiotensin-converting enzyme; ALVD = asymptomatic left ventricular dysfunction; HF = heart failure; MRI = magnetic resonance imaging.
Range used for sensitivity analyses.
The cost of a one-year supply was used regardless of the medication adherence rate.
Details can be found in the Appendix.
Sensitivity Analyses
One-way sensitivity analyses were conducted for ALVD treatment efficacy and duration of efficacy, sensitivity and specificity of echocardiography, medication adherence rate, the cumulative incidence of HF at 20 years after cancer diagnosis, utilities for HF, discount rates, and echocardiographic screening cost (Tables 1, 2). Two-way sensitivity analyses were also conducted for echocardiographic sensitivity and specificity and ALVD treatment efficacy. Cohort values were calculated using weighted averages of QALYs and cost calculated for the risk groups using their prevalence as weights.
Identifying a Cost-effective Screening Strategy
Healthcare cost and QALYs for screening frequencies of 1 to 5 years were calculated for each risk profile. The frequencies were ordered by QALYs. The incremental cost per QALY gained by increasing the screening frequency to the next higher level was calculated (9). Frequencies providing fewer QALYs for equal or higher cost than other frequencies or frequencies gaining fewer QALYs for equal or higher cost than a combination of two other frequencies were eliminated (9, 43). The remaining frequency with the highest QALY gained at less than $100,000 was considered the most cost-effective.
Role of the Funding Source
The study was supported in part by the Lance Armstrong Foundation and the National Cancer Institute. The funding sources had no role in the design, conduct, or the decision to publish the study findings.
RESULTS
Model Validation
Model validation procedures are detailed in the Appendix 2. External model validity was assessed by comparing model-based estimates of the cumulative incidence of HF at 20 years after cancer diagnosis with estimates reported in four large cohort studies (21-23, 28). Because the cohort characteristics were reported in aggregates, we identified specific risk profiles in the Guidelines that could correspond to the study data. The range of cumulative incidence calculated for these risk profiles (0.5%-5.8%) overlapped the estimates or the 95% confidence limits reported by the four studies (2%-7.9%) (Appendix Table 3).
Base-Case
Within each age at cancer diagnosis category, life expectancy and QALYs gained from screening increased with higher anthracycline dose. The reduction in HF risk was highest in the first two decades after cancer diagnosis and declined thereafter. The largest reduction in HF risk occurred for screening performed sooner after cancer diagnosis rather than later (Table 3).
Table 3.
Health Outcomes, Cost, and ICER of the COG Guidelines: Screening Intervals of 1 to 5 Years Compared to No Screening and to Immediately Preceding Less Expensive Strategy
| Risk profile No.* |
COG Guidelines Risk Profile Characteristics |
Screening interval, y |
Per person cost, $ |
Per person Life Expectancy, y† |
(Cumulative incidence of HF without screening, %) and % reduction with screening |
QALY/ person |
Compared to no screening |
Compared to immediately preceding less expensive non-dominated strategy†† |
||||||
|---|---|---|---|---|---|---|---|---|---|---|---|---|---|---|
| Age at Dx |
Chest RT |
AC dose, mg/m2 |
20 y after Dx |
30 y after Dx |
50 y after Dx |
Incremental QALY**/ person |
ICER, $/QALY |
Incremental QALY**/ person |
ICER, $/QALY |
|||||
| Entire AC-exposed cohort* | None | 48,388 | 56.84 | (2.5) | (7.7) | (19.8) | 33,41 | -- | -- | -- | -- | |||
|
| ||||||||||||||
| COG Guidelines‡ | 56,383 | 57.35 | 23.0 | 17.5 | 12.1 | 33.54 | 0.130 | 61,500 | 0.106¶ | 33,200¶ | ||||
|
| ||||||||||||||
| 2 | < 1 y | No | < 200 | None | 47,586 | 64.71 | (0.7) | (2.7) | (8.8) | 29.81 | -- | -- | -- | -- |
|
| ||||||||||||||
| 5∥ | 50,895 | 65.10 | 12.5 | 14.7 | 11.6 | 29.87 | 0.065 | 50,800 | 0.065 | 50,800 | ||||
|
| ||||||||||||||
| 4 | 51,562 | 65.14 | 18.1 | 16.9 | 12.9 | 29.88 | 0.071 | 56,100 | 0.006 | 115,100 | ||||
|
| ||||||||||||||
| 3 | 52,604 | 65.17 | 18.1 | 18.1 | 13.4 | 29.89 | 0.079 | 63,800 | 0.008 | 135,300 | ||||
|
| ||||||||||||||
| 2§ | 54,616 | 65.21 | 23.6 | 19.6 | 14.8 | 29.89 | 0.085 | 82,700 | 0.006 | 314,400 | ||||
|
| ||||||||||||||
| 1 | 60,438 | 65.24 | 26.4 | 21.4 | 15.7 | 29.90 | 0.091 | 141,900 | 0.006 | 1,058,400 | ||||
|
| ||||||||||||||
| 3 | < 1 y | No | ≥ 200 | None | 48,712 | 59.04 | (2.9) | (9.6) | (25.2) | 28.10 | -- | -- | -- | -- |
|
| ||||||||||||||
| 5 | 52,834 | 59.74 | 12.9 | 13.2 | 9.9 | 28.28 | 0.173 | 23,800 | 0.173 | 23,800 | ||||
|
| ||||||||||||||
| 4 | 53,501 | 59.81 | 17.1 | 15.6 | 11.0 | 28.29 | 0.190 | 25,200 | 0.017 | 38,600 | ||||
|
| ||||||||||||||
| 3 | 54,511 | 59.85 | 18.1 | 16.6 | 11.3 | 28.31 | 0.203 | 28,600 | 0.012 | 81,500 | ||||
|
| ||||||||||||||
| 2 | 56,372 | 59.91 | 22.3 | 17.9 | 12.2 | 28.32 | 0.219 | 35,000 | 0.016 | 117,100 | ||||
|
| ||||||||||||||
| 1 | 61,576 | 59.98 | 24.7 | 19.2 | 12.9 | 28.34 | 0.238 | 54,100 | 0.019 | 217,000 | ||||
|
| ||||||||||||||
| 4 | 1-4 y | Yes | Any | None | 52,573 | 42.46 | (5.8) | (15.6) | (31.1) | 25.07 | -- | -- | -- | -- |
|
| ||||||||||||||
| 5 | 55,398 | 42.90 | 12.2 | 10.4 | 6.9 | 25.23 | 0.155 | 18,300 | 0.155 | 18,300 | ||||
|
| ||||||||||||||
| 4 | 55,911 | 42.93 | 15.3 | 12.2 | 7.6 | 25.24 | 0.167 | 20,000 | 0.012 | 41,100 | ||||
|
| ||||||||||||||
| 3 | 56,661 | 42.97 | 16.7 | 13.1 | 7.9 | 25.26 | 0.182 | 22,400 | 0.015 | 49,000 | ||||
|
| ||||||||||||||
| 2 | 58,064 | 43.00 | 20.1 | 14.1 | 8.6 | 25.27 | 0.196 | 28,000 | 0.014 | 103,100 | ||||
|
| ||||||||||||||
| 1 | 61,966 | 43.05 | 22.2 | 15.4 | 9.2 | 25.29 | 0.218 | 43,100 | 0.022 | 177,400 | ||||
|
| ||||||||||||||
| 5 | 1-4 y | No | < 100 | None | 49,090 | 62.69 | (0.7) | (2.6) | (8.9) | 31.18 | -- | -- | -- | -- |
|
| ||||||||||||||
| 5 | 52,238 | 63.06 | 12.5 | 13.7 | 11.4 | 31.25 | 0.061 | 51,300 | 0.061 | 51,400 | ||||
|
| ||||||||||||||
| 4 | 52,868 | 63.08 | 16.7 | 16.4 | 13.0 | 31.25 | 0.065 | 58,400 | 0.003 | Dominated§§ | ||||
|
| ||||||||||||||
| 3 | 53,867 | 63.11 | 18.1 | 17.9 | 13.4 | 31.26 | 0.072 | 66,300 | 0.011 | 152,200 | ||||
|
| ||||||||||||||
| 2 | 55,779 | 63.13 | 22.2 | 19.0 | 14.5 | 31.26 | 0.074 | 90,000 | 0.002 | Dominated | ||||
|
| ||||||||||||||
| 1 | 61,323 | 63.18 | 25.0 | 20.5 | 15.5 | 31.27 | 0.083 | 146,700 | 0.009 | 609,200 | ||||
|
| ||||||||||||||
| 6 | 1-4 y | No | 100 to < 300 | None | 48,667 | 61.58 | (1.0) | (3.3) | (10.2) | 30.70 | -- | -- | -- | -- |
|
| ||||||||||||||
| 5 | 52,081 | 61.94 | 11.3 | 12.9 | 11.0 | 30.76 | 0.060 | 56,900 | 0.060 | 56,900 | ||||
|
| ||||||||||||||
| 4 | 52,706 | 61.97 | 16.5 | 15.3 | 12.5 | 30.77 | 0.066 | 61,300 | 0.006 | 106,000 | ||||
|
| ||||||||||||||
| 3 | 53,702 | 62.00 | 17.5 | 16.5 | 12.8 | 30.78 | 0.074 | 67,800 | 0.008 | 118,500 | ||||
|
| ||||||||||||||
| 2 | 55,580 | 62.03 | 21.6 | 18.3 | 14.1 | 30.78 | 0.079 | 87,100 | 0.005 | 368,200 | ||||
|
| ||||||||||||||
| 1 | 61,004 | 62.06 | 23.7 | 19.5 | 14.8 | 30.79 | 0.086 | 143,600 | 0.006 | 834,500 | ||||
|
| ||||||||||||||
| 7 | 1-4 y | No | ≥ 300 | None | 51,280 | 55.48 | (3.6) | (11.4) | (29.1) | 28.72 | -- | -- | -- | -- |
|
| ||||||||||||||
| 5 | 55,163 | 56.18 | 12.4 | 12.4 | 9.3 | 28.89 | 0.175 | 22,200 | 0.175 | 22,200 | ||||
|
| ||||||||||||||
| 4 | 55,776 | 56.23 | 16.1 | 14.8 | 10.3 | 28.91 | 0.190 | 23,700 | 0.015 | 40,600 | ||||
|
| ||||||||||||||
| 3 | 56,709 | 56.29 | 18.0 | 16.0 | 10.7 | 28.93 | 0.210 | 25,900 | 0.020 | 47,600 | ||||
|
| ||||||||||||||
| 2 | 58,438 | 56.35 | 22.0 | 17.3 | 11.5 | 28.94 | 0.226 | 31,700 | 0.016 | 104,800 | ||||
|
| ||||||||||||||
| 1 | 63,182 | 56.42 | 24.5 | 18.7 | 12.3 | 28.96 | 0.246 | 48,300 | 0.020 | 234,900 | ||||
|
| ||||||||||||||
| 8 | ≥ 5 y | Yes | < 300 | None | 48,975 | 48.70 | (1.9) | (6.1) | (15.2) | 33.23 | -- | -- | -- | -- |
|
| ||||||||||||||
| 5 | 51,364 | 48.89 | 12.3 | 12.1 | 9.6 | 33.29 | 0.060 | 40,000 | 0.060 | 40,000 | ||||
|
| ||||||||||||||
| 4 | 51,852 | 48.91 | 15.9 | 14.4 | 10.8 | 33.30 | 0.065 | 44,600 | 0.005 | 101,600 | ||||
|
| ||||||||||||||
| 3 | 52,613 | 48.92 | 17.4 | 15.7 | 11.4 | 33.30 | 0.070 | 51,700 | 0.006 | 131,200 | ||||
|
| ||||||||||||||
| 2 | 54,051 | 48.94 | 22.0 | 17.0 | 12.5 | 33.31 | 0.076 | 66,400 | 0.006 | 235,800 | ||||
|
| ||||||||||||||
| 1 | 58,174 | 48.97 | 24.6 | 18.7 | 13.6 | 33.32 | 0.087 | 106,100 | 0.010 | 400,300 | ||||
|
| ||||||||||||||
| 9 | ≥ 5 y | Yes | ≥ 300 | None | 51,048 | 44.84 | (5.8) | (16.1) | (31.3) | 31.52 | -- | -- | -- | -- |
|
| ||||||||||||||
| 5 | 53,618 | 45.18 | 11.6 | 10.5 | 7.2 | 31.64 | 0.125 | 20,500 | 0.125 | 20,500 | ||||
|
| ||||||||||||||
| 4 | 54,104 | 45.21 | 15.0 | 12.5 | 8.0 | 31.66 | 0.139 | 22,000 | 0.014 | 35,500 | ||||
|
| ||||||||||||||
| 3 | 54,816 | 45.23 | 16.4 | 13.7 | 8.6 | 31.67 | 0.149 | 25,300 | 0.010 | 73,400 | ||||
|
| ||||||||||||||
| 2 | 56,120 | 45.26 | 20.5 | 15.0 | 9.4 | 31.68 | 0.163 | 31,100 | 0.014 | 91,800 | ||||
|
| ||||||||||||||
| 1 | 59,724 | 45.31 | 22.9 | 16.4 | 10.3 | 31.70 | 0.183 | 47,300 | 0.020 | 176,600 | ||||
|
| ||||||||||||||
| 10 | ≥ 5 y | No | < 200 | None | 52,165 | 62.89 | (0.5) | (1.8) | (8.0) | 37.74 | -- | -- | -- | -- |
|
| ||||||||||||||
| 5 | 55,084 | 63.11 | 12.8 | 14.2 | 12.8 | 37.76 | 0.021 | 138,200 | 0.021 | 138,400 | ||||
|
| ||||||||||||||
| 4 | 55,677 | 63.12 | 17.0 | 17.5 | 14.9 | 37.76 | 0.022 | 158,800 | 0.001 | Dominated | ||||
|
| ||||||||||||||
| 3 | 56,624 | 63.15 | 19.2 | 18.6 | 15.4 | 37.77 | 0.028 | 158,400 | 0.007 | 220,000 | ||||
|
| ||||||||||||||
| 2 | 58,427 | 63.17 | 23.4 | 20.2 | 17.2 | 37.77 | 0.030 | 210,600 | 0.002 | 1,127,000 | ||||
|
| ||||||||||||||
| 1 | 63,659 | 63.19 | 25.5 | 21.9 | 18.4 | 37.77 | 0.031 | 368,400 | 0.002 | 3,487,700 | ||||
|
| ||||||||||||||
| 11 | ≥ 5 y | No | 200 to <300 | None | 52,767 | 61.81 | (0.9) | (3.3) | (12.0) | 37.66 | -- | -- | -- | -- |
|
| ||||||||||||||
| 5 | 55,849 | 62.10 | 13.3 | 14.2 | 12.0 | 37.71 | 0.057 | 54,600 | 0.057 | 54,600 | ||||
|
| ||||||||||||||
| 4 | 56,438 | 62.11 | 16.7 | 16.6 | 13.6 | 37.71 | 0.057 | 64,700 | 0.000 | Dominated | ||||
|
| ||||||||||||||
| 3 | 57,367 | 62.14 | 17.8 | 18.1 | 14.2 | 37.72 | 0.064 | 72,200 | 0.007 | 207,900 | ||||
|
| ||||||||||||||
| 2 | 59,135 | 62.16 | 23.3 | 19.3 | 15.6 | 37.72 | 0.066 | 97,400 | 0.002 | Dominated | ||||
|
| ||||||||||||||
| 1 | 64,197 | 62.20 | 24.4 | 21.1 | 16.8 | 37.73 | 0.076 | 151,400 | 0.012 | 583,800 | ||||
|
| ||||||||||||||
| 12 | ≥ 5 y | No | ≥ 300 | None | 53,962 | 58.79 | (3.0) | (9.6) | (25.5) | 36.93 | -- | -- | -- | -- |
|
| ||||||||||||||
| 5 | 57,128 | 59.21 | 12.0 | 11.8 | 8.6 | 37.04 | 0.111 | 28,500 | 0.111 | 28,500 | ||||
|
| ||||||||||||||
| 4 | 57,703 | 59.24 | 15.7 | 14.2 | 9.9 | 37.05 | 0.120 | 31,100 | 0.009 | 61,800 | ||||
|
| ||||||||||||||
| 3 | 58,607 | 59.27 | 17.1 | 15.3 | 10.2 | 37.06 | 0.127 | 36,500 | 0.007 | Dominated | ||||
|
| ||||||||||||||
| 2 | 60,298 | 59.33 | 21.4 | 16.4 | 11.2 | 37.08 | 0.142 | 44,600 | 0.015 | 113,500 | ||||
|
| ||||||||||||||
| 1 | 64,999 | 59.38 | 23.8 | 18.1 | 12.2 | 37.09 | 0.159 | 69,500 | 0.017 | 278,100 | ||||
AC = anthracycline; COG = Children’s Oncology Group; Dx = diagnosis; HF = heart failure; ICER = incremental cost effectiveness ratio; QALY = quality-adjusted life-year; RT = radiation therapy.
Excludes: Risk profile 1: < 1 year old, chest irradiated, exposed to any anthracycline.
0% discount.
As recommended by the COG Guidelines for each risk profile. The row values for the entire AC-exposed cohort are weighted means of the values across the 11 risk profiles, using percentages of the risk profiles in the cohort as weights. The ICER was calculated by taking the weighted mean of the cost over the 11 risk profiles divided by the weighted mean of the QALY over the 11 risk profiles.
Non-italicized bolded rows correspond to screening frequencies recommended by the COG Guidelines.
Bolded rows in italics indicate the screening frequency with an ICER under $100,000 per QALY when compared to the immediately preceding less expensive screening frequency for the risk profile. When this is not indicated (risk profile 5), the screening frequency with an ICER under $100,000 is the same as that of the COG Guidelines. For risk profile 10, the corresponding screening frequency is 10 years (incremental QALY=0.017, ICER=$93,400; not shown).
Shown are the incremental QALY and ICER for the entire AC-exposed cohort (compared to no screening and compared to the immediately preceding less expensive strategy) based on the screening frequency with an ICER under $100,000 per QALY when compared to no screening for each risk profile (bolded and italicized rows, except for risk profiles 5 and 10, as explained in ∥).
Discrepancies may exist due to rounding.
Non-dominated strategies are screening frequencies that are neither less effective nor more expensive than at least one competing alternative.
The frequency was removed due to extended dominance, i.e. the frequency gained fewer QALYs and was more costly than at least one other alternative frequency.
Following the COG Guidelines for life instead of no screening increased the average cohort life-expectancy from 56.8 to 57.3 years, delayed HF onset on average by 1.5 years, increased the average QALY by 0.13, and decreased the cumulative incidence (“risk”) of HF by 23%, 18%, and 12% at 20, 30, and 50 years after cancer diagnosis, respectively. Across risk profiles 2 to 12, the average gain in life expectancy ranged from 2.6 to 11.3 months, the gain in QALYs ranged from 0.02 to 0.25, and the reduction in HF risk at 20, 30, and 50 years after cancer diagnosis ranged from 12.3% to 24.7%, 12.1% to 19.6%, and 9.2% to 15.6%, respectively. The ICER for the cohort (compared to no screening) was $61,500 (Table 3). Depending on the risk profile 2 to 12, the ICER ranged from $40,000 to $138,200 (Table 3). Within any age group, the ICER was better for those at higher risk for HF due to chest irradiation or anthracycline dose, whether controlled for screening frequency or based on the frequencies in the COG Guidelines.
Screening Frequencies of 1 to 5 Years
The base-case analyses examined the frequencies recommended by the COG Guidelines; however, these screening frequencies may not be optimal. Our results indicate that the costliest—but most effective—strategy was annual screening (ICER: $43,100 to $368,400), and the least-expensive was screening every 5 years (ICER: $18,300 to $138,200). Given these observations above, we identified the most cost-effective screening frequencies costing under $100,000 per QALY. Under this constraint (Table 3), annual screening recommendations in the COG Guidelines was reduced to every 2 to 4 years depending on the risk group, biennial screening to every 5 years, and every 5-year screening recommended for risk profiles 5 and 10 was maintained for the former and reduced to every 10 years for the latter. This overall less-frequent screening strategy maintained 80% of the health benefits of the COG Guidelines at nearly half the ICER ($33,200, relative to no screening): life-expectancy gain was 4.9 months (vs. 6.1); QALY gain was 0.11 (vs. 0.13); and the reduction in HF risk at 30 years after diagnosis was 14.3% (vs. 17.5%). When compared to the overall less-frequent screening strategy, the COG Guidelines had an overall ICER of $185,300.
Sensitivity Analyses
The ICER was most sensitive to ALVD treatment efficacy (percent reduction in annual HF incidence) (Figure 1). If treatment efficacy was 50%, the ICER decreased to $34,900 (base-case: $61,500) and the reduction in HF risk at 30 years after cancer diagnosis increased to 28.6% (base-case: 17.5%). When treatment efficacy was 10%, the HF risk at 30 years reduced by 7.8%, and the ICER was $167,200. Limiting the duration of treatment efficacy to 6 years, as observed in one study (4), increased the ICER ($118,100) and decreased the reduction in HF risk at 30 years after cancer diagnosis to 10.7%.
Figure 1.
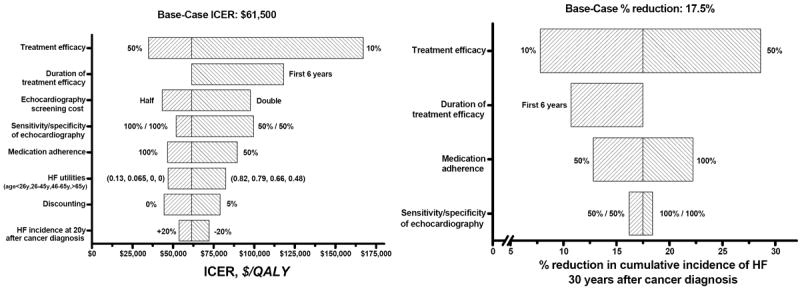
Tornado diagrams of the one-way sensitivity analyses for ICER and the percent reduction in the cumulative incidence of HF at 30 years after cancer diagnosis, by varying key variables.
ACE = angiotensin-converting enzyme
HF = heart failure
ICER = incremental cost-effectiveness ratio
QALY = quality-adjusted life-year
The ICER was next most sensitive to the cost of echocardiography. Doubling the cost increased the ICER ($97,700). When the echocardiographic sensitivity and specificity were 50%, screening was more costly (ICER: $99,600); but the effect on reducing the HF risk at 30 years was small (16.2% vs. 17.5% for the base-case). Complete adherence (100%) to ALVD treatment improved cost-effectiveness (ICER: $46,600) and resulted in a larger reduction (22.2%) in HF risk at 30 years after diagnosis. Low adherence (50%) made screening more costly (ICER: $89,700) and decreased the percent reduction in HF risk at 30 years (12.8%).
Screening was more cost-effective (ICER: $47,000) if HF utilities (quality-of-life weight) were lower than assumed for the base-case, and less cost-effective (ICER: $82,500) if they were higher. The ICER was least sensitive to changes in HF risk at 20 years after cancer diagnosis: $44,500 and $53,800, respectively, for a 20% higher and a 20% lower risk. The ICER for 0% and 5% discount rates were $44,500 and $78,900, respectively.
Two-way sensitivity analyses (Appendix Figure 4) showed that the ICER of the Guidelines remained below $100,000 if ALVD treatment efficacy was 20% or higher and the echocardiographic sensitivity and specificity were at least 75% and 90%, respectively. If treatment efficacy was 10% or less, the ICER would exceed $142,000 even with 100% echocardiographic sensitivity and specificity.
DISCUSSION
Echocardiographic screening for ALVD following the COG Guidelines with subsequent treatment could extend the life expectancy of a childhood cancer survivor by 6.1 months, QALYs by 1.6 months, and reduce the HF risk at 30 years after cancer diagnosis by 18%. The cost per QALY gained (compared to no screening) was $61,500, which is lower than the $100,000 per QALY often cited to assess the cost-effectiveness of interventions (QALY is one-year of life lived in perfect health, reflecting the quantity and the quality of life) (44). We also identified a more cost-effective screening strategy ($33,200 per QALY) that calls for less-frequent screening than the COG Guidelines while preserving most of the health benefits.
If $100,000 was used as the cost-effectiveness benchmark, the COG Guidelines would not be considered cost-effective for ALVD treatment efficacy equal to or lower than 10% or for treatment efficacy that was short-lived (e.g. 6 years, as suggested by one study [4]), keeping other variables fixed. However, the cost per QALY remained around $100,000 or less for echocardiographic sensitivity and specificity as low as 50%, doubling of echocardiography cost, treatment adherence of 50% (equivalent to 15% ALVD treatment efficacy), and HF quality-of-life that was higher or HF risk at 20 years after cancer diagnosis that was lower than that assumed for the base-case. Two-way sensitivity analyses further showed that the cost per QALY of screening was around $100,000 or less if ALVD treatment efficacy was 30% or higher even for low echocardiographic sensitivity and specificity of 50%. For a lower ALVD treatment efficacy of 20%, the cost per QALY remained under $100,000 as long as the echocardiographic sensitivity and specificity were higher than 75% and 90%, respectively.
Heidenreich et al. (19) examined the cost-effectiveness of a one-time screen for ALVD using serum B-type natriuretic peptide and echocardiography (92% sensitivity, 96% specificity) in older adults in the general population. The efficacy of ACE inhibitor therapy for treating ALVD was assumed to be 34%. They estimated the cost per QALY of echocardiography as $69,000 (2010 US dollars) compared to no screening. It is difficult to compare their results to ours given the differences in at-risk population (older, general population vs. anthracycline-exposed childhood cancer survivors), screening frequency (one-time vs. repeated), and confirmation diagnostics (none vs. cardiac MRI). Nevertheless, both studies suggest that echocardiographic screening for ALVD is cost-effective. We found screening to be more cost-effective for survivors exposed to higher anthracycline doses, with an attendant higher risk of anthracycline-related HF. Heidenreich et al. also showed that cost-effectiveness of screening with B-type natriuretic peptide increased as ALVD prevalence increased. Other programs for preventing HF also found screening to be more beneficial for populations with higher risks (45, 46).
Reductions in HF risk were greater sooner after cancer diagnosis than later, possibly because at younger ages the HF risk is higher than the competing risks of non-HF mortality. The burden of chronic diseases (and the attendant mortality) in this cohort increases with time since cancer diagnosis (47, 48), which we addressed by the multiplicative risk assumption. The benefit of screening one disease (ALVD) is mitigated with time because the rate of non-HF-related mortality increases. Therefore, beginning screening sooner after cancer diagnosis rather than later could better control HF risk.
Our assessment of the cost-effectiveness of the COG Guidelines are limited by two sources of uncertainty: 1) the assumptions derived largely from adult data regarding ALVD treatment efficacy, the sensitivity and specificity of echocardiography, and medication adherence; and 2) the assumptions of constant HF risk beyond 20 years after cancer diagnosis and the use of a multiplicative risk model to estimate non-HF mortality at older ages.
The implications of the first source of uncertainty can be gleaned from the results of sensitivity analyses: the COG Guidelines would not be cost-effective if the true ALVD treatment efficacy in childhood cancer survivors was lower than 20% and the sensitivity and specificity of echocardiography were lower than 75% and 90%, respectively; or if treatment efficacy (at 30%) is limited to 6-years, or medication adherence was lower than 50%. However, the treatment efficacy for therapies combining ACE inhibitors and beta-blockers as well as the duration of treatment efficacy is currently unknown, and merits future investigation.
The second source of uncertainty (holding HF risk constant beyond 20 years and assuming a multiplicative model for excess non-HF mortality) underestimates the lifetime risk of HF and, therefore, the cost-effectiveness of screening. In fact, when we applied the additive risk assumption in one risk profile setting, the estimated cost per QALY was lower than that of the multiplicative risk assumption, showing that the multiplicative model we used tends to underestimate the cost-effectiveness of screening. Finally, we did not address the cost of heart transplantation, which also may underestimate the cost-effectiveness of screening.
Strengths of our studies include simulating the entire cohort of anthracycline-exposed childhood cancer survivors and their characteristics, making our assessment of the cost-effectiveness of screening more realistic than if a narrow subgroup of individuals were examined. We also identified optimal screening frequencies for individual risk profiles, hence a more cost-effective screening strategy for the cohort.
In summary, lifetime echocardiographic screening for ALVD as recommended by the COG Guidelines would be cost-effective for decreasing the HF risk in anthracycline-exposed childhood cancer survivors, given that ALVD treatment efficacy exceeds 20%. A more cost-effective strategy involving less frequent screening, and hence less patient burden, could provide similar health benefits at half of the cost. Based on our modeling using the CCSS cohort, annual screening recommended by the Guidelines for more than 50% of survivors could be decreased to every 2 to 4 years. The biennial screening recommended for more than 30% of survivors may be decreased to every 5 years. Every 5-year screening recommended for 3% of survivors could be maintained, but the frequency could be reduced to 10 years for an additional12% of the survivors. This study provides a rationale for decreasing the screening frequencies in the COG Guidelines.
Supplementary Material
Acknowledgments
This study was supported in part by the Lance Armstrong Foundation (S.A. and F.L.W.) and grants No. U24-CA55727 (L.L.R.), U10-CA098543 (Adamson), 2 K12-CA001727-14 (Mortimer) from the National Cancer Institute.
Appendix Figure 1.
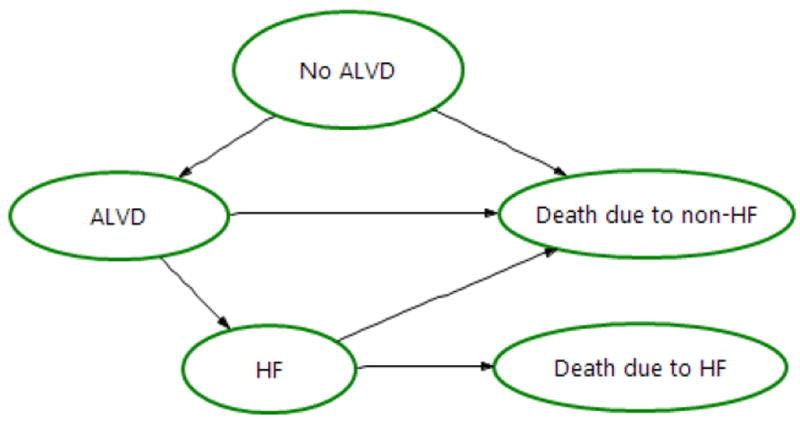
Four-health state transition diagram.
ALVD = asymptomatic left ventricular dysfunction
HF = heart failure
Appendix Figure 2.

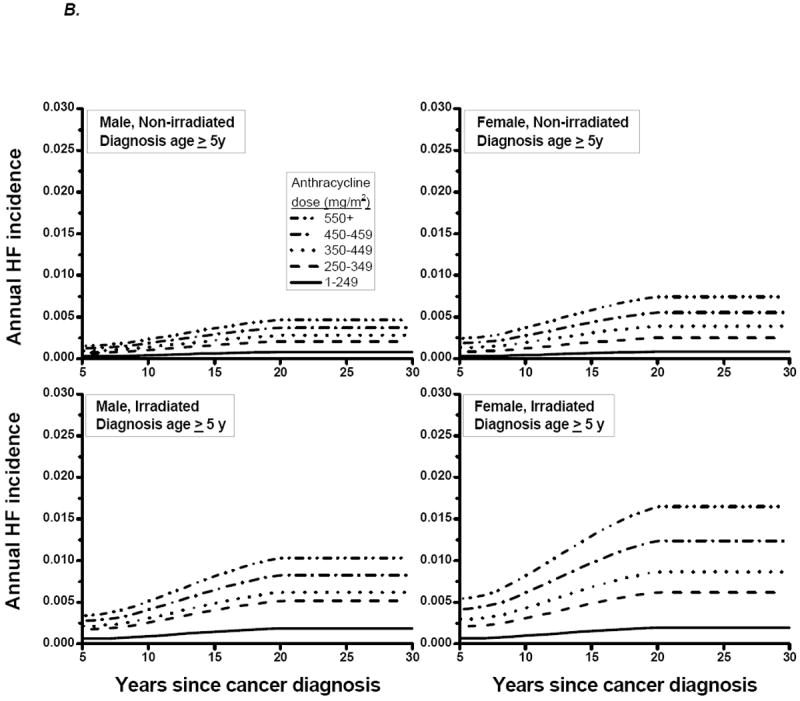
Annual incidence of HF by years since cancer diagnosis, for
A) age at cancer diagnosis < 5 years;
B) age at cancer diagnosis ≥ 5 years
HF = heart failure
Appendix Figure 3.

Annual non-HF mortality by attained age
HF = heart failure
RR = relative risk (compared to the U.S. population)
Appendix Figure 4.
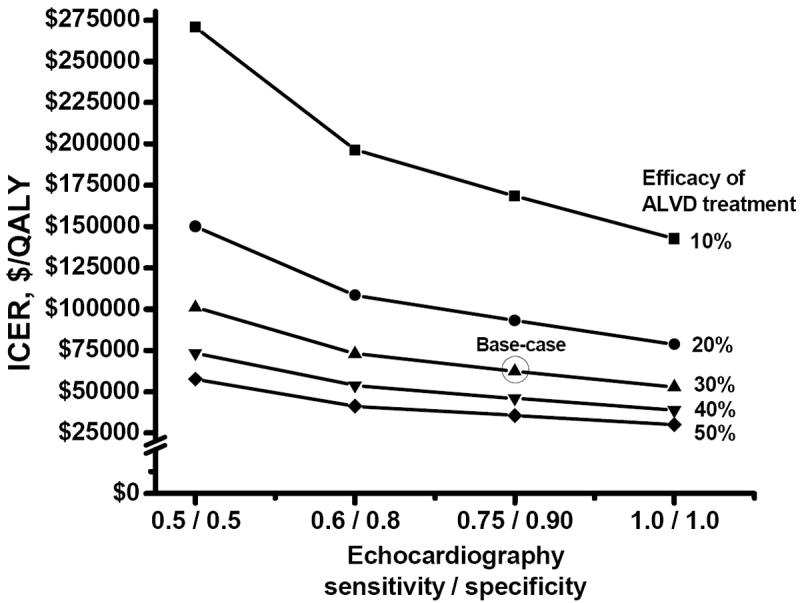
Two-way sensitivity analyses for ICER, by varying the efficacy of ALVD treatment and the sensitivity and specificity of echocardiography for detecting ALVD
ALVD = asymptomatic left ventricular dysfunction
ICER = incremental cost-effectiveness ratio
QALY = quality-adjusted life-year
Appendix Table 1.
Children’s Oncology Group Guidelines for Echocardiographic Screening for ALVD
| Risk profile | Frequency in the CCSS cohort, %* | Age at cancer diagnosis, y | Chest irradiation | Anthracycline dose, mg/m2 | Recommended screening interval, y |
|---|---|---|---|---|---|
| 1 | 1.3 | < 1 | Yes | Any | 1 |
| 2 | 2.0 | < 1 | No | <200 | 2 |
| 3 | 2.2 | < 1 | No | ≥200 | 1 |
| 4 | 5.1 | 1-4 | Yes | Any | 1 |
| 5 | 3.1 | 1-4 | No | <100 | 5 |
| 6 | 12.4 | 1-4 | No | ≥100 to 299 | 2 |
| 7 | 12.0 | 1-4 | No | ≥300 | 1 |
| 8 | 9.4 | ≥ 5 | Yes | < 300 | 2 |
| 9 | 7.7 | ≥ 5 | Yes | ≥300 | 1 |
| 10 | 11.8 | ≥ 5 | No | <200 | 5 |
| 11 | 7.8 | ≥ 5 | No | ≥200 to 299 | 2 |
| 12 | 25.3 | ≥ 5 | No | ≥300 | 1 |
The total is more than 100% due to rounding.
Appendix Table 2.
Model-based Cumulative Incidence of ALVD and Lifetime Mortality from HF
| Years since cancer diagnosis | |||
|---|---|---|---|
| 20 | 30 | 50 | |
| Cumulative incidence of ALVD, % | 6.9 | 13.3 | 26.9 |
|
| |||
| Lifetime mortality from HF, % | 1.0 | 3.9 | 11.2 |
ALVD = asymptomatic left ventricular dysfunction; HF = heart failure.
Appendix Table 3.
Comparison of Model-based Cumulative Incidence of HF with Published Studies
| Published studies: First author [year] (reference no) | No. exposed to anthracycline | Age at cancer diagnosis, y | Cumulative anthracycline dose (mg/m2) | RT % | Cumulative incidence of HF at 20y since cancer diagnosis | COG Guidelines risk profiles potentially represented in the published studies | Model-based cumulative incidence of HF at 20y since cancer diagnosis, %§ | |
|---|---|---|---|---|---|---|---|---|
| % | 95% CI | |||||||
| van Dalen [2006] (22) | 830 | Mean age at treatment 8.8 | Median 280; Mean 288; range 15-900 | 21 | 5.5 | 1.5-9.5 | 4 to 12 | 0.5 to 5.8 |
|
| ||||||||
| Mulrooney [2009] (21) | 4,765 (14,358 total in study) | Median 6.0* | NG | 66* | NG | NG | 4 to 12 | 0.5 to 5.8 |
| <250 | NG | 2.4 | NG | 4,5,6,8,10,11 | 0.5 to 5.8 | |||
| ≥250 | NG | 3.8 | NG | 4,6,7,8,9,11,12 | 0.6 to 5.8 | |||
|
| ||||||||
| van der Pal [2012] (23) | 565 (1,362 total in study) | Median age category 5-9* | Median dose category 201-300; range 1- >500 | 0 | 4.0 | 1.8-6.2 | 5,6,7,10,11,12 | 0.5 to 3.6 |
| 100 | 7.9 | 1.4-14.0 | 4,8,9 | 0.6 to 5.8 | ||||
|
| ||||||||
| Armstrong [2013] (28) | 3,779 (10,724 total in study) | Median age category 5-9.9* | NG | 0 | 2‡ | NG | 5,6,7,10,11,12 | 0.5 to 3.0 |
| 100 | 3.8‡ | NG | 4,8,9 | 0.6 to 5.8 | ||||
CI = confidence interval; COG = Children’s Oncology Group; HF = heart failure; NG = not given; RT = radiation therapy.
For the total study cohort.
Determined by assuming an exposure age of 7.5y to estimate the cumulative incidence of HF at 20 and 30 years after exposure (from Fig. 2D, Armstrong [2013] (28)).
Ranges shown are based on the COG Guidelines’ risk profile groups potentially represented in the published study data.
Footnotes
Presented in abstract form at the annual meeting of the American Society of Clinical Oncology, Chicago, IL, June 1-6, 2012; and the 12th International Conference on Long-term Complications of Treatment of Children and Adolescents for Cancer, Williamsburg, VA, June 8-9, 2012.
Conflicts of interest
We declare that we have no conflict of interest.
References
- 1.Lipshultz SE, Alvarez JA, Scully RE. Anthracycline associated cardiotoxicity in survivors of childhood cancer. Heart. 2008;94(4):525–33. doi: 10.1136/hrt.2007.136093. [DOI] [PubMed] [Google Scholar]
- 2.Lipshultz SE, Adams MJ, Colan SD, Constine LS, Herman EH, Hsu DT, et al. Long-term Cardiovascular Toxicity in Children, Adolescents, and Young Adults Who Receive Cancer Therapy: Pathophysiology, Course, Monitoring, Management, Prevention, and Research Directions: A Scientific Statement From the American Heart Association. Circulation. 2013 doi: 10.1161/CIR.0b013e3182a88099. [DOI] [PubMed] [Google Scholar]
- 3.Lipshultz SE, Colan SD, Gelber RD, Perez-Atayde AR, Sallan SE, Sanders SP. Late cardiac effects of doxorubicin therapy for acute lymphoblastic leukemia in childhood. N Engl J Med. 1991;324(12):808–15. doi: 10.1056/NEJM199103213241205. [DOI] [PubMed] [Google Scholar]
- 4.Lipshultz SE, Lipsitz SR, Sallan SE, Simbre VCn, Shaikh SL, Mone SM, et al. Long-term enalapril therapy for left ventricular dysfunction in doxorubicin-treated survivors of childhood cancer. J Clin Oncol. 2002;20(23):4517–22. doi: 10.1200/JCO.2002.12.102. [DOI] [PubMed] [Google Scholar]
- 5.Lipshultz SE, Lipsitz SR, Sallan SE, Dalton VM, Mone SM, Gelber RD, et al. Chronic progressive cardiac dysfunction years after doxorubicin therapy for childhood acute lymphoblastic leukemia. J Clin Oncol. 2005;23(12):2629–36. doi: 10.1200/JCO.2005.12.121. [DOI] [PubMed] [Google Scholar]
- 6.Landier W, Bhatia S, Eshelman DA, Forte KJ, Sweeney T, Hester AL, et al. Development of risk-based guidelines for pediatric cancer survivors: the Children’s Oncology Group Long-Term Follow-Up Guidelines from the Children’s Oncology Group Late Effects Committee and Nursing Discipline. J Clin Oncol. 2004;22(24):4979–90. doi: 10.1200/JCO.2004.11.032. [DOI] [PubMed] [Google Scholar]
- 7.Hunt SA, Abraham WT, Chin MH, Feldman AM, Francis GS, Ganiats TG, et al. ACC/AHA 2005 Guideline Update for the Diagnosis and Management of Chronic Heart Failure in the Adult: a report of the American College of Cardiology/American Heart Association Task Force on Practice Guidelines (Writing Committee to Update the 2001 Guidelines for the Evaluation and Management of Heart Failure): developed in collaboration with the American College of Chest Physicians and the International Society for Heart and Lung Transplantation: endorsed by the Heart Rhythm Society. Circulation. 2005;112(12):e154–235. doi: 10.1161/CIRCULATIONAHA.105.167586. [DOI] [PubMed] [Google Scholar]
- 8.Shankar SM, Marina N, Hudson MM, Hodgson DC, Adams MJ, Landier W, et al. Monitoring for cardiovascular disease in survivors of childhood cancer: report from the Cardiovascular Disease Task Force of the Children’s Oncology Group. Pediatrics. 2008;121(2):e387–96. doi: 10.1542/peds.2007-0575. [DOI] [PubMed] [Google Scholar]
- 9.Gold MR, S J, Russell LB, Weinstein MC, editors. Cost-Effectiveness in Health and Medicine. New York: Oxford University Press; 1996. [Google Scholar]
- 10.Robison LL, Armstrong GT, Boice JD, Chow EJ, Davies SM, Donaldson SS, et al. The Childhood Cancer Survivor Study: a National Cancer Institute-supported resource for outcome and intervention research. J Clin Oncol. 2009;27(14):2308–18. doi: 10.1200/JCO.2009.22.3339. [DOI] [PMC free article] [PubMed] [Google Scholar]
- 11.Robison LL, Mertens AC, Boice JD, Breslow NE, Donaldson SS, Green DM, et al. Study design and cohort characteristics of the Childhood Cancer Survivor Study: a multi-institutional collaborative project. Med Pediatr Oncol. 2002;38(4):229–39. doi: 10.1002/mpo.1316. [DOI] [PubMed] [Google Scholar]
- 12.The SOLVD Investigators. Effect of enalapril on survival in patients with reduced left ventricular ejection fractions and congestive heart failure. N Engl J Med. 1991;325:293–302. doi: 10.1056/NEJM199108013250501. [DOI] [PubMed] [Google Scholar]
- 13.Erbel R, Schweizer P, Krebs W, Meyer J, Effert S. Sensitivity and specificity of two-dimensional echocardiography in detection of impaired left ventricular function. Eur Heart J. 1984;5(6):477–89. doi: 10.1093/oxfordjournals.eurheartj.a061694. [DOI] [PubMed] [Google Scholar]
- 14.Naik MM, Diamond GA, Pai T, Soffer A, Siegel RJ. Correspondence of left ventricular ejection fraction determinations from two-dimensional echocardiography, radionuclide angiography and contrast cineangiography. J Am Coll Cardiol. 1995;25(4):937–42. doi: 10.1016/0735-1097(94)00506-L. [DOI] [PubMed] [Google Scholar]
- 15.Lucariello RJ, Sun Y, Doganay G, Chiaramida SA. Sensitivity and specificity of left ventricular ejection fraction by echocardiographic automated border detection: comparison with radionuclide ventriculography. Clin Cardiol. 1997;20(11):943–8. doi: 10.1002/clc.4960201108. [DOI] [PMC free article] [PubMed] [Google Scholar]
- 16.Habash-Bseiso DE, Rokey R, Berger CJ, Weier AW, Chyou PH. Accuracy of noninvasive ejection fraction measurement in a large community-based clinic. Clin Med Res. 2005;3(2):75–82. doi: 10.3121/cmr.3.2.75. [DOI] [PMC free article] [PubMed] [Google Scholar]
- 17.Gimelli A, Landi P, Marraccini P, Sicari R, Frumento P, L’Abbate A, et al. Left ventricular ejection fraction measurements: accuracy and prognostic implications in a large population of patients with known or suspected ischemic heart disease. Int J Cardiovasc Imaging. 2008;24(8):793–801. doi: 10.1007/s10554-008-9317-1. [DOI] [PubMed] [Google Scholar]
- 18.Rovai D, Morales MA, Di Bella G, Prediletto R, De Nes M, Pingitore A, et al. Echocardiography and the clinical diagnosis of left ventricular dysfunction. Acta Cardiol. 2008;63(4):507–13. doi: 10.2143/AC.63.4.2033051. [DOI] [PubMed] [Google Scholar]
- 19.Heidenreich PA, Gubens MA, Fonarow GC, Konstam MA, Stevenson LW, Shekelle PG. Cost-effectiveness of screening with B-type natriuretic peptide to identify patients with reduced left ventricular ejection fraction. J Am Coll Cardiol. 2004;43(6):1019–26. doi: 10.1016/j.jacc.2003.10.043. [DOI] [PubMed] [Google Scholar]
- 20.Cardinale D, Colombo A, Lamantia G, Colombo N, Civelli M, De Giacomi G, et al. Anthracycline-induced cardiomyopathy : clinical relevance and response to pharmacologic therapy. J Am Coll Cardiol. 2010;55(3):213–20. doi: 10.1016/j.jacc.2009.03.095. [DOI] [PubMed] [Google Scholar]
- 21.Mulrooney DA, Yeazel MW, Kawashima T, Mertens AC, Mitby P, Stovall M, et al. Cardiac outcomes in a cohort of adult survivors of childhood and adolescent cancer: retrospective analysis of the Childhood Cancer Survivor Study cohort. BMJ. 2009;339:b4606. doi: 10.1136/bmj.b4606. [DOI] [PMC free article] [PubMed] [Google Scholar]
- 22.Van Dalen EC, van der Pal HJ, Kok WE, Caron HN, Kremer LC. Clinical heart failure in a cohort of children treated with anthracyclines: A long-term follow-up study. European Journal of Cancer. 2006;42:3191–8. doi: 10.1016/j.ejca.2006.08.005. [DOI] [PubMed] [Google Scholar]
- 23.van der Pal HJ, van Dalen EC, van Delden E, van Dijk IW, Kok WE, Geskus RB, et al. High risk of symptomatic cardiac events in childhood cancer survivors. J Clin Oncol. 2012;30(13):1429–37. doi: 10.1200/JCO.2010.33.4730. [DOI] [PubMed] [Google Scholar]
- 24.Pein F, Sakiroglu O, Dahan M, Lebidois J, Merlet P, Shamsaldin A, et al. Cardiac abnormalities 15 years and more after Adriamycin therapy in 229 childhood survivors of a solid tumour at the Institut Gustave Roussy. Br J Cancer. 2004;91(1):37–44. doi: 10.1038/sj.bjc.6601904. [DOI] [PMC free article] [PubMed] [Google Scholar]
- 25.Guldner L, Haddy N, Pein F, Diallo I, Shamsaldin A, Dahan M, et al. Radiation dose and long term risk of cardiac pathology following radiotherapy and anthracycline for a childhood cancer. Radiother Oncol. 2006;81(1):47–56. doi: 10.1016/j.radonc.2006.08.020. [DOI] [PubMed] [Google Scholar]
- 26.Lipshultz SE, Lipsitz SR, Mone SM, Goorin AM, Sallan SE, Sanders SP, et al. Female sex and drug dose as risk factors for late cardiotoxic effects of doxorubicin therapy for childhood cancer. N Engl J Med. 1995;332(26):1738–43. doi: 10.1056/NEJM199506293322602. [DOI] [PubMed] [Google Scholar]
- 27.Blanco E, Beyene J, Maloney AM, Almeida R, Ethier MC, Winick N, et al. Non-relapse mortality in pediatric acute lymphoblastic leukemia: a systematic review and meta-analysis. Leuk Lymphoma. 2012;53(5):878–85. doi: 10.3109/10428194.2011.639018. [DOI] [PubMed] [Google Scholar]
- 28.Armstrong GT, Oeffinger KC, Chen Y, Kawashima T, Yasui Y, et al. Modifiable risk factors and major cardiac events among adult survivors of childhood cancer. J Clin Oncol. 2013;31(29):3673–80. doi: 10.1200/JCO.2013.49.3205. [DOI] [PMC free article] [PubMed] [Google Scholar]
- 29.Center for Disease Control and Prevention. National Hospital Discharge Survey. 2001 Accessed at www.cdc.gov/nchs/nhds/nhds_publications.htm on 15 April 2011.
- 30.Armstrong GT, Liu Q, Yasui Y, Neglia JP, Leisenring W, Robison LL, et al. Late mortality among 5-year survivors of childhood cancer: a summary from the Childhood Cancer Survivor Study. J Clin Oncol. 2009;27(14):2328–38. doi: 10.1200/JCO.2008.21.1425. [DOI] [PMC free article] [PubMed] [Google Scholar]
- 31.Towbin JA, Lowe AM, Colan SD, Sleeper LA, Orav EJ, Clunie S, et al. Incidence, causes, and outcomes of dilated cardiomyopathy in children. JAMA. 2006;296(15):1867–76. doi: 10.1001/jama.296.15.1867. [DOI] [PubMed] [Google Scholar]
- 32.Felker GM, Thompson RE, Hare JM, Hruban RH, Clemetson DE, Howard DL, et al. Underlying causes and long-term survival in patients with initially unexplained cardiomyopathy. N Engl J Med. 2000;342(15):1077–84. doi: 10.1056/NEJM200004133421502. [DOI] [PubMed] [Google Scholar]
- 33.Armenian SH, Sun CL, Shannon T, Mills G, Francisco L, Venkataraman K, et al. Incidence and predictors of congestive heart failure after autologous hematopoietic cell transplantation. Blood. 2011;118(23):6023–9. doi: 10.1182/blood-2011-06-358226. [DOI] [PMC free article] [PubMed] [Google Scholar]
- 34.Kirsch J, McGuire A. Establishing health state valuations for disease specific states: an example from heart disease. Health Econ. 2000;9(2):149–58. doi: 10.1002/(sici)1099-1050(200003)9:2<149::aid-hec501>3.0.co;2-n. [DOI] [PubMed] [Google Scholar]
- 35.Silber JH, Cnaan A, Clark BJ, Paridon SM, Chin AJ, Rychik J, et al. Enalapril to prevent cardiac function decline in long-term survivors of pediatric cancer exposed to anthracyclines. J Clin Oncol. 2004;22(5):820–8. doi: 10.1200/JCO.2004.06.022. [DOI] [PubMed] [Google Scholar]
- 36.Roberts RA, Abrams H, Sembach MK, Lister JJ, Gans RE, Chisolm TH. Utility measures of health-related quality of life in patients treated for benign paroxysmal positional vertigo. Ear Hear. 2009;30(3):369–76. doi: 10.1097/AUD.0b013e31819f316a. [DOI] [PubMed] [Google Scholar]
- 37.The SOLVD Investigators. Effect of enalapril on mortality and the development of heart failure in asymptomatic patients weith reduced left ventricular ejection fractions. N Engl J Med. 1992;327:685–91. doi: 10.1056/NEJM199209033271003. [DOI] [PubMed] [Google Scholar]
- 38.Center for Medicare & Medicaid Services. Baltimore, MD: Accessed at www.cms.gov on 10 Sept 2011. [Google Scholar]
- 39.Blue Book Average Wholesale Price. First DataBank. 2010 Accesed at www.fdbhealth.com/policies/drug-pricing-policy/ on 4 May 2011.
- 40.U.S. Census Bureau. Washington, DC: 2011. Statistical Abstract of the United States. Accessed at www.census.gov/compendia/statab/ on 10 Sept 2011. [Google Scholar]
- 41.Healthcare Cost and Utilization Project (HCUP) Overview of the Nationwide Inpatient Sample. Rockville, MD: Agency for Healthcare Research and Quality; 2008. [Google Scholar]
- 42.United States Department of Labor Bureau of Labor Statistics. National Compensation Survey. 2010 Accessed at www.bls.gov/eci on 1 April 2011.
- 43.Cantor SB. Cost-effectiveness analysis, extended dominance, and ethics: a quantitative assessment. Med Decis Making. 1994;14(3):259–65. doi: 10.1177/0272989X9401400308. [DOI] [PubMed] [Google Scholar]
- 44.Ubel PA, Hirth RA, Chernew ME, Fendrick AM. What is the price of life and why doesn’t it increase at the rate of inflation? Arch Intern Med. 2003;163(14):1637–41. doi: 10.1001/archinte.163.14.1637. [DOI] [PubMed] [Google Scholar]
- 45.Stinnett AA, Mittleman MA, Weinstein MC, Kuntz KM, Cohen JA, Williams LW, et al. Appendix C: The Cost-Effectiveness of Dietary and Pharmacologic Therapy for Cholesterol Reduction in Adults. In: Gold MR, S J, Russell LB, Weinstein MC, editors. Cost-Effectiveness in Health and Medicine. Oxford: Oxford University Press; 1996. pp. 349–91. [Google Scholar]
- 46.Gaziano TA, Steyn K, Cohen DJ, Weinstein MC, Opie LH. Cost-effectiveness analysis of hypertension guidelines in South Africa: absolute risk versus blood pressure level. Circulation. 2005;112(23):3569–76. doi: 10.1161/CIRCULATIONAHA.105.535922. [DOI] [PubMed] [Google Scholar]
- 47.Armstrong GT, Liu Q, Yasui Y, Huang S, Ness KK, Leisenring W, et al. Long-term outcomes among adult survivors of childhood central nervous system malignancies in the Childhood Cancer Survivor Study. J Natl Cancer Inst. 2009;101(13):946–58. doi: 10.1093/jnci/djp148. [DOI] [PMC free article] [PubMed] [Google Scholar]
- 48.Armstrong GT, Pan Z, Ness KK, Srivastava D, Robison LL. Temporal trends in cause-specific late mortality among 5-year survivors of childhood cancer. J Clin Oncol. 2010;28(7):1224–31. doi: 10.1200/JCO.2009.24.4608. [DOI] [PMC free article] [PubMed] [Google Scholar]
- 49.Exner DV, Dries DL, Waclawis MA, Shelton B, Domanski MJ. Beta-adrenergic blocking agent use and mortality in patients with asymptomatic and symptomatic left ventricular systolic dysfunction: a post hoc analysis of the Studies of Left Ventricular Dysfunction. J am Coll Cardiol. 1999;33(4):916–23. doi: 10.1016/s0735-1097(98)00675-5. [DOI] [PubMed] [Google Scholar]
- 50.Kremer LCM, van der Pal HJH, Offringa M, van Dalen EC, Voute PA. Frequency and risk factors of subclinical cardiotoxicity after anthacycline therapy in children: a systematic review. Ann Oncol. 2002;13(4):819–29. doi: 10.1093/annonc/mdf167. [DOI] [PubMed] [Google Scholar]
- 51.Kremer LCM, van Dalen EC, Offringa M, Voute PA. Frequency and risk factors of anthracycline-induced clinical heart failure in children: a systematic review. Ann Oncol. 2002;13(4):503–12. doi: 10.1093/annonc/mdf118. [DOI] [PubMed] [Google Scholar]
- 52.Paulides M, Kremers A, Stohr W, Bielack S, Jurgens H, Treuner J, et al. Prospective longitudinal evaluation of doxorubicin-induced cardiomyopathy in sarcoma patients: a report of the late effects surveillance system (LESS) Pediatr Blood Cancer. 2006;46(4):489–95. doi: 10.1002/pbc.20492. [DOI] [PubMed] [Google Scholar]
- 53.Lotrionte M, Biondi-Zoccai G, Abbate A, Lanzetta G, D’Ascenzo F, Malavasi V, et al. Review and meta-analysis of incidence and clinical predictors of anthracycline cardiotoxicty. Am J Cardiol. 2013;112(12):1980–4. doi: 10.1016/j.amjcard.2013.08.026. [DOI] [PubMed] [Google Scholar]
- 54.Gooley TA, Leisenring W, Crowley J, Storer BE. Estimation of failure probabilities in the presence of competing risks: new representations of old estimators. Stat Med. 1999;18(6):695–706. doi: 10.1002/(sici)1097-0258(19990330)18:6<695::aid-sim60>3.0.co;2-o. [DOI] [PubMed] [Google Scholar]
- 55.Preston DL, Lubin JH, McConney M. EPICURE User’s Guide. Seattle, WA: Hirosoft International Corporation; 1993. [Google Scholar]
- 56.Remme WJ, Riegger G, Hildebrandt P, Komajda M, Jaarsma W, Bobbio M, et al. The benefits of early combination treatment of carvedilol and an ACE-inhibitor in mild heart failure and left ventricular systoloic dysfunction. The carvedilol and ACE-inhibitor remodeling mild heart failure evaluation trial (CARMEN) Cardiovasc Drugs Ther. 2004;18(1):57–66. doi: 10.1023/B:CARD.0000025756.32499.6f. [DOI] [PubMed] [Google Scholar]
- 57.Cohen E. Would your doctor pay for wasted time? [10 March 2011];CNN health. 2011 http://www.cnn.com/2011/HEALTH/06/30/time.worth.money.cohen/index.html.
- 58.Center for Disease Control and Prevention. National Ambulatory Medical Care Survey. 2010 Accessed at www.cdd.gov/nchs/ahcd.htm on 15 April 2011.
Associated Data
This section collects any data citations, data availability statements, or supplementary materials included in this article.