Abstract
Introduction:
Data query (DQ) rate per case record form (CRF) page is an index of quality of clinical trial data, which can be affected by the phase of clinical trial, the therapeutic area, and the country, where investigator site is located.
Objective:
To compare DQ rate per page by countries, phases, and therapeutic areas.
Materials and Methods:
Data from 19 paper CRF clinical trials conducted at 352 sites, in 5,610 patients were entered into clinical data management system by double data entry method, and DQs were generated. The DQ rate per page was compared for the phase, therapeutic area, and the country, by parametric analysis of variance (ANOVA) and nonparametric test-Kruskal-Wallis and median test. Multiple comparisons test was conducted for each category using Tukey's Studentized Range Test.
Results:
The total number of DQs from 108,599 CRF pages was 33,177 (0.306/CRF page). The studies included 12 countries, all phases, and seven therapeutic areas. Comparison of DQ rate per page showed a significant difference between phases, countries, and therapeutic areas. However, multiple comparisons showed that the DQ rate per page was significantly different between Phase I and other phases, and oncology, cardiology, endocrinology, and dermatology. The DQ categories were: Missing 21.8%, confirmatory 50.1%, and clarification 28.2%. The most common DQs by CRF field were: Lab data (23.2%), physical examination (17.4%), study assessment (17.4), and concomitant medication (12%). There was no correlation between the number of CRF pages and DQ rate per page per study.
Conclusion:
The phase of study and therapeutic area could impact the data quality as measured by DQ rates.
Keywords: Case record form, country, data query, data query rate per page, phase, therapeutic area, quality
INTRODUCTION
Since last several years, the clinical trial industry has become global with inclusion of new emerging countries such as India. One of the major reasons for inclusion of emerging countries is potential for fast recruitment. During the same period, the protocols have become more complex, with an increase in number of selection criteria, number of protocol procedures, and number of case record form (CRF) pages.[1] These changes have resulted in increasing the burden of work at investigator sites, which in turn increased the risk of adversely affecting the quality and performance of the team at the investigator site. As most sites in emerging countries are new in the field of clinical trials, there is a concern about quality of data collected from these new regions. Data query (DQ) rate per CRF page is one index of quality, used to assess quality of clinical trial data from some of the western countries and Russia.[2]
A recent analysis of data queries from 26 large phase II/III trials comparing DQ rate per page from North America or western Europe and other emerging regions failed to detect any statistically significant differences.[3] However, in an analysis of 8,317 protocols, Getz et al., found wide differences in protocol complexity and work burden across phases and therapeutic areas.[4] Hence, it would be important to consider the impact of therapeutic area whilst analyzing DQ rates. We report here comparison of DQs by countries, phases, and therapeutic areas.
MATERIALS AND METHODS
Data generated from 19 clinical trials, conducted by 352 sites in 5,610 patients, using paper CRF were included for analysis of DQs.
A cumulative total of 108,599 CRF pages were entered into Oracle Clinical Data Management System using double data entry method. The CRF pages were then validated using edit checks, logic checks, and 100% manual review to generate per page DQs. Multiple DQ for each page were counted as two separate DQs.
DQ rate per page was calculated by dividing total number of DQs raised by total number of CRF pages entered.
Statistical analysis was carried out to:
Compare statistically, the DQ per page among countries, phases of clinical trial, and therapeutic areas using parametric analysis of variance (ANOVA), nonparametric Kruskal-Wallis and median test. If the distribution of DQ rate per page was significant, multiple comparisons were performed for each category–country, phase, and therapeutic area by Tukey's Studentized Range Test
Assess correlation between number of CRF pages/study and average number of DQs per CRF page/study
-
Distribution of category of various types of DQs: Missing data, confirmatory queries, and clarification
- Missing data queries are queries raised when data is not provided
- Confirmation queries are queries raised to confirm the data not recorded/provided as per CRF entry criteria
- Clarification queries are queries raised to get more clarification on the data provided/recorded on CRF pages but lacks clarity.
-
Distribution of DQs per CRF page by data fields on CRF page such as:
- Laboratory data
- Physical examination
- Study assessment
- Concomitant medication
- Administrative
- Adverse event
- Medical history
- Investigational product
- Administrative, and
- Electrocardiogram.
RESULTS
The total number of DQs from 108,599 CRF pages was 33,177 giving a DQ rate per page of 0.306/CRF page. The studies were from 12 countries, covering 352 sites, all phases, and seven therapeutic areas.
The phase wise distribution of number of subjects, CRF pages and DQ per CRF page is presented in Table 1.
Table 1.
Distribution of DQ rate per page by phase of study
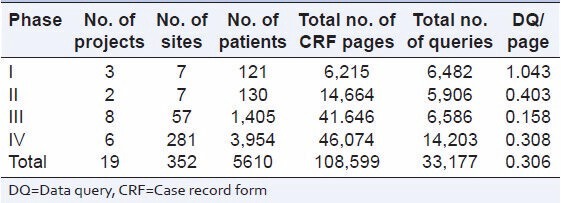
The DQ rate per page for Phase IV was lowest (0.308) and was highest for Phase I (1.043) [Table 1].
Table 2 describes country-wise distribution of number of subjects, CRF pages, and DQ per CRF page.
Table 2.
Distribution of DQ rate per page by country
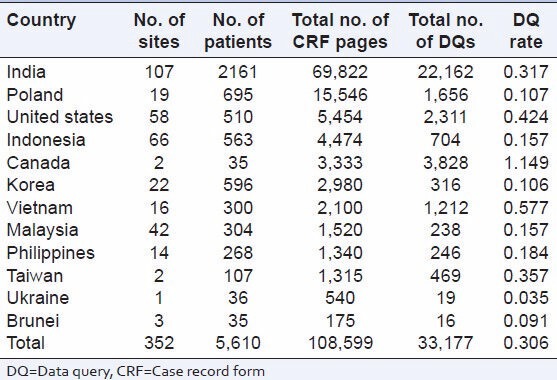
The DQ rate per page across countries ranged from 0.035 for Ukraine to 1.149 for Canada [Table 2].
Table 3 describes therapeutic area wise distribution of number of subjects, CRF pages and DQ per CRF page.
Table 3.
Distribution of DQ rate per page therapeutic area
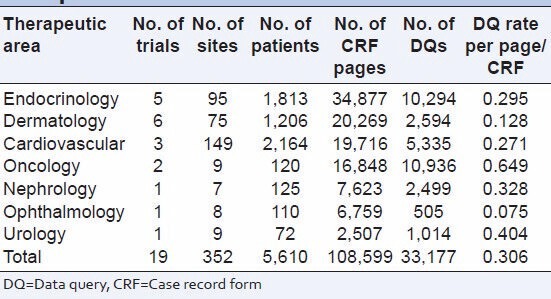
DQ rate per page was lowest for ophthalmology (0.075) and highest for oncology 0.649 [Table 3].
Comparison of DQ rate per page from all phases showed a significant difference between countries and therapeutic areas [Table 4].
Table 4.
Statistical comparison of DQ rate per page

The DQ rate per page showed a significant difference between phases, countries, and therapeutic areas. The multiple comparison tests showed:
Phases
DQ rate per page from phase I studies were significantly different from Phase II, Phase III, and Phase IV
DQ rate per page from Phase II, Phase III, and Phase IV was not significantly different from each other.
Countries
There were no significant differences between countries.
Therapeutic areas
-
DQ rate per page from oncology studies were significantly different from cardiology, endocrinology, and dermatology. All other comparisons did not show any significant differences.
Number of CRF pages ranged from two pages for a Phase IV study to 155 pages for a Phase I study [Table 5].
There was no correlation between the number of CRF pages and DQ rate per page.
The distribution of DQ categories was: Missing 21.8%, confirmatory 50.1%, and clarification 28.2%.
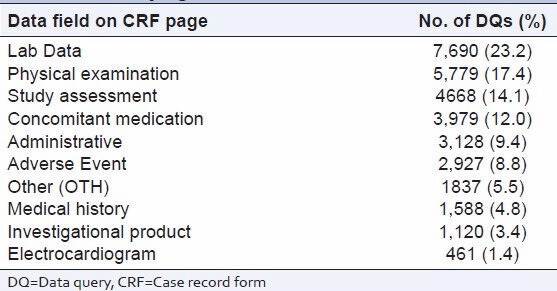
The most common DQs [Table 6] by CRF field were: Lab data (23.2%), physical examination (17.4%), study assessment (17.4), and concomitant medication (12.0%).
Table 5.
Distribution of CRF pages and DQ rate per page
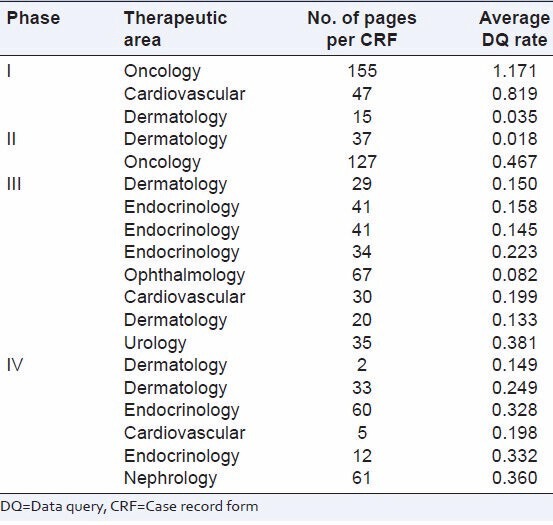
Table 6.
Distribution of number of DQs by data field on CRF pages
DISCUSSION
Our study showed that the average DQ rate per page was 0.306/CRF page or 1 DQ in 3 CRF pages. DQ rate per page was highest for Phase I or oncology study. Getz has reported that Phase I protocols were the most complex and the most burdensome.[4] The study also reported that anti-infectives, immunomodulation, CNS, and oncology studies are consistently the most complex and burdensome to execute.[4]
Getz et al., study has revealed that protocol complexity and work for all phases in diverse therapeutic areas have grown between 2000 and 2007. Hence, comparison of DQ rate per page for countries needs to consider the effect of phase or therapeutic area in the analysis.
We found a significant difference in DQ rate per page by parametric test ANOVA or non-parametric tests for all phases, all countries, and therapeutic areas.
Our results for the difference DQ rate per page between the countries are in contrast to the study of Desai et al.,[3] who reported that there were no statistically significant differences in the query rates, when developing country regions were compared to North America or Western Europe. However, our study differs from this study in several aspects. Desai et al., compared combined DQ rate per page for Phase II and III studies, whilst our study has compared DQs of all phases separately. Desai's study combined studies of several companies, covering all 10 regions of the globe, whilst we could include eastern Europe, US, India, and Asia Pacific. Also, Desai's study did not consider the effect of therapeutic area on the DQ rate, but only analyzed the data quality of developing countries.
When the multiple comparisons were done for each group, DQ rate per page was significantly different between Phase I and other Phases, but not significantly different between Phase II or III or IV. Amongst therapeutic areas, the DQ rate per page was significantly different between oncology and cardiology, endocrinology and deramatology. However, amongst the countries, there was no significant difference in DQ rate per page, when multiple comparison test was applied. Hence, it appears that the phase of the study or therapeutic area could explain the differences in DQ rate per page between the countries.
The length of CRF could be another factor which could impact DQ rate. However, we did not find any correlation between length of CRF and the DQ rate.
Confirmatory DQs featured as the most common category type highlighting the need for thorough training in protocol and CRF completion for sites. Over 20% DQs were due to missing data, suggesting the need for greater and vigilant monitoring by clinical research associate prior to data retrieval.
Physical examination and lab data pages generated the highest number of DQs again highlighting the need for precise CRF completion guidelines and ongoing site training.
Our study included paper CRFs. It is possible that use of electronic CRF could have reduced the DQ rates. However, Desai's study reported the query rate per page was higher for clinical trials using electronic CRFs.[3] Hence, it appears that technology alone would not be able reduce the number of DQs.
There were some limitations of our study. The study did not cover countries from western Europe, Latin America, Africa, and China. The number of sites was not similar from all countries for all phases. There was preponderance of Phase III and IV studies and only seven therapeutic areas covered.
In conclusion, the phase of study, and the therapeutic area could impact the data quality as measured by DQ rate per page.
Footnotes
Source of Support: Nil.
Conflict of Interest: None declared.
REFERENCES
- 1.Platonov PG, Varshavsky S, Escandon S. An evaluation of query generation rate per page as an indicator of major factors influencing data quality. Appl Clin Trials. 2003;12:32–4. [Google Scholar]
- 2.Getz K. Protocol design trends and their effect on clinical trial performance. Raj Pharma. 2008:315–6. [Google Scholar]
- 3.Desai PB, Anderson C, Sietsema WK. A Comparison of the quality of data, assessed using query rates, from clinical trials conducted across developed versus emerging global regions. Drug Inf J. 2012;46:455–63. [Google Scholar]
- 4.Getz KA, Campo RA, Kaitin KI. Variability in protocol design complexity by phase and therapeutic area. Drug Inf J. 2011;45:413–20. [Google Scholar]


