Abstract
Reactive nitrogen species (RNS) and oxygen species (ROS) have been reported to modulate the function of nitric oxide synthase (NOS); however, the precise dosedependent effects of specific RNS and ROS on NOS function are unknown. Questions remain unanswered regarding whether pathophysiological levels of RNS and ROS alter NOS function, and if this alteration is reversible. We measured the effects of peroxynitrite (ONOO-), superoxide (O2.-), hydroxyl radical (.OH), and H2O2 on nNOS activity. The results showed that NO production was inhibited in a dose-dependent manner by all four oxidants, but only O2.- and ONOO- were inhibitory at pathophysiological concentrations (≤ 50 μM). Subsequent addition of tetrahydrobiopterin (BH4) fully restored activity after O2.- exposure, while BH4 partially rescued the activity decrease induced by the other three oxidants. Furthermore, treatment with either ONOO- or O2.- stimulated nNOS uncoupling with decreased NO and enhanced O2.- generation. Thus, nNOS is reversibly uncoupled by O2.- (≤ 50 μM), but irreversibly uncoupled and inactivated by ONOO-. Additionally, we observed that the mechanism by which oxidative stress alters nNOS activity involves not only BH4 oxidation, but also nNOS monomerization as well as possible degradation of the heme.
Keywords: neuronal nitric oxide synthase, nitric oxide, superoxide, peroxynitrite, hydroxyl, hydrogen peroxide, dose-dependent, uncoupling, tetrahydrobiopterin, monomerization
Introduction
Nitric oxide (NO) is a critical mediator of a number of biological processes including vasodilation, neurotransmission and host-defense [1-3]. Its roles in the cardiovascular system include regulation of vasomotor tone, cell adhesion to the endothelium, inhibition of platelet aggregation, and vascular smooth muscle cell proliferation [4-7]. NO is synthesized in cells by a class of L-arginine dependent nitric oxide synthases (NOS) that catalyze the transformation of L–arginine to L–citrulline with the formation of NO [8-10]. There are three major isoforms of NOS. Neuronal (nNOS) and endothelial (eNOS) isoforms are constitutively expressed and require micromolar concentrations of free Ca2+ for activitation, via a calmodulin dependent mechanism, whereas the inducible isozyme (iNOS) is cytokine-inducible and largely Ca2+ independent.
The NOS enzymes are dimeric in their active form and are associated with two molecules of calmodulin (CaM). They contain relatively tightly-bound cofactors such as BH4, FAD, FMN and iron protoporphyrin IX (heme) [11]. The catalytic domains of NOS include a flavin containing NADPH-binding reductase, and a heme-binding oxygenase that also contains the binding sites for BH4 and L-arginine. These two domains are separated by a CaM binding sequence and in the presence of calcium/calmodulin, and the substrate NADPH, electrons flow from the reductase domain to the oxygenase domain resulting in the activation of oxygen at the heme center, followed by monooxygenation of substrate. The production of NO from L-arginine by NOS occurs via two sequential monooxygenation events, consuming 1.5 equivalents of NADPH for every NO produced [12]. Our laboratory and several others have demonstrated that besides synthesizing NO, all three isoforms of NOS can also generate O2.-, depending on substrate and cofactor availability [13-18]. With low levels or total absence of L– arginine, purified nNOS catalyzes the reduction of oxygen, with O2.- production [13,14]. In L-arginine-depleted cells, nNOS generates both O2.- and NO leading to peroxynitrite-mediated cell injury [15].
Besides the availability of enzyme substrates or cofactors [19-21], several additional mechanisms also can modulate NO synthesis by NOS. These include protein-protein interactions [22-26], protein phosphorylation [27-29], endogenous inhibitory N-methylated L-arginines [30,31], subcellular localization [32], subunit dimerization [33], as well as product feedback inhibition, by which excess NO down-regulates the amount of subsequent NO synthesis. NOS activity can also be altered by oxidative stress.
Oxidative stress often occurs at low levels under normal physiological conditions and is greatly enhanced in a variety of disease processes associated with inflammation or ischemia and reperfusion. There are several biologically important reactive oxygen species (ROS), including O2.-, .OH and H2O2. O2.- combines with NO to produce ONOO-, a cytotoxic oxidant. ONOO- and ROS are chemically unstable and highly reactive, and may induce oxidative damage to DNA, lipids, and proteins. While it has been hypothesized that cellular oxidants interact with NOS and alter its activity, questions remain regarding the precise dose-dependent effects of these oxidants on the activity of the enzyme and the mechanisms involved in this process.
To characterize the specific dose dependent effects of specific reactive oxygen or nitrogen species on the enzymatic function of nNOS, purified enzyme was pre-exposed to known amounts of O2.-, .OH, H2O2 and ONOO-, and the NO generation rate was quantified spectroscopically by measuring the rapid oxidation of oxyhemoglobin to methemoglobin. The NO and O2.- generation was also measured using electron paramagnetic resonance spin trapping. The mechanism by which oxidative stress alters nNOS enzyme function was also explored.
Materials and methods
Materials
Human embryonic kidney (HEK) 293 cells stably transfected with rat nNOS were provided by Dr. Valina Dawson, Department of Neuroscience, The John Hopkins University, School of Medicine. Cell culture materials were obtained from GIBCO (Invitrogen, Carlsbad, CA). Peroxynitrite was purchased from Upstate Cell Signaling Solutions (Lake Placid, NY). BH4 was obtained from Cayman Chemical Company (Ann Arbor, MI). Calmodulin and catalase were purchased from Sigma-Aldrich (St. Louis, MO). 2′ 5′ ADP Sepharose™ 4B, calmodulin Sepharose™ 4B and Superdex 200 10/300 GL Tricorn™ high performance chromatography columns and gel filtration calibration kits were purchased from Amersham Pharmacia Biosciences (Pittsburgh, PA). 5-(Diisopropoxyphosphoryl)-5-methyl-1-pyrroline-N-oxide (DIPPMPO) was from Alexis Biochemicals, Inc. (San Diego, CA). N-methyl-D-glucamine dithiocarbomate (MGD) was synthesized in our laboratory. Xanthine oxidase (XO) and complete EDTA-free protease inhibitor cocktail tablets were purchased from Roche Applied Sciences (Indianapolis, IN). All other chemicals were obtained from Sigma-Aldrich unless noted otherwise.
nNOS enzyme purification
The nNOS-transfected HEK 293 cells were cultured in DMEM supplemented with 10% heat-inactivated fetal bovine serum and antibiotics penicillin G (100 unit/ml) and streptomycin (100 μg/ml) with L-glutamine (292 μg/ml) at 37°C in a 5% CO2, 95% air-humidified incubator. NOS expressing cells were selected for by including Geneticin® (500 μg/ml) in the growth medium. To scale up the number of cells cultured, nNOS-HEK293 cells were grown in suspension in two 1000 ml-spinner bottles for 4 days. Cells were then harvested by centrifugation and homogenized in buffer that contained 50 mM Tris-HCl, pH 7.4, 2 mM EDTA, 2 mM EGTA, 1 mM dithiothreitol (DTT) and protease inhibitors. The cell lysate was centrifugated at 16,000 g for 10 min at 4°C and the supernatant loaded onto a 2′, 5′-ADP-Sepharose 4B column. After extensive washing with 50 mM Tris-HCl, pH 7.4 with 450 mM NaCl, the bound protein was eluted with 10 mM NADPH in 50 mM Tris-HCl, pH 7.4. The eluate was then applied to a calmodulin Sepharose 4B column and equilibrated in 50 mM Tris-HCl, 150 mM NaCl, and 2 mM CaCl2, pH 7.4. nNOS was eluted with 5 mM EGTA in 50 mM Tris-HCl, 150 mM NaCl, pH 7.4. The peak nNOS containing fractions were concentrated using an Amicon Ultra 100,000 MW cut off concentrator. The nNOS enzyme was stored in liquid nitrogen in 50 mM Tris-HCl pH 7.4 with 10% glycerol. The nNOS concentration was determined using the Bradford assay (Bio-Rad) with bovine serum albumin as the standard. The purity of nNOS was verified by SDS-PAGE followed by Coomassie Blue staining. The typical activity of nNOS was between 150 and 200 nmol mg-1 min-1 with a purity > 85% as determined by SDS-PAGE.
Peroxynitrite and ROS treatment of nNOS
Purified nNOS at 0.5 μg/μl (∼ 1.56 μM dimer) was preincubated with BH4 25 μM and NADPH 25 μM on ice for 30 min to allow BH4 and NADPH to bind to nNOS. The BH4 and NADPH saturated nNOS was exposed to given amounts of each of four oxidants: ONOO-, O2.-, OH and H2O2. For ONOO-, exposure of nNOS to 0.2 μM to 2000 μM concentrations of ONOO- was performed on ice for 10 min. ONOO- concentration was determined by absorbance at 302 nm (ε302 = 1.67 mM-1cm-1). The ONOO- stock, in 0.3 M NaOH, ∼ 150 mM, was diluted in 10 mM NaOH to various concentrations just before addition to the nNOS solution in 50 mM Tris-HCl pH 7.4. The volume of ONOO- added was limited to 1/10 of the total incubation volume. Since the half-life of peroxynitrite in neutral solution is less than 2 sec, there was no need for a quenching step for the ONOO- treatment. For O2.- exposure, the generating system consisted of 0.1 unit/ml XO, with xanthine in a concentration range from 0.2 μM to 2000 μM, and 200 unit/ml catalase to remove any H2O2 formed. O2.- produced from xanthine-XO was quantitated using the cytochrome c reduction assay and the concentration of O2.- generated corresponded to ∼ 50% of the xanthine concentration. BH4 and NADPH saturated nNOS samples were incubated for 20 min at room temperature with this xanthine-XO system and then SOD (1000 unit/ml) as well as additional catalase 200 unit/ml were added to quench any residual O2.- production from xanthine-XO and the preparation placed on ice. For OH exposure, OH was generated from H2O2 via the iron mediated Fenton reaction as reported previously [34]. Ferric iron chelate Fe3+ - nitrilotriacetate (Fe-NTA) (1:2) was prepared according to the literature [35]. The BH4 and NADPH saturated nNOS was incubated with 20 μM Fe-NTA and H2O2 (0.2 μM to 2000 μM H2O2) on ice for 20 min and any excess H2O2 was removed by the addition of 400 unit/ml catalase. For H2O2 exposure, the BH4 and NADPH saturated nNOS samples were incubated with given amounts of H2O2 in the presence of 400 μM diethylenetriaminepentaacetic acid (DTPA). After 20 min incubation on ice, catalase 400 unit/ml was added. For all exposures 5 min were allowed between completion of exposure and measurement of nNOS activity.
Oxyhemoglobin assay of NO generation rate
nNOS activity was measured from the initial rate of NO generation spectrophotometrically determined from the oxidation of oxyhemoglobin to methemoglobin. The NO generation rate was calculated from the change in the absorption at 401 nm minus 411 nm as a function of time (ε401-411 = 38 mM-1 cm-1) [36]. The assay mixture consisted of the control or oxidant exposed nNOS in 50 mM Tris-HCl, pH 7.4, as described above, with 200 μM CaCl2, 10 μg/ml CaM, 150 μM DTT, 200 μM NADPH and 10 μM oxyhemoglobin added. 100 μM L-arginine was added to start the reaction. To test the effect of BH4 repletion, matched experiments were performed with addition of 100 μM BH4. These assays were carried out on a plate-reader, SPECTRA Max Plus 384 from Molecular Devices, with 96-well plates at 37°C. The NO generation rate was determined using the data collected in the linear phase of the change in absorbance at 401 – 411 nm within the first two minutes.
EPR spin trapping of O2.- and NO
Spin trapping measurements of NO and O2.- generation form nNOS were performed using a Bruker EMX EPR spectrometer with HS cavity in a 50μl capillary tube. The NO assay mixture contained 40 μg/ml purified nNOS, 0.2 mM Fe-MGD (1:10) spin trap (ammonium iron (II) sulfate 0.2mM, MGD 2 mM) and nNOS substrates and co-factors (200 μM CaCl2, 10 μg/ml CaM, 1 mM NADPH, 2 mM 15N-L-arg) in 50 mM Tris-HCl, pH 7.4, The O2.- assay mixture consisted of 40 μg/ml nNOS, 500 unit/ml catalase, 400 μM DTPA, nNOS substrates and co-factors (as above) and 20 mM DIPPMPO spin trap. For the determination of the effects of ONOO- and O2.- nNOS was incubated with either 50 μM ONOO- on ice or with 100 μM Xanthine and XO 0.1 unit/ml at room temperature for 10 min. In the later case 500 μM oxypurinol was added to assure terminatation of any XO-mediated O2.- generation 1 min before starting the spin trap measurements. All EPR spectra were obtained in a 50 μl capillary tube at room temperature (23°C) using the following parameters: microwave power 20 mW, modulation frequency 100 kHz, microwave frequency 9.87 GHz, time constant of 163.84 mSec, and scan time 84 s. The modulation amplitude used for NO and O2.- detection was 4.0 G and 1.0 G, respectively. All EPR spectra shown are accumulation of 5 scans.
Gel filtration Chromatography for detection of nNOS dimer and monomer
The nNOS samples were subjected to gel filtration chromatography on Superdex 200 HR column controlled by an AKTA™design fast protein liquid chromatography (FPLC) system (Amersham Pharmacia Biotech). The column was equilibrated with 50 mM Tris-HCl, pH 7.4 with 150 mM NaCl at 4°C. The nNOS was eluted at a flow rate of 0.3 ml/min and monitored by UV/Visible absorbance at 280 nm, 254 nm and 400 nm. The calibration curve was obtained based on the elution profiles of protein standards (thyroglobulin, ferritin, catalase, aldolase, albumin, and ovalbumin). The void volume was determined with Dextran Blue 2000. The areas of the peaks of dimer and monomer were integrated using the chromatography software package, Unicorn 4.0 (Amersham).
Statistical Analysis
Results were expressed as mean ± SE. Statistical significance was determined using the Student's t - Test. A value of P < 0.05 was considered statistically significant.
Results
Effects of oxidative stress on NO generation rate by nNOS
The rate of NO generation from nNOS was significantly decreased following exposure to increasing levels of ONOO- (Fig. 1). The rate of NO production following exposure to 20 μM ONOO- decreased to 66% of basal levels and with 100 μM ONOO- decreased to 42% of basal activity with progressively increasing inhibition at higher concentrations. With all ONOO- concentrations studied, subsequent addition of BH4 only very modestly restored enzyme function with a maximum BH4-dependent restoration of +14 % in NO generation seen following 500 μM ONOO- exposure. With the highest concentration studied, 2000 μM ONOO-, addition of BH4 did not restore any nNOS activity.
Fig. 1. Dose-dependent effect of ONOO- on NO generation rate from nNOS.
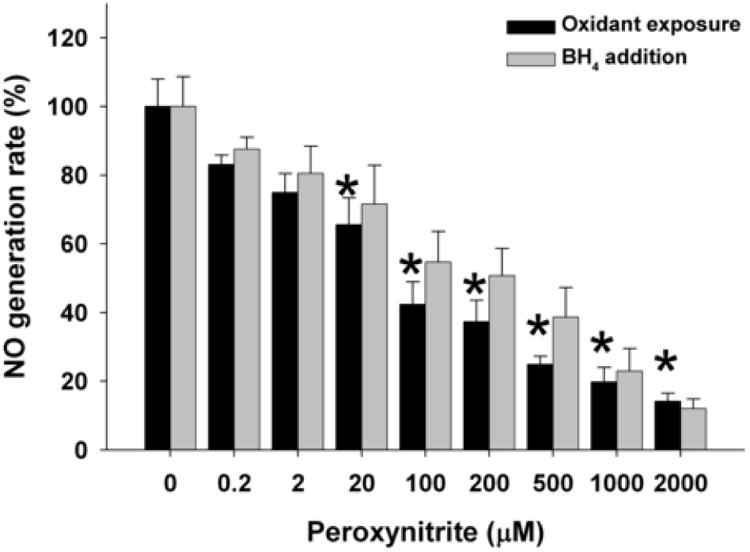
BH4 and NADPH saturated nNOS was incubated with ONOO- (0-2000 μM) for 10 min on ice. NO generation rate was then measured using the oxyhemoglobin assay in 50 mM Tris-HCl, pH 7.4 at 37°C, containing 200 μM NADPH, 200 μM CaCl2, 150 μM DTT, 10 μg/ml CaM, 10 μM oxyhemoglobin, 100 μM L-Arginine, with or without subsequent addition of 100 μM BH4. The NO generation rates were calculated from the initial rates and are given as percentage of the activity of the 0 μM ONOO--treated nNOS. Data are presented as mean ± S.E. of triplicate experiments. * Indicates a significant (P < 0.05) difference from the corresponding untreated control value.
Similar to ONOO-, O2.- dose dependently decreased the NO generation rate by nNOS (Fig. 2). With exposure to 20 μM xanthine, corresponding to 10 μM total measured O2.- generation, NO production decreased to 81% of baseline and with 100 μM Xanthine (50 μM O2.- generation) to 44%. However, BH4 addition was able to almost completely rescue the loss of nNOS activity induced by these low levels of O2.- exposure. Even with 100 μM xanthine, subsequent addition of BH4 restored the activity to almost 95% of basal levels. At higher xanthine concentrations, only partial nNOS activity was recovered with BH4 addition. Thus BH4 addition was highly effective in reversing the O2.--induced loss of nNOS activity at low to moderate levels of O2.-generation, while higher levels as seen with 1000 or 2000 μM xanthine no significant restoration of NO generation was seen.
Fig. 2. Dose-dependent effect of O2.- on NO generation rate from nNOS.
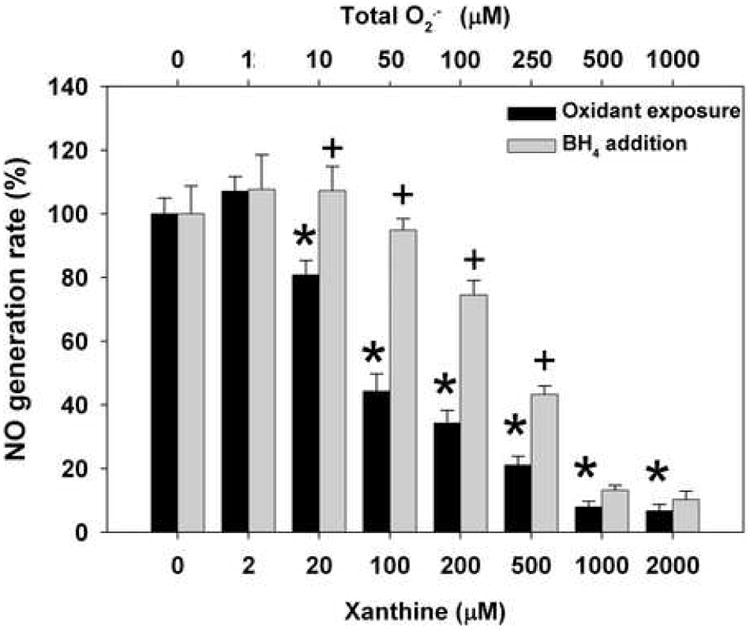
BH4 and NADPH saturated nNOS was incubated with O2.- generation system, xanthine (0-2000 μM) – XO (0.1unit/ml) – catalase (200 unit/ml), for 20 min at room temperature. SOD (1000 unit/ml) and additional catalase (200 unit/ml) was then added and incubated for 5 min to terminate the reaction and remove any residual O2.- from xanthine-XO. NO generation rate was measured with oxyhemoglobin assay in 50 mM Tris-HCl, pH 7.4 at 37°C. The assay mixture included 200 μM NADPH, 200 μM CaCl2, 150 μM DTT, 10 μg/ml CaM, 10 μM oxyhemoglobin, 100 μM L-Arginine, with or without subsequent addition 100 μM BH4. The NO generation rates were calculated from the initial rates and are given as percentage of the activity of the 0 μM xanthine-treated nNOS. Data are presented as mean ± S.E. of triplicate experiments. * Indicates a significant (P < 0.05) difference from the corresponding untreated control value; + Indicates significant activity is restored by subsequent addition of BH4 (P < 0.05).
Exposure to OH generated from the H2O2/Fe-NTA generating system resulted in loss of NO production only at high levels of H2O2, with 65% of basal activity remaining at 500 μM H2O2 and 52% activity with 1000 μM H2O2 (Fig. 3). However, unlike O2.-, there was no significant BH4-induced rescue of enzyme activity lost during OH treatment. In stark contrast to the other three oxidants, H2O2 had very little effect on nNOS activity until very high concentrations were used (Fig. 4). H2O2 treatment had no significant effect on NO generation rate at concentrations less than 2000 μM (Fig. 4). With 2000 μM H2O2 exposure, 61 % activity was still present and addition of BH4 did not significantly restore this loss of nNOS activity.
Fig. 3. Dose-dependent effect of ·OH on NO generation rate from nNOS.
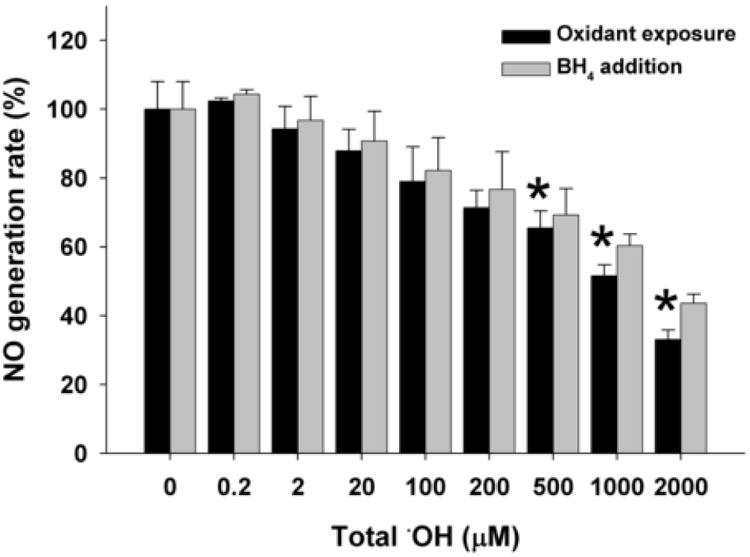
BH4 and NADPH saturated nNOS was incubated with 20 μM Fe-NTA and increasing concentrations of H2O2 (0-2000 μM) for 20 min on ice and 400 unit/ml catalase was added to remove the residual H2O2 before the assay. NO generation rate was measured using oxyhemoglobin assay containing 200 μM NADPH, 200 μM CaCl2, 150 μM DTT, 10 μg/ml CaM, 10 μM oxyhemoglobin, 100 μM L-Arginine, with or without subsequent addition of 100 μM BH4. The NO generation rates were calculated from the initial rates and are given as percentage of the activity of the 0 μM OH-treated nNOS. Data are presented as mean ± S.E. of triplicate experiments. * Indicates a significant (P < 0.05) difference from the corresponding control value.
Fig. 4. Dose-dependent effect of H2O2 on NO generation rate from nNOS.
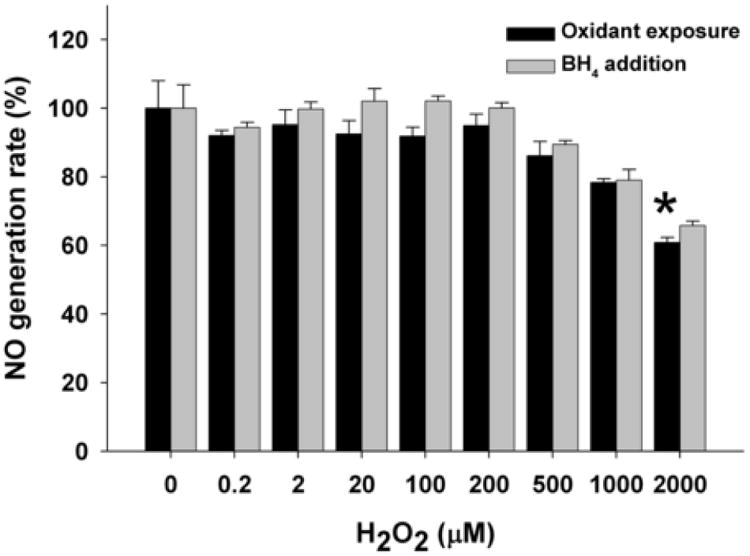
BH4 and NADPH saturated nNOS was incubated with 400 μM DTPA and increasing concentrations of H2O2 (0-2000 μM) for 20 min on ice and 400 unit/ml catalase was added to remove the residual H2O2 before the assay. NO generation rate was measured using oxyhemoglobin assay containing 200 μM NADPH, 200 μM CaCl2, 150 μM DTT, 10 μg/ml CaM, 10 μM oxyhemoglobin, 100 μM L-Arginine, with or without subsequent addition of 100 μM BH4. The NO generation rates were calculated from the initial rates and are given as percentage of the activity of the 0 μM H2O2-treated nNOS. Data are presented as mean ± S.E. of triplicate experiments. Data are presented as mean ± S.E. of triplicate experiments. * Indicates a significant (P < 0.05) difference from the corresponding untreated control.
Effects of oxidative stress in inducing nNOS uncoupling with O2.- generation
To determine and definitively demonstrate that oxidative stress induces nNOS uncoupling, leading to O2.- generation, EPR spin trapping measurements were performed. Purified nNOS (0.5 μg/μl, ∼3.12 μM) was incubated under anaerobic conditions in the presence of 4 μM BH4 and NADPH on ice for 30 min at to allow BH4 and NADPH binding to nNOS. This BH4 and NADPH saturated nNOS was then incubated either with 50 μM ONOO- on ice or with the O2.- generating system using 100 μM xanthine - 0.1 unit/ml XO at RT for 10 min. EPR measurements were carried out as described in the experimental section with the nitrone spin trap DIPPMPO, which forms a relatively stable O2.- adduct. The effects of ONOO- and O2.- exposure on subsequent O2.- generation, were then determined in the presence of 2 mM 15N-L-arg by adding nNOS co-factors (200 μM CaCl2, 20 μg/ml CaM, 1 mM NADPH). Control nNOS gave only a very weak EPR signal, in contrast, ONOO- and O2.- treated nNOS gave rise to a strong DIPPMPO-OOH signal characteristic of trapped O2.- (Fig.5 left panel).
Fig. 5. Effects of ONOO- and O2.- on NOS-derived O2.- and NO generation.
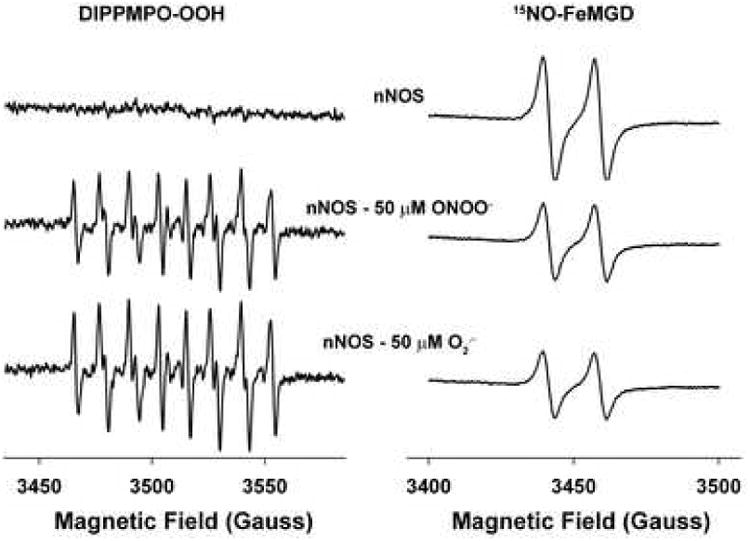
nNOS was exposed to 50 μM ONOO- or 50 μM O2.- (100 μM xanthine-0.1 uint/ml XO) on ice or at room temperature for 10 min. EPR spin trapping measurements of O2.- or NO production from nNOS were performed with spin trap 20 mM DIPPMPO or 0.2 mM Fe-MGD in the presence of 2 mM 15N-L-arginine with 200 μM CaCl2, 10 μg/ml CaM, 1 mM NADPH. EPR parameters were as described in methods. The left panel shows the characteristic spectra of the O2.--derived DIPPMPO-OOH adduct, while the right panel shows the NO-derived spectra of the 15NO·Fe·MGD adduct.
Parallel experiments were carried out to determine the effects of ONOO- and O2.- on NO release from nNOS using the well characterized NO spin trap Fe-MGD. A strong NO signal from nNOS was observed exhibiting the characteristic doublet spectrum of the 15NO·Fe·MGD complex. 15N isotopically labeled L-arginine was used to prove that the nitrogen was derived from the guanidino group of L-arginine and also to ensure that only NO from nNOS was measured. In the presence of L-arginine, both ONOO- (50 μM) and O2.- (50 μM) significantly inhibited NO formation observed from nNOS (Fig.5 right panel). Thus, from these studies both ONOO- (50 μM) and O2.- (50 μM), decrease NO production and greatly enhance O2.- generation. As such, at this level of oxidant exposure, as occurs under a range of pathophysiological conditions, both ONOO- and O2.- induce uncoupling of nNOS and greatly enhance nNOS-derived O2.- generation.
Effects of Oxidants on the nNOS monomer/dimer equilibrium
To explore the possible mechanisms by which oxidative stress alters nNOS enzyme function, further experiments were performed using FPLC to separate the nNOS monomer and dimer states. Purified nNOS (15 μg) with 5 mM DTT in 100 μl volume was injected to a Superdex 200 10/300 mm size exclusion column with 50 mM Tris-HCl, 150 mM NaCl, pH 7.4 as elution buffer. As seen in figure 6, the untreated nNOS is almost totally present as dimer with a retention volume of 10.1 ml. To obtain nNOS monomer, nNOS was incubated with 5 M urea on ice for 2 hours [37]. This urea treated nNOS gave 92% monomer and 8% dimer according to the peak integration of the absorbance at 280 nm. The retention volume for the monomer was 11.6 ml (Fig. 6). A significant increase in monomer peak appeared with O2.--treated (500 μM xanthine/0.1 XO unit/ml, 250 μM total superoxide) and ONOO- (500 μM)-treated nNOS, with levels of 50% and 33% respectively (Fig. 6, 7). OH treatment (500 μM H2O2) also induced less but notable monomer formation, of 21%, as seen from the shoulder peak in figure 6. However, there was no evidence of monomer formation in the 500 uM H2O2-treated nNOS.
Fig. 6. FPLC profiles demonstrating effects of ONOO-, ·OH and H2O2 on the monomerization of nNOS dimers.
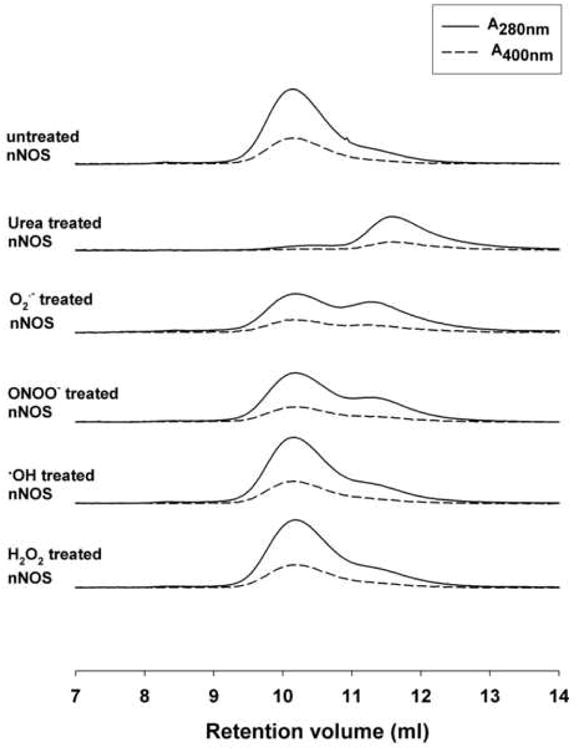
nNOS 15 μg was applied to each analysis. Elution buffer consisted of 50 mM Tris-HCl, 150 mM NaCl, 5 mM DTT, pH 7.4. Supedex 200 column and elution buffer were well equilibrated at ∼6 °C. Above are chromatograms for untreated nNOS, 5 M urea-treated nNOS (5 M urea; 2 hours on ice), O2.--treated nNOS (500μM xanthine; 0.1unit/ml XO; 20 min at RT), ONOO--treated nNOS (500 μM ONOO-; 10 min on ice), OH-treated nNOS (500 μM H2O2; 20μM Fe-NTA; 20 min on ice), and H2O2-treated nNOS (500 μM H2O2; 200μM DTPA; 20 min on ice). Solid lines present the absorbance at 280 nm wavelength. Dashed lines present the absorbance at 400 nm wavelength.
Fig. 7. Peak integration results of gel filtration chromatography.
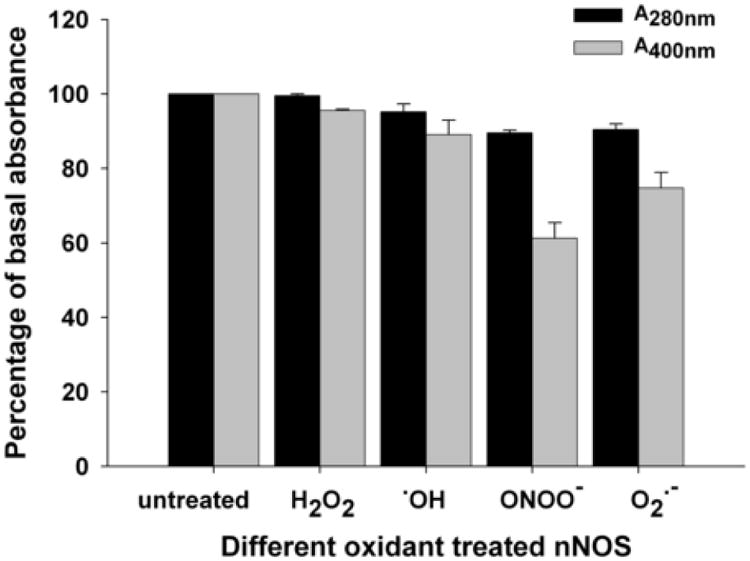
The absorbance of untreated nNOS at 280nm (black bar) and 400nm (gray bar) are used as basal control. The total absorbance of dimer and monomer peaks of oxidant treated nNOS is shown as percentage of the basal control. Data are presented as mean ± S.E. of triplicate experiments.
In addition to the monomer/dimer analysis, the FPLC studies provided data on the effects of oxidants in inducing changes in the optical absorbance of nNOS dimer and monomer. For the O2.-, ONOO-, OH and H2O2-treated nNOS samples, absorbance at 400 nm was decreased to 75%, 61%, 89% and 96% of the untreated nNOS respectively. In contrast to this the absorbance at 280 nm showed little change with oxidant treatment. Since the absorbance at 400 nm in nNOS is due mainly to the Soret band of the heme group, the observed oxidant-induced decrease in A400nm is likely related to heme degradation or a change in the heme binding site with greatest effect seen with ONOO- and lesser effects with O2.- > ·OH > H2O2.
Discussion
Nitric oxide and oxygen radical generation is increased in postischemic tissues such as the heart and brain and mediate postischemic injury [38,39]. It is well known that oxygen radicals cause lipid peroxidation and cellular calcium loading both of which are critical processes of cellular injury [34,40]. Reactive oxygen and nitrogen species formed in postischemic tissues may alter NOS function and all three NOS isoforms can become potent sources of ROS with the depletion of L-arginine or BH4 [15,18]. While it is known that oxidants can induce NOS dysfunction, there has been a lack of knowledge regarding the precise dose-dependent relationships by which particular biological oxidants alter NOS function and which oxidants exert the greatest concentration dependent effects. Furthermore, it is unknown if levels of ROS or ONOO-formed under pathophysiological conditions lead to a loss of NOS function or induce uncoupling of the enzyme.
nNOS was the first of the NOS isoforms shown to generate O2.- and it is present at high levels in brain and other neurons as well as other tissues [13,14,41]. In the absence of L-arginine or with BH4 depletion, production of NO from nNOS becomes uncoupled from the oxidation of NADPH, resulting in prominent O2.- generation [12]. Loss of NO production from NOS would exert profound effects on neuronal function and signaling. Uncoupling of the enzyme with O2.- formation would also further shift the balance of NO and O2.- present and likely induce cellular injury. However, the precise sensitivity of this critical enzyme to specific oxidant stress has not been determined.
Under pathophysiolgical conditions of oxidant stress as occur in ischemic and reperfused tissues, it can be inferred that the total integrated fluxes of ROS formation of O2.-, OH, or H2O2 result in total concentrations from several μM to 100 μM values [42-44]. Similar values would also be expected for ONOO- [38]. In the current study, we observed that both ONOO- and O2.- significantly alter nNOS function at levels above 10 - 20 μM while at levels above 100 μM >50% reduction in nNOS activity was seen. In contrast to this, for H2O2-derived OH relatively high > 200 uM exposures were required to induce significant alterations in nNOS activity. Moreover, treatment with H2O2 had very little effect even at very high concentrations, treatment with >1 mM H2O2 were required to produce even only modest effects. This resistance to oxidation by H2O2 is consistent with previous data demonstrating that nNOS can use H2O2 as a substrate, with formation of the reactive heme-oxy species, followed by reaction with Nω-hydroxyl-L-arginine or L-arginine [45,46].
With NOS that was pre-exposed to ONOO-, subsequent addition of BH4 produced only a modest restoration of NO generation. Similarly, for OH or H2O2-treated nNOS, subsequent addition of BH4 did not restore nNOS activity. This demonstrates that the oxidation of BH4 is not the only cause of the loss of NO generation by nNOS for these oxidants. In contrast, subsequent addition of BH4 to O2.--treated nNOS completely restored the NO generation at low and moderate levels of O2.--exposure (≤50 μM), and still significantly restored NO generation even after treatment with much higher levels of O2.-. Thus, the O2.--induced decrease in NO activity is almost completely due to BH4 oxidation until very high concentrations are reached.
Oxidant induced decreases in enzyme activity have been noted previously in many enzyme systems, including the NOS isozymes, and a number of different mechanisms have been implicated. Laursen et al. [47] and others [48,49] have reported that ONOO- is more potent than either O2.- or H2O2 in causing oxidation of BH4. These investigators reported that ONOO- dramatically increased vascular O2.- production in vessels from control mice but not in vessels from eNOS-deficient mice, suggesting that eNOS was the source of O2.- [48]. Our results agree that ONOO- is a potent inhibitor of nNOS-directed NO generation, however, our data indicates that BH4 oxidation is only one component of the oxidant-induced nNOS dysfunction. Furthermore, with the exception O2.-, BH4 oxidation does not appear to be the most significant cause of the oxidant-induced decrease in NO generation by nNOS.
It has been well demonstrated that under certain conditions NOS enzymes can produce O2.-, either in lieu of or in addition to NO, and that the oxidation state of the BH4 plays a critical role in coupling electron transfer from NADPH to L-arg to prevent the production of O2.- [20]. NOS catalysis functions via two sequential monooxygenation events which require the generation of a stable activated oxygen species at the heme center. In the absence of BH4, the activated oxygen species decays after a one electron reduction of molecular oxygen, producing O2.- rather than NO, leading to a condition known as NOS uncoupling [18]. BH4 not only increases NO generation by nNOS, but also decreases O2.- and subsequent H2O2 formation. When BH4 is added to a viable “uncoupled” NOS, the oxidation of NADPH is again coupled to the production of NO, as such any oxidant-induced decrease in NO activity that can be rescued by the addition of BH4 can be viewed as an indication of the presence of uncoupled NOS. Indeed we observed that O2.- exposure induced this BH4 dependent uncoupling with reversible loss of nNOS activity. EPR spin trapping measurements also confirmed that this low level of O2.- exposure triggered O2.- generation from the enzyme. Interestingly, while ONOO- also induced a loss of activity this was much less reversible with subsequent BH4 addition. Low level ONOO- exposure also triggered O2.- generation. This data together with the demonstrated inability of BH4 to rescue ONOO− induced enzyme dysfunction indicates that peroxynitrite-dependent uncoupling occurs by an additional mechanism independent of BH4.
For eNOS, it has been reported that an increase of eNOS-dependent O2.- formation correlated with the decrease in eNOS dimer levels in endothelial cells BAECs treated with ONOO- [49]. Our EPR results with purified nNOS demonstrate that ONOO- and O2.- induced a increase in O2.- generation in the presence of BH4 and L-arg, which is consistant with results reported in cultured cells [50,51] where ONOO- and oxidative stress switch nNOS from NO generation to O2.- generation. To begin to define the molecular mechanisms responsible for the observed oxidant-induced decrease in enzyme activity, we determined the change in nNOS monomer:dimer ratio after oxidant treatment. It is know that treatment with urea can dissociate the dimer into stable monomers [52]. Our FPLC results showed that a significant amount of nNOS monomer was generated by treatment with either O2.- or ONOO-, while .OH treatment produced a lesser amount of monomer. However, there was almost no detectible dissociation of the dimer in H2O2–treated nNOS. As expected, oxidant induced nNOS monomerization mirrors the observed activity decrease, that is, the more potent the oxidant in decreasing nNOS activity the higher amount of monomerization occured. Electron transfer from the reductase domain to the oxygenase domain is a requisite inter-subunit transfer [23]. Therefore, monomerization of nNOS is a key mechanism contributing to the oxidant-induced loss of nNOS activity.
Questions remain regarding how oxidant stress induces nNOS monomerization. Low temperature SDS-PAGE and gel filtration studies have demonstrated that BH4 stabilizes the nNOS dimer against dissociation [37,52,53]. This could partially explain the observed monomerization of ONOO- and ROS-treated nNOS. BH4 is oxidized when nNOS is exposed to ONOO- and ROS, and the stability of nNOS dimer would be decreased due to the depletion of BH4. It is known that reconstitution of pterin-free iNOS with BH4 can recover function to that of the active enzyme [54]. However, our results show that oxidant treatment sufficient to induce loss of nNOS activity, with the exception of low levels of O2.- exposure, leads to an irreversible decrease in NO production and immediate addition of BH4 did not significantly restore the loss of nNOS activity. Therefore, oxidation of BH4 leading to the subsequent decrease in dimer stability is not the only mechanism involved in the oxidant-induced decrease of nNOS activity.
Analysis of the gel filtration data gives some evidence that the heme or the heme binding site is a target for oxidation. Integration of the peaks elucidated that there is an absorbance decrease at 400 nm. The observed changes in the absorbance of 400 nm could be indicative of oxidation of the heme and possibly decreased heme content of the enzyme after exposure to O2.-, ONOO-, .OH and H2O2. ONOO- induced the highest decrease in A400, which correlates well with the irreversible dose-dependent loss of nNOS activity. Previous studies have shown that the heme group of nNOS is required for enzyme dimerization and that heme-free NOS is monomeric [55]. As such, oxidation of the heme moiety that leads to degradation would not only inactivate the enzyme, but would also lead to the observed monomerization. Another interesting point of the gel filtration data is that although O2.- induces the most nNOS monomer, the hypothesized heme loss is in the order of ONOO- > O2.- > .OH > H2O2. This could explain why subsequent addition of BH4 can restore the observed loss in NO generation induced by O2.-, but is not able to rescue the ONOO- induced decrease. Exogenous O2.- mainly induces BH4 oxidation at low or moderate concentrations, while ONOO- primarily induces irreversible damage, potentially to the heme group.
Conclusion
Our studies show that NO production from purified nNOS was decreased in a dose-dependent manner by the oxidants ONOO-, O2.-, .OH and H2O2. Pathophysiological levels of ONOO- and O2.-, were sufficient to cause prominent loss of NO generation from nNOS and result in uncoupling of the enzyme. .OH and H2O2 only altered nNOS at high levels. ONOO- and O2.- – induced oxidative stress leading to uncoupling of nNOS even in the presence of L-arg with an increase in nNOS-derived O2.- generation. The decrease in NO generation of nNOS induced by ONOO-, .OH and H2O2 was not significantly restored with the subsequent addition of BH4, however, with O2.- exposure at low and moderate levels near total restoration of function was seen. Our results indicate that oxidant-induced enzyme dysfunction occurs via both oxidation of BH4 and other mechanisms including potential degradation or loss of the heme center, with subsequent monomerization of the active homodimer
Acknowledgments
This work was supported by the National Institutes of Health Grants HL63744, HL65608, and HL38324, to J.L.Z.
Footnotes
Publisher's Disclaimer: This is a PDF file of an unedited manuscript that has been accepted for publication. As a service to our customers we are providing this early version of the manuscript. The manuscript will undergo copyediting, typesetting, and review of the resulting proof before it is published in its final citable form. Please note that during the production process errors may be discovered which could affect the content, and all legal disclaimers that apply to the journal pertain.
References
- 1.Ignarro LJ. Annu Rev Pharmacol Toxicol. 1990;30:535–560. doi: 10.1146/annurev.pa.30.040190.002535. [DOI] [PubMed] [Google Scholar]
- 2.Bredt DS, Snyder SH. Neuron. 1992;8:3–11. doi: 10.1016/0896-6273(92)90104-l. [DOI] [PubMed] [Google Scholar]
- 3.Marletta MA, Tayeh MA, Hevel JM. Biofactors. 1990;2:219–225. [PubMed] [Google Scholar]
- 4.Palmer RMJ, Ferrige AG, Moncada S. Nature. 1987;327:524–526. doi: 10.1038/327524a0. [DOI] [PubMed] [Google Scholar]
- 5.Kubes P, Suzuki M, Granger DN. Proc Natl Acad Sci U S A. 1991;88:4651–4655. doi: 10.1073/pnas.88.11.4651. [DOI] [PMC free article] [PubMed] [Google Scholar]
- 6.Radomski MW, Palmer RMJ, Moncada S. Trends Pharmacol Sci. 1991;12:87–88. doi: 10.1016/0165-6147(91)90510-y. [DOI] [PubMed] [Google Scholar]
- 7.Scottburden T, Vanhoutte PM. Circulation. 1993;87:51–55. [Google Scholar]
- 8.Marletta MA. Cell. 1994;78:927–930. doi: 10.1016/0092-8674(94)90268-2. [DOI] [PubMed] [Google Scholar]
- 9.Nathan C, Xie QW. Cell. 1994;78:915–918. doi: 10.1016/0092-8674(94)90266-6. [DOI] [PubMed] [Google Scholar]
- 10.Knowles RG, Moncada S. Biochem J. 1994;298:249–258. doi: 10.1042/bj2980249. [DOI] [PMC free article] [PubMed] [Google Scholar]
- 11.Ghosh DK, Stuehr DJ. Biochemistry. 1995;34:801–807. doi: 10.1021/bi00003a013. [DOI] [PubMed] [Google Scholar]
- 12.Stuehr DJ, Kwon NS, Nathan CF, Griffith OW, Feldman PL, Wiseman J. J Biol Chem. 1991;266:6259–6263. [PubMed] [Google Scholar]
- 13.Pou S, Pou WS, Bredt DS, Snyder SH, Rosen GM. J Biol Chem. 1992;267:24173–24176. [PubMed] [Google Scholar]
- 14.Heinzel B, John M, Klatt P, Bohme E, Mayer B. Biochem J. 1992;281:627–630. doi: 10.1042/bj2810627. [DOI] [PMC free article] [PubMed] [Google Scholar]
- 15.Xia Y, Dawson VL, Dawson TM, Snyder SH, Zweier JL. Proc Natl Acad Sci U S A. 1996;93:6770–6774. doi: 10.1073/pnas.93.13.6770. [DOI] [PMC free article] [PubMed] [Google Scholar]
- 16.Xia Y, Zweier JL. Proc Natl Acad Sci U S A. 1997;94:6954–6958. doi: 10.1073/pnas.94.13.6954. [DOI] [PMC free article] [PubMed] [Google Scholar]
- 17.Xia Y, Roman LJ, Masters BSS, Zweier JL. J Biol Chem. 1998;273:22635–22639. doi: 10.1074/jbc.273.35.22635. [DOI] [PubMed] [Google Scholar]
- 18.Xia Y, Tsai AL, Berka V, Zweier JL. J Biol Chem. 1998;273:25804–25808. doi: 10.1074/jbc.273.40.25804. [DOI] [PubMed] [Google Scholar]
- 19.Tayeh MA, Marletta MA. J Biol Chem. 1989;264:19654–19658. [PubMed] [Google Scholar]
- 20.Bogle RG, Baydoun AR, Pearson JD, Moncada S, Mann GE. Biochem J. 1992;284:15–18. doi: 10.1042/bj2840015. [DOI] [PMC free article] [PubMed] [Google Scholar]
- 21.Arnal JF, Munzel T, Venema RC, James NL, Bai CL, Mitch WE, Harrison DG. J Clin Invest. 1995;95:2565–2572. doi: 10.1172/JCI117957. [DOI] [PMC free article] [PubMed] [Google Scholar]
- 22.Bredt DS, Snyder SH. Proc Natl Acad Sci U S A. 1990;87:682–685. doi: 10.1073/pnas.87.2.682. [DOI] [PMC free article] [PubMed] [Google Scholar]
- 23.Abusoud HM, Yoho LL, Stuehr DJ. J Biol Chem. 1994;269:32047–32050. [PubMed] [Google Scholar]
- 24.Garcia-Cardena G, Fan R, Shah V, Sorrentino R, Cirino G, Papapetropoulos A, Sessa WC. Nature. 1998;392:821–824. doi: 10.1038/33934. [DOI] [PubMed] [Google Scholar]
- 25.Song Y, Zweier JL, Xia Y. Am J Physiol Cell Physiol. 2001;281:C1819–C1824. doi: 10.1152/ajpcell.2001.281.6.C1819. [DOI] [PubMed] [Google Scholar]
- 26.Song Y, Zweier JL, Xia Y. Biochem J. 2001;355:357–360. doi: 10.1042/0264-6021:3550357. [DOI] [PMC free article] [PubMed] [Google Scholar]
- 27.Corson MA, James NL, Latta SE, Nerem RM, Berk BC, Harrison DG. Circ Res. 1996;79:984–991. doi: 10.1161/01.res.79.5.984. [DOI] [PubMed] [Google Scholar]
- 28.Dimmeler S, Fleming I, Fisslthaler B, Hermann C, Busse R, Zeiher AM. Nature. 1999;399:601–605. doi: 10.1038/21224. [DOI] [PubMed] [Google Scholar]
- 29.Nakane M, Mitchell J, Forstermann U, Murad F. Biochem Biophys Res Commun. 1991;180:1396–1402. doi: 10.1016/s0006-291x(05)81351-8. [DOI] [PubMed] [Google Scholar]
- 30.Cardounel AJ, Zweier JL. J Biol Chem. 2002;277:33995–34002. doi: 10.1074/jbc.M108983200. [DOI] [PubMed] [Google Scholar]
- 31.Cardounel AJ, Xia Y, Zweier JL. J Biol Chem. 2005;280:7540–7549. doi: 10.1074/jbc.M410241200. [DOI] [PubMed] [Google Scholar]
- 32.Michel T, Li GK, Busconi L. Proc Natl Acad Sci U S A. 1993;90:6252–6256. doi: 10.1073/pnas.90.13.6252. [DOI] [PMC free article] [PubMed] [Google Scholar]
- 33.Schmidt H, Pollock JS, Nakane M, Gorsky LD, Forstermann U, Murad F. Proc Natl Acad Sci U S A. 1991;88:365–369. doi: 10.1073/pnas.88.2.365. [DOI] [PMC free article] [PubMed] [Google Scholar]
- 34.Josephson RA, Silverman HS, Lakatta EG, Stern MD, Zweier JL. J Biol Chem. 1991;266:2354–2361. [PubMed] [Google Scholar]
- 35.Aisen P, Leibman A, Zweier J. J Biol Chem. 1978;253:1930–1937. [PubMed] [Google Scholar]
- 36.Kelm M, Feelisch M, Spahr R, Piper HM, Noack E, Schrader J. Biochem Biophys Res Commun. 1988;154:236–244. doi: 10.1016/0006-291x(88)90675-4. [DOI] [PubMed] [Google Scholar]
- 37.RodriguezCrespo I, Gerber NC, deMontellano PRO. J Biol Chem. 1996;271:11462–11467. doi: 10.1074/jbc.271.19.11462. [DOI] [PubMed] [Google Scholar]
- 38.Wang PH, Zweier JL. J Biol Chem. 1996;271:29223–29230. doi: 10.1074/jbc.271.46.29223. [DOI] [PubMed] [Google Scholar]
- 39.Zweier JL, Fertmann J, Wei G. Antioxid Redox Signal. 2001;3:11–22. doi: 10.1089/152308601750100443. [DOI] [PubMed] [Google Scholar]
- 40.Venardos KM, Kaye DM. Curr Med Chem. 2007;14:1539–1549. doi: 10.2174/092986707780831078. [DOI] [PubMed] [Google Scholar]
- 41.Lafoncazal M, Pietri S, Culcasi M, Bockaert J. Nature. 1993;364:535–537. doi: 10.1038/364535a0. [DOI] [PubMed] [Google Scholar]
- 42.Zweier JL. J Biol Chem. 1988;263:1353–1357. [PubMed] [Google Scholar]
- 43.Zweier JL, Kuppusamy P, Williams R, Rayburn BK, Smith D, Weisfeldt ML, Flaherty JT. J Biol Chem. 1989;264:18890–18895. [PubMed] [Google Scholar]
- 44.Xia Y, Zweier JL. J Biol Chem. 1995;270:18797–18803. doi: 10.1074/jbc.270.32.18797. [DOI] [PubMed] [Google Scholar]
- 45.Pufahl RA, Wishnok JS, Marletta MA. Biochemistry. 1995;34:1930–1941. doi: 10.1021/bi00006a014. [DOI] [PubMed] [Google Scholar]
- 46.Adak S, Wang Q, Stuehr DJ. J Biol Chem. 2000;275:33554–33561. doi: 10.1074/jbc.M004337200. [DOI] [PubMed] [Google Scholar]
- 47.Laursen JB, Somers M, Kurz S, McCann L, Warnholtz A, Freeman BA, Tarpey M, Fukai T, Harrison DG. Circulation. 2001;103:1282–1288. doi: 10.1161/01.cir.103.9.1282. [DOI] [PubMed] [Google Scholar]
- 48.Landmesser U, Dikalov S, Price SR, McCann L, Fukai T, Holland SM, Mitch WE, Harrison DG. J Clin Invest. 2003;111:1201–1209. doi: 10.1172/JCI14172. [DOI] [PMC free article] [PubMed] [Google Scholar]
- 49.Kuzkaya N, Weissmann N, Harrison DG, Dikalov S. J Biol Chem. 2003;278:22546–22554. doi: 10.1074/jbc.M302227200. [DOI] [PubMed] [Google Scholar]
- 50.Shang TS, Kotamrajua S, Zhao HT, Kalivendi SV, Hillard CJ, Kalyanaraman B. Free Radical Biol Med. 2005;39:1059–1074. doi: 10.1016/j.freeradbiomed.2005.05.022. [DOI] [PubMed] [Google Scholar]
- 51.Zou MH, Shi CM, Cohen RA. J Clin Invest. 2002;109:817–826. doi: 10.1172/JCI14442. [DOI] [PMC free article] [PubMed] [Google Scholar]
- 52.Panda K, Rosenfeld RJ, Ghosh S, Meade AL, Getzoff ED, Stuehr DJ. J Biol Chem. 2002;277:31020–31030. doi: 10.1074/jbc.M203749200. [DOI] [PubMed] [Google Scholar]
- 53.Klatt P, Schmidt K, Lehner D, Glatter O, Bachinger HP, Mayer B. EMBO J. 1995;14:3687–3695. doi: 10.1002/j.1460-2075.1995.tb00038.x. [DOI] [PMC free article] [PubMed] [Google Scholar]
- 54.Rusche KM, Marletta MA. J Biol Chem. 2001;276:421–427. doi: 10.1074/jbc.M006860200. [DOI] [PubMed] [Google Scholar]
- 55.Klatt P, Pfeiffer S, List BM, Lehner D, Glatter O, Bachinger HP, Werner ER, Schmidt K, Mayer B. J Biol Chem. 1996;271:7336–7342. doi: 10.1074/jbc.271.13.7336. [DOI] [PubMed] [Google Scholar]


