Abstract
Aldehyde oxidase, a molybdoflavoenzyme that plays an important role in aldehyde biotransformation, requires oxygen as substrate and produces reduced oxygen species. However, little information is available regarding its importance in cellular redox stress. Therefore, studies were undertaken to characterize its superoxide and hydrogen peroxide production. Aldehyde oxidase was purified to >98% purity and exhibited a single band at ∼290 kDa on native polyacrylamide gradient gel electrophoresis. Superoxide generation was measured and quantitated by cytochrome c reduction and EPR spin trapping with p-dimethyl aminocinnamaldehyde as reducing substrate. Prominent superoxide generation was observed with an initial rate of 295 nmol/min/mg. Electrochemical measurements of oxygen consumption and hydrogen peroxide formation yielded values of 650 nmol/min/mg and 355 nmol/min/mg. In view of the ubiquitous distribution of aldehydes in tissues, aldehyde oxidase can be an important basal source of superoxide that would be enhanced in disease settings where cellular aldehyde levels are increased.
Keywords: Aldehyde oxidase, Xanthine oxidase, Superoxide, Hydrogen peroxide, Electron paramagnetic resonance, Spin trapping, Cytochrome c reduction, Reactive oxygen species, Free radicals, Oxygen consumption
Aldehyde oxidase (AO; EC 1.2.3.1)1 is a prominent member of the molybdenum hydroxylase family of enzymes, which also includes xanthine oxidoreductase (XOR). XOR has two interconvertible forms, xanthine dehydrogenase (XDH; EC 1.1.1.204) and xanthine oxidase (XO; 1.1.3.22). Both forms of XOR are involved in the catabolism of purines, oxidizing hypoxanthine to xanthine, and finally xanthine to its terminal catabolite, uric acid. However, XDH primarily reduces NAD+ with production of NADH, whereas XO reduces molecular oxygen with the production of superoxide and hydrogen peroxide (H2O2). XDH can be converted irreversibly into XO by treating with proteases like trypsin, chymotrypsin or pancreation, or reversibly into XO by oxidizing thiol groups of Cys535 and Cys992 [1]. Conversion of XDH into XO is a not a general characteristic of all eukaryotic XORs, e.g. chicken liver XOR is present only in the XDH form and does not undergo conversion into XO [2].
Both XOR and AO are homodimeric consisting of two identical subunits with an approximate molecular mass of 145 kDa each. Each subunit consists of four discrete regions — two N-terminal domains contain distinct [2Fe-2S] centers. A linker peptide connects it to a 40 kDa FAD binding domain that positions the flavin ring in close proximity and a second linker peptide connects the FAD domain with the 85 kDa C-terminal portion of the protein that contains the molybdenum center and the substrate binding pocket [3,4]. The structure of XOR is well conserved among human, chicken, mouse and rat enzymes [5] and the amino acid sequences reveal that the molybdenum binding site is the most conserved region with 94% homology among human, rat and mouse [6]. The gene encoding human AO is also very similar to that for XOR, with almost identical intron/exon organization with respect to the positions of exons and type of intron/exon junctions [7,8].
Although AO and XO are related enzymes in terms of their general structure, biochemical characteristics and amino acid sequences, their substrate specificity and inhibitor susceptibility are different [9-11]. AO is predominantly present in the liver but it is also present in other tissues, such as lung, kidney, heart, vasculature and skin of several mammalian species and has broad substrate specificity [9,12]. Despite its name, it can catalyze not only the oxidation of a variety of aldehydes to their corresponding carboxylic acids [10] but also the hydroxylation of aromatic azaheterocycles containing a –CH=N– moiety (e.g. phthalazine and purines), and aromatic or non-aromatic charged heterocycles with –CH=N+ – (e.g. NI-methylnicotinamide and N-methylphthalazinium) [13-15]. AO also plays a major role in nitroreduction [16] and participates in the reduction of isoxazole and isothiazole ring systems [17]. On the other hand, XOR participates mainly in purine metabolism, though both XOR and AO have some overlapping substrate specificity [11].
Because of its ability to generate and the suggested role of this in reperfusion injury [18] and in the pathophysiology of congestive heart failure [19], over the past two decades much interest has focused on XOR. Over this time, however, there has been little investigation of AO and its role in oxidant biology. When molecular oxygen acts as an electron acceptor in the AO-catalyzed oxidation of aldehydes or azaheterocycles, it undergoes a two-electron reduction to produce H2O2, however, a portion undergoes one-electron reduction to produce , as seen with XOR. While earlier work has provided indirect evidence of formation [20,21], no detailed investigation of generation by AO or characterization of the magnitude of its production has been reported. As such, the importance of AO in the process of free radical biology under normal or disease conditions remains unclear.
In order to address this critical issue, we have developed an improved method to purify AO from rat liver and characterized its reduction of molecular oxygen. Direct EPR spin trapping measurements of production have been performed, as well as measurements of cytochrome c reduction and these results were correlated with polarographic measurements of H2O2 production and oxygen consumption. Given the known levels of aldehyde substrates and AO activity present in biological tissues, it is evident from this work that AO is an important source of both and H2O2 in biological tissues.
Materials and methods
Ethylenediaminetetraacetic acid (EDTA) disodium salt, phenylmethanesulfonyl fluoride (PMSF), xanthine, 4-(Dimethylamino)cinnamaldehyde (p-DMAC), 4-aminobenzamidine dihydrochloride, menadione, glycine, potassium phosphate, sodium chloride, sodium pyrophosphate, sodium hydroxide, acrylamide/bisacrylamide solution (31%), ammonium sulfate, ammonium persulfate, sodium dodecyl sulfate (SDS), sodium salicylate, methanol, catalase, cytochrome c, copper-zinc superoxide dismutase (SOD1), HR Sephacryl S-300 and Sephadex G-25 were purchased from Sigma. Hydroxyapatite Ultrogel was purchased from Ciphergen Biosystems, Inc. Benzamidine Sepharose 6B and molecular weight marker for native gel were obtained from Amersham Biosciences. Bovine serum albumin (BSA), protein determination kit, precast gel (4-15% gradient) for native PAGE, sample buffers, β-mercaptoethanol, chromatographic columns and molecular weight marker for SDS-PAGE were obtained from Bio-Rad. Spin trapping agents, 5,5-dimethyl-1-pyrroline-N-oxide (DMPO) and 5-(diethoxyphosphoryl)-5-methyl-1-pyrroline-N-oxide (DEPMPO) were purchased from Dojindo Laboratories (Kumamoto, Japan) and Alexis (Carlsbad, CA), respectively. Diethylenetriaminepentaacetic acid (DTPA) was obtained from Aldrich. All other chemicals used were of the highest quality commercially available.
Purification of AO from rat liver
Livers were surgically excised from male Sprague-Dawley rats (250-300 g) and rinsed thoroughly in phosphate buffer saline (PBS) solution (pH 7.4) containing 0.15 M potassium phosphate, 0.9% NaCl to remove residual blood. These livers were then immediately frozen in liquid nitrogen.
The entire purification was performed at 2-3 °C and all buffers contain 0.1 mM EDTA, unless otherwise specified. The enzyme purification protocol used here differs somewhat from other preparations reported in the literature [22-25]. Briefly, the frozen rat livers were rinsed with 50 mM potassium phosphate buffer (pH 7.8) containing 0.3 mM EDTA, 0.1 mM salicylate and 0.1 mM PMSF (buffer A) and homogenized with three volumes of cold buffer using a glass-Teflon homogenizer. Liver cytosol was obtained from the homogenate by centrifugation at 45,000 × g for 30 min at 4 °C. The cytosol thus obtained, was heated at 56 °C for 10 min, followed by rapid cooling and then ultracentrifuged at 235,000 × g at 4 °C for one hour. The clear red supernatant was filtered through glass wool and solid ammonium sulfate was added to 30% saturation with constant stirring. The resulting suspension was centrifuged at 100,000 × g for 30 min at 4 °C and the pellet was discarded. To this clear supernatant, further ammonium sulfate was added slowly with constant stirring to bring it to 60% saturation (final). After centrifugation, the resulting pellet was dissolved in a minimum volume of buffer A. The insoluble debris was removed by ultracentrifugation at 140,000 × g for one hour at 4 °C and the supernatant was desalted by passage through a Sephadex G-25 column pre-equilibrated with phosphate buffer (pH 7.8) and then loaded on Hydroxyapatite Ultrogel column pre-equilibrated with phosphate buffer (pH 7.8). Protein was eluted with 100 mM phosphate buffer (pH 7.8) and the active fractions were pooled, combined and concentrated using a Centricon YM-30 membrane before loading on a HR Sephacryl S-300 gel filtration column pre-equilibrated with 100 mM glycine-NaOH buffer (pH 9.0) containing 100 mM NaCl. The protein was eluted with the same buffer and pooled, combined and buffer-exchanged and loaded on a Benzamidine Sepharose 6B column pre-equilibrated with 15 mM pyrophosphate buffer (pH 9.0). The column was washed with three column volumes of equilibration buffer and the protein was eluted with the same buffer containing 10 mM 4-aminobenzamidine dihydrochloride. The active fractions were pooled, combined, concentrated and passed through a small Sephadex G-25 column pre-equilibrated with 50 mM phosphate buffer (pH 7.8). The protein was further concentrated as above and stored under liquid nitrogen until needed. In all steps of purification, the collected fractions were checked for activities of both AO and XO.
Assay for AO activity
AO activity was determined by adding a suitable volume of enzyme solution to 1 mL of 50 mM potassium phosphate buffer (pH 7.8) containing 25 μM of p-DMAC as reducing substrate at 30 °C and monitoring the decrease in absorbance at 398 nm resulting from the oxidation of substrate in a cuvette of 1 cm path length. The dissolved oxygen was used as electron acceptor. Absorbance changes were converted to units of enzyme activity (IU) using an extinction coefficient ε = 30,500 M-1 cm-1 [26]. One unit of enzyme activity is defined as the amount of enzyme required to oxidize one micromole of substrate (p-DMAC) per minute at 30 °C.
Assay for XO activity
XO activity was determined by adding a suitable amount of enzyme solution to a 50 mM potassium phosphate buffer (pH 7.8) containing 30 μM xanthine as a substrate at 30 °C and immediately following the increase in absorbance at 295 nm due to the oxidation of the substrate to uric acid. The enzyme activity was calculated from the absorbance values using an extinction coefficient ε = 6,780 M-1 cm-1 [27].
Determination of protein concentration
Protein concentration was determined by the Bradford method [28], using Bio-Rad protein assay kit and bovine serum albumin as a standard. Specific activity was expressed as the number of enzyme units per milligram of protein, i.e., μmol min-1 mg-1.
Polyacrylamide gel electrophoresis
Polyacrylamide gel electrophoresis (PAGE) was carried out on both native and denaturing samples using two different molecular weight markers. SDS-PAGE was performed according to the procedure as described by Laemmli [29] using 4% stacking gel and 10% resolving gel. Upon completion of electrophoresis the gel was stained with 0.25% Coomassie brilliant blue R-250 and destained with a solution containing 15% methanol and 10% acetic acid. For native PAGE, a pre-cast gradient gel (4-15%) from Bio-Rad was used. Electrophoresis was performed using a constant current of 5 mA for 14 hours. Finally, the gel was stained and destained according to the procedure described above. The entire process of native PAGE was performed at 2-3 °C.
Ultraviolet-visible spectroscopy
All kinetic and spectral measurements were performed with a Hewlett Packard 8452A diode array spectrophotometer equipped with a thermostated cell compartment. The Pro-Kinetic program was used for kinetic data analysis. A quartz cuvette of 1 cm path length was used for UV-vis experiments.
Detection of formation using cytochrome c assay
Formation of was detected by following the SOD-inhibitable reduction of ferricytochrome c at 550 nm at 37 °C. Total volume of reaction mixture was 1 mL consisting of 100 μM ferricytochrome c, 100 mM phosphate buffer (pH 7.8) containing 0.1 mM EDTA, a suitable amount of enzyme and 100 μM p-DMAC as substrate. p-DMAC was added last to initiate the reaction and the absorbance change at 550 nm was recorded. In order to subtract any -independent change in absorbance the same assay was performed in the presence of 50 μg of SOD. An extinction coefficient of 21,000 M-1 cm-1 [30] was used for cytochrome c (the difference between the absorption of reduced cytochrome c minus oxidized cytochrome c) to quantify the formation. Similar experiments were performed with xanthine oxidase (XO) under identical condition except that 100 μM xanthine was used as a substrate instead of p-DMAC. Cytochrome c used in all these experiments was further purified by treatment with potassium ferricyanide and subsequently passage through a Sephadex G-25 column.
Electron paramagnetic resonance spectroscopy
X-band electron paramagnetic resonance (EPR) spectra were recorded on a Bruker ESP 300 E spectrometer equipped with a TM110 microwave cavity. The system was also equipped with a proton probe gaussmeter and a microwave frequency counter to enable precise calibration of magnetic field and microwave frequency as described previously [31]. The sample was placed in a TM aqueous flat cell and EPR measurements were performed at ambient temperature. Either DMPO or DEPMPO were used as spin traps. The EPR parameters were as follows: microwave frequency, 9.78 GHz; microwave power, 20 mW; modulation amplitude, 0.5 G; time constant, 82 ms; scan time, 30 s. Quantitation of the observed free radical signals was performed by computer simulation of the spectra with comparison of the double integral of the observed signal with that of a TEMPO standard (1 μM) measured under identical conditions [32].
Measurements of H2O2 formation and O2 consumption
Formation of H2O2 and O2 consumption were measured using an electrochemical method as described previously [33]. Briefly, three electrodes, a Pt disk microelectrode, a Pt auxiliary electrode, and a silver/silver chloride (Ag/AgCl) reference electrode were inserted into a 4-port water-jacketed electrochemical chamber containing 2 mL air saturated phosphate buffer (50 mM, pH 7.8), 0.1 mM EDTA, 0.2 mM p-DMAC for AO or 0.2 mM xanthine for XO, and 14 mU/mL of AO or XO. The set up was connected to a CHI Electrochemical Detector (CH Instrument, Austin, TX, USA). The solution was constantly stirred with a magnetic bar controlled by the stirrer. The enzyme was added to initiate the reaction and the production of H2O2 and the consumption of O2 were detected simultaneously.
Results
Purification of AO
The purification protocol used for aldehyde oxidase is summarized in Table 1. The overall purification from the cytosol was more than 1600 fold with a yield of 12%. The final specific activity of purified AO was 1.8 U/mg that is comparable to the highly purified enzyme as reported in the literature [25]. The purity of the enzyme was checked with both SDS-PAGE and native PAGE (Fig. 1). In the SDS-PAGE, we observed one band at approximately 150 kDa. In addition to this, we also observed three other bands at approximately 135 kDa, 100 kDa and 40 kDa (Fig. 1A). These bands appear to arise due to proteolysis and suggest that AO, like XO, is also susceptible to proteolysis [23]. However, native PAGE showed only a single band at approximately 290 kDa indicating that the purified AO is free from other protein impurities. To further characterize the enzyme and assess its purity, optical absorption spectroscopy were performed. The purified enzyme shows a characteristic UV-vis absorbance spectrum (Fig. 2) indistinguishable from that previously reported for highly purified enzyme [25, 34]. The band at 450 nm corresponds to FAD and [2Fe-2S] centers, whereas the band at 560 nm is due to [2Fe-2S] clusters alone (see inset, Fig. 2). The ratio A280:A450, an indication of the ratio of protein to flavin plus iron, was between 5.3 and 5.7, comparable to the values reported previously for AO [25, 34].
Table 1.
Purification of AO from rat liver.
| Purification step | Total protein (mg) |
Total activity (mU) |
Specific activity (mU/mg) |
Purification fold | Yield (%) |
|---|---|---|---|---|---|
| Liver homogenate | 7987 | 8626 | 1.08 | 1 | 100 |
| 60% (NH4)2SO4 cut | 1734 | 3173 | 1.83 | 2 | 37 |
| Hydroxyapatite Ultrogel | 293 | 2068 | 7.06 | 7 | 24 |
| HR Sephacryl S-300 | 105 | 1090 | 10.38 | 10 | 13 |
| Benzamidine Sepharose-6B | 0.56 | 1004 | 1800 | 1667 | 12 |
Fig. 1.
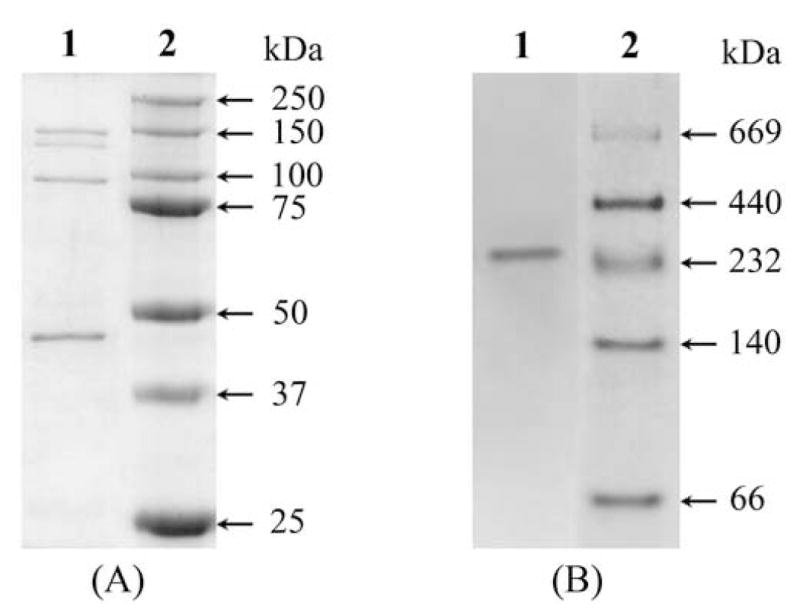
(A) SDS-PAGE of purified AO from rat liver. Samples were electrophoresed on 10% gel and stained for protein with Coomassie Brilliant Blue. Lane 1, 10 μg of purified AO; lane 2, standard molecular weight marker. (B) native PAGE of purified AO. Sample was electrophoresed on 4-15% gradient gel and stained for protein with Coomassie Brilliant Blue. Lane 1, 10 μg of purified AO; lane 2, standard native molecular weight markers.
Fig. 2.
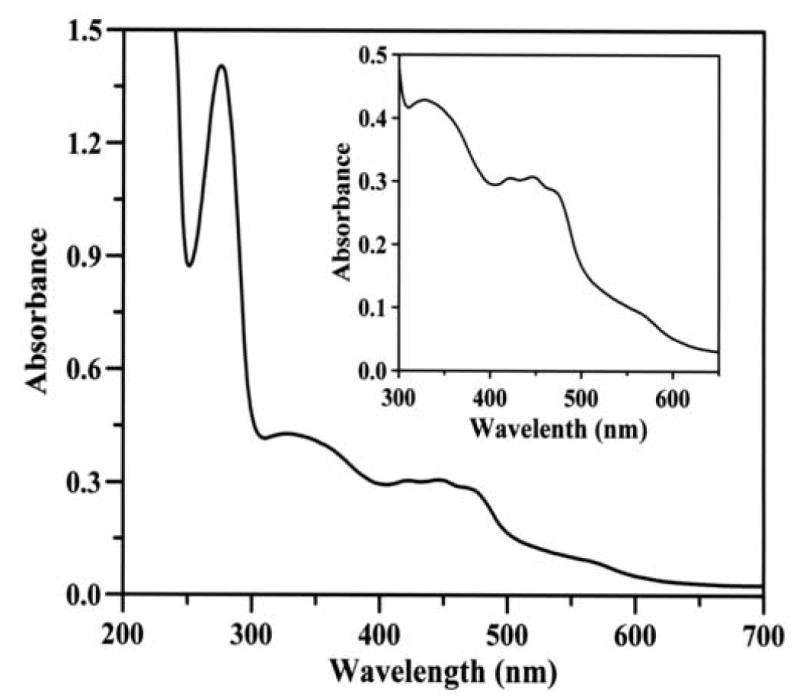
Ultraviolet-visible absorption spectrum of purified rat liver AO. The spectrum of AO (1.22 mg/mL) reveals a characteristic feature of enzymes belonging to xanthine oxidase family, with absorption maxima at 278, 340, 450 and 560 nm. Inset, an expanded view of the spectrum in the 300-650 nm region.
Detection of by cytochrome c reduction
Initial experiments were performed using the cytochrome c reduction assay to measure the rate of production by AO, in the presence of substrate, 100 μM p-DMAC (Fig. 3a). Detection of in this assay is based on its ability to reduce ferricytochrome c,
Fig. 3.
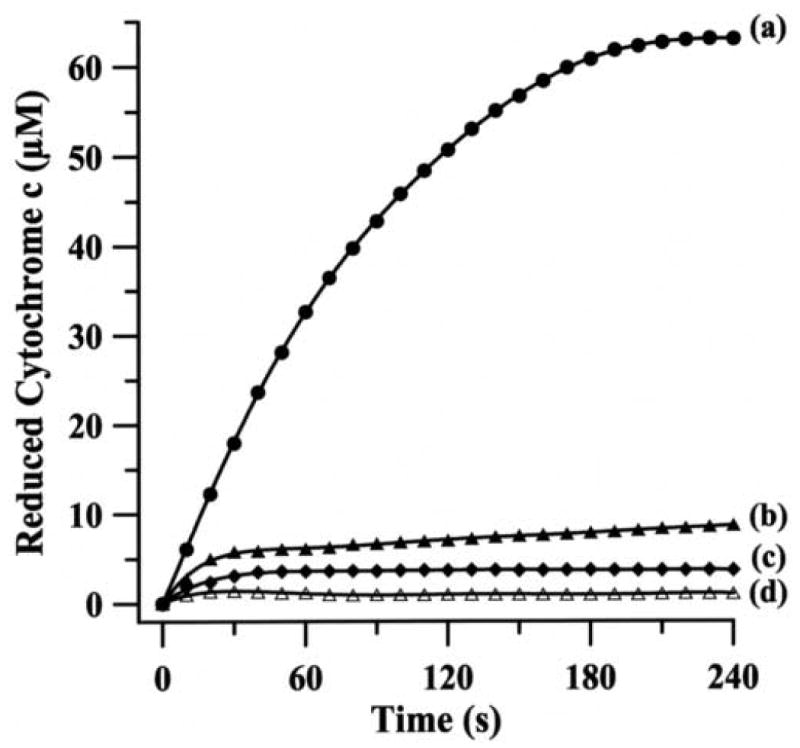
Continuous assay for the generation of during the oxidation of p-DMAC by rat liver AO. The reaction mixture (1 mL) contained 100 mM phosphate buffer (pH 7.8), 0.1 mM EDTA, 100 μM ferricytochrome c, 100 U/mL catalase, 14 mU/mL AO and 100 μM p-DMAC as a substrate. Reduction of ferricytochrome c by (a) complete system; (b) same as a but in presence of menadione (100 μM); (c) same as a but in presence of SOD1 (100 U/mL); (d) same as a but without any enzyme and in presence of SOD1 (100 U/mL).
Since AO also catalyzes the two-electron reduction of molecular oxygen to H2O2, which in turn can re-oxidize Fe2+-cytochrome c to Fe3+-cytochrome c, the reaction was performed in the presence of catalase (100 U/mL) that decomposes H2O2 into H2O and O2. To further confirm that the observed cytochrome c reduction was due to AO-generated , experiments were performed in presence of menadione, a potent inhibitor of AO. Menadione at a concentration of 100 μM, largely blocked (∼92% inhibition) the observed cytochrome c reduction, with minimal change in absorbance at 550 nm observed (Fig. 3b). Similarly, the reduction of cytochrome c was completely inhibited by SOD1 (Fig. 3c) and the observed absorbance was identical to that in the absence of AO (Fig. 3d). These results indicate that the observed reduction of cytochome c is almost entirely due to its reaction with . In order to compare the rate of superoxide production by AO with that of XO, we performed similar experiments with XO under identical conditions using xanthine as a substrate (Fig. 4a). The reduction of cytochrome c was almost completely quenched by SOD1 (Fig. 4b) and in the absence of XO no cytochrome c reduction was seen (Fig. 4c), indicating that the reduction of cytochrome c is solely due to its reaction with generated by XO/xanthine system.
Fig. 4.
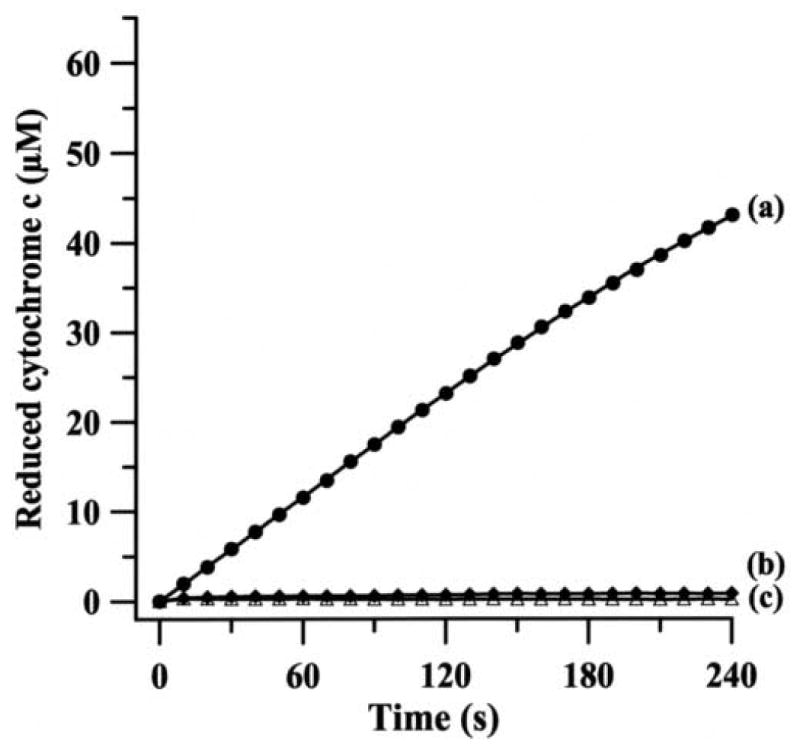
Continuous assay for the generation of during the oxidation of xanthine by bovine milk XO. The reaction mixture (1 mL) contained 100 mM phosphate buffer (pH 7.8), 0.1 mM EDTA, 100 μM ferricytochrome c, 100 U/mL catalase, 14 mU/mL XO and 100 μM xanthine as a substrate. Reduction of ferricytochrome c by (a) complete system; (b) same as a but in presence of SOD1 (100 U/mL); (c) same as a but without any enzyme and in presence of SOD1 (100 U/mL). In order to compare the rate of superoxide production by XO with that of AO both X- and Y-axis scales are kept identical to those of Fig. 3.
Detection of by EPR spin trapping
EPR spin trapping is the most direct method to detect highly labile free radicals including , hydroxyl and other oxygen-, carbon- or sulfur-centered radicals. EPR spin trapping measurements were performed on preparations of 14 mU/mL AO in 50 mM phosphate buffer (pH 7.8) containing 400 μM of the iron chelator DTPA in the presence of 50 mM DMPO. Addition of 200 μM p-DMAC resulted in the formation of a prominent EPR spectrum. As shown in Fig. 5A, this spectrum consists of 12 peaks arising from hyperfine coupling parameters aN = 14.2 G, aH1 = 11.6 G, and aH2 = 1.2 G corresponding to the adduct of DMPO, DMPO-OOH [35]. A small additional EPR component was also observed arising from the DMPO-OH adduct (aN = aH = 14.9 G), as marked by ● in Fig. 5A, which is likely due to the spontaneous decomposition of DMPO-OOH adduct into DMPO-OH adduct [35]. In addition, a very weak signal of a carbon centered radical adduct (DMPO-R) is also seen in the spectrum (as indicated by ◆). No EPR signal was observed in the absence of AO (Fig. 5B). The addition of SOD1 (100 U/mL), the superoxide radical scavenging enzyme, completely quenched the observed EPR signal (Fig. 5C). Menadione, a potent inhibitor of AO, also quenched this DMPO-OOH adduct signal (Fig. 5D); however, very weak signals corresponding to DMPO-OH and DMPO-R adducts were observed. No EPR signal was observed when the same experiment was performed in the presence of 100 U/mL SOD1 (data not shown).
Fig. 5.
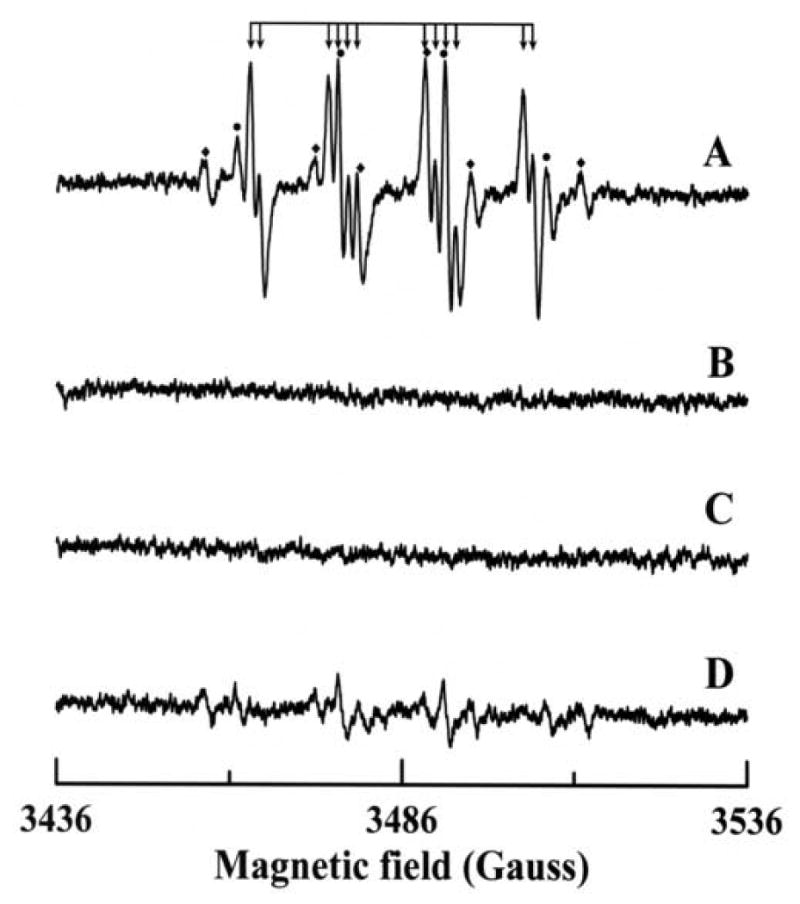
EPR spectra of DMPO radical adducts recorded during the reaction of p-DMAC with AO in presence of DMPO. The spectra were recorded after incubation of 200 μM p-DMAC with 14 mU/mL AO, 400 μM DTPA and 50 mM DMPO for 2 minutes at room temperature in 50 mM phosphate buffer (pH 7.8). (A) Complete system; (B) same as A but in absence of AO; (C) same as A but in presence of 100 U/mL SOD1; (D) same as A but in presence of 100 μM menadione. The composite spectrum of A consists of three different radical adducts: (↓) DMPO/ , (●) DMPO/•OH and (◆) DMPO/•R. Instrumental conditions are as described in the “Materials and methods”.
In order to determine the time course of formation by the p-DMAC/AO system, further EPR spin trapping experiments were performed as a function of time using DMPO. The reaction mixture contained DMPO (100 mM), p-DMAC (200 μM) and AO (28 mU/mL) in 50 mM phosphate buffer (pH 7.8) containing 400 μM DTPA. Maximum formation of the DMPO-OOH adduct was seen over the first two minutes of the reaction (Figs. 6 & 7). By the third minute the DMPO-OOH signal declined with a small increase in the observed DMPO-OH signal as shown in Fig. 7. Quantitation of the DMPO radical adducts was performed by computer simulation of the EPR spectra with comparison the double integral of the observed signal with that of a TEMPO standard measured under identical conditions. The decomposition of DMPO-OOH into DMPO-OH adduct is one of several decomposition pathways. The signal corresponding to the DMPO-OOH adduct decayed due to the short half-life of this adduct (∼45 s) and a small increase in signal intensity of DMPO-OH adduct was observed (Fig. 7).
Fig. 6.
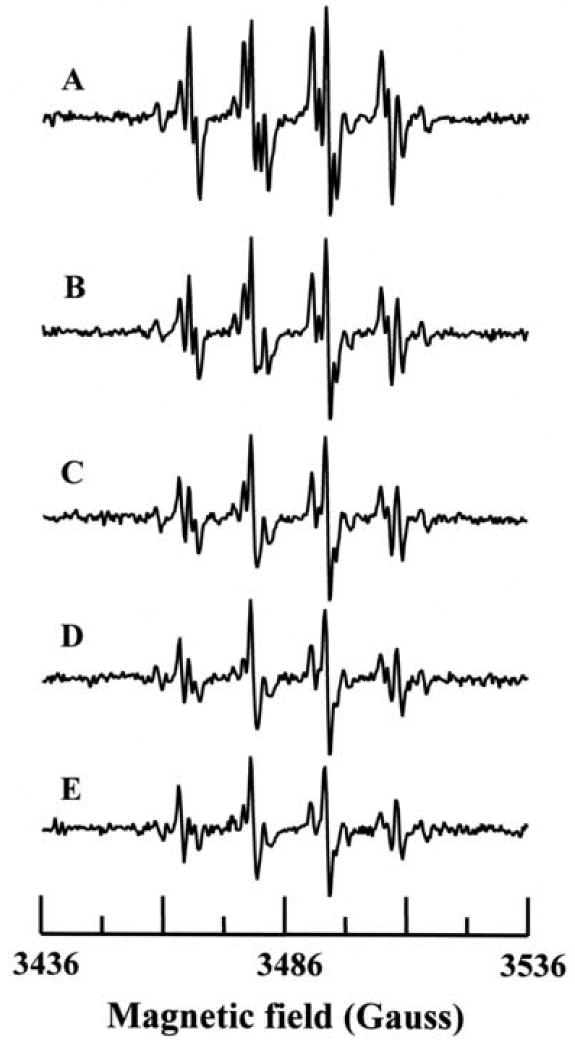
Time course of radical generation from AO. The reaction mixture contained DMPO (100 mM), p-DMAC (200 μM) and AO (28 mU/mL) in 50 mM phosphate buffer (pH 7.8) with 0.4 mM DTPA. Data collection was started 105 seconds after the addition of AO. Spectra A-E were recorded at 1 min interval.
Fig. 7.
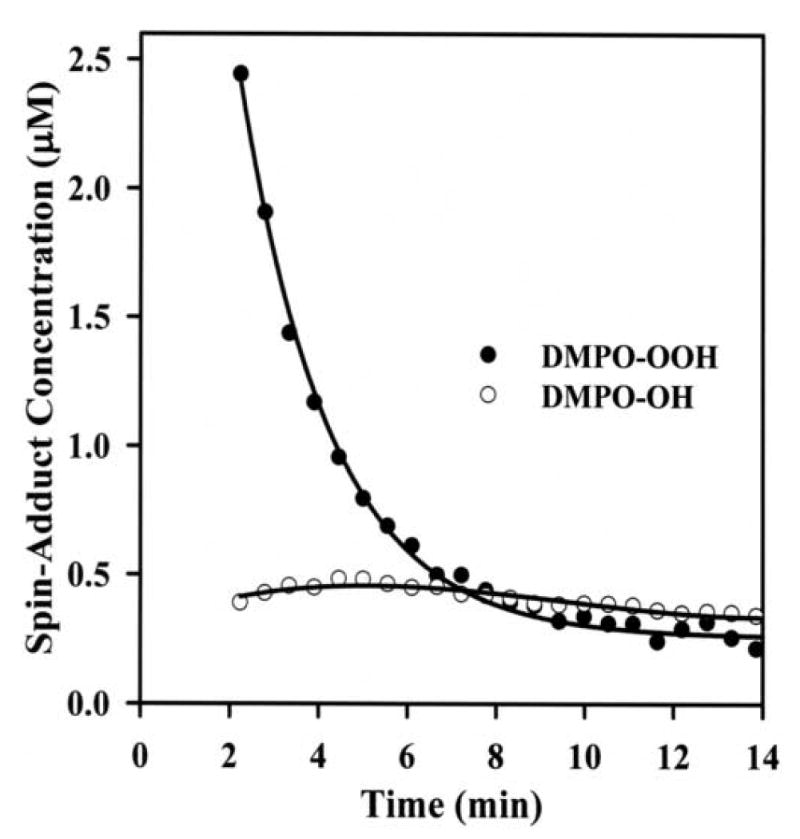
Kinetics of formation of and hydroxyl radical adducts of DMPO: Concentrations of DMPO-OOH (●) and DMPO-OH (○) adducts as obtained by computer simulation of the EPR spectra with comparison the double integral of the observed signal with that of a TEMPO standard measured under the identical conditions. Measurements were performed as described in Fig. 6.
To further confirm formation and examine the kinetics of this process additional experiments were also performed using the spin trap DEPMPO, which forms a more stable adduct with [36]. The half-life for decomposition of the DEPMPO-OOH adduct in aqueous media is ∼16 min, much longer than the ∼45 s half life of DMPO-OOH [37-39]. EPR experiments were carried out under conditions identical to those in Fig. 5, except that the reaction mixture contained 20 mM of DEPMPO in place of DMPO. The observed EPR spectrum arises largely from the DEPMPO-OOH adduct, as can be seen in Fig. 8A. Again some small additional peaks are seen and correspond to DEPMPO-OH (as marked by ●) and DEPMPO-R adducts (as indicated by ◆) in Fig. 8A. No EPR signal was observed either in the absence of AO (Fig. 8B), or upon addition of superoxide dismutase (SOD1) to the reaction mixture (Fig. 8C). The addition of 100 μM of the AO-inhibitor menadione also largely abolished the observed signal (Fig. 8D); however, very weak signals corresponding to DEPMPO-OH and DEPMPO-R adducts are observed in this spectrum. No EPR signal was observed when the same experiment was performed in the presence of 100 U/mL SOD1 (data not shown). Thus, it is clear that AO in the presence of requisite substrate is a prominent source of generation.
Fig. 8.
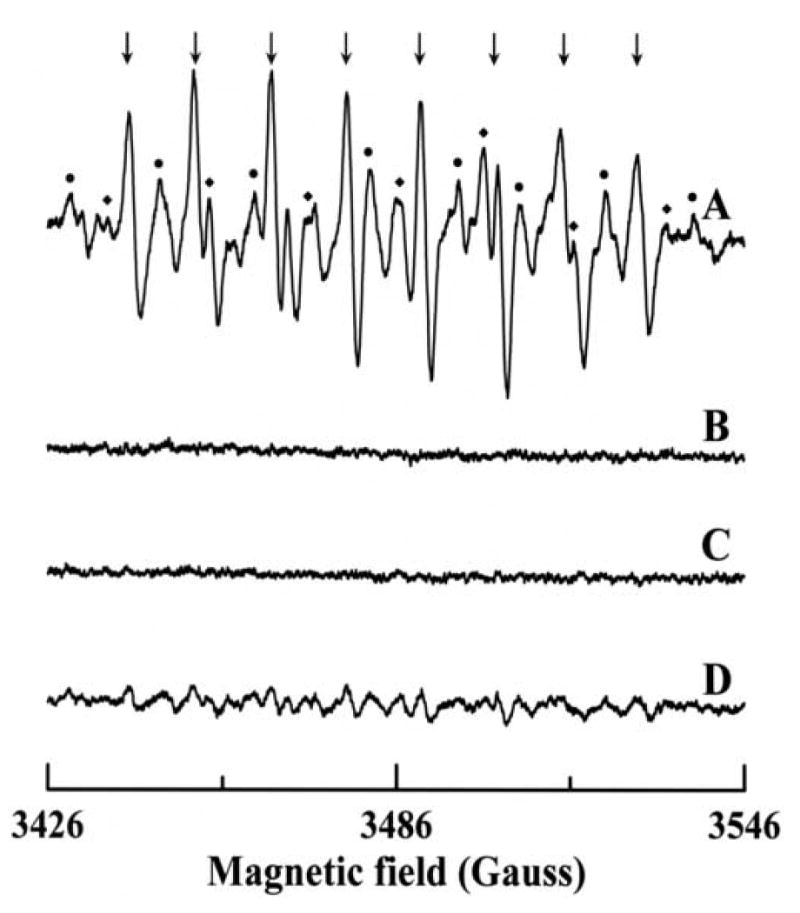
EPR spectra of DEPMPO radical adducts formed upon reaction of p-DMAC with AO in presence of DEPMPO. The spectra were recorded after incubation of 200 μM p-DMAC with 14 mU/mL AO, 400 μM DTPA and 20 mM DEPMPO for 2 minutes at room temperature in 50 mM phosphate buffer (pH 7.8). (A) Complete system; (B) same as A but in absence of AO; (C) same as A but in presence of 100 U/mL SOD1; (D) same as A but in presence of 100 μM menadione. The composite spectrum of A consists of three different radical adducts with spectral peaks labeled as follows: (↓) DEPMPO/ , (●) DEPMPO/•OH and (◆) DEPMPO/•R. Instrumental conditions are as described in the “Materials and methods”.
Detection of H2O2 formation and O2 consumption
Since oxygen is also reduced by AO to produce H2O2 in a two-electron process, we performed simultaneous electrochemical measurements of oxygen consumption and H2O2 formation by the p-DMAC/AO system. It is known that XOR, in the presence of xanthine, can also reduce molecular oxygen bivalently to produce H2O2. We compared the amount of H2O2 produced by p-DMAC/AO system with those obtained from xanthine/XO system. In the case of AO, about 55% of the total oxygen consumed underwent a two-electron reduction to produce H2O2, with the remaining 45% forming , whereas with XO about 78% of the total oxygen consumed generated H2O2 and 22% (Table 2). It is thus evident that under the present experimental conditions immediately following activation, AO generates considerably more than does XO.
Table 2.
Correlation of oxygen utilization with and H2O2 formation in AO and XO catalyzed reactions using p-DMAC and xanthine as substrates, respectively.
| Enzyme used | Rate of O2 consumption (nmol min-1 mg-1) |
Rate of H2O2 formation (nmol min-1 mg-1) |
Rate of
formation (nmol min-1 mg-1) |
Rate of substrate consumption (nmol min-1 mg-1) |
|---|---|---|---|---|
| AO from rat liver | 650 | 355 | 295 | 899 |
| XO from bovine milk | 648 | 505 | 143 | 885 |
Discussion
AO utilizes three types of reducing substrate – (a) aldehydes, (b) aromatic azaheterocyclic compounds, and (c) quaternary azahetrocyclic compounds. Among these three types of substrates, aldehydes are converted to the corresponding carboxylic acids and the other two are hydroxylated in the presence of molecular oxygen, which serves as the acceptor of the reducing equivalents thus obtained. However, AO has much wider substrate specificity than xanthine oxidase and can oxidize a wide variety of aldehyde compounds as well as certain drugs of pharmacological and toxicological importance, including the hypnotic agent zaleplon, the antiviral agent famciclovir, the antiepileptic agent zonisamide, the antitumor agents acridine carboxamide and zebularine, the antituberculous agent pyrazinamide and certain cancer-chemotherapeutic agents (e.g., methotrexate, and 6-methylthiopurine) [40,41].
AO and XOR are structurally similar but their substrate and inhibitor specificities differ. In spite of their differences in substrate specificity, the properties and immediate environment of the molybdenum center are quite similar although the properties of Fe-S and FAD centers differ significantly in these enzymes [42]. One critical difference between XOR and AO lies in the fact that the former can undergo interconversion between the dehydrogenase and oxidase forms. Unlike XOR, AO is a permanent oxidase without any activity towards NAD+ – attempts to convert the rabbit liver AO to a dehydrogenase form by treatment with dithiothreitol, for example, were unsuccessful [34]. Lack of reactivity of AO towards NAD+ has been attributed to lack of an amino acid sequence characteristic of a NAD+ binding site, which is conserved in XO [22].
Free radicals generated during the metabolism of acetaldehyde [43] or oxidation of NADH [21] by AO in the presence of catalytic iron have been suggested to initiate alcohol-induced liver injury, with XO playing a minor role. Alcohol-induced reactive oxygen species generated by AO, can induce carcinogenic mutations and DNA damage leading to breast cancer [44]. The human gene encoding AO has been linked to the familial recessive form of amyotrophic lateral sclerosis (ALS), a rare and severe motor neuron disease causing progressive muscular paralysis finally leading to death [45]. Another physiological role of this enzyme is to catalyze the oxidation of N1-methyl nicotinamide and pyridoxal [46]. It also metabolizes other endogenous substrates like retinaldehyde [47], the principal component of visual pigments and a precursor of retinoic acid, and dihydroxymandelaldehyde [48], a product of the catabolic pathway of adrenaline and noradrenaline. Therefore, AO may play an important role in vision and synaptic transmission [7].
Lipid peroxidation, glycation and amino acid oxidation are major pathways of the generation of endogenous aldehydes. Lipid peroxidation produces more than 200 different aldehydes: malondialdehyde (MDA) represents about 70% of the total aldehydes produced in the membrane lipid peroxidation, with hexanal and 4-hydroxy-2-nonenal (HNE) accounting about 15% and 5% respectively [49]. Levels of MDA in humans are 0.1-35 μM and because of its lipophilic nature the concentration of HNE can accumulate up to millimolar levels within microsomal membranes [49]. In certain disease states the levels of these aldehydes are even higher [50].
Another important physiological source of aldehydes is the metabolism of ethanol by alcohol dehydrogenase (ADH) generating acetaldehyde. While the levels of acetaldehyde in normal subjects are 0.2-5 μM, after ingestion of alcohol or in subjects with liver disease the level is increased 3-30 fold [51]. The salivary acetaldehyde levels of smoking and drinking subjects are quite high with values of 370 μM reported [52]. Substantial decrease in activity of aldehyde dehydrogenase (ALDH) during chronic alcohol consumption and the inhibition of this enzyme by smoking result a substantial increase in acetaldehyde concentration [53]. Owing to its high Km values (22 mM, in rat liver) for acetaldehyde, cytosolic ALDH plays a minor role in the metabolism of total acetaldehyde during ethanol oxidation [54]; however, mitochondrial ALDH with a low Km value is believed to be responsible for the clearance of acetaldehyde [55]. Under these circumstances AO is the major cytosolic enzyme responsible for the metabolism of endogenous aldehydes and this leads to production of reactive oxygen species (ROS) such as and hydrogen peroxide, and may explain the ROS mediated oxidative liver injury observed in chronic alcoholics.
There are some differences in tissue distribution between AO and XO. In humans and other mammals, the highest levels of AO-activities are found in liver whereas other organs such as lung, kidney, brain and small intestine contain less than 50% of the hepatic enzyme activity. On the other hand, lactating mammary gland and proximal intestine contain higher XO-activity than liver in most species [9,40]. Activity of AO in human liver was found to be 22.4 mU/mg [56], about 23 fold higher than that of XO (0.9 mU/mg) [27].
The EPR spin trapping studies reported here definitively demonstrate the production of by AO in the presence of the substrate, p-DMAC and oxygen. Prominent adducts were seen with the spin traps DMPO or DEPMPO. The weak signals corresponding to DMPO-OH (Fig. 5A) may result from low level •OH formation or the spontaneous decomposition of DMPO-OOH adduct. In addition, this •OH reacts with methanol (used for dissolving the substrate) to form carbon centered radicals leading to the formation of DMPO-R adducts (Fig. 5A). Signals were quenched by SOD1 or with the specific inhibitor, menadione. However, in the presence of menadione very weak signals of DMPO-OH and DMPO-R were observed (Fig. 5D) mainly due to the incomplete inhibition of AO by menadione as evident from the non-observance of EPR signals when the same experiment was performed in the presence of SOD1 (data not shown). The reduction of cytochrome c during turnover further demonstrate generation, and this is inhibited by SOD1 which dismutes to H2O2 and O2 at a rate much faster than the rate which reacts with cytochrome c. All the produced in the cytochrome c assay was eventually scavenged by cytochrome c as evident from the facts that (a) rates of production was directly proportional to the concentration of enzyme and (b) increasing the concentration of cytochrome c had no effect on the production of (data not shown).
The formation of and hydrogen peroxide by xanthine/XO was found to be about 22% and 78%, respectively indicating that the most of the electrons are being utilized for a two-electron reduction of O2. On the other hand, the p-DMAC/AO system generates about 45% and 55% hydrogen peroxide. In addition, the initial rate of generation from AO was about two fold higher than that from XO (Table 2). Thus immediately following activation, AO produced significantly more than XO. In terms of kinetics, the xanthine/XO system produced at approximately a steady-state level (Fig. 4) during the first few minutes, whereas the p-DMAC/AO system generated a burst of (Fig. 3) that decreased after 2-3 minutes. This burst kinetics was found to be mainly due to substrate consumption, as subsequent substrate addition restarted the reaction. Addition of higher substrate levels at the start of the reaction, however, caused partial substrate-mediated inhibition of AO with lower initial rate. The decrease in EPR signal intensity corresponding to DMPO-OOH adduct with time is due to the short half-life (∼45 s) of the DMPO-OOH adduct and the decreased rate of formation after the first couple of minutes is due to substrate consumption by AO as noted above.
These studies demonstrate that the metabolism of aldehydes by AO in presence of oxygen produces significant amounts of and hydrogen peroxide, which may well play an important role in the oxygen free radical injury triggered by ischemia-reperfusion, inflammation and various inflammatory diseases. Because of its wider substrate specificity (including a large variety of aldehydes, azaheterocyclic compounds and certain important drugs) and greater level of activity as cited above, this enzyme may be an important basal source of ROS under normal physiological conditions. This basal level of ROS generation could be greatly enhanced in disease settings where cellular aldehyde levels are increased.
Acknowledgments
This work was supported by National Institutes of Health grants HL63744, HL65608, and HL38324 (to JLZ) and GM075036 (to RH). We thank Dr Xiaoping Liu for his help in the polarographic measurements of oxygen consumption and hydrogen peroxide formation.
Footnotes
Abbreviations used: ADH, alcohol dehydrogenase; ALDH, aldehyde dehydrogenase; AO, aldehyde oxidase; DEPMPO, 5-(diethoxyphosphoryl)-5-methyl-1-pyrroline-N-oxide; DMPO, 5,5-dimethyl-1-pyrroline-N-oxide; DTPA, diethylenetriaminepentaacetic acid;. EDTA, ethylenediaminetetraacetic acid; EPR, electron paramagnetic resonance; FAD, flavine adenine dinucleotide; HNE, 4-hydroxy-2-nonenal; MDA, malondialdehyde; PAGE, polyacrylamide gel electrophoresis; p-DMAC, 4-(Dimethylamino)cinnamaldehyde; PMSF, phenylmethanesulfonyl fluoride; SDS, sodium dodecyl sulfate; SOD1, copper-zinc superoxide dismutase; TEMPO, 2,2,6,6-Tetramethylpiperidine 1-oxyl; XDH, xanthine dehydrogenase; XO, xanthine oxidase; XOR, xanthine oxidoreductase.
Publisher's Disclaimer: This is a PDF file of an unedited manuscript that has been accepted for publication. As a service to our customers we are providing this early version of the manuscript. The manuscript will undergo copyediting, typesetting, and review of the resulting proof before it is published in its final citable form. Please note that during the production process errors may be discovered which could affect the content, and all legal disclaimers that apply to the journal pertain.
References
- 1.Nishino T, Okamoto K, Kawaguchi Y, Hori H, Matsumura T, Eger BT, Pai EF, Nishino T. J Biol Chem. 2005;280:24888–24894. doi: 10.1074/jbc.M501830200. [DOI] [PubMed] [Google Scholar]
- 2.Sato A, Nishino T, Noda K, Amaya Y, Nishino T. J Biol Chem. 1995;270:2818–2826. doi: 10.1074/jbc.270.6.2818. [DOI] [PubMed] [Google Scholar]
- 3.Hille R. Chem Rev. 1996;96:2757–2816. doi: 10.1021/cr950061t. [DOI] [PubMed] [Google Scholar]
- 4.Hille R. Arch Biochem Biophys. 2005;433:107–116. doi: 10.1016/j.abb.2004.08.012. [DOI] [PubMed] [Google Scholar]
- 5.Ichida K, Amaya Y, Noda K, Minoshima S, Hosoya T, Sakai O, Shimizu N, Nishino T. Gene. 1993;133:279–284. doi: 10.1016/0378-1119(93)90652-j. [DOI] [PubMed] [Google Scholar]
- 6.Xu P, Huecksteadt TP, Harrison R, Hoidal JR. Biochem Biophys Res Commun. 1994;199:998–1004. doi: 10.1006/bbrc.1994.1328. [DOI] [PubMed] [Google Scholar]
- 7.Terao M, Kurosaki M, Demontis S, Zanotta S, Garattini E. Biochem J. 1998;332(Pt 2):383–393. doi: 10.1042/bj3320383. [DOI] [PMC free article] [PubMed] [Google Scholar]
- 8.Terao M, Kurosaki M, Saltini G, Demontis S, Marini M, Salmona M, Garattini E. J Biol Chem. 2000;275:30690–30700. doi: 10.1074/jbc.M005355200. [DOI] [PubMed] [Google Scholar]
- 9.Beedham C. Prog Med Chem. 1987;24:85–127. doi: 10.1016/s0079-6468(08)70420-x. [DOI] [PubMed] [Google Scholar]
- 10.Johns DG. J Clin Invest. 1967;46:1492–1505. doi: 10.1172/JCI105641. [DOI] [PMC free article] [PubMed] [Google Scholar]
- 11.Krenitsky TA, Neil SM, Elion GB, Hitchings GH. Arch Biochem Biophys. 1972;150:585–599. doi: 10.1016/0003-9861(72)90078-1. [DOI] [PubMed] [Google Scholar]
- 12.Moriwaki Y, Yamamoto T, Higashino K. Histol Histopathol. 1997;12:513–524. [PubMed] [Google Scholar]
- 13.Beedham C, Critchley DJ, Rance DJ. Arch Biochem Biophys. 1995;319:481–490. doi: 10.1006/abbi.1995.1320. [DOI] [PubMed] [Google Scholar]
- 14.Hall WW, Krenitsky TA. Arch Biochem Biophys. 1986;251:36–46. doi: 10.1016/0003-9861(86)90048-2. [DOI] [PubMed] [Google Scholar]
- 15.Stubley C, Stell JGP, Mathieson DW. Xenobiotica. 1979;9:475–484. doi: 10.3109/00498257909087261. [DOI] [PubMed] [Google Scholar]
- 16.Ueda O, Sugihara K, Ohta S, Kitamura S. Drug Metab Dispos. 2005;33:1312–1318. doi: 10.1124/dmd.105.005306. [DOI] [PubMed] [Google Scholar]
- 17.Sugihara K, Tatsumi K. Arch Biochem Biophys. 1986;247:289–293. doi: 10.1016/0003-9861(86)90586-2. [DOI] [PubMed] [Google Scholar]
- 18.McCord JM. New Engl J Med. 1985;312:159–163. doi: 10.1056/NEJM198501173120305. [DOI] [PubMed] [Google Scholar]
- 19.Berry CE, Hare JM. J Physiol. 2004;555:589–606. doi: 10.1113/jphysiol.2003.055913. [DOI] [PMC free article] [PubMed] [Google Scholar]
- 20.Badwey JA, Robinson JM, Karnovsky MJ, Karnovsky ML. J Biol Chem. 1981;256:3479–3486. [PubMed] [Google Scholar]
- 21.Mira L, Maia L, Barreira L, Manso CF. Arch Biochem Biophys. 1995;318:53–58. doi: 10.1006/abbi.1995.1203. [DOI] [PubMed] [Google Scholar]
- 22.Calzi ML, Raviolo C, Ghibaudi E, de Gioia L, Salmona M, Cazzaniga G, Kurosaki M, Terao M, Garattini E. J Biol Chem. 1995;270:31037–31045. doi: 10.1074/jbc.270.52.31037. [DOI] [PubMed] [Google Scholar]
- 23.Maia L, Mira L. Arch Biochem Biophys. 2002;400:48–53. doi: 10.1006/abbi.2002.2781. [DOI] [PubMed] [Google Scholar]
- 24.Rajagopalan KV, Fridovich I, Handler P. J Biol Chem. 1962;237:922–928. [PubMed] [Google Scholar]
- 25.Stell JGP, Warne AJ, Lee-Woolley C. J Chromatogr. 1989;475:363–372. doi: 10.1016/s0021-9673(01)89690-4. [DOI] [PubMed] [Google Scholar]
- 26.Kurth J, Kubiciel A. Biomed Biochim Acta. 1984;43:1223–1226. [PubMed] [Google Scholar]
- 27.Krenitsky TA, Spector T, Hall WW. Arch Biochem Biophys. 1986;247:108–119. doi: 10.1016/0003-9861(86)90539-4. [DOI] [PubMed] [Google Scholar]
- 28.Bradford MM. Anal Biochem. 1976;72:248–254. doi: 10.1016/0003-2697(76)90527-3. [DOI] [PubMed] [Google Scholar]
- 29.Laemmli UK. Nature. 1970;227:680–685. doi: 10.1038/227680a0. [DOI] [PubMed] [Google Scholar]
- 30.Massey V. Biochim Biophys Acta. 1959;34:255–256. doi: 10.1016/0006-3002(59)90259-8. [DOI] [PubMed] [Google Scholar]
- 31.Sankarapandi S, Zweier JL. J Biol Chem. 1999;274:1226–1232. doi: 10.1074/jbc.274.3.1226. [DOI] [PubMed] [Google Scholar]
- 32.Zweier JL. J Biol Chem. 1988;263:1353–1357. [PubMed] [Google Scholar]
- 33.Liu X, Zweier JL. Free Radic Biol Med. 2001;31:894–901. doi: 10.1016/s0891-5849(01)00665-7. [DOI] [PubMed] [Google Scholar]
- 34.Turner NA, Doyle WA, Ventom AM, Bray RC. Eur J Biochem. 1995;232:646–657. [PubMed] [Google Scholar]
- 35.Finkelstein E, Rosen GM, Rauckman EJ, Paxton J. Mol Pharmacol. 1979;16:676–685. [PubMed] [Google Scholar]
- 36.Fréjaville C, Karoui H, Tuccio B, Le Moigne F, Culcasi M, Pietri S, Lauricella R, Tordo P. J Med Chem. 1995;38:258–265. doi: 10.1021/jm00002a007. [DOI] [PubMed] [Google Scholar]
- 37.Roubaud V, Sankarapandi S, Kuppusamy P, Tordo P, Zweier JL. Anal Biochem. 1998;257:210–217. doi: 10.1006/abio.1997.2542. [DOI] [PubMed] [Google Scholar]
- 38.Tuccio B, Lauricella R, Fréjaville C, Bouteiller J, Tordo P. J Chem Soc, Perkin Trans. 1995;2:295–298. [Google Scholar]
- 39.Villamena FA, Zweier JL. Antioxid Redox Signal. 2004;6:619–629. doi: 10.1089/152308604773934387. [DOI] [PubMed] [Google Scholar]
- 40.Beedham C. In: Enzyme Systems that Metabolise Drugs and Other Xenobiotics. Ioannides C, editor. John Wiley & Sons Ltd.; UK: 2002. pp. 147–187. [Google Scholar]
- 41.Kitamura S, Sugihara K, Ohta S. Drug Metab Pharmacokinet. 2006;21:83–98. doi: 10.2133/dmpk.21.83. [DOI] [PubMed] [Google Scholar]
- 42.Barber MJ, Coughlan MP, Rajagopalan KV, Siegel LM. Biochemistry. 1982;21:3561–3568. doi: 10.1021/bi00258a006. [DOI] [PubMed] [Google Scholar]
- 43.Shaw S, Jayatilleke E. Life Sci. 1992;50:2045–2052. doi: 10.1016/0024-3205(92)90570-f. [DOI] [PubMed] [Google Scholar]
- 44.Wright RM, McManaman JL, Repine JE. Free Radic Biol Med. 1999;26:348–354. doi: 10.1016/s0891-5849(98)00204-4. [DOI] [PubMed] [Google Scholar]
- 45.Berger R, Mezey E, Clancy KP, Harta G, Wright RM, Repine JE, Brown RH, Brownstein M, Patterson D. Somat Cell Mol Genet. 1995;21:121–131. doi: 10.1007/BF02255787. [DOI] [PubMed] [Google Scholar]
- 46.Stanulovic M, Chaykin S. Arch Biochem Biophys. 1971;145:27–34. doi: 10.1016/0003-9861(71)90005-1. [DOI] [PubMed] [Google Scholar]
- 47.Tomita S, Tsujita M, Ichikawa Y. FEBS Lett. 1993;336:272–274. doi: 10.1016/0014-5793(93)80818-f. [DOI] [PubMed] [Google Scholar]
- 48.McGeer PL, Eccles JC, McGeer EG. Molecular Neurobiology of the Mammalian Brain. Plenum Press; New York: 1978. [Google Scholar]
- 49.Esterbauer H, Schaur RJ, Zollner H. Free Radic Biol Med. 1991;11:81–128. doi: 10.1016/0891-5849(91)90192-6. [DOI] [PubMed] [Google Scholar]
- 50.Aznar J, Santos MT, Valles J, Sala J. J Clin Pathol. 1983;36:712–715. doi: 10.1136/jcp.36.6.712. [DOI] [PMC free article] [PubMed] [Google Scholar]
- 51.Ando H, Abe H, Hisanou R. Clin Cardiol. 1993;16:443–446. doi: 10.1002/clc.4960160514. [DOI] [PubMed] [Google Scholar]
- 52.Salaspuro V, Salaspuro M. Int J Cancer. 2004;111:480–483. doi: 10.1002/ijc.20293. [DOI] [PubMed] [Google Scholar]
- 53.Nuutinen H, Lindros KO, Salaspuro M. Alcohol Clin Exp Res. 1983;7:163–168. doi: 10.1111/j.1530-0277.1983.tb05432.x. [DOI] [PubMed] [Google Scholar]
- 54.Eriksson CJP, Marselos M, Koivula T. Biochem J. 1975;152:709–712. doi: 10.1042/bj1520709. [DOI] [PMC free article] [PubMed] [Google Scholar]
- 55.Klyosov AA, Rashkovetsky LG, Tahir MK, Keung WM. Biochemistry. 1996;35:4445–4456. doi: 10.1021/bi9521093. [DOI] [PubMed] [Google Scholar]
- 56.Rodrigues AD. Biochem Pharmacol. 1994;48:197–200. doi: 10.1016/0006-2952(94)90240-2. [DOI] [PubMed] [Google Scholar]


