

Abstract
Live-cell assays to measure cellular function performed within 3D cultures have the potential to elucidate the underlying processes behind disease progression and tissue formation. Cells cultured in 3D interact and remodel their microenvironment and can develop into complex structures. We have developed a transcription factor (TF) activity array that uses bioluminescence imaging (BLI) of lentiviral delivered luminescent reporter constructs that allows for the non-invasive imaging of TF activity in both 2D and 3D culture. Imaging can be applied repeatedly throughout culture to capture dynamic TF activity, though appropriate normalization is necessary. We investigated in-well normalization using Gaussia or Renilla luciferase, and external well normalization using firefly luciferase. Gaussia and Renilla luciferase were each unable to provide consistent normalization for long-term measurement of TF activity. However, external well normalization provided low variability and accounted for changes in cellular dynamics. Using external normalization, dynamic TF activities were quantified for five TFs. The array captured expected changes in TF activity to stimuli, however the array also provided dynamic profiles within 2D and 3D that have not been previously characterized. The development of the technology to dynamically track TF activity within cells cultured in both 2D and 3D can provide greater understanding of complex cellular processes.
Keywords: cellular array, transcription factor activity, bioluminescence imaging, 3D culture
Introduction
In vitro cell culture within biomaterials is an emerging technology to model normal biological processes and disease progression. Cells growing in 3D within hydrogels receive signals through multiple mechanisms (e.g., the extracellular matrix, cell–cell interactions, and growth factors or cytokines) thus potentially influencing either normal or abnormal differentiation and offering a model that produces phenotypes more representative of in vivo phenotypes than cells cultured in 2D (Bissell and Radisky, 2001). The microenvironment that cells are cultured in has a direct impact on cellular processes (Cukierman et al., 2001). For example, mammary epithelial cells cultured in 3D gels are able to form spherical structures with hollow lumens and are able to produce and secrete milk proteins, whereas cells cultured in 2D on tissue culture plastic lose their ability to form more complex structures and to synthesize most milk proteins (Li et al., 1987). In addition, drug responsiveness can differ within cells cultured in 2D and 3D (Cukierman et al., 2002). The ability to study cells growing in 3D cultures has the potential to elucidate some of the fundamental differences between normal and diseased cells throughout the organization of cells into complex structures.
Cells grown in 3D can more effectively recapitulate in vivo phenotypes, yet 3D culture has not become the standard approach in part due to increasing difficulty in the cellular and molecular analyses. Cell morphology and organization into structures can be observed with standard light microscopy. Confocal microscopy, following fluorescence staining, is often employed to enhance image clarity and provide 3D reconstructions. However, imaging approaches are typically supplemented with molecular analyses to facilitate the identification of mechanisms controlling the phenotype. Conventional molecular biology techniques, such as qPCR, Western blots, proteomics, and microarrays have been applied to 3D culture, yet can be challenging. These techniques rely on recovering the cells from the matrix, which can be labor intensive and thus impact throughput. Additionally, the cells are recovered through enzymatic digestion of the matrix, which may impact the recovery of protein and mRNA. The utility of biomaterials for 3D culture could be enhanced with the development of techniques to more easily provide molecular level information about cellular processes.
An emerging technique to report on the cellular processes employs gene delivery to evaluate the activity of transcription factors (TF) (Bellis et al., 2011; King et al., 2007; MacQuarrie et al., 2011; Pannier et al., 2007; Yang et al., 2009). TFs are the downstream targets of signaling pathways, and measurement of TF activity indicates activity within the upstream signaling pathways. Notably, the use of the signal transduction reporter constructs measures activity, which is distinct from more traditional techniques (PCR, Western, protein and DNA microarrays) that measure mRNA or protein abundance. TF activity can be measured by delivering genetic constructs containing a TF-responsive binding element that modifies the expression of a reporter protein, such as firefly luciferase (ffLuc). Luciferase production thus correlates with TF activity at the promoter region. The reporter protein luciferase can be quantified readily through BLI applied to living cells, with comparable results to more common lysed cell assays (Bellis et al., 2011; Pannier et al., 2007; Weiss et al., 2011). Imaging systems are highly sensitive, and the enzymatic activity of luciferase enables levels to be quantified over multiple orders of magnitude. With BLI, the technique is applied to living cells without further processing, which avoids the labor-intensive steps of cell retrieval and lysis and preservers the integrity of the intracellular network.
In this report, we investigate the use of lentiviral vectors in a TF activity array to quantify long-term dynamic changes in signaling pathway activity for cells cultured in 3D. Since 2D cellular analysis is considered to be a standard technique for cellular analysis, and is a simpler technique for other applications (i.e., therapeutic compound screening), we have also included a 2D platform to use as a basis for comparison. We have previously reported on the use of nonviral delivery of the signal transduction reporter constructs to cells cultured in 2D and 3D (Bellis et al., 2011; Weiss et al., 2011), which provides transient expression and thus only short-term reporting on TF activity. Herein, viral vectors were employed that lead to integration of the reporter construct and enable the long-term reporting of TF activity. The long-term quantitative measurement of TF activity requires normalization to account for changes in cellular dynamics, which we are defining to include changes in factors such as cell growth, basal promoter activity, and translation and stability of luciferase. Normalization was evaluated having independent control wells within the array, as well as an additional internal, in-well, reporter construct. For the in-well control, two luminescent reporters, Gaussia (GLuc) and Renilla (RLuc) luciferase, were evaluated. GLuc and RLuc utilize an alternative enzymatic substrate from ffLuc and therefore can be assayed separately. Separate wells containing ffLuc were also characterized as a potential method of normalization of cellular dynamics. In addition to validating the luciferase measurements and the normalization procedure, the TF activity array is applied to the culture of breast cancer cells and stimulation by phorbol-12-myristate-13-acetate (PMA). Taken together, BLI for TF activity can provide an enabling technology to analyze cellular responses in 3D models of normal and disease processes.
Materials and Methods
Cell Lines and Maintenance
Studies were performed with MCF7 cells maintained at 37°C in a humidified, 5% CO2 atmosphere. Cells were cultured in Dulbecco’s Modified Eagle Medium (DMEM) with 10% FBS, 1% penicillin/streptomycin, and 20 mM Hepes buffer. Cells were cultured for three days in phenol free DMEM and dextran-coated charcoal-stripped FBS for PMA induction studies.
Lentiviral Constructs
To create the bioluminescent normalization constructs, the GLuc gene from pCMV-GLuc (New England Biolabs, Ipswich, MA) and the RLuc gene from pTA-RLuc (Ariazi et al., 2007) were first transferred into the backbone derived from Panomics Luciferase Reporter vectors using NheI and XbaI restriction enzymes. The GLuc, RLuc and ffLuc control vector, were then transferred in to a HIV-1 backbone vector (VSV-G). Using techniques described previously (Jiang et al., 1992), the lentivirus for each TF reporter was produced by co-transfecting HEK-293T cells with the virus packaging plasmids (pMDL-GagPol, pRSV-Rev, and pIVSVSV-G) (Ataullakhanov et al., 1979) with the transfer vectors. To quantify the virus production the number of physical particles (PP) for each virus batch was determined by using a HIV-1 p24 Antigen ELISA kit (ZeptoMetrix, Buffalo, NY). Lentiviral reporter constructs were also made from Panomics constructs that contained the TF activity reporters named AP1, NFκB, p53, Smad 3/4, and SP1 (Supplementary Table I).
Transduction of Cells With Reporter Genes
Cells were transduced with the reporter vectors using spinoculation procedures as described previously (O’Doherty et al., 2000). Infections were performed with a virus concentration of 10,000 PP/cell and by centrifuging at 800g at 32°C for 45 min, the effluent was then removed and the cells were resuspended in fresh media and transferred to 24-well plates cultured normally. TA–RLuc/TA–ffLuc and TA–GLuc/TA–ffLuc stable cell lines were created by sequential transduction of RLuc or GLuc followed by TA–ffLuc. Cells were transduced with the TF activity reporter constructs using the same infection methods and were allowed to culture for 3 days before use in the array.
Array Formation and Dynamic TF Activity Monitoring
Stably infected cells were split, counted and either encapsulated in basement membrane extract (BME; Trevigen, Gathersburg, MD) or seeded directly into wells of a 384-well plate. Cells were encapsulated in BME by mixing cold BME solution with the cell solution to reach a final concentration of 12 mg/mL BME, 10 μL of the cell/ BME solution was then added to each well of a 384-well plate and allowed to incubate for 37°C for 45 min before an additional 40 μL of media was added to each well. For analysis in 2D, cells were seeded in parallel directly into the 384 wells plate. Cells were seeded at varying cell densities from 1,000 to 7,500 cells/well in both 2D and 3D.
The dynamic imaging and normalization of TF activity was investigated by monitoring the changes in TF activity of arrays formed in both 2D and 3D when exposed to PMA. The arrays were formed by seeding 5,000 cells/well of MCF7 cells stably infected with reporters for AP1, NFκB, p53, Smad 3/4, SP1, and the TA–ffLuc control construct and were imaged for ffLuc every 24 h for 5 days with the first time point 24 h after cells seeding. Cells were treated with 20 ng/mL PMA after the initial time point was collected. Each experiment was done in duplicate with at least four wells per condition.
Quantifying Firefly, Gaussia and Renilla Luciferase
Bioluminescence imaging of firefly and Renilla luciferase was performed using the IVIS imaging system (Caliper, Hopkinton, MA). To measure ffLuc, d-luciferin was added to each well of the plate to reach a final concentration of 1 mM. Images of the plate were captured with a 2 min exposure time every 5 min for an hour to determine the best time to capture ffLuc photon flux. In subsequent experiments, images were captured 25 min after d-luc addition with an exposure time of 2 min. Eighteen hours before the first time point cells were dosed with 0.1 mM d-luciferin in order to reduce the abundance of accumulated luciferase. After each time point of any experiment with dynamic imaging, 90% of the media in each well was exchanged with fresh media. The total incubation time needed for the ViviRen (Promega, Madison, WI) RLuc substrate was determined by adding Viviren to each well of the plate to reach a final concentration of 20 μM. The optimal time to measure RLuc photon flux is 2 min after substrate addition. Cells were dosed with 2 μM d-luciferin 18 h prior to the first time point. Viviren was added to each well of the plate immediately following ffLuc imaging and images were captured using a built in 500 nm filter on the IVIS system in order to separate the RLuc light form the ffLuc. The filter was able to reduce the light from the ffLuc/d-luciferin reaction by 98%. The reaction between GLuc and its substrate decays quickly and therefore a plate reader with an injector port was used for the measurement. Prior to ffLuc imaging, 10 μL samples of each well within the array was collected and stored at 4°C for at least 24 h. GLuc abundance in the media was assayed using the BioLux® Gaussia Luciferase assay Kit (New England Biolabs, Ipswich, MA), following manufacture instructions.
Doubling Time Determination
Stably infected TA–ffLuc cells were seeded at varying densities from 1,000 to 7,500 cells/well within a 384-well plate (n = 4). The plates were imaged daily for 5 days following the above procedures. The raw firefly flux values were plotted versus time and the growth constant for the exponential growth phase was obtained by regression. The doubling time was calculated from the growth constant, by averaging over the four seeding densities. The doubling time was also calculated by plating 8,000 cells/well into 12 wells of a 96-well plate. In parallel with the time points of the bioluminescent determination of doubling time, the cell number in three wells were determined using a hemocytometer. The average counted cell number was plotted versus time and the doubling time was calculated from the curve as stated above.
Statistical Analysis
All statistical analysis were performed using the open source software R (R Developmental Core Team, 2008) as previously described (Weiss et al., 2012). Briefly, only data above background determined by a student’s t-test (α = 0.01) were employed and a multiple regression model was used on log2-transformed data. Models for each TF included dimensionality, PMA treatment and time with the corresponding linear interactions plus a square temporal term. Final models were obtained by stepwise model selection by exact AIC using the MASS package (Venables and Ripley, 2002). Multiple comparisons were corrected by FDR (α = 0.05).
Results
Imaging Firefly Luciferase
BLI to quantify ffLuc, the functional readout of the TF activity array, was evaluated to determine imaging parameters, sensitivity, and consistency. First, the stability of ffLuc was determined to identify the timing at which light emission should be measured following substrate addition. Cells stably infected with TA–ffLuc construct (which lacks any TF specific binding element) were plated in a 384-well plate and the cells cultured for 24 h. ffLuc activity was measured every 5 min for 1 h (Fig. 1a). Light emission stabilized approximately 15 min after substrate addition and remained stable for the rest of the imaging period. These results indicate that ffLuc can be imaged reliably between 15 and 50 min after substrate addition, and that the time required for addition of substrate to each well of the array should not significantly impact the signal within this time. This window of imaging time was also confirmed with both lower and higher levels of ffLuc expression (data not show). A 30-min substrate incubation time prior to imaging was used for all subsequent ffLuc imaging.
Figure 1.

Imaging of ffLuc using bioluminescence imaging. a: Cell lines stably expressing ffLuc were seeded at (●) 7,500, (∎) 5,000, (▴) 2,500, (◆) 1,000, and (▾) 0 cells per well in both 2D (solid lines) and 3D (dashed lines). The cells were imaged 24 h after seeding and the average photon flux (± SD) was monitored every 5 min for approximately 1 h after d-luciferin addition. b: Cells seeded at varying densities were imaged 24 h after seeding. The light emission had a linear relationship with cell number in both 2D (● solid lines) and 3D (◻ dashed lines), with a R2 of 0.94 and 0.98, respectively.
Next, the sensitivity of BLI to quantify varying numbers of ffLuc producing cells was investigated. Cells stably expressing TA–ffLuc were plated in varying concentration (0–7,500 cells/well) and cultured for 24 h. A linear relationship between the number of cells plated per well and the ffLuc photon flux was observed for cell cultured in both 2D and 3D, with R2 values of 0.94 and 0.98, respectively (Fig. 1b). The light emission from cells cultured in 2D and 3D were comparable suggesting that mass transport of the substrate is not limiting within the 3D hydrogel. We also investigated the ability of TA–ffLuc measurements to capture changes in cell number over time in culture. TA–ffLuc stable cells were imaged daily for 5 days and the doubling time calculated from the exponential curve of the ffLuc data. The TA–ffLuc approximation of doubling time was 0.82 ± 0.07 days, which is consistent with the doubling time that was calculated by manual cell counts at equivalent time points (data not shown). Therefore, ffLuc data for the TA–ffLuc construct can provide an indirect measure of cell number throughout culture.
Imaging Gaussia Luciferase
The measurement of secreted GLuc was investigated as a means to provide an in well normalization of TF activity by BLI that would not interfere with the measurement and quantification of ffLuc. GLuc activity in conditioned media was difficult to obtain using BLI due to the rapid decay of light produced by the enzyme (data not shown). A plate reader with an automated injector port was subsequently employed to determine GLuc concentration, as the injector port provided consistent timing of substrate addition and light emission.
The ability of the GLuc measurement to capture differences in cell density was determined. Cells expressing TA–GLuc were seeded at densities ranging from 0 to 7,500 cells/well. After 24 h of culture, we confirmed that GLuc abundance within a sample of conditioned media was correlated with the number of cells plated in each well (Fig. 2). The abundance of GLuc within the cultured media correlated with the number cells plated in both 2D and 3D with R2 values of 0.74 and 0.83, respectively.
Figure 2.

GLuc light emission correlates with cell number. Media samples of GLuc stable cells seeded at varying densities were taken 24 h after seeding and quantified for GLuc abundance. The abundance of GLuc within the cultured media correlated with the number cells plated in both 2D and 3D with R2 of 0.74 and 0.83, respectively.
We subsequently investigated the potential for GLuc measurement to capture changes in cell number and dynamics within a well over time. TA–ffLuc/TA–GLuc stable cells were plated at varying cell densities and cultured for 5 days. ffLuc bioluminescence was measured and GLuc media samples were taken every 24-h for cells seeded in both 2D and 3D. The ffLuc signal for both cells in 2D and 3D increased over the 5-day time course (Fig. 3a and d) indicating changes in cellular dynamics and a growth in the cell population. For GLuc to provide adequate normalization over time, the change in the measurement of GLuc (Fig. 3b and e) should mirror that of the firefly control construct (Fig. 3a and d). No correlation between GLuc and ffLuc was observed in either 2D or 3D (Fig. 3c and f), with R2 values of 0.08 and 0.14, respectively. However, a linear correlation between GLuc and ffLuc measurements was possible for short times or low cell density. GLuc may be able to capture changes in cellular dynamics in some circumstances, yet was unable to capture dynamic changes over the 5-day culture.
Figure 3.

GLuc expressing cells for the measurement and normalization of changes in cellular dynamics over a 5-day culture period. FLuc/GLuc stable cell were plated at densities from (●) 7,500, (∎) 5,000, (▴) 2,500, (◆) 1,000, and (▾) 0 cells per well and imaged daily for 5 days in both 2D (solid lines, filled points) and 3D (dashed lines, empty point). a and d: BLI of ffLuc upon the addition of d-Luciferin. b and e: Quantification of GLuc abundance in a 10 μL sample of conditioned media. c and f: the comparison of GLuc and ffLuc values for individual wells over the 5-day culture and imaging period.
Imaging Renilla Luciferase
Renilla luciferase (RLuc) provides an alternative bioluminescent normalization protein that can be employed with the analysis of TF activity. In contrast to GLuc, RLuc remains in the cell and is not secreted. The enzymatic reaction between RLuc and its substrate produces light at a different wavelength from ffLuc. Therefore, measurements of both RLuc and ffLuc can be made within the same well using filters. The RLuc signal plateaued at 3 min after substrate addition for cells cultured in 2D and remained stable for 2 min (Fig. 4a). If the Renilla substrate can be added to all wells in under 2 min, imaging of the plates can be performed using live cell imaging. However, for measurements of RLuc in 3D (Fig. 4b), a lower level in light emission is observed at all times relative to the same number of cells plated in 2D.
Figure 4.

Kinetics of imaging RLuc using BLI. Wells seeded with (●) 7,500, (∎) 5,000, (▴) 2,500, and (▾) 0 RLuc/ffLuc stably-expressing cells. Note that the total number of cells per well was constant at 7,500 cells/well. For wells with less than 7,500 RLuc/ffLuc stably-expressing cells, the balance of cells up to 7,500 cells/well were comprised of uninfected cells. Wells were imaged after the addition of the RLuc substrate, VivRen, in both 2D (a) and 3D (b).
The sensitivity of RLuc to quantify the cell number per well was investigated. Conditions with varying percentages of RLuc producing cells were plated in both 2D and 3D and imaged 24 h after seeding. The Renilla substrate produces some non-specific luminescence in the culture media, which is an additional challenge to accurate BLI measurement. Due to this non-specific luminescence, this experiment was performed by seeding a constant total number of cells to minimize variability in auto-luminescence between conditions, yet the percentage of RLuc producing cells was varied. A strong correlation was obtained between the number of RLuc producing cells and light emission for cells cultured in 2D (R2 = 0.93; Fig. 5), but this correlation was weaker in 3D (R2 = 0.55). Arrays of varying percentages of RLuc producing cells were formed and imaged over 5 days. Although the profile of the ffLuc measurement is the same for 2D and 3D (Fig. 6a and d), the same trends for RLuc were not seen for cells cultured in the two platforms (Fig. 6b and e). The difference in the ability to measure RLuc in 2D and 3D is further illustrated with comparison of the RLuc and the ffLuc dynamic measurements for the 5-day culture period (Fig. 6c and f). The correlation between the RLuc and ffLuc measurement for all times and cell concentrations cultured in 2D and 3D were R2 = 0.67 and R2 = 0.08, respectively. The abundance of RLuc within the 3D system was not accurately quantified using BLI. Taken together, RLuc was unable to measure changes in the cell number within 3D culture and therefore was not used in subsequent studies.
Figure 5.

RLuc light emission correlates with cell number. Wells within a 384-well plate were seeded with various numbers of RLuc/FLuc stably expressing cells, which were imaged 24 h after seeding to quantify the photon flux. The abundance of RLuc luminescence within each well correlated with the number cells plated in both 2D and 3D with R2 of 0.93 and 0.55, respectively.
Figure 6.

RLuc expressing cells for the measurement and normalization of changes in cellular dynamics over a 5-day culture period. FLuc/RLuc stable cell were plated at (●) 7,500, (∎) 5,000, (▴) 2,500, and (▾) 0 RLuc cells per well (with total of 7,500 cells/well) and imaged daily for 5 days in both 2D (solid lines, filled points) and 3D (dashed lines, empty point). a and d: BLI of ffLuc upon the addition of d-luciferin. b and e: BLI of RLuc upon the addition of ViviRen. c and f: the comparison of RLuc and ffLuc values for individual wells over the 5-day culture and imaging period.
Normalization of Changes in TF Activity Over Time
The ability to capture dynamic activity of TFs was subsequently investigated, with cells cultured in 2D and 3D. A library of five TF reporter constructs was used within the array to investigate the impact of PMA on cell signaling within both 2D and 3D (Supplementary Fig. 1). PMA induces several transcription factors as a result of a block in the G1 phase of cell cycle and through the activation of members of the MAPK pathway (Favata et al., 1998; Guilbaud et al., 1990; Valette et al., 1987). Since RLuc and GLuc were unable to sufficiently account for changes in cell number, normalization was based on separate wells that contained the TA–ffLuc construct. The procedure for normalizing the light emission from an individual well was: (i) values for each well were normalized by the light emission at the initial time point to adjust for any well to well variability in cell seeding, (ii) multiply by the average intensity value of each TF in each array to remove array to array variability within 2D or 3D experiments, and (iii) these values were then normalized by the average of the TA–ffLuc control wells to account for changes in cellular dynamics, which we had previously defined as changes in cell number, basal promoter activity, or protein production or stability. PMA initially induced the TA promoter (Sakaguchi et al., 1991), however, a decrease of ffLuc signal follows as the cells cycle is disturbed due to treatment. The ffLuc photon flux for the untreated condition remains relatively stable for the duration of the experiment (Fig. 7).
Figure 7.
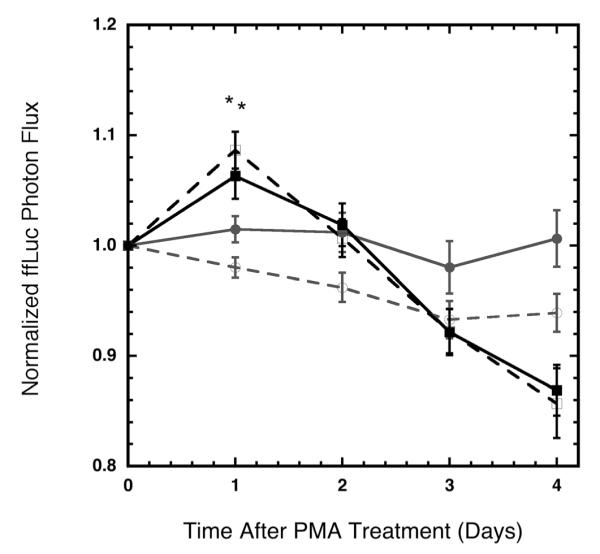
TA–ffLuc construct accounted for cellular dynamics upon treatment with PMA in both 2D and 3D. Cells stably infected with ffLuc were treated with PMA at Day 0 and imaged daily for 4 days. Cells treated with PMA (∎) showed an initial increase in normalized ffLuc photon flux as compared to untreated cells (●) for both 2D (solid lines), and 3D (dashed lines). Statistical significance of P < 0.05 between PMA and vehicle control are denoted with (*).
A multi-linear regression analysis indicates that the normalized activities of the TFs within this study are strongly influenced by the culture platform and PMA treatment (Supplemental Table II and Fig. 8). PMA stimulation produces a transient decrease in p53, and SP1 activity as well as an increase in AP1 and NFκB activity. Using multiple comparisons analysis, the fully normalized data representing the dynamic changes in TF activity for both 2D and 3D upon PMA induction indicates that all five TF had statistically significant activity in terms of treatment and time (Supplementary Table III). In addition, the culture dimensionality also provided statistically significant effect on all five TFs that were studied (Fig. 9). In addition, the dimensionality of culture had a significant effect on the cellular response to PMA treatment for the activity of p53, Smad 3/4, and SP1 (Supplementary Fig. 1). Taken together, the TF activity array reported multiple dynamic TF activity profiles and demonstrates that the dynamic activity of a TF upon drug treatment is environmentally dependant.
Figure 8.

Dynamic profiling of TF activity within MCF7 cells upon PMA treatment. Changes in temporal TF activity were quantified using the TF activity array for cells cultured on 2D culture surfaces (solid lines, filled points, a–e) and within 3D hydrogels (dashed lines, open points, f–j). The arrays were either treated with PMA (black) or with vehicle control (gray). The TF activity as quantified by the reporter constructs are normalized by control wells of constitutively active ffLuc in order to account for changes in cellular dynamics over time. The above graph shows the means ± s.e. from two independent experiments with a total n = 10 for each condition at each time point. Statistical significance of P < 0.05 between PMA and vehicle control are denoted with (*).
Figure 9.

The culture platform and treatment influences TF activity. Normalized TF activities across all time points were collapsed to identify the individual influences of treatment and culture platform on the activity of (a) AP1, (b) NFκB, (c) p53, (d) Smad 3/4 and (e) SP1. Solid lines are cells within 2D culture and dashed lines represent cells cultured within 3D culture. Statistically significance of P < 0.05 are denoted with (o) between PMA treated and vehicle control and with (*) between 2D and 3D.
Discussion
We report the development of an assay with the ability for long-term dynamic quantification of TF activity for cells in 3D culture. In order to accurately quantify TF activity, the dynamic measurements must be normalized to account for changes in cell dynamics. A second normalizing construct encoding for an alternate reporter protein is commonly used in conjunction with the TF reporter construct with non-viral transfection based studies, however the use of normalizing luminescence reporters have not been extended to account for cellular dynamics within long-term culture studies and the use of lentiviral reporter vectors.
We investigated TA–RLuc and TA–GLuc as normalizing constructs for the TF activity array. Both RLuc and GLuc require a different substrate than ffLuc for the light emitting reaction. Therefore when d-luciferin (the ffLuc substrate) is added to each well, regardless of the normalizing construct, only light from firefly luciferase is produced. GLuc seemed to be an ideal candidate for normalization measurements since GLuc abundance can easily be decoupled from the ffLuc signal by taking a small sample of media containing the secreted GLuc and assaying it separately. However, as compared to the ffLuc measurements, a greater variability in the measurement of GLuc was observed and therefore not ideal for normalization. This variability was likely due in part to the pipetting within wells at each time point. With repeated measurement during the experiment, this error may have been compounded over time and possibly increase the measurement variability. GLuc also did not capture the changes in cell dynamics throughout culture, with increasing error observed at greater extents of cell confluency. Taken together, GLuc could not provide adequate normalization for TF activity for long-term culture within the TF activity array.
RLuc could be used to normalize for cell dynamics for cells cultured in 2D, yet could not capture the cell dynamics for 3D culture. RLuc emits light at a lower wavelength than ffLuc, with light emission from RLuc and ffLuc separated using filters. The filters were able to remove 98% of ffLuc signal from RLuc measurement; however, separating ffLuc from the RLuc signal was more difficult. To account for the uneven emission overlap, we first measured ffLuc without the aid of filters, and subsequently added the RLuc substrate and imaged with a 500 nm filter. In order for this imaging schema to provide reliable results, the signal from RLuc imaging at the previous time point must dissipate prior to the next time point. This results in a minimum time between imaging of approximately 24 h, which may depend on RLuc production and consumption. Although the correlation between RLuc light emission and cell number was comparable to ffLuc within 2D, light emission within 3D could not be measured accurately, which may result from transport limitations in 3D.
The inability of RLuc and GLuc to normalize effectively led to an external well normalization using ffLuc to account for cellular dynamics. The firefly signal was more consistent and had greater sensitivity than RLuc and GLuc when correlating cell number to light output. The light output from these wells mirrored the growth of cells. To account for possible variation in the initial cell number from well to well, all values within the array are normalized first to the light emission from that well at the initial time point. To account for possible variation between array to array, we multiply by the average intensity value of each TF. Each individual well is then normalized by the average of the TA–ffLuc control wells for that time point in order to normalize for cell growth and promoter activity. Overall, the control wells of TA–ffLuc provided a sufficient method to track cell growth as well as monitor the impact of treatments on the basal activity of the TA promoter.
Using TA–ffLuc for normalization, the dynamic activity of five transcription factors (AP1, NFκB, p53, Smad 3/4, and SP1) over a 5-day period in response to PMA treatment was profiled. PMA is known to block the cell cycle within the G1 phase to induce a more differentiated phenotype and prohibit proliferation (Guilbaud et al., 1990; Valette et al., 1987). Additionally, PMA has been shown to enhance proliferation and reduce apoptosis through the activation of various members of the MAPK pathway (Favata et al., 1998). Importantly, the TA–ffLuc control wells were able to normalize for the effect of PMA on the basal TA promoter that is present on all the reporter constructs. The trends in TF activity as measured by the array are consistent with previously published data (Abdel-Mageed and Agrawal, 1998; Biggs and Kraft, 1999; Hung et al., 2006; Lindemann et al., 2003). However, unlike previous studies, the TF activity array was able to identify temporal changes in TF activity. For example, exposure of MCF7 cells to PMA for over 9 h has previously been reported to deacetylate SP1, leading to a decrease in activity (Hung et al., 2006); however, the activity of SP1 in PMA treated within 2D culture becomes comparable to untreated treated cells again after 4 days of treatment. Importantly, this study also highlights that three out of the five TFs respond differently to treatment depending on culture dimensionality. The temporal profiles of p53, Smad 3/4, and SP1 in response to PMA stimulation are statistically different in 2D and in 3D. However, the activities of AP1 and NFκB in response to treatment were unaffected by the dimensionality of culture. The results of this study emphasize that 2D culture may not fully capture the physiological responses that would be observed in more complex 3D environments and therefore highlight the utility of the TF activity array to study active cellular processes that can be correlated with the cellular phenotypes.
In conclusion, in vitro cultures of cells in 3D are being employed to model tissue formation or disease progression, and techniques are needed that can measure the dynamic changes in cell signaling during these complex processes. We report a method for the dynamic measurement of TF activity within live cells over long-term culture in 3D. This technique can be applied with many constructs as a screen to identify key TFs at various times of culture. BLI imaging of luminescent reporter constructs allowed for the non-invasive imaging of TF activity throughout culture. The TF activity array was able to quantify the activity of five TFs over a 5-day time course as the cells responded to treatment and were able to proliferate both on a 2D surface and within a 3D matrix. Cells cultured in 3D formed complex structures that were not present in 2D culture and interacted with and remodeled their hydrogel microenvironment, resulting in structures that emulate in vivo phenotypes. Our TF activity array has the potential to provide large-scale analysis of signaling activity of cells cultured within a physiological relevant context thus paving the way for more detailed study of disease progression and tissue formation.
Supplementary Material
Acknowledgments
This work was funded by the National Institutes of Health (NIH; R21CA125285, P50GM081892) and the Chicago Biomedical Consortium with support from the Searle Funds at The Chicago Community Trust.
Contract grant sponsor: National Institutes of Health (NIH)
Contract grant number: R21CA125285; P50GM081892
Contract grant sponsor: Chicago Biomedical Consortium
Footnotes
Additional supporting information may be found in the online version of this article.
References
- Abdel-Mageed AB, Agrawal KC. Activation of nuclear factor kappaB: Potential role in metallothionein-mediated mitogenic response. Cancer Res. 1998;58(11):2335–2338. [PubMed] [Google Scholar]
- Ariazi EA, Kraus RJ, Farrell ML, Jordan VC, Mertz JE. Estrogen-related receptor alpha1 transcriptional activities are regulated in part via the ErbB2/HER2 signaling pathway. Mol Cancer Res. 2007;5(1):71–85. doi: 10.1158/1541-7786.MCR-06-0227. [DOI] [PubMed] [Google Scholar]
- Ataullakhanov FI, Vitvitskii VM, Zhabotinskii AM, Pichugin AV, Kholodenko BN. Quantitative model of human erythrocyte glycolysis. Region of cell viability determined by ATP concentration. Biofizika. 1979;24(6):1048–1053. [PubMed] [Google Scholar]
- Bellis AD, Penalver-Bernabe B, Weiss MS, Yarrington ME, Barbolina MV, Pannier AK, Jeruss JS, Broadbelt LJ, Shea LD. Cellular arrays for large-scale analysis of transcription factor activity. Biotechnol Bioeng. 2011;108(2):395–403. doi: 10.1002/bit.22916. [DOI] [PMC free article] [PubMed] [Google Scholar]
- Biggs JR, Kraft AS. The role of the Smad3 protein in phorbol ester-induced promoter expression. J Biol Chem. 1999;274(52):36987–36994. doi: 10.1074/jbc.274.52.36987. [DOI] [PubMed] [Google Scholar]
- Bissell MJ, Radisky D. Putting tumours in context. Nat Rev Cancer. 2001;1(1):46–54. doi: 10.1038/35094059. [DOI] [PMC free article] [PubMed] [Google Scholar]
- Cukierman E, Pankov R, Stevens DR, Yamada KM. Taking cell-matrix adhesions to the third dimension. Science. 2001;294(5547):1708–1712. doi: 10.1126/science.1064829. [DOI] [PubMed] [Google Scholar]
- Cukierman E, Pankov R, Yamada KM. Cell interactions with three-dimensional matrices. Curr Opin Cell Biol. 2002;14(5):633–639. doi: 10.1016/s0955-0674(02)00364-2. [DOI] [PubMed] [Google Scholar]
- Favata MF, Horiuchi KY, Manos EJ, Daulerio AJ, Stradley DA, Feeser WS, Van Dyk DE, Pitts WJ, Earl RA, Hobbs F, Copeland RA, Magolda RL, Scherle PA, Trzaskos JM. Identification of a novel inhibitor of mitogen-activated protein kinase kinase. J Biol Chem. 1998;273(29):18623–18632. doi: 10.1074/jbc.273.29.18623. [DOI] [PubMed] [Google Scholar]
- Guilbaud NF, Gas N, Dupont MA, Valette A. Effects of differentiation-inducing agents on maturation of human MCF-7 breast cancer cells. J Cell Physiol. 1990;145(1):162–172. doi: 10.1002/jcp.1041450122. [DOI] [PubMed] [Google Scholar]
- Hung JJ, Wang YT, Chang WC. Sp1 deacetylation induced by phorbol ester recruits p300 to activate 12(S)-lipoxygenase gene transcription. Mol Cell Biol. 2006;26(5):1770–1785. doi: 10.1128/MCB.26.5.1770-1785.2006. [DOI] [PMC free article] [PubMed] [Google Scholar]
- Jiang SY, Wolf DM, Yingling JM, Chang C, Jordan VC. An estrogen-receptor positive Mcf-7 clone that is resistant to antiestrogens and estradiol. Mol Cell Endocrinol. 1992;90(1):77–86. doi: 10.1016/0303-7207(92)90104-e. [DOI] [PubMed] [Google Scholar]
- King KR, Wang S, Irimia D, Jayaraman A, Toner M, Yarmush ML. A high-throughput microfluidic real-time gene expression living cell array. Lab Chip. 2007;7(1):77–85. doi: 10.1039/b612516f. [DOI] [PMC free article] [PubMed] [Google Scholar]
- Li ML, Aggeler J, Farson DA, Hatier C, Hassell J, Bissell MJ. Influence of a reconstituted basement membrane and its components on casein gene expression and secretion in mouse mammary epithelial cells. Proc Natl Acad Sci USA. 1987;84(1):136–140. doi: 10.1073/pnas.84.1.136. [DOI] [PMC free article] [PubMed] [Google Scholar]
- Lindemann RK, Braig M, Hauser CA, Nordheim A, Dittmer J. Ets2 and protein kinase C epsilon are important regulators of parathyroid hormone-related protein expression in MCF-7 breast cancer cells. Biochem J. 2003;372(Pt. 3):787–797. doi: 10.1042/BJ20030046. [DOI] [PMC free article] [PubMed] [Google Scholar]
- MacQuarrie KL, Fong AP, Morse RH, Tapscott SJ. Genome-wide transcription factor binding: Beyond direct target regulation. Trends Genet. 2011;27(4):141–148. doi: 10.1016/j.tig.2011.01.001. [DOI] [PMC free article] [PubMed] [Google Scholar]
- O’Doherty U, Swiggard WJ, Malim MH. Human immunodeficiency virus type 1 spinoculation enhances infection through virus binding. J Virol. 2000;74(21):10074–10080. doi: 10.1128/jvi.74.21.10074-10080.2000. [DOI] [PMC free article] [PubMed] [Google Scholar]
- Pannier AK, Ariazi EA, Bellis AD, Bengali Z, Jordan VC, Shea LD. Bioluminescence imaging for assessment and normalization in transfected cell arrays. Biotechnol Bioeng. 2007;98(2):486–497. doi: 10.1002/bit.21477. [DOI] [PMC free article] [PubMed] [Google Scholar]
- Sakaguchi M, Zenzie-Gregory B, Groopman JE, Smale ST, Kim SY. Alternative pathway for induction of human immunodeficiency virus gene expression: Involvement of the general transcription machinery. J Virol. 1991;65(10):5448–5456. doi: 10.1128/jvi.65.10.5448-5456.1991. [DOI] [PMC free article] [PubMed] [Google Scholar]
- R Developmental Core Team . R Foundation for Statistical Computing; Vienna, Austra: 2008. R: A Language and enviroment for statistical computing. ISBN 3-900051-07-0. http://www.r-project.org. [Google Scholar]
- Valette A, Gas N, Jozan S, Roubinet F, Dupont MA, Bayard F. Influence of 12-O-tetradecanoylphorbol-13-acetate on proliferation and maturation of human breast carcinoma cells (MCF-7): Relationship to cell cycle events. Cancer Res. 1987;47(6):1615–1620. [PubMed] [Google Scholar]
- Venables WN, Ripley BD. Modern applied statistics with S. Springer; New York: 2002. [Google Scholar]
- Weiss MS, Penalver Bernabe B, Bellis AD, Broadbelt LJ, Jeruss JS, Shea LD. Dynamic, large-scale profiling of transcription factor activity from live cells in 3D culture. PLoS ONE. 2011;5(11):e14026. doi: 10.1371/journal.pone.0014026. [DOI] [PMC free article] [PubMed] [Google Scholar]
- Weiss MS, Bernabe BP, Shikanov A, Bluver DA, Mui MD, Shin S, Broadbelt LJ, Shea LD. The impact of adhesion peptides within hydrogels on the phenotype and signaling of normal and cancerous mammary epithelial cells. Biomaterials. 2012;33(13):3548–3559. doi: 10.1016/j.biomaterials.2012.01.055. [DOI] [PMC free article] [PubMed] [Google Scholar]
- Yang E, Yarmush ML, Androulakis IP. Transcription factor network reconstruction using the living cell array. J Theor Biol. 2009;256(3):393–407. doi: 10.1016/j.jtbi.2008.09.040. [DOI] [PMC free article] [PubMed] [Google Scholar]
Associated Data
This section collects any data citations, data availability statements, or supplementary materials included in this article.