

Abstract
Purpose.
Chronic inflammation and dysregulation of circadian rhythmicity are involved in the pathogenesis of diabetic retinopathy. MicroRNAs (miRNAs) can regulate inflammation and circadian clock machinery. We tested the hypothesis that altered daily rhythm of miR-146a expression in diabetes contributes to retinal inflammation.
Methods.
Nondiabetic and STZ-induced diabetic rats kept in 12/12 light/dark cycle were killed every 2 hours over a 72-hour period. Human retinal endothelial cells (HRECs) were synchronized with dexamethasone. Expression of miR-146a, IL-1 receptor-associated kinase 1 (IRAK1), IL-1β, VEGF and ICAM-1, as well as clock genes was examined by real-time PCR and Western blot. To modulate expression levels of miR-146a, mimics and inhibitors were used.
Results.
Diabetes inhibited amplitude of negative arm (per1) and enhanced amplitude of the positive arm (bmal1) of clock machinery in retina. In addition to clock genes, miR-146a and its target gene IRAK1 also exhibited daily oscillations in antiphase; however, these patterns were lost in diabetic retina. This loss of rhythmic pattern was associated with an increase in ICAM-1, IL-β, and VEGF expression. Human retinal endothelial cells had robust miR-146a expression that followed circadian oscillation pattern; however, HRECs isolated from diabetic donors had reduced miR-146a amplitude but increased amplitude of IRAK1 and ICAM-1. In HRECs, miR-146a mimic or inhibitor caused 1.6- and 1.7-fold decrease or 1.5- and 1.6-fold increase, respectively, in mRNA and protein expression levels of ICAM-1 after 48 hours.
Conclusions.
Diabetes-induced dysregulation of daily rhythms of miR-146a and inflammatory pathways under miR-146a control have potential implications for the development of diabetic retinopathy.
Keywords: diabetic retinopathy, miRNA, circadian rhythm, intercellular adhesion molecule 1, inflammatory response, endothelial cells
Diabetes-induced dysregulation of daily rhythms of miR-146a and inflammatory pathways under miR-146a control have potential implications for the development of diabetic retinopathy.
Introduction
Circadian rhythms (24-hour oscillations) synchronize various physiological and behavioral rhythms with the environmental light–dark cycle. Nearly every mammalian cell investigated to date has a self-sustained circadian clock that links endogenous rhythms with changes in cellular environment. Circadian rhythmicity is involved in both transcriptional and translational pathways with up to 10% of gene transcripts and even greater fraction of proteins exhibiting a circadian rhythm.1–5
The involvement of circadian rhythmicity at the posttranscriptional level suggests a role for miRNA in this process. The miRNAs are small noncoding RNAs that can regulate gene expression by binding to the 3′ untranslated region (3′UTR) of mRNA, leading to either translational repression or mRNA cleavage by recognizing and binding the complementary sequences in 3′UTR of mRNA.6 Up to 30% of mammalian gene transcripts are believed to be regulated by miRNAs.7,8 A single miRNA can regulate expression of a number of different target genes because of the presence of the target sequence for each miRNA on multiple genes.9,10 Regulation of gene expression by miRNA plays a vital role in regulating various aspects of circadian clock function. The role of miRNA in circadian control of gene expression is to provide a “fine-tuning” mechanism, which contributes to coordinating posttranscriptional regulation.11–13
Expression of miRNA results in posttranscriptional feedback control mechanisms that are involved in modulating lipid and carbohydrate metabolism as well as inflammatory pathways.14–16 A growing body of evidence suggests that miRNAs contribute to insulin secretion, pancreatic islet development, beta cell differentiation, and regulation of glucose and lipid metabolism17–20; therefore, playing key roles in the pathogenesis of diabetes and its complications.21,22 Recent data demonstrated that downregulation of miR-146a contributes to the development of diabetic retinopathy (DR) by activation of nuclear factor (NF)-κB mediated inflammatory pathways.23 However, the role of circadian regulation of miRNAs and their potential target genes in diabetic retina has not been studied.
The miR-146a has been demonstrated to play a key role in innate immunity, inflammatory responses, viral infections, and in some malignancies.24–26 Nuclear factor–κB transactivates miR-146 but miR-146 also inhibits NF-κB activation by targeting IRAK1 and TNF receptor-associated factor 6 (TRAF6).27 Activation of IRAK1, a key mediator of Toll-like receptor (TLR) and IL-1 receptor (IL-1R) pathways, results in inflammatory target gene expression.28 Nuclear factor–κB is a key regulator of inflammatory responses known to be activated in the diabetic retina.29 Intercellular adhesion molecule-1 (ICAM-1) is one of the genes controlled by the NF-κB pathway and is increased in the diabetic retina and contributes to the pathogenesis of DR.30–32
In this study, we examined the role of circadian regulation of miR-146a and the inflammatory pathways controlled by miR-146a using animal and cell culture DR models.
Methods
Reagents
Dulbecco's modified Eagle's medium (DMEM) and F12 culture medium, antibiotics, fetal bovine serum (FBS), trypsin, NuPAGE Novex 10% Bis-Tris gels, fluorescent secondary antibody, and superScript II RNase H reverse transcription kit were obtained from Invitrogen (Carlsbad, CA, USA). Endothelial cell growth supplement (ECGS) was from Upstate Biotechnology (Lake Placid, NY, USA), and insulin-transferrin-selenium mix (ITS), 7-amino-4-trifluoro-methylcoumarin (AFC), Streptozotocin (STZ), Dexamethasone, primary mouse anti-α tubulin antibody, and commonly used chemicals and reagents were purchased from Sigma-Aldrich Chemical (St. Louis, MO, USA). miRIDIAN miRNA mimic or inhibitor for miR-146a and negative controls (scrambled) were obtained from Dharmacon (GE Healthcare Life Sciences, Pittsburgh, PA, USA). mirVana miRNA Isolation Kit, TaqMan miRNA Assay, TaqMan miRNA Assay Reverse Transcription kit, Power SYBR Green PCR Master Mix, and TaqMan Universal PCR Master Mix II without UNG were from Applied Biosystems (Foster City, CA, USA).
Animals and Induction of Diabetes
All animal experiments were designed and carried out in accordance with the ARVO Statement for the Use of Animals in Ophthalmic and Vision Research. This study was approved by the Institutional Animal Care and Use Committee at Michigan State University. Eight-week-old male Long Evans rats with body weights of 240 g were purchased from the Harlan Laboratories (Haslett, MI, USA). Diabetes was induced by intraperitoneal injection of 65 mg STZ per kg body weight as previously described.33 Nondiabetic animals received vehicle (100 mM citric acid buffer, pH = 4.5) injections. The animals were maintained on a 12 hours light/12 hours dark cycle (lights on at 7:00 AM, lights off at 7:00 PM) for the duration of the study. Body weight and blood glucose were monitored biweekly. Circadian studies were performed 6 weeks after the induction of diabetes to mimic early-stage DR. To investigate the mRNA expression level of ICAM-1, VEGF, and IL-1β, nondiabetic and diabetic rats were killed 1 to 3 hours after the lights went on (Zeitgeber time [ZT] 1-3). The retinas were collected for mRNA expression analysis.
In Vivo Circadian Studies
Nondiabetic and diabetic rats were killed every 2 hours beginning 1 hour after the lights went on (ZT 1) throughout three complete 24-hour light/dark cycles. During the dark phase (ZT 12–23) the dissection was carried out under dim red light. To isolate the retina, the eyes were enucleated, cornea, lens, and vitreous humor were removed, and the retina was gently separated from choroid, washed in PBS, snap frozen in liquid nitrogen, and stored at −80°C.
Cell Culture
Primary cultures of human retinal endothelial cells (HRECs) and human Müller cells (HMC) were prepared from the retinas provided by National Disease Research Interchange (Philadelphia, PA, USA) as previously described.34 Characteristics of the donors are summarized in Supplementary Table S1. Passages 3 to 5 were used in the experiments. High purity (over 99%) HREC were used in the study. HRECs were grown in six-well plates coated with 0.1% gelatin in 2 mL growth medium/well consisting of DMEM/F12 (1:1 ratio, 5 mM glucose) supplemented with 10% FBS, 5% ECGS, 1% penicillin/streptomycin, and 1× ITS at 37°C in humidified 95% air and 5% CO2. Human retinal pigment epithelial cell line ARPE-19 cell culture (HRPE) cells and HMC were grown in 2 mL growth medium/well consisting of DMEM/F12 (1:1 ratio, 5 mM glucose) supplemented with 10% FBS, 1% penicillin/streptomycin, at 37°C in humidified 95% air and 5% CO2.
Dexamethasone Exposure
Human retinal endothelial cells from nondiabetic and diabetic donors were grown to 80% confluence and exposed to 100 nM dexamethasone for 2 hours. After 2 hours, the medium was replaced with growth medium supplemented with 10% FBS. The cells did not receive any further medium changes from this point until the time of harvest. Human retinal endothelial cells were harvested every 3 hours over a 48-hour or 24-hour period following the initial exposure and total miRNA, RNA, and proteins were extracted.
miRNAs Transfection and RNAi
Cultured HRECs were detached with trypsin, centrifuged at 100g for 5 minutes, and resuspended in electroporation solution (Amaxa Biosystems, Gaithersburg, MD, USA) to a final concentration of 4 to 5 × 10⁵ cells/100 μL. Then 100 μL cell suspension was mixed with 50 nM miRIDIAN miRNA mimic or 100 nM miRIDIAN miRNA antagomir for miR-146a and the negative controls (scrambled) into the electroporation cuvette, and HREC were electroporated (Nucleofactor program M-030; Amaxa Biosystems). The electroporated cells were maintained in supplemented medium in 37°C/5% CO2 incubator. After 48 hours, cells were harvested for total miRNA, RNA, and protein extraction.
miRNA Analysis
Ribonucleic acid was isolated using the mirVana miRNA Isolation Kit (Ambion, Austin, TX, USA) according to the manufacturer's instructions. The purity and quantity of RNA were assessed using the NanoDrop ND-1000 spectrophotometer (Thermo Scientific, Wilmington, DE, USA). All the samples were diluted to a final concentration of 10 ng/μL. The samples were used immediately or stored at −80°C for future use. Total RNA (10 ng) was used for cDNA synthesis with TaqMan miRNA Assay Reverse Transcription kit according to the manufacturer's instructions. Real-time PCR was performed with TaqMan miRNA Assay. All TaqMan assays were run in triplicate on an ABI PRISM 7500 Fast real-time PCR systems using TaqMan Universal PCR Master Mix II without UNG. The relative amounts of miRNAs were calculated by using the comparative cycle threshold (CT) method, and the data were normalized to the expression of 4.5S RNA (H) or RNU58B for rat or human.
mRNA Analysis
RNA was isolated using the mirVana miRNA Isolation Kit according to the manufacturer's instructions. Transcript-specific primers for each gene were designed using Primer 3 software (available at http://frodo.wi.mit.edu/primer3/) and listed in Supplementary Table S2. First-strand cDNA was synthesized using the SuperScript II RNase H Reverse Transcription kit. Synthesized cDNA was mixed with 2× SYBR Green PCR Master Mix and the different sets of gene-specific forward and reverse primers and then subjected to real-time PCR quantification using the ABI PRISM 7500 Fast Real-time PCR System (Applied Biosystems). All reactions were performed in triplicate. The relative amounts of mRNAs were calculated by using the comparative CT method. All genes were normalized to the abundance of cyclophilin mRNA.
Western Blotting
Protein concentration was determined by a Qubit fluorometer (Invitrogen), according to the manufacturer's instructions, and equivalent amounts of protein were loaded on the NuPAGE Novex 10% Bis-Tris gels for SDS-PAGE separation. The separated proteins were electrophoretically transferred to a nitrocellulose membrane (Bio-Rad, Hercules, CA, USA), blocked for 30 minutes at room temperature, and probed with primary mouse anti-ICAM-1 and mouse anti-α-tubulin antibody followed by fluorescent secondary antibody. The blots were analyzed by the Licor Odyssey scanner (Licor Biosciences, Lincoln, NE, USA) and quantitated using Licor Odyssey software.
Periodicity Analysis
To identify rhythmic miR-146a and IRAK1 expression in rat retinas, we used a statistical program COSOPT based on an algorithm described by Straume35 with a COSOPT multiple measures corrected β value (pMMC-β) cutoff of 0.05. The amplitude and phase were calculated using COSOPT analysis; the data were then evaluated by single cosine analysis in R (R analysis) to identify rhythmic gene expression in synchronized HREC. The data were considered diurnal oscillation by the zero-amplitude test with a Pr-value of less than 0.05.
Results
Effect of Diabetes on Daily Oscillations of Clock Genes, miR-146a, and IRAK1 Expression in Rat Retina
Expression of circadian oscillator genes in rat retina was examined every 2 hours for the 72-hour period. Expression levels of bmal1, per1, and cry1 displayed the rhythmic oscillation expression pattern in the retina isolated from nondiabetic and STZ diabetic rats by COSOPT or R analysis. Diabetes inhibited the per1 amplitude (1.87E-02 for nondiabetic rats and 3.56E-03 for diabetic rats, P = 0.0139, COSOPT analysis) and enhanced the bmal1 (9.15E-02 for nondiabetic rats and 1.21E-01 for diabetic rats, P = 0.004, COSOPT analysis) amplitude.36
Expression of miR-146a and its target gene IRAK1 in retinas isolated from nondiabetic rats had a daily oscillation pattern (pMMC-β for miR-146a is 0.022, for IRAK1 is 0.01), whereas both miR-146a and IRAK1 expression from STZ diabetic rats displayed the nonoscillating pattern (pMMC-β for miR-146a is 0.08, for IRAK1 is 0.09) by COSOPT analysis (Table 1; Figs. 1A, 1B). Daily oscillations of miR-146a were in phase with bmal1, and antiphase with per1 and cry1 by COSOPT analysis. Furthermore, diabetic animals had lower amplitude of expression of miR-146a (P = 0.0202) and higher amplitude of IRAK1 expression (P = 0.0115) compared with the nondiabetic animals (Table 1; Figs. 1A, 1B; COSOPT analysis). Although we did not have enough retinal material to analyze circadian pattern, we determined the expression level of several important inflammatory factors, including ICAM-1, VEGF, and IL-1β at ZT1-3. As shown in Figure 1C, the mRNA expression level of ICAM-1, VEGF, and IL-1β was significantly increased in diabetic rat retinas as compared with nondiabetic rats.
Table 1.
Analysis of the Expression Levels and Daily Oscillation of miR-146a and IRAK1 by COSOPT in Rat Retina
|
Name |
Gene ID |
Nondiabetic vs. Diabetic |
Period |
Phase, ZT |
pMMC-β |
Daily Rhythmicity |
|
|
Amplitude |
P
Value |
||||||
| miR-146a | Nondiabetic | 9.19E-01 | 0.0202* | 26.7 | 3 | 0.022* | Yes |
| Diabetic | 3.13E-01 | 0.08 | No | ||||
| IRAK1 | Nondiabetic | 2.27E-02 | 0.0115* | 22.9 | 15 | 0.01** | Yes |
| Diabetic | 3.85E-02 | 0.09 | No | ||||
Amplitude, mean amplitude of the identified time series (theoretically zero); Period, mean period of the identified time series (theoretically 24); Phase, mean time of acrophase of the identified time series (theoretically zero); pMMC-β, mean multiple measures corrected significance probability β value. Genes with a period of between 20 and 28 hours with pMMC-β value of <0.05 were considered circadianly regulated.
* P < 0.05.
** P < 0.01.
*** P < 0.0001.
Figure 1.
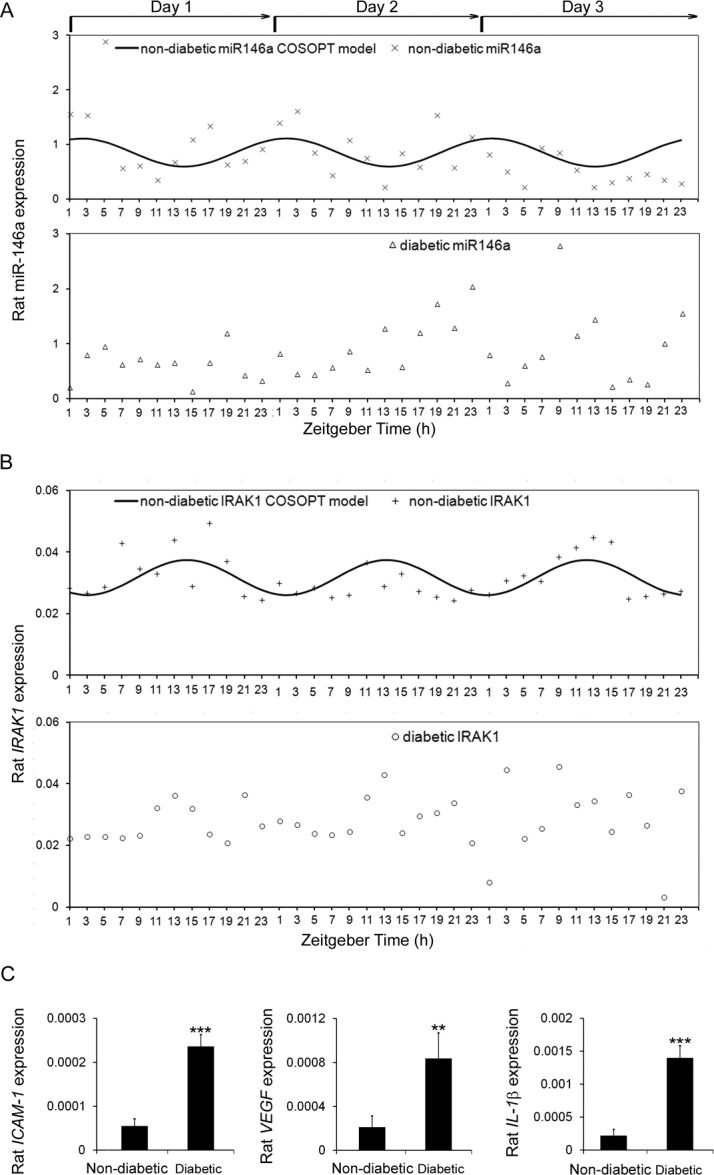
Expression profiles of miR-146a and inflammatory genes in rat retinas. Retinas were collected every 2 hours throughout three complete 24-hour light/dark cycles from STZ-induced diabetic rats and age matched nondiabetic rats. COSOPT statistical analysis was performed to analyze the rhythmic pattern of (A) miR-146 and (B) IRAK1 mRNA expression. (C) STZ-induced diabetic rats and nondiabetic rats were killed and their retinas were harvested for RNA analysis. The mRNA levels of ICAM-1, VEGF, and IL-1β were examined by real-time PCR.
IRAK1 and ICAM-1 Are Negatively Regulated by miR-146a in HREC
The expression level of miR-146a was examined in HMC, HREC, and HRPE cells in three independent experiments. As shown in Figure 2A, miR-146a is expressed in all three types of cells, with the highest expression level in HMC (P < 0.001), followed by HREC (Fig. 2A). The expression of miR-146a was very low in HRPE cells (Fig. 2A); miR-146a is known to control inflammatory pathways through directly targeting IRAK1 and TRAF6 genes. As we and others have previously demonstrated, the IL-1β pathway is highly activated in diabetic retina and we focused on the effect of miR-146a on IRAK1 and ICAM-1 expression. We modulated the activity of miR-146a by transfection of miR-146a mimic or inhibitor in HREC. As expected, expression of miR-146a was significantly increased by miR-146a mimic and reduced by miR-146a inhibitor (P < 0.001) (Fig. 2B). Furthermore, mRNA expression of IRAK1 and ICAM-1 was negatively regulated by miR-146a (Figs. 2C, 2D). IRAK1 mRNA level was reduced 2.9-fold and ICAM-1 mRNA level was reduced 1.6-fold in miR-146a mimic-treated HREC. Consistently, miR-146a inhibitor caused a 2.7-fold increase in the IRAK1 mRNA level and 1.5-fold increase in the ICAM-1 mRNA level (Figs. 2C, 2D). In the presence of miR-146a mimic, ICAM-1 protein expression in HREC was decreased 1.7-fold compared with control mimic-transfected cells; however, miR-146a inhibitor increased the protein expression by 1.6-fold in HREC (Fig. 2E).
Figure 2.

IRAK1 and ICAM-1 were negatively regulated by miR-146a in HREC. (A) miR-146a expression levels in three human retinal cell types, HREC, HRPE cells, and HMC, were detected by real-time PCR and normalized to human reference miRNA, RNU58B. Results are shown as the mean ± SE. ***P < 0.001 compared to HRPE cells and HREC. (B) Real-time PCR analysis of miR-146a expression after delivery of miR-146a mimic or inhibitor in HREC. Results are mean ± SE. ***P < 0.001 compared with control mimic or inhibitor. (C) Real-time PCR analysis of IRAK1 mRNA level after miR-146a mimic or inhibitor delivery in HREC. Results are mean ± SE. ***P < 0.001 compared with control mimic or inhibitor. (D) Real-time PCR analysis of ICAM-1 mRNA level after miR-146a mimic or inhibitor delivery in HREC. Results are mean ± SE. ***P < 0.001 compared with control mimic or inhibitor. (E) Western blot analysis of ICAM-1 protein expression after miR-146a mimic or inhibitor delivery in HREC. α-tubulin serves a loading control. Representative blots are from three independent experiments. Quantification of band intensity is relative to control. Results are mean ± SE. ***P < 0.001 compared with control mimic or inhibitor.
Circadian Changes in Clock Genes, miR-146a, IRAK1, and ICAM-1 Expressions in HREC From Nondiabetic and Diabetic Donors
We next used HREC isolated from nondiabetic and diabetic donors and examined the expression levels of clock genes (bmal1, per1, per2, cry1, cry2), miR-146a, IRAK1, and ICAM-1. As shown in Table 2, all examined clock genes exhibited the rhythmic oscillation pattern expression for up to 48 hours following synchronization in HREC isolated from nondiabetic and diabetic donors by R analysis (*Pr < 0.05, **Pr < 0.001, ***Pr < 0.0001) (Table 2; Fig. 3A).
Table 2.
Analysis of the Gene Expression Levels and Daily Rhythmicity by R Project in Synchronized HREC
|
Name |
Gene ID |
Nondiabetic vs. Diabetic |
R Analysis |
||||
|
Amplitude |
P
Value |
Period |
Phase, ZT |
Pr
Value |
Daily Rhythmicity |
||
| bmal1 | Nondiabetic | 3.89E-03 | 0.1901 | 27 | 12 | 0.0249* | Yes |
| Diabetic | 2.93E-03 | 28 | 12 | 0.009** | Yes | ||
| per1 | Non diabetic | 1.19E-04 | 0.7352 | 23 | 3 | 0.0393* | Yes |
| Diabetic | 1.03E-04 | 24 | 3 | 0.0476* | Yes | ||
| per2 | Nondiabetic | 3.23E-04 | 0.0033** | 25 | 3 | 0.0007*** | Yes |
| Diabetic | 7.39E-04 | 26 | 3 | 0.0141* | Yes | ||
| cry1 | Nondiabetic | 4.27E-03 | 0.019* | 28 | 9 | <0.0001*** | Yes |
| Diabetic | 5.16E-03 | 28 | 9 | <0.0001*** | Yes | ||
| cry2 | Nondiabetic | 2.24E-03 | 0.9876 | 23 | 6 | 0.0008*** | Yes |
| Diabetic | 2.25E-03 | 26 | 6 | 0.0066** | Yes | ||
| miR-146a | Nondiabetic | 1.29E+00 | <0.0001*** | 23 | 18 | 0.00123** | Yes |
| Diabetic | 1.46E-01 | 0.181 | No | ||||
| IRAK1 | Nondiabetic | 7.40E-03 | 0.0099** | 21 | 15 | 0.0182* | Yes |
| Diabetic | 1.95E-02 | 0.315 | No | ||||
| ICAM-1 | Nondiabetic | 3.56E-02 | 0.0137* | 29 | 9 | 0.0247* | Yes |
| Diabetic | 7.79E-02 | 0.0225* | Yes | ||||
Pr values have been calculated by the single cosine R analysis. Genes with Pr < 0.05 were considered circadianly regulated. b mal1, brain and muscle aryl-hydrocarbon receptor nuclear translocator-like 1; cry, cryptochrome; per, period.
* P < 0.05.
** P < 0.01.
*** P < 0.0001.
Figure 3.

Expression levels of IRAK1 and ICAM-1 showed circadian rhythm in synchronized HREC. Cultures of HREC isolated from nondiabetic and diabetic donor were exposed to 100 nM dexamethasone for 2 hours and subsequently harvested at 3-hour intervals up to 48 hours following synchronization for isolation of total RNA and miRNA. (A) Expression levels of bmal1, per1, per2, cry1, and cry2 were measured by real-time PCR and normalized to cyclophilin. R analysis was performed to analyze the rhythmic mRNA expression pattern of bmal1, per1, per2, cry1, and cry2. (B) miR-146a expression level was examined by real-time PCR and normalized to human reference miRNA, RNU58B. R analysis was performed to analyze the rhythmic expression pattern of miR-146a. (C) IRAK1 and (D) ICAM-1 mRNA levels were detected in synchronized HREC from nondiabetic and diabetic donor by real-time PCR and normalized to housekeeping gene, cyclophilin A. The rhythmic mRNA expression pattern of IRAK1 and ICAM-1 also was analyzed with R project. Results are shown as the mean ± SD, n = 3 for observations in HREC from nondiabetic donors and diabetic donors.
In agreement with previous studies, HREC isolated from nondiabetic donors did not show an inflammatory response to high glucose and miR-146a expression was not affected by high glucose in HREC (data not shown). We thus used HREC isolated from nondiabetic and diabetic donors to examine the possible effect of diabetes on the expression of miR-146a and inflammatory markers. The expression of miR-146a exhibited circadian rhythmicity for up to 48 hours following synchronization in HREC derived from nondiabetic donors (Pr = 0.00123) (Table 2; Fig. 3B; R analysis), whereas rhythmic expression of miR-146a was lost in HREC from diabetic donors (Pr = 0.181) (Table 2; Fig. 3B; R analysis). Notably, miR-146a expression had a lower amplitude in HREC derived from diabetic donors compared with the nondiabetic donors (P < 0.0001) (Table 2; Fig. 3B; R analysis). As the direct target gene of miR-146a, mRNA expression level of IRAK1 exhibited the opposite circadian rhythmicity to miR-146a expression in HREC from nondiabetic donors (Pr = 0.0182) (Table 2; Fig. 3C; R analysis), and lost the rhythmic expression in HREC from diabetic donors (Pr = 0.315) (Table 2; Fig. 3C; R analysis). In agreement with IRAK1 being negatively regulated by miR-146a, our data also showed higher amplitude of IRAK1 mRNA expression in HREC from diabetic donors as compared with nondiabetic donors (P = 0.0099) (Table 2; Fig. 3C; R analysis).
ICAM-1 mRNA expression exhibited circadian rhythm in HREC isolated from nondiabetic and diabetic individuals (Pr is 0.0247 for nondiabetic donors and 0.0225 for diabetic donors) (Table 2; Fig. 3D; R analysis). As shown in Figures 2D and 2E, ICAM-1 was also negatively regulated by miR-146a in HREC, amplitude of ICAM-1 mRNA expression was higher in HREC isolated from diabetic donors compared with nondiabetic donors (P = 0.0137) (Table 2; Fig. 3D; R analysis). To validate these mRNA expression results, protein levels of ICAM-1 were assessed by Western blot (Fig. 4). Due to limited availability of human retinal endothelial cells from matching nondiabetic and diabetic donors, this experiment was performed for only 24 hours. Based on 24 hours of data, R analysis identified the rhythmic oscillation pattern expression in HREC from both nondiabetic and diabetic donors (n = 3) (Pr is 0.0389 for nondiabetic donors and 0.0297 for diabetic donors) (Fig. 4).
Figure 4.

ICAM-1 protein expression showed circadian rhythm in synchronized HREC. Cultures of HREC isolated from nondiabetic and diabetic donors were exposed to 100 nM dexamethasone for 2 hours and subsequently harvested at 3-hour intervals up to 24 hours following synchronization for isolation of protein. Immunoblot and quantitative analysis of ICAM-1 protein expression in synchronized HREC from nondiabetic and diabetic donors. α-tubulin serves a loading control. R analysis was performed to analyze the rhythmic protein expression pattern of ICAM-1. Representative blots are from three independent experiments. Results are mean ± SE.
To directly compare the ICAM-1 expression levels, the proteins were rerun on another set of gels with nondiabetic and diabetic HREC loaded side-by-side (Supplementary Fig. S1). Consistent with the results of mRNA expression (Fig. 3C), ICAM-1 protein expression was increased in HREC from diabetic donors compared with nondiabetic donors (Supplementary Fig. S1).
Discussion
The miR-146 family is composed of two evolutionary conserved miRNA genes, miR-146a and miR-146b, located on chromosomes 5 and 10, respectively.37 The miR-146a was shown to have 75 predicted target genes by TargetRank software (http://genes.mit.edu/targetrank/, available in the public domain).38 Among these predicted target genes, a number of important targets have been validated, including inflammatory (IRAK1, TRAF6, TLR2, TLR4, NFKB1, FAS), DNA repair (BRCA1 and 2), apoptosis (FADD), migration (ROCK1, CXCR4), and proliferation (SMAD4) genes.39 It is not surprising that miR146a has been implicated in inflammatory response,26 insulin resistance,40 rheumatoid arthritis,41 lupus,42 leukemia,42 and colorectal, breast, cervical and other types of cancer.43–46
Diabetic retinopathy is initiated as low-grade chronic inflammatory disease. Several miRNAs can serve as negative regulators of inflammation; however, their role in controlling retinal inflammation is not well understood. Among these miRNAs, miR-146a was shown to be the most downregulated in diabetic rat retina. Two well-known activators of NF-κB pathway, TRAF6 and IRAK1, have the highest context score as miR-146a targets as determined by TargetScan software (http://www.targetscan.org/, in the public domain). The miR-146a can thus reduce activation of NF-κB and inhibit expression of NF-κB target genes, such as IL-6, IL-8, IL-1β, and TNF-α, through direct downregulation of IRAK1 and TRAF6.29,41,43
Recent studies have demonstrated that several miRNAs follow circadian expression pattern and are in turn involved in the control of circadian rhythmicity of a number of genes. The circadian rhythms of miR-219 and miR-132 expression are involved in the circadian clock activity in the suprachiasmatic nucleus.47 Similarly, inhibition of miR-122 in the liver alters the circadian rhythmicity of key transcripts involved in metabolism.12,48 In the mouse retina, 12 miRNAs exhibited circadian rhythm.13
Immune function and inflammatory activity has been shown to be associated with circadian rhythm, with the peak of inflammatory activity occurring during the beginning of the sleep cycle.49 Numerous studies demonstrated critical involvement of IL-1β in the pathogenesis of DR.50,51 Indeed, IL-1β concentration is increased in diabetic retina.34 Furthermore, blocking IL-1β production or signaling was shown to prevent vascular damage in the DR animal model.52,53 Although previous studies reported 24-hour rhythmicity of the IL-1β expression in serum,54–56 no information was available about diurnal rhythms of inflammatory pathways in general and the IL-1β pathway in particular and their regulation by miRNA in the retina. IRAK1 is a key regulator of the IL-1β pathway.28 In this study, we investigated the circadian expression of miR-146a and its target IRAK1 in diabetic retina.
We have previously demonstrated that diabetes has a pronounced effect on the regulation of the daily rhythmic patterns of clock genes. In this study, we confirmed that retina has daily rhythmicity of all the major clock genes and the amplitude as well as phase of these oscillations is affected by diabetes. In addition to clock genes, here we demonstrate that miR-146a expression exhibited the rhythmic oscillation expression pattern in the retinas from nondiabetic, but not diabetic rats. Importantly, the miR146a direct target, IRAK1, also followed rhythmic expression that was in opposite phase with miR-146a expression, in agreement with negative regulation of IRAK1 by miR-146a. Moreover, mRNA expression of IRAK1 rhythmicity also was lost in diabetic retinas as compared with nondiabetic retinas. These data highlight the importance of normal daily oscillation patterns of retinal inflammatory markers and suggest that the loss of rhythmicity represents an important aspect of diabetes-induced retinal inflammation.
We next demonstrated that miR-146a expression follows rhythmic expression in the widely used human retinal cell culture model that can mimic retinal inflammation, HREC. The miR-146a had lower amplitude of expression level in HREC from diabetic donors than nondiabetic donors. In agreement with the animal model data, IRAK1 mRNA expression followed circadian pattern in HREC that was in opposite phase with miR-146a expression; moreover, IRAK1 showed higher amplitude of mRNA expression in HREC from diabetic donors compared with nondiabetic donors.
We next analyzed the expression of ICAM-1, a target gene downstream of IRAK1 activated by proinflammatory cytokines, including IL-1β, through the NF-κB pathway.57 ICAM-1 is a member of the immunoglobulin supergene family expressed on endothelial cells and involved in monocyte adhesion to the endothelium and the transmigration of leukocytes.31 ICAM-1 plays an important role in immune and inflammatory responses.58 Previous studies have demonstrated that the expression of ICAM-1 is increased in diabetic retinas and is involved in the pathogenesis of DR.32,59 Our data further support this observation, indicating that both mRNA and protein expression level of ICAM-1 are increased in HREC from diabetic donors compared with nondiabetic donors. Notably, our study demonstrates that IRAK1 and ICAM-1 expressions are reduced by the miR-146a mimic and increased by miR-146a inhibitors in HREC, further supporting a role for miR-146a in retinal vascular inflammation. Interestingly, mRNA expression level of ICAM-1 also exhibited the circadian oscillation in the human retinal cells examined with the phase opposite to that of miR-146a expression. Consistently, R analysis demonstrated circadian oscillation pattern in 24-hour ICAM-1 protein expression data. Although we cannot rule out potential contribution of the effect of dexamethasone to the results of the ICAM-1 protein expression due to the short duration of the experiment, in combination with the other circadian expression data presented in this article it is suggestive that ICAM-1 protein is, at least in part, under circadian regulation.
Taken together, this study demonstrates a coordinated rhythmicity of retinal miR-146a, its direct targets IRAK-1, as well as downstream target ICAM-1 expression in vivo and in vitro DR models. The rhythmicity of miR-146a expression in the diabetic retina may act to mediate rhythmicity of the inflammatory response in retinal cells and provide a novel approach to regulation of inflammation in DR.
Acknowledgments
Supported by National Institutes of Health Grants EY016077; and MEAS Grant MICL02163 (JVB), EY07739 and EY12601 (MBG), EY021626 (MEB), and DK090730 (MBG, JVB).
Disclosure: Q. Wang, None; S.N. Bozack, None; Y. Yan, None; M.E. Boulton, None; M.B. Grant, None; J.V. Busik, None
References
- 1. Akhtar RA, Reddy AB, Maywood ES, et al. Circadian cycling of the mouse liver transcriptome, as revealed by cDNA microarray, is driven by the suprachiasmatic nucleus. Curr Biol. 2002; 12: 540–550 [DOI] [PubMed] [Google Scholar]
- 2. Reddy AB, Karp NA, Maywood ES, et al. Circadian orchestration of the hepatic proteome. Curr Biol. 2006; 16: 1107–1115 [DOI] [PubMed] [Google Scholar]
- 3. Claridge-Chang A, Wijnen H, Naef F, Boothroyd C, Rajewsky N, Young MW. Circadian regulation of gene expression systems in the Drosophila head. Neuron. 2001; 32: 657–671 [DOI] [PubMed] [Google Scholar]
- 4. Panda S, Antoch MP, Miller BH, et al. Coordinated transcription of key pathways in the mouse by the circadian clock. Cell. 2002; 109: 307–320 [DOI] [PubMed] [Google Scholar]
- 5. McDonald MJ, Rosbach M. Microarray analysis and organization of circadian gene expression in Drosophila. Cell. 2001; 107: 567–578 [DOI] [PubMed] [Google Scholar]
- 6. Lim LP, Lau NC, Garrett-Engele P, et al. Microarray analysis shows that some microRNAs downregulate large numbers of target mRNAs. Nature. 2005; 433: 769–773 [DOI] [PubMed] [Google Scholar]
- 7. Lewis BP, Burge CB, Bartel DP. Conserved seed pairing, often flanked by adenosines, indicates that thousands of human genes are microRNA targets. Cell. 2005; 120: 15–20 [DOI] [PubMed] [Google Scholar]
- 8. Lagos-Quintana M, Rauhut R, Lendeckel W, Tuschl T. Identification of novel genes coding for small expressed RNAs. Science. 2001; 294: 853–858 [DOI] [PubMed] [Google Scholar]
- 9. Stark A, Brennecke J, Bushati N, Russell RB, Cohen SM. Animal MicroRNAs confer robustness to gene expression and have a significant impact on 3′UTR evolution. Cell. 2005; 123: 1133–1146 [DOI] [PubMed] [Google Scholar]
- 10. Farh KK, Grimson A, Jan C, et al. The widespread impact of mammalian MicroRNAs on mRNA repression and evolution. Science. 2005; 310: 1817–1821 [DOI] [PubMed] [Google Scholar]
- 11. Yang M, Lee JE, Padgett RW, Edery I. Circadian regulation of a limited set of conserved microRNAs in Drosophila. BMC Genomics. 2008; 9: 83 [DOI] [PMC free article] [PubMed] [Google Scholar]
- 12. Gatfield D, Le Martelot G, Vejnar CE, et al. Integration of microRNA miR-122 in hepatic circadian gene expression. Genes Dev. 2009; 23: 1313–1326 [DOI] [PMC free article] [PubMed] [Google Scholar]
- 13. Xu S, Witmer PD, Lumayag S, Kovacs B, Valle D. MicroRNA (miRNA) transcriptome of mouse retina and identification of a sensory organ-specific miRNA cluster. J Biol Chem. 2007; 282: 25053–25066 [DOI] [PubMed] [Google Scholar]
- 14. Emilsson V, Thorleifsson G, Zhang B, et al. Genetics of gene expression and its effect on disease. Nature. 2008; 452: 423–428 [DOI] [PubMed] [Google Scholar]
- 15. Iliopoulos D, Malizos KN, Oikonomou P, Tsezou A. Integrative microRNA and proteomic approaches identify novel osteoarthritis genes and their collaborative metabolic and inflammatory networks. PLoS One. 2008; 3: e3740 [DOI] [PMC free article] [PubMed] [Google Scholar]
- 16. Bartel DP. MicroRNAs: genomics, biogenesis, mechanism, and function. Cell. 2004; 116: 281–297 [DOI] [PubMed] [Google Scholar]
- 17. Poy MN, Eliasson L, Krutzfeldt J, et al. A pancreatic islet-specific microRNA regulates insulin secretion. Nature. 2004; 432: 226–230 [DOI] [PubMed] [Google Scholar]
- 18. Kloosterman WP, Lagendijk AK, Ketting RF, Moulton JD, Plasterk RHA. Targeted inhibition of miRNA maturation with morpholinos reveals a role for miR-375 in pancreatic islet development. PLoS Biology. 2007; 5: 1738–1749 [DOI] [PMC free article] [PubMed] [Google Scholar]
- 19. Baroukh N, Ravier MA, Loder MK, et al. MicroRNA-124a regulates Foxa2 expression and intracellular signaling in pancreatic beta-cell lines. J Biol Chem. 2007; 282: 19575–19588 [DOI] [PubMed] [Google Scholar]
- 20. Poy MN, Spranger M. Stoffel M. microRNAs and the regulation of glucose and lipid metabolism. Diabetes Obes Metab. 2007; 9: 67–73 [DOI] [PubMed] [Google Scholar]
- 21. Pandey AK, Agarwal P, Kaur K, Datta M. MicroRNAs in diabetes: tiny players in big disease. Cell Physiol Biochem. 2009; 23: 221–232 [DOI] [PubMed] [Google Scholar]
- 22. Funari VA, Winkler M, Brown J, Dimitrijevich SD, Ljubimov AV, Saghizadeh M. Differentially expressed wound healing-related microRNAs in the human diabetic cornea. PLoS One. 2013; 8: e84425 [DOI] [PMC free article] [PubMed] [Google Scholar]
- 23. Kovacs B, Lumayag S, Cowan C. Xu SB. microRNAs in early diabetic retinopathy in streptozotocin-induced diabetic rats. Invest Ophthalmol Vis Sci. 2011; 52: 4402–4409 [DOI] [PubMed] [Google Scholar]
- 24. Nahid MA, Satoh M, Chan EK. Mechanistic role of microRNA-146a in endotoxin-induced differential cross-regulation of TLR signaling. J Immunol. 2011; 186: 1723–1734 [DOI] [PMC free article] [PubMed] [Google Scholar]
- 25. Li L, Chen XP, Li YJ. MicroRNA-146a and human disease. Scand J Immunol. 2010; 71: 227–231 [DOI] [PubMed] [Google Scholar]
- 26. Perry MM, Moschos SA, Williams AE, Shepherd NJ, Larner-Svensson HM, Lindsay MA. Rapid changes in microRNA-146a expression negatively regulate the IL-1 beta-induced inflammatory response in human lung alveolar epithelial cells. J Immunol. 2008; 180: 5689–5698 [DOI] [PMC free article] [PubMed] [Google Scholar]
- 27. Taganov KD, Boldin MP, Chang KJ, Baltimore D. NF-kappa B-dependent induction of microRNA miR-146, an inhibitor targeted to signaling proteins of innate immune responses. Proc Natl Acad Sci U S A. 2006; 103: 12481–12486 [DOI] [PMC free article] [PubMed] [Google Scholar]
- 28. Gottipati S, Rao NL, Fung-Leung WP. IRAK1: a critical signaling mediator of innate immunity. Cell Signal. 2008; 20: 269–276 [DOI] [PubMed] [Google Scholar]
- 29. Taganov KD, Boldin MP, Chang KJ, Baltimore D. NF-kappaB-dependent induction of microRNA miR-146, an inhibitor targeted to signaling proteins of innate immune responses. Proc Natl Acad Sci U S A. 2006; 103: 12481–12486 [DOI] [PMC free article] [PubMed] [Google Scholar]
- 30. Nozaki M, Ogura Y, Hirabayashi Y, Saishin Y, Shimada S. Enhanced expression of adhesion molecules of the retinal vascular endothelium in spontaneous diabetic rats. Ophthalmic Research. 2002; 34: 158–164 [DOI] [PubMed] [Google Scholar]
- 31. Joussen AM, Murata T, Tsujikawa A, Kirchhof B, Bursell SE, Adamis AP. Leukocyte-mediated endothelial cell injury and death in the diabetic retina. Am J Pathol. 2001; 158: 147–152 [DOI] [PMC free article] [PubMed] [Google Scholar]
- 32. McLeod DS, Lefer DJ, Merges C, Lutty GA. Enhanced expression of intracellular adhesion. Molecule-1 and P-selectin in the diabetic human retina and choroid. Am J Pathol. 1995; 147: 642–653 [PMC free article] [PubMed] [Google Scholar]
- 33. Tikhonenko M, Lydic TA, Wang Y, et al. Remodeling of retinal fatty acids in an animal model of diabetes: a decrease in long-chain polyunsaturated fatty acids is associated with a decrease in fatty acid elongases Elovl2 and Elovl4. Diabetes. 2010; 59: 219–227 [DOI] [PMC free article] [PubMed] [Google Scholar]
- 34. Busik JV, Mohr S, Grant MB. Hyperglycemia-induced reactive oxygen species toxicity to endothelial cells is dependent on paracrine mediators. Diabetes. 2008; 57: 1952–1965 [DOI] [PMC free article] [PubMed] [Google Scholar]
- 35. Straume M. DNA microarray time series analysis: automated statistical assessment of circadian rhythms in gene expression patterning. Methods Enzymol. 2004; 383: 149–166 [DOI] [PubMed] [Google Scholar]
- 36. Wang Q, Tikhonenko M, Bozack SN, et al. Changes in the daily rhythm of lipid metabolism in the diabetic retina. PLoS One. 2014; 9: e95028 [DOI] [PMC free article] [PubMed] [Google Scholar]
- 37. Williams AE, Perry MM, Moschos SA, Larner-Svensson HM, Lindsay MA. Role of miRNA-146a in the regulation of the innate immune response and cancer. Biochem Soc Trans. 2008; 36: 1211–1215 [DOI] [PubMed] [Google Scholar]
- 38. Jazdzewski K, Liyanarachchi S, Swierniak M, et al. Polymorphic mature microRNAs from passenger strand of pre-miR-146a contribute to thyroid cancer. Proc Natl Acad Sci U S A. 2009; 106: 1502–1505 [DOI] [PMC free article] [PubMed] [Google Scholar]
- 39. Dweep H, Sticht C, Pandey P. Gretz N. miRWalk—database: prediction of possible miRNA binding sites by “walking” the genes of three genomes. J Biomed Inform. 2011; 44: 839–847 [DOI] [PubMed] [Google Scholar]
- 40. Balasubramanyam M, Aravind S, Gokulakrishnan K, et al. Impaired miR-146a expression links subclinical inflammation and insulin resistance in Type 2 diabetes. Mol Cell Biochem. 2011; 351: 197–205 [DOI] [PubMed] [Google Scholar]
- 41. Pauley KM, Satoh M, Chan AL, Bubb MR, Reeves WH, Chan EK. Upregulated miR-146a expression in peripheral blood mononuclear cells from rheumatoid arthritis patients. Arthritis Res Ther. 2008; 10: R101 [DOI] [PMC free article] [PubMed] [Google Scholar]
- 42. Tang Y, Luo X, Cui H, et al. MicroRNA-146A contributes to abnormal activation of the type I interferon pathway in human lupus by targeting the key signaling proteins. Arthritis Rheum. 2009; 60: 1065–1075 [DOI] [PubMed] [Google Scholar]
- 43. Bhaumik D, Scott GK, Schokrpur S, Patil CK, Campisi J, Benz CC. Expression of microRNA-146 suppresses NF-kappaB activity with reduction of metastatic potential in breast cancer cells. Oncogene. 2008; 27: 5643–5647 [DOI] [PMC free article] [PubMed] [Google Scholar]
- 44. Hezova R, Kovarikova A, Bienertova-Vasku J, et al. Evaluation of SNPs in miR-196-a2, miR-27a and miR-146a as risk factors of colorectal cancer. World J Gastroenterol. 2012; 18: 2827–2831 [DOI] [PMC free article] [PubMed] [Google Scholar]
- 45. Lin SL, Chiang A, Chang D, Ying SY. Loss of mir-146a function in hormone-refractory prostate cancer. RNA. 2008; 14: 417–424 [DOI] [PMC free article] [PubMed] [Google Scholar]
- 46. Yue C, Wang M, Ding B, et al. Polymorphism of the pre-miR-146a is associated with risk of cervical cancer in a Chinese population. Gynecol Oncol. 2011; 122: 33–37 [DOI] [PubMed] [Google Scholar]
- 47. Cheng HY, Papp JW, Varlamova O, et al. microRNA modulation of circadian-clock period and entrainment. Neuron. 2007; 54: 813–829 [DOI] [PMC free article] [PubMed] [Google Scholar]
- 48. Krutzfeldt J, Rajewsky N, Braich R, et al. Silencing of microRNAs in vivo with ‘antagomirs'. Nature. 2005; 438: 685–689 [DOI] [PubMed] [Google Scholar]
- 49. Besedovsky L, Lange T, Born J. Sleep and immune function. Pflugers Arch. 2012; 463: 121–137 [DOI] [PMC free article] [PubMed] [Google Scholar]
- 50. Kowluru RA, Mohammad G, Santos JM, Tewari S, Zhong Q. Interleukin-1beta and mitochondria damage, and the development of diabetic retinopathy. J Ocul Biol Dis Infor. 2011; 4: 3–9 [DOI] [PMC free article] [PubMed] [Google Scholar]
- 51. Kowluru RA, Odenbach S. Role of interleukin-1beta in the development of retinopathy in rats: effect of antioxidants. Invest Ophthalmol Vis Sci. 2004; 45: 4161–4166 [DOI] [PubMed] [Google Scholar]
- 52. Vincent JA, Mohr S. Inhibition of caspase-1/interleukin-1beta signaling prevents degeneration of retinal capillaries in diabetes and galactosemia. Diabetes. 2007; 56: 224–230 [DOI] [PubMed] [Google Scholar]
- 53. Yego EC, Vincent JA, Sarthy V, Busik JV, Mohr S. Differential regulation of high glucose-induced glyceraldehyde-3-phosphate dehydrogenase nuclear accumulation in Muller cells by IL-1beta and IL-6. Invest Ophthalmol Vis Sci. 2009; 50: 1920–1928 [DOI] [PubMed] [Google Scholar]
- 54. Sutherland ER, Martin RJ, Ellison MC, Kraft M. Immunomodulatory effects of melatonin in asthma. Am J Respir Crit Care Med. 2002; 166: 1055–1061 [DOI] [PubMed] [Google Scholar]
- 55. DeRijk R, Michelson D, Karp B, et al. Exercise and circadian rhythm-induced variations in plasma cortisol differentially regulate interleukin-1 beta (IL-1 beta), IL-6, and tumor necrosis factor-alpha (TNF alpha) production in humans: high sensitivity of TNF alpha and resistance of IL-6. J Clin Endocrinol Metab. 1997; 82: 2182–2191 [DOI] [PubMed] [Google Scholar]
- 56. Entzian P, Linnemann K, Schlaak M, Zabel P. Obstructive sleep apnea syndrome and circadian rhythms of hormones and cytokines. Am J Respir Crit Care Med. 1996; 153: 1080–1086 [DOI] [PubMed] [Google Scholar]
- 57. Chen W, Esselman WJ, Jump DB, Busik JV. Anti-inflammatory effect of docosahexaenoic acid on cytokine-induced adhesion molecule expression in human retinal vascular endothelial cells. Invest Ophthalmol Vis Sci. 2005; 46: 4342–4347 [DOI] [PMC free article] [PubMed] [Google Scholar]
- 58. Casasnovas JM, Bickford JK, Springer TA. The domain structure of ICAM-1 and the kinetics of binding to rhinovirus. J Virol. 1998; 72: 6244–6246 [DOI] [PMC free article] [PubMed] [Google Scholar]
- 59. Seckin D, Ilhan N, Ertugrul S. Glycaemic control, markers of endothelial cell activation and oxidative stress in children with type 1 diabetes mellitus. Diabetes Res Clin Pract. 2006; 73: 191–197 [DOI] [PubMed] [Google Scholar]