

Abstract
Objective: The mechanisms underlying the pathogenesis of intractable epilepsy (IE) are still unclear. This study aimed to investigate the role of phosphorylation of Cyclase Response Element Binding Protein (p-CREB)/microRNA-132 (miR-132) signal pathway in the epileptogenesis. Methods: Temporal lobe epilepsy (TLE) was induced in rodents, and the brain tissues were collected. P-CREB expression was detected by Western blot assay and immunochemistry at 6 h, 24 h, 3 d, 7 d, 14 d, 30 d and 60 d after induced status epilepsy (SE), respectively, and in patients with TLE. The expression of miR-132 was detected by RT-PCR. Results: The p-CREB and miR-132 were highly expressed in both rats and patients with TLE as compared to controls. Conclusions: The expression of p-CREB and miR-132 increases in epilepsy rats and patients, suggesting a possible pathogenetic role of p-CREB and miR-132 in TLE via modulating the dendritic plasticity.
Keywords: Temporal lobe epilepsy, phosphorylation of cyclase response element binding protein, microRNA-132, mossy fiber sprouting
Introduction
Temporal lobe epilepsy (TLE), accompanied by hippocampal sclerosis and mossy fiber sprouting (MFS), is a common form of focal epilepsy in humans [1,2]. It is characterized by recurrent spontaneous seizures and associated with abnormal formation of excitatory circuits, including dendrites, axons, and synaptic connections [3].
MicroRNAs (miRNA), endogenously highly conserved and noncoding single strand RNAs, are post-transcriptional gene regulation factors of about 22 nucleotides [4,5]. Change in miRNAs in abundance has been found in patients with TLE [6], and several of them are involved in the formation and development of dendrites, axons and synaptic plasticity [7,8], and partly regulate the occurrence of spontaneous seizures [9]. MIR-132, an activity-dependent RNA, was found to have increased expression in the pyramidal cells and granule cells as the neurons became mature [10]. With the physiological or pathophysiological stimuli for sensory neurons, miR-132 has been addressed in the regulation of synaptic plasticity via modulating the dendritic growth and spinogenesis in cultured hippocampal neurons by targeting p250GAP [11-14]. In addition, miR-132 was found to be involved in the negative regulation of cognitive memory [15-17] and the decreased miR-132 expression could extenuate the neuronal death induced by seizures [18], in vivo.
miR-132 is regulated by the CAMP response element binding protein (CREB), which binds to the CRE region of a gene, and promote the transcription and translation of the gene when the site ser133 of CREB is phosphorylated [19]. p-CREB promotes the formation of new synapse and affects physiological function of neurons, such as long-term synaptic potentiation by regulating protein synthesis [19], and increasing Na+ conductance and decreasing K+ conductance to increase neural excitation [20]. In addition, CREB is a downstream protein of ERK1/2 signal pathway which is related to MFS [19,21,22] and that is a common epilepsy pathophysiology involved in the formation of abnormal excitatory loops in TLE [23]. Studies have shown that transgenic mice constitutively overexpressing the active form of CREB for more than 3-4 weeks occasionally showed spontaneous seizures [24], but decreased expression of CREB suppressed the onset of epilepsy [25].
Within this context, we hypothesized that the signal pathway p-CREB/miR-132 2 participated in the pathophysiological process of TLE. In this study, the expression of p-CREB and miR-132 was detected in rats and patients with TLE by immunohistochemistry, western blot assay and qRT-PCR.
Materials and methods
Human subjects
Thirty patients with intractable TLE were randomly selected from the epilepsy brain tissue bank. In this study, all of the patients with epilepsy had typical clinical manifestations and characteristic electroencephalograms. The diagnosis of seizure type was confirmed according to the 1981 International League Against Epilepsy. Before surgery, the epileptic lesion was localized in all patients by brain magnetic resonance imaging (MRI) or CT and 24-h EEG or video EEG; sphenoidal electrode monitoring and intraoperative electrocorticography (ECOG) were performed to localize the epileptic lesion before resection in all patients. Two neuropathologists reviewed each case independently. These patients were refractory to maximal doses of at least three AEDs, including phenytoin, valproic acid, carbamazepine, phenobarbital, and topiramate. Brain MRI or CT and the related laboratory inspection had not indicated other nervous system diseases. Table 1 summarizes the clinical features of epileptic patients as follows. In this epilepsy group, surgical removal of the epileptogenic zone in the temporal neocortex was an alternative treatment option. The pathological findings in the resected tissues included gliosis, neuronal loss, and signs of neuronal degeneration. After lesion resection, the electrodes for intraoperative electrocorticography were placed on the remaining edge of tissues to ensure that the lesion was resected completely.
Table 1.
Clinical characteristics of TLE patients
| Patients | Gender | Age | Duration (year) | Seizure type | AEDs | Resection tissue | Pathology |
|---|---|---|---|---|---|---|---|
| 1 | M | 28 | 5 | SGS | CBZ, PHT, VPA | TNr | nd, g |
| 2 | F | 36 | 16 | SGS | CBZ, PHT, VPA, PB | TNl | nd, nl, g |
| 3 | F | 22 | 6 | SGS | CBZ, VPA, PHT | TNr | nd, nl, g |
| 4 | M | 15 | 9 | SGS | CBZ, PHT, VPA | TNl | g |
| 5 | M | 14 | 7 | CPS | CBZ, PHT, PB | TNl | nd, g |
| 6 | M | 20 | 10 | SGS | CBZ, PHT, VPA | TNr | nd, nl, g |
| 7 | F | 17 | 5 | CPS | CBZ, PB, CLB | TNr | nd, g |
| 8 | F | 58 | 40 | CPS | CBZ, PHT, CLB | TNl | nd, g |
| 9 | M | 8 | 5 | CPS | CBZ, PB, VPA | TNl | nd, g |
| 10 | M | 18 | 13 | SGS | CBZ, PRM, PHT | TNr | nd, g |
| 11 | M | 15 | 4 | SGS | CBZ, PHT, TPM | TNr | nd, g |
| 12 | M | 32 | 20 | SGS | CBZ, VPA, TPM | TNl | nl, g |
| 13 | F | 47 | 18 | CPS | CBZ, PB, CLB, PRM | TNr | nd, nl, g |
| 14 | M | 41 | 20 | SGS | CBZ, PHT, VPA, PB | TNr | nd, nl, g |
| 15 | M | 17 | 5 | SGS | TPM, VPA, PHT | TNr | nd, nl, g |
| 16 | M | 22 | 16 | SGS | CBZ, TPM, VPA, PB | TNl | nl, g |
| 17 | M | 16 | 14 | SGS | CBZ, PHT, PB | TNl | nl, nd, g |
| 18 | M | 15 | 15 | SGS | CBZ, CLB, TPM | TNl | nd, g |
| 19 | M | 25 | 7 | SGS | CBZ, PRM, TPM, PB | TNr | nd |
| 20 | M | 26 | 9 | SGS | CBZ, PHT, VPA, CLB | TNr | nl, nd, g |
| 21 | F | 45 | 6 | CPS | CBZ, VPA, TPM | TNr | g |
| 22 | M | 26 | 14 | SGS | CBZ, TPM, VPA, CLB | TNr | nl, nd, g |
| 23 | M | 22 | 21 | SGS | CBZ, VPA, TPM, PB | TNl | nd, g |
| 24 | M | 22 | 12 | SGS | CBZ, VPA, PRM, NIM, PB | TNr | nl, nd, g |
| 25 | F | 15 | 10 | CPS | CBZ, TPM, VPA | TNl | nd, g |
| 26 | M | 22 | 8 | CPS | CBZ, PB, TPM | TNr | Nl, g |
| 27 | M | 15 | 6 | SGS | CBZ, VPA, PHT | TNr | nd, g |
| 28 | M | 24 | 22 | SGS | CBZ, VPA, PB, TPM, CLB | TNl | nl, nd, g |
| 39 | F | 22 | 5 | SGS | CBZ, VPA, CLB | TNr | nl, g |
| 30 | F | 18 | 16 | SGS | CBZ, PB, VPA | TNl | nd, g |
Footnotes: CBZ, carbamazepine; PHT, phenytoin; VPA, valproic acid; PB, phenobarbital; TPM, topiramate; CLB, clonazepam; PRM, primaclone; NIM, nimodipine; TN, temporal neocortex; nl, neuronal loss; nd, neuronal degeneration; g, gliosis; SGS, secondarily generalized seizure; CPS, complex partial seizure; l, left; R, right; F, female; M, male.
For comparison, 15 histologically normal temporal neocortex samples were collected as controls from individuals treated for increased intracranial pressure due to head trauma. All patients were histopathologically diagnosed as brain trauma, and had no prior history of seizures and nor other neurologic disorders. Their brain structures were nearly normal. The same two neuropathologists reviewed all these cases. Table 2 shows the clinical features of controls.
Table 2.
Clinical characteristics of control patients
| Gender | Age (year) | Etiological diagnosis | Resection tissue | Adjacent tissue pathology |
|---|---|---|---|---|
| Male | 48 | Trauma | TNl | Normal |
| Female | 22 | Trauma | TNl | Normal |
| Male | 31 | Trauma | TNl | Normal |
| Male | 23 | Trauma | TNr | Normal |
| Female | 20 | Trauma | TNr | Normal |
| Male | 46 | Trauma | TNl | Normal |
| Male | 21 | Trauma | TNr | Normal |
| Male | 29 | Trauma | TNl | Normal |
| Female | 42 | Trauma | TNr | Normal |
| Male | 38 | Trauma | TNl | Normal |
| Male | 38 | Trauma | TNl | Normal |
| Female | 17 | Trauma | TNr | Normal |
| Male | 48 | Trauma | TNl | Normal |
| Female | 18 | Trauma | TNr | Normal |
| Female | 10 | Trauma | TNl | Normal |
Footnotes: TN, temporal neocortex; l, left; r, right.
Our study was approved by the National Institutes of Health and the ethics committee on human research at Chongqing Medical University in accordance with The Code of Ethics of the World Medical Association (Declaration of Helsinki) for experiments involving humans and EU Directive 2010/63/EU for animal experiments. Informed consent was obtained from patients or their relatives.
Rat TLE model
The Lithium-pilocarpine (Li-Pilo) rat model has been widely used as a model for simulating human TLE [26]. Adult male Sprague-Dawley rats (12 weeks old) weighing 180-220 g were purchased from the Experimental Animal Center of Chongqing Medical University, China. Rats were housed under controlled environmental conditions (temperature: 26°C; humidity: 50-60%, 12 h/12 h light-dark cycle) and given ad libitum accessed to standard food and water. The experiments on animals were approved by the Ethical Commission of Chongqing Medical University and were in accordance with international standards.
Rats were divided into control group and TLE group. Rats in TLE group were sacrificed at different time points after status epilepticus (SE): 6 h, 24 h, 72 h, 7 d, 14 d, 30 d, and 60 d (n = 8 per time point). Lithium chloride (127 mg/kg, i.p., Sigma, USA) and atropina (1 mg/kg, i.p.) were injected at 20 h and 30 min prior to the administration of pilocarpine (35 mg/kg, i.p., Sigma, USA), respectively. Rats then received repeated injections of pilocarpine (10 mg/kg, i.p.) every 10 min until they developed seizures of stage 4 [27]. In control group, rats were injected with equal volume of normal saline instead of pilocarpine. After epileptic seizure of stage 4 and stage 5 according to the Racine’s scale [27], rats were maintained in the state of seizure for 1 h, and then injected with diazepam (10 mg/kg, i.p.) and atropina (1 mg/kg, i.p.) to terminate seizures. Rats exhibiting epileptic seizures of under stage 4 were excluded.
Tissue processing
Human tissues
Temporal neocortexs of TLE patients are divided into two portions. One was immediately placed in liquid nitrogen for Western blot assay and PCR, and the other was fixed in 4% paraformaldehyde for 48 h, and then embedded in paraffin for immunohistochemistry. Brain tissues in control group were prepared with the same procedures.
Animal tissues
Rats were sacrificed by decapitation after intraperitoneal administration of 3.5 mg/kg hydrated chloral (1 ml/kg i.p.). Two slides of hippocampus were dissected, and then stored in liquid nitrogen for Western blot assay and RT-PCR. The remaining rats in each group were anesthetized and perfused with normal saline followed by 4.0% paraformaldehyde. Brain tissues were immediately fixed in 4% paraformaldehyde for 24 h, embedded in paraffin and sectioned at 5 μm for immunohistochemistry.
Immunohistochemistry
After paraffinization and dehydration, tissues were incubated in H2O2 (3%, 20 min) to block the activity of endogenous peroxide, and then antigen retrieval was done in a microwave oven for 4 min at 92-98°C in 10 mmol/L sodium citrate buffer (pH 6.0). Non-specific binding was blocked by incubating the sections with 10% goat serum (Zhongshan Golden Bridge Inc., Beijing, China) at 37°C for 30 min. Then, sections were incubated with primary p-CREB antibody (rabbit polyclonal antibody, 1:60, Santa Cruz, USA) for 2 h at 4°C followed by incubation for 1 h at 37°C, These sections were treated with anti-rabbit secondary antibody for 25 min at 37°C, and then ABC solution (Zhongshan Golden Bridge Inc., Beijing, China) at 37°C for 25 min. Immunoreactivity was visualized with DAB (Zhongshan Golden Bridge, Inc., Beijing, China). The LEICA DM6000B automatic microscope (Leica, Germany) was used to collect images. Ten fields were randomly selected for each sample and analyzed automatically and semi-quantitatively using the Image-Pro Plus 6.0 image analysis system.
Western blot assay
Total proteins were extracted from the brain tissues using the whole protein extraction kit (Keygen Biotech, Nanjing, China). Protein concentrations were determined with the Enhanced BCA Protein Assay Kit (Beyotime, Haimen, China). Proteins (50-100 μg per lane) were separated by SDS-PAGE (5% stacking gel, 60 V, 30 min; 10% separating gel, 100 V, 60 min), and then were electrotransferred onto polyvinylidene fluoride (PVDF) membranes at 250 mA for 60 min. PVDF membranes were incubated at 37°C for 60 min in 5% skim milk to block non-specific binding, and incubated with primary p-CREB antibody (rabbit polyclonal antibody, 1:50, Santa Cruz, USA) and primary β-actin antibody (rabbit polyclonal antibody, 1:1000, Santa Cruz, USA) at 4°C overnight. After washing with Tween-20-Tris-buffered saline (TTBS) four times (10 min per time), membranes were incubated with a horseradish peroxidase-conjugated secondary antibody (goat anti-rabbit IgG-HRP, 1:4000, Zhongshan Golden Bridge Inc., Beijing, China) for 60 min at 37°C and washed with TTBS four times (10 min per time). The protein bands were visualized with an enhanced chemiluminescence substrate (Pierce, USA) and scanned (Bio-Rad Laboratories). The optical density (OD) of these bands was quantified using the Quantity One software (Bio-Rad Laboratories). The mean OD of p-CREB relative to β-actin was determined.
RNA isolation and reverse transcription
Total RNA was extracted from the brain tissues using RNAiso plus (TaKaRa, Dalian, China) according to the manufacturer’s instructions. The concentration and purity of RNA were measured at 260 (A260) and 280 (A280) nm. The RNA samples were used for reverse transcription (RT) reaction when the A260/A280 was between 1.90 and 2.20. Then, 1 μg of total RNA was added into 10 μl of RT system using the SYBR® PrimeScript™ miRNA RT-PCR Kit (TaKaRa, Dalian, China). The RT reaction was done under the following conditions: (1) 37°C for 60 min; (2) 85°C for 5 s. For each RT reaction, a blank control was prepared using all the reagents, but the RNA was replaced with an equivalent volume of water. Each reaction mixture was diluted to 100 μl for real-time PCR.
SYBR-Green quantitative real-time PCR
Real-Time PCR was done on BIO-RED CFX96. SYBR® Premix Ex Taq™ II (TaKaRa, Dalian, China), Uni-miR qPCR Primer (TaKaRa, Dalian, China) and miR-132 specific primer (F 5’-GCCGCTAACAGTCTACAGCCAT-3’) (Genscript, China) were used. The PCR mixture contained 10 μl of SYBR® Premix Ex Taq™ II, 0.5 μl of 10 μM Uni-miR qPCR Primer, 0.5 μl of miR-132 specific primer, 1 μl of RT reaction solution and 8 μl of dH2O. The real-time PCR was done under the following conditions: stage 1, 95°C for 30 s; stage 2, a total of 40 cycles of 95°C for 5 s and 60°C for 20 s; stage 3, dissociation. Standard curves of miR-132 and β-actin were delineated to assure the efficiencies of amplification between 90% and 110%. After PCR, the amplification and melting curves were checked, and data were analyzed with the software (Bio-Rad CFX Manager) and represented as mean 2-ΔΔCT ± standard deviation (SD). Beta-actin (primer F 5’-AGGCCCCTCTGAACCCTAAG-3’) was used for normalization.
Data analysis
Data are expressed as means ± SD. Student’s t-test (SPSS 17) was used for statistical analysis of differences between epileptic group and control group in humans.
Differences among animal groups were compared by one-way ANOVA followed by turkey’s HSD post hoc multiple comparison test (Graph-Pad Prism 5). A value of P less than 0.05 was considered statistically significant.
Results
Demographic and clinical characteristics of patients
The mean age of patents with drug-refractory TLE was 35.10 ± 17.67 years and there were 21 men and 9 women. In addition, 50% of patients had at least a 10-year history of seizure, and 33.3% had a clinical history of more than 15 years. In control group, patients had a mean age of 30.06 ± 12.49 years, and there were 9 men and 6 women. There were no significant differences in age and gender between IE group and control group (P > 0.05). Independent samples test and Chi-square test were used for comparisons.
MiR-132 expression in the hippocampus of TLE rats in different phases of epilepsy
MiR-132 expression at different times after SE was detected by real-time PCR (Figure 1A). Beta-actin was used for normalization. In TLE rats, the miR-132 expression (n = 3 per group) was significantly up-regulated at 24 h (2.25 ± 0.10, P < 0.05) and 7 d (1.80 ± 0.11, P < 0.05) after SE. Although the miR-132 expression up-regulated at 3 d (1.28 ± 0.13, P > 0.05), 14 d (1.07 ± 0.11, P > 0.05), 30 d (1.12 ± 0.10, P > 0.05) and 60 d (1.32 ± 0.08, P > 0.05) after SE, no significance was observed as compared to control group.
Figure 1.
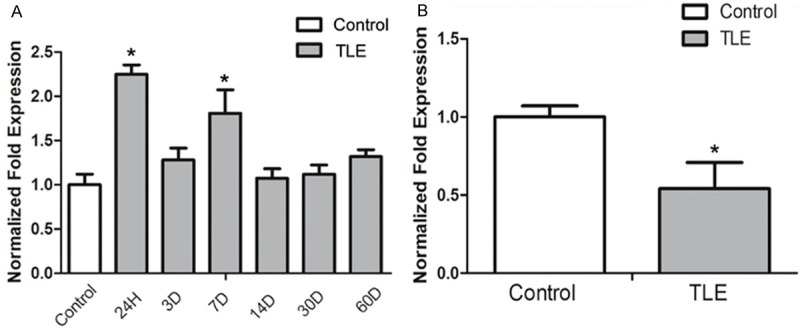
miR-132 expression in the hippocampus of SLE rats and the temporal neocortex of TLE patients by Real-Time PCR approach. A: The expression of miR-132 expression had a significant difference at the 24 h and 7 d time point in SLE rat models when compared with controls (*P < 0.05). B: There was a significant decrease in the miR-132 expression in the temporal neocortex of TLE patients when compared with controls (*P < 0.05).
MiR-132 expression in the temporal neocortex of TLE patients
The miR-132 expression in the temporal neocortex was detected in TLE patients (Figure 1B). In human subjects, the miR-132 expression normalized to β-actin was significantly lower in the TLE patients (0.32 ± 0.34, P < 0.05) than in controls. The change in miR-132 expression was not in strict accordance with the p-CREB expression in rat model.
P-CREB expression by Western blot assay
P-CREB expression was detected in the hippocampus of TLE rats and the temporal neocortex of TLE patients by Western blot assay (Figure 2A and 2B). Molecular weight of p-CREB and β-actin were both 43 kDa. In TLE rats (n = 5 per group), the p-CREB expression was up-regulated at 6 h after SE but no significance was observed, and the p-CREB expression continued to increase, and significant difference was observed at 24 h (0.63 ± 0.07), 3 d (0.83 ± 0.20) and 7 d (0.71 ± 0.31) after SE as compared to control group (0.29 ± 0.03; P < 0.5). When the rats were in the latency phase of TLE, there was a slight decline in the p-CREB expression when compared with that in the acute phase, and with the control group (P > 0.05). In patients with drug-refractory TLE, the p-CREB expression was up-regulated significantly (0.42 ± 0.20; P < 0.05) when compared with control group (0.26 ± 0.10; Figure 2C and 2D).
Figure 2.
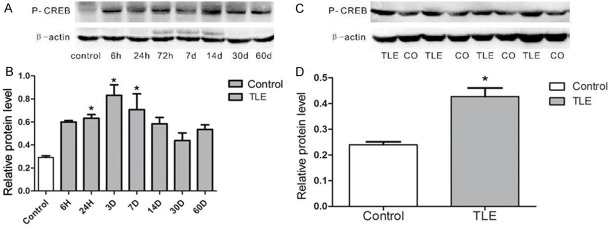
p-CREB expression was detected in the hippocampus of SLE rats and TLE patients by the Western blot assay. A: Lane one shows p-CREB expression in normal rats, lanes 2-8 show p-CREB expression in the SLE rat epileptic models at the time points of 6 h, 24 h, 72 h, 7 d, 14 d, 30 d and 60 d after inducing TLE respectively. B: Pp-CREB expression was significantly up-regulated at the time point 24 h, 3 d or/and 14 d (*P < 0.05). C: Lane 1, 3, 5, and 7 show p-CREB expression in patients with drug-refractory TLE; lane 2, 4, 6, and 8 show p-CREB expression in controls. D: The relative protein level indicated p-CREB expression level was significantly higher in TLE the patients (*P < 0.05).
p-CREB expression by immunohistochemistry
The p-CREB expression was detected in TLE rats and TLE patients by immunohistochemistry (Figure 3). Results showed p-CREB was expressed in the nucleus of neurons in the subfields of hippocampus (dentate gyrus, CA1 and CA3 region) (Figure 3A and 3B). p-CREB expression was up-regulated at all time points after SE (P < 0.05). In patients with drug-refractory TLE, the p-CREB expression increased markedly (0.42 ± 0.06; P < 0.05) when compared with control group (0.23 ± 0.02; Figure 3C and 3D).
Figure 3.
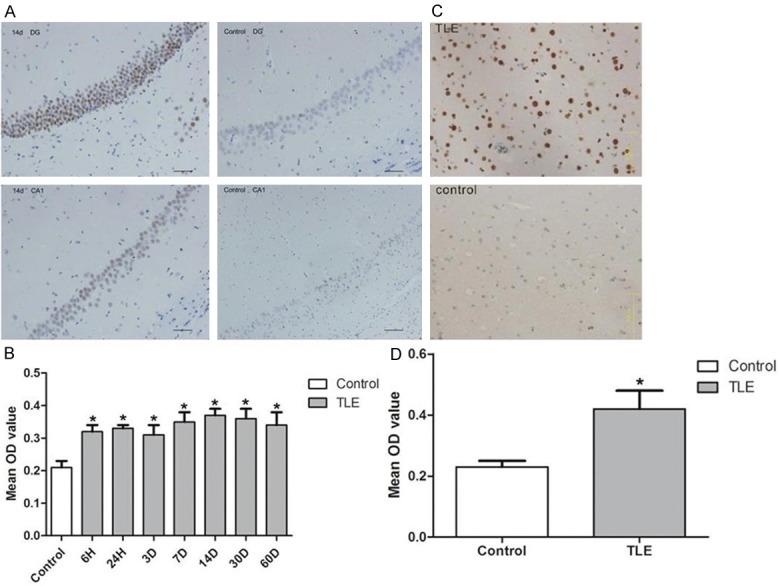
p-CREB expression in rats and patients with TLE by immunohistochemistry. A: The p-CREB positive cells were located in the hippocampusal neurons, such as pyramidal cells and dentate granule cells. In the hippocampus CA1 region and dentate gyrus of the hippocampus, p-CREB expression in the TLE model rats was higher at the time point of 14 d than in controls. B: The mean OD value indicates that p-CREB expression increased at all the time points after inducing SE, and there was significant difference in p-CREB expression between normal rats and epileptic rats at these time points (*P < 0.05). C: In patients with TLE, p-CREB was expressed strongly in the neurons, but expressed faintly weakly in the neurons of temporal neocortex neurons of control groups. D: The mean OD value indicated p-CREB expression level was significantly higher in TLE patients with TLE than the in controls (*P < 0.05). Scale bar = 75 μm.
Discussion
MFS is a characteristic pathophysiology in patients with the drug-refractory TLE, and increased dendritic thickness and length accompanied by an increase in the number of dendritic spines are associated with the afferent sprouting [28-30]. miR-132, which is CREB-dependent, has been revealed to regulate the dendritic structural plasticity (dendritic length, volume and the number of spines in vitro) [11,13,14]. Whether the p-CREB/miR-132 signal pathway is involved in the pathogenesis of TLE is still unclear. In the present study, rat Li-Pilo model was established to simulate human TLE, and the expression of p-CREB and miR-132 was detected in TLE patients and TLE rats.
Immunohistochemistry showed p-CREB was highly expressed in rats at all time points after SE and in TLE patients. The p-CREB positive staining was located in the neuronal nucleus of hippocampus (such as pyramidal cells and dentate granule cells); there was no positive staining in the microglial cells and astrocytes (Figure 4). Western blot assay indicated p-CREB expression was up-regulated at 6 h after SE but there was no significance. The p-CREB expression continued to increased at 24 h, 3 d and 7 d after SE (P < 0.05) when compared with control group. However, there was a slight decline in the latency phase of SE as compared to that in the acute phase and that in control group. When compared with findings in immunohistochemistry, the up-regulated expression was comparable between hyperacute phase and latent phase in Western blot assay. That may be explained as follows: a. the sample size was too small to draw the conclusion (n = 5 per group for western blot assay); b. immunohistochemistry was more accessible to get the significant difference as its advantages in analysis, and we only collected 3 brain tissues for this detection; c. the whole hippocampus was used for Western blot assay, and findings were influenced by the compositions of total protein. It has been addressed that the neuronal loss, microglia and astroglia cell proliferation significantly occur in the latent and chronic phases [31,32]. Considering the above context, they were not conflicting between results acquired by two measurements. As a result, the p-CREB expression was significantly up-regulated in the neurons of SLE rats and TLE patients.
Figure 4.
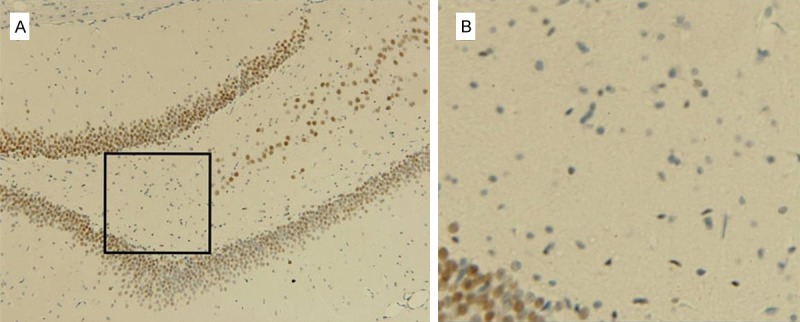
p-CREB positive staining in the dentate gyrus after 60 days of after inducing SE by immunohistochemistry. (A) p-CREB positive staining was located in the nucleus of hippocampus neurons nucleus of hippocampus, (such as pyramidal cells and dentate granule cells). (B) The magnified inset image of (A) showed s there was no positive staining in the hilus of the dentate gyrus containing abundant in microglial cells or astrocytes.
The expression of miR-132, an activity-dependent RNA, was increased in pyramidal cells and granule cells as the neurons became mature. RT-PCR was done to detect the expression of miR-132. Results showed the miR-132 was up-regulated at 24 h and 7 d after SE in TLE rats with significant difference, but no marked difference was observed at other time points as compared to control group. This may be explained as that the sample size was small (3 hippocampus tissues per group were used for RT-PCR). There was a decline in miR-132 expression at 3 d after SE when compared with that at 24 h. It mainly attributed to the high expression of inducible cAMP early repressor (ICER) which may down-regulate the CREB expression, and ICER expression may be regulated by the overexpression of CREB consequently in the acute phase [33-36]. When the negative feedback trended to be static, miR-132 was highly expressed again though there was slight to medium neural loss at this time point. In the latent phase, there was no significant increase in miR-132 expression when compared with controls, because the massive neuronal loss and microglia and astroglia cell proliferation were present at this time point, and MFS pathogenesis occurred meanwhile [31,32]. If it was taken into account, the conclusion could be drawn that miR-132 expression in the neurons was also up-regulated in the latent phase, or it was down-regulated by another signal molecules. We also measured the miR-132 expression in TLE patients. There was a significant decrease in miR-132 expression when compared with controls. This may be attributed to the massive neuronal loss, and microglia and astroglia cell proliferation due to long-term influence of epilepsy (Table 1). However, a previous genome-wide expression analysis of miRNAs in controls as compared to epileptic subjects did not identify the association between miR-132 with refractory TLE [37]. This might be attributed to the differences in the source of samples, causes and abundance of samples.
In conclusion, the expression of p-CREB and miR-132 is highly up-regulated in the neurons of TLE rats and patients with drug-refractory TLE when compared with controls. Our findings demonstrate that the p-CREB/miR-132 signal pathway participates in the epileptogenesis. Further studies are still needed to validate the role of this signal pathway in the epileptogenesis.
Acknowledgements
This work was supported by National Natural Science Foundation of China (No.81171225) and Chongqing Health Bureau Key Medical Research Project (2010-1-36). The authors thank the patients and their families for their participation in this study. We thank The Affiliated First Hospital of Chongqing Medical University for brain tissue processing, and the National Institutes of Health of China and the Ethics Committee on Human Research of the Chongqing Medical University.
Disclosure of conflict of interest
None.
References
- 1.Sutula T, Cascino G, Cavazos J, Parada I, Ramirez L. Mossy fiber synaptic reorganization in the epileptic human temporal lobe. Ann Neurol. 1989;26:321–330. doi: 10.1002/ana.410260303. [DOI] [PubMed] [Google Scholar]
- 2.Babb TL, Kupfer WR, Pretorius JK, Crandall PH, Levesque MF. Synaptic reorganization by mossy fibers in human epileptic fascia dentata. Neuroscience. 1991;42:351–363. doi: 10.1016/0306-4522(91)90380-7. [DOI] [PubMed] [Google Scholar]
- 3.Gardiner J, Marc J. Disruption of normal cytoskeletal dynamics may play a key role in the pathogenesis of epilepsy. Neuroscientist. 2010;16:28–39. doi: 10.1177/1073858409334422. [DOI] [PubMed] [Google Scholar]
- 4.Ambros V. The functions of animal microRNAs. Nature. 2004;431:6. doi: 10.1038/nature02871. [DOI] [PubMed] [Google Scholar]
- 5.Bartel DP. MicroRNAs: genomics, biogenesis, mechanism, and function. Cell. 2004;116:281–297. doi: 10.1016/s0092-8674(04)00045-5. [DOI] [PubMed] [Google Scholar]
- 6.Kan A. Profiling cytokines in temporal lobe epilepsy. Geneeskunde Proefschriften. 2012 [Google Scholar]
- 7.Song YJ, Tian XB, Zhang S, Zhang YX, Li X, Li D, Cheng Y, Zhang JN, Kang CS, Zhao W. Temporal lobe epilepsy induces differential expression of hippocampal miRNAs including let-7e and miR-23a/b. Brain Res. 2011;1387:134–140. doi: 10.1016/j.brainres.2011.02.073. [DOI] [PubMed] [Google Scholar]
- 8.Barbato C, Giorgi C, Catalanotto C, Cogoni C. Thinking about RNA? MicroRNAs in the brain. Mamm Genome. 2008;19:541–551. doi: 10.1007/s00335-008-9129-6. [DOI] [PubMed] [Google Scholar]
- 9.Jimenez-Mateos EM, Engel T, Merino-Serrais P, McKiernan RC, Tanaka K, Mouri G, Sano T, O’Tuathaigh C, Waddington JL, Prenter S, Delanty N, Farrell MA, O’Brien DF, Conroy RM, Stallings RL, DeFelipe J, Henshall DC. Silencing microRNA-134 produces neuroprotective and prolonged seizure-suppressive effects. Nat Med. 2012;18:1087–1094. doi: 10.1038/nm.2834. [DOI] [PMC free article] [PubMed] [Google Scholar]
- 10.Luikart BW, Bensen AL, Washburn EK, Perederiy JV, Su KG, Li Y, Kernie SG, Parada LF, Westbrook GL. miR-132 mediates the integration of newborn neurons into the adult dentate gyrus. PLoS One. 2011;6:e19077. doi: 10.1371/journal.pone.0019077. [DOI] [PMC free article] [PubMed] [Google Scholar]
- 11.Impey S, Davare M, Lesiak A, Fortin D, Ando H, Varlamova O, Obrietan K, Soderling TR, Goodman RH, Wayman GA. An activity-induced microRNA controls dendritic spine formation by regulating Rac1-PAK signaling. Mol Cell Neurosci. 2010;43:146–156. doi: 10.1016/j.mcn.2009.10.005. [DOI] [PMC free article] [PubMed] [Google Scholar]
- 12.Nudelman AS, DiRocco DP, Lambert TJ, Garelick MG, Le J, Nathanson NM, Storm DR. Neuronal activity rapidly induces transcription of the CREB-regulated microRNA-132, in vivo. Hippocampus. 2010;20:492–498. doi: 10.1002/hipo.20646. [DOI] [PMC free article] [PubMed] [Google Scholar]
- 13.Wayman GA, Davare M, Ando H, Fortin D, Varlamova O, Cheng HY, Marks D, Obrietan K, Soderling TR, Goodman RH, Impey S. An activity-regulated microRNA controls dendritic plasticity by down-regulating p250GAP. Proc Natl Acad Sci U S A. 2008;105:9093–9098. doi: 10.1073/pnas.0803072105. [DOI] [PMC free article] [PubMed] [Google Scholar]
- 14.Vo N, Klein ME, Varlamova O, Keller DM, Yamamoto T, Goodman RH, Impey S. A cAMP-response element binding protein-induced microRNA regulates neuronal morphogenesis. Proc Natl Acad Sci U S A. 2005;102:16426–16431. doi: 10.1073/pnas.0508448102. [DOI] [PMC free article] [PubMed] [Google Scholar]
- 15.Hansen KF, Sakamoto K, Wayman GA, Impey S, Obrietan K. Transgenic miR132 alters neuronal spine density and impairs novel object recognition memory. PLoS One. 2010;5:e15497. doi: 10.1371/journal.pone.0015497. [DOI] [PMC free article] [PubMed] [Google Scholar]
- 16.Scott HL, Tamagnini F, Narduzzo KE, Howarth JL, Lee YB, Wong LF, Brown MW, Warburton EC, Bashir ZI, Uney JB. MicroRNA-132 regulates recognition memory and synaptic plasticity in the perirhinal cortex. Eur J Neurosci. 2012;36:2941–2948. doi: 10.1111/j.1460-9568.2012.08220.x. [DOI] [PMC free article] [PubMed] [Google Scholar]
- 17.Shaltiel G, Hanan M, Wolf Y, Barbash S, Kovalev E, Shoham S, Soreq H. Hippocampal microRNA-132 mediates stress-inducible cognitive deficits through its acetylcholinesterase target. Brain Struct Funct. 2013;218:59–72. doi: 10.1007/s00429-011-0376-z. [DOI] [PMC free article] [PubMed] [Google Scholar]
- 18.Jimenez-Mateos EM, Bray I, Sanz-Rodriguez A, Engel T, McKiernan RC, Mouri G, Tanaka K, Sano T, Saugstad JA, Simon RP, Stallings RL, Henshall DC. miRNA Expression profile after status epilepticus and hippocampal neuroprotection by targeting miR-132. Am J Pathol. 2011;179:2519–2532. doi: 10.1016/j.ajpath.2011.07.036. [DOI] [PMC free article] [PubMed] [Google Scholar]
- 19.Wu H, Zhou Y, Xiong ZQ. Transducer of regulated CREB and late phase long-term synaptic potentiation. FEBS J. 2007;274:3218–3223. doi: 10.1111/j.1742-4658.2007.05891.x. [DOI] [PubMed] [Google Scholar]
- 20.Benito E, Barco A. CREB’s control of intrinsic and synaptic plasticity: implications for CREB-dependent memory models. Trends Neurosci. 2010;33:230–240. doi: 10.1016/j.tins.2010.02.001. [DOI] [PubMed] [Google Scholar]
- 21.Xu ZC, Chen YM, Xu P, Liu H, Xie YL, Zeng KB. Epileptiform discharge upregulates p-ERK1/2, growth-associated protein 43 and synaptophysin in cultured rat hippocampal neurons. Seizure. 2009;18:680–685. doi: 10.1016/j.seizure.2009.09.004. [DOI] [PubMed] [Google Scholar]
- 22.Hu B, Liu C, Bramlett H, Sick TJ, Alonso OF, Chen S, Dietrich WD. Changes in trkB-ERK1/2-CREB/Elk-1 pathways in hippocampal mossy fiber organization after traumatic brain injury. J Cereb Blood Flow Metab. 2004;24:934–943. doi: 10.1097/01.WCB.0000125888.56462.A1. [DOI] [PubMed] [Google Scholar]
- 23.Thomas AM, Corona-Morales AA, Ferraguti F, Capogna M. Sprouting of mossy fibers and presynaptic inhibition by group II metabotropic glutamate receptors in pilocarpine-treated rat hippocampal slice cultures. Neuroscience. 2005;131:303–320. doi: 10.1016/j.neuroscience.2004.11.002. [DOI] [PubMed] [Google Scholar]
- 24.de Armentia ML, Jancic D, Olivares R, Alarcon JM, Kandel ER, Barco A. cAMP response element-binding protein-mediated gene expression increases the intrinsic excitability of CA1 pyramidal neurons. J Neurosci. 2007;27:13909–13918. doi: 10.1523/JNEUROSCI.3850-07.2007. [DOI] [PMC free article] [PubMed] [Google Scholar]
- 25.Zhu X, Han X, Blendy JA, Porter BE. Decreased CREB levels suppress epilepsy. Neurobiol Dis. 2012;45:253–263. doi: 10.1016/j.nbd.2011.08.009. [DOI] [PMC free article] [PubMed] [Google Scholar]
- 26.Majores M, Schoch S, Lie A, Becker AJ. Molecular neuropathology of temporal lobe epilepsy: complementary approaches in animal models and human disease tissue. Epilepsia. 2007;48(Suppl 2):4–12. doi: 10.1111/j.1528-1167.2007.01062.x. [DOI] [PubMed] [Google Scholar]
- 27.Racine RJ, Gartner JG, Burnham WM. Epileptiform activity and neural plasticity in limbic structures. Brain Res. 1972;47:262–268. doi: 10.1016/0006-8993(72)90268-5. [DOI] [PubMed] [Google Scholar]
- 28.Isokawa M. Remodeling Dendritic Spines of Dentate Granule Cells in Temporal Lobe Epilepsy Patients and the Rat Pilocarpine Model. Epilrpsiu. 2000;41:S14–7. doi: 10.1111/j.1528-1157.2000.tb01550.x. [DOI] [PubMed] [Google Scholar]
- 29.Freiman TM, Eismann-Schweimler J, Frotscher M. Granule cell dispersion in temporal lobe epilepsy is associated with changes in dendritic orientation and spine distribution. Exp Neurol. 2011;229:332–338. doi: 10.1016/j.expneurol.2011.02.017. [DOI] [PubMed] [Google Scholar]
- 30.Suzuki F, Makiura Y, Guilhem D, Sorensen JC, Onteniente B. Correlated axonal sprouting and dendritic spine formation during kainate-induced neuronal morphogenesis in the dentate gyrus of adult mice. Exp Neurol. 1997;145:203–213. doi: 10.1006/exnr.1997.6469. [DOI] [PubMed] [Google Scholar]
- 31.Borges K. Neuronal and glial pathological changes during epileptogenesis in the mouse pilocarpine model. Exp Neurol. 2003;182:21–34. doi: 10.1016/s0014-4886(03)00086-4. [DOI] [PubMed] [Google Scholar]
- 32.André V, Dubé C, François J, Leroy C, Rigoulot MA, Roch C, Namer IJ, Nehlig A. Pathogenesis and Pharmacology of Epilepsy in the Lithium- pilocarpine Model. Epilepsia. 2007;48:41–47. doi: 10.1111/j.1528-1167.2007.01288.x. [DOI] [PubMed] [Google Scholar]
- 33.Borlikova G, Endo S. Inducible cAMP early repressor (ICER) and brain functions. Mol Neurobiol. 2009;40:73–86. doi: 10.1007/s12035-009-8072-1. [DOI] [PMC free article] [PubMed] [Google Scholar]
- 34.Walker WH, Daniel PB, Habener JF. Inducible cAMP early repressor ICER down-regulation of CREB gene expression in Sertoli cells. Mol Cell Endocrinol. 1998;143:167–178. doi: 10.1016/s0303-7207(98)00082-3. [DOI] [PubMed] [Google Scholar]
- 35.Sassone-Corsi P. Coupling gene expression to cAMP signalling: role of CREB and CREM. Int J Biochem Cell Biol. 1998;30:27–38. doi: 10.1016/s1357-2725(97)00093-9. [DOI] [PubMed] [Google Scholar]
- 36.Molina CA, Foulkes NS, Lalli E, Sassone-Corsi P. Inducibility and negative autoregulation of CREM: an alternative promoter directs the expression of ICER, an early response repressor. Cell. 1993;75:875–886. doi: 10.1016/0092-8674(93)90532-u. [DOI] [PubMed] [Google Scholar]
- 37.Kan AA, van Erp S, Derijck AA, de Wit M, Hessel EV, O’Duibhir E, de Jager W, Van Rijen PC, Gosselaar PH, de Graan PN, Pasterkamp RJ. Genome-wide microRNA profiling of human temporal lobe epilepsy identifies modulators of the immune response. Cell Mol Life Sci. 2012;69:3127–3145. doi: 10.1007/s00018-012-0992-7. [DOI] [PMC free article] [PubMed] [Google Scholar]