

Abstract
Background
Mild traumatic brain injury is a serious public health concern, affecting more than 1.7 million people in the United States annually. Mild TBI is difficult to diagnose and is clinically associated with impaired motor coordination and cognition.
Methods
Mice were subjected to a mild TBI (mTBI-1 or mTBI-2) induced by a weight drop model. Brain injury was assessed histologically and biochemically, the latter by serum neuron specific enolase (NSE) and glial fibrillary acidic protein (GFAP). Systemic and brain inflammation were measured by cytokine array. Blood brain barrier (BBB) integrity was determined by cerebral vascular leakage of micromolecular and macromolecular fluorescent molecules. Mice were evaluated using a rotarod device and novel object recognition to measure motor coordination and cognition, respectively.
Results
Mice undergoing mTBI-1 or mTBI-2 had significant deficits in motor coordination and cognition for several days after injury compared to controls. Furthermore, we found both mTBI-1 and mTBI-2 caused micromolecular leakage in the BBB, whereas only mTBI-2 caused macromolecular leakage. Serum NSE and GFAP were elevated acutely and corresponded to the degree of injury, but returned to baseline within 24 hours. Serum cytokines interleukin-6 (IL-6) and keratinocyte-derived chemokine (KC) were significantly increased within 90 minutes of TBI. IL-6 levels correlated with the degree of injury.
Conclusion
The current study provides a reproducible model of mild TBI in mice that exhibits pathological features of mild TBI in humans. Furthermore, our data suggest that serum cytokines, such as IL-6, may be effective biomarkers for severity of head injury.
Keywords: TBI, inflammation, combat casualty care, trauma, cytokines, chemokines
Introduction
Traumatic brain injury (TBI) is a serious public health concern for both civilian and military populations. In the civilian setting, there are over 1.7 million cases of TBI each year in the United States, and severe TBI is the leading cause of death after trauma(Thurman, Alverson et al. 1999; Fujimoto, Longhi et al. 2004; Faul M 2010). In the military setting, TBI is the “signature injury” of the current conflicts in the Middle East (Okie 2005; Wojcik, Stein et al. 2010). The annual economic burden for TBIs in the United States is over 70 billion dollars, due to the long-term or lifelong assistance needed as a result of the physical, cognitive and psychosocial sequelae of TBI (Thurman, Alverson et al. 1999; Fujimoto, Longhi et al. 2004; Faul M 2010). The majority of TBIs that occur are categorized as mild (Langlois, Rutland-Brown et al. 2006; Elder and Cristian 2009). Due to the minimal symptoms after a mild TBI (mTBI), many of these individuals do not seek medical attention. Therefore, the number of patients with mTBI is likely severely underestimated.
Due to the long-term problems associated with mTBI, many animal models have been developed to reproduce the pathologic changes associated with this injury. However, many of these models are non-physiological or fail to replicate the functional deficits observed in humans. In the current study, we developed a model of mTBI in mice using a closed-head, weight-drop technique. This model shows significant disruption to the blood-brain barrier, local and systemic inflammation, and functional deficits in cognition and motor coordination.
Methods
Animals
Male C57/BL6 mice (Jackson, ME) aged 8–10 weeks were used in experiments. Animals were acclimated for at least 1 week and were housed in controlled conditions with 12-hour light-dark cycle. The mice had free access to water and standard chow. All experiments were approved by the Institutional Animal Care and Use Committee of the University of Cincinnati.
Traumatic Brain Injury Model
Closed head injury was performed by using a weight drop device. Each mouse was anesthetized for 2 minutes with 2% isoflurane in 100% oxygen at 1 L/min. Animals were then placed in a prone position on the platform below the weight so the alignment device sat between the eyes and ears of the mouse (posterior to the coronal sutures). Head injury was induced by dropping the cylindrical rod from 1.5 centimeters. The weight of the rod was varied from 400 to 500 grams to obtain a head injury (mTBI-1 or mTBI-2). Sham-injury mice were anesthetized with isoflurane, but were not subjected to the head injury. Mice were euthanized by injection of sodium pentobarbital (300μg) followed by cervical dislocation.
Injury Evaluation
Immediately following head injury, righting reflex response (RRR) was evaluated. RRR is defined as the animal’s ability to right itself from a supine to prone position. Time to achieve this reflex was recorded for each animal.
Blood Brain Barrier
Animals were anesthetized with 2% isoflurane in 100% oxygen at 1 L/min for 2 minutes and then restrained in a supine position and maintained with 2% isoflurane in 100% oxygen at 1 L/min. Each mouse was then injected with 0.3 ml of a fluorescent solution intravenously. The solutions consisted of either Lucifer yellow or FITC labeled albumin. 25 μg of Lucifer yellow, CH lithium salt (Sigma) was mixed with 1 mL of 0.1 M sodium phosphate buffer. FITC labeled albumin (Sigma) was made per protocol. These solutions were then further diluted to 10 mL. Immediately following injection, injury was induced to each mouse. Each mouse was then sacrificed at 90 minutes or six hours then perfused with 10cc of 4% formalin via inferior vena cava cannulation. Each animal was decapitated and brains were extracted and placed into 4% formalin, then transferred to ethanol after 24 hours. Each brain was fixed and prepared by protocol. 5 μm slices were cut and placed on glasses slides and remained unstained. All sections of brains were visualized in the FITC wavelength under a fluorescent microscope to evaluate for vascular leakage.
Histology
Animals were given either a mTBI-1 or mTBI-2. Each mouse was sacrificed 6 hours after injury then perfused with 10cc of 4% formalin. Each animal was decapitated and brains were extracted and placed into 4% formalin. Each brain was fixed and prepared by protocol. Standard preparation for hematoxylin and eosin staining was done and evaluated by light microscopy.
Magnetic Resonance Imaging
After injury, mice were sacrificed and brains were removed 24 hours after injury. Formalin fixation was done for 24 hours, and the ex vivo brains were evaluated with Diffusion Tensor Imaging. In vivo MRI evaluation was also completed 48 hours after injury.
Serum/Tissue analysis
Animals were sacrificed 90 minutes, 6 hours, and 24 hours after injury. Blood samples were obtained by cardiac puncture. Brain samples were obtained after decapitation. Cortical samples were homogenized in 1 mL of phosphate buffered solution containing a complete protease inhibitor (Roche, IN). Supernatant was centrifuged 3 times at 12,000 for 15 minutes each. Blood samples underwent a centrifugation of 8000 rpm for 10 minutes in serum separator tubes. All samples were stored at −80*C until analysis. Blood and brain samples were evaluated at each time point for 13 different chemokines and cytokines by a multiplex ELISA (Quansys, UT). Chemokines included in the multiplex are: GMCSF, IFN-γ, IL-1α, IL-1β, IL-6, IL-10, KC, MCP-1, MDC, MIP-1α, MIP-2, Rantes, and TNF-α.
Motor Evaluation
A rotarod device (IITC Life Science Woodland Hills, CA) was utilized to test motor deficits. All mice were trained for 5 consecutive days on the rotarod each morning. Head injury was done on day 6 and training resumed on day 7 for an additional 5 days. Mice were evaluated at two different settings. The rotarod was set to start at an initial speed of 5 revolutions per minute (rpm) and accelerate to 24 rpm over 90 seconds or accelerate to 36 rpm over 180 seconds. Each mouse performed the task 3 times at each setting daily. Each trial on the rod was terminated when the animal fell off the rod, held on to the rod and completed two complete revolutions, or remained on the rod for 600 seconds. Data was averaged and then represented as a ratio of daily performance to initial performance (ratio to baseline).
Cognitive Evaluation
Novel object recognition has been used to assess visuospatial memory in a familiar environment. Novel object recognition testing was performed for 5 days. All animals (n=7 per group) were placed in an open field (24 cm × 45 cm × 21 cm) with no objects for 5 minutes for an acclimation period on day 0. After acclimation, animals were then given a head injury. 24 hours after injury, mice were placed in the field for 10 minutes with two identical objects (O1 and O2). This session was recorded with a videoing device, and the number of encounters for each object was quantified. An encounter was defined as sniffing, touching, and stretching the head toward the object within 2 centimeters. The second day of training occurred 24 hours after the initial session in which one of the old objects (O2) was replaced with a novel object. This testing was repeated 3 and 6 days after initial training with a new novel object being introduced each session. Data was then represented as a percentage of encounters with the novel object versus known object.
Statistics
Statistical analysis was performed using one-way ANOVA with subsequent Tukey’s test or a two-tailed t-test. Data is reported as mean ± SEM. Differences were considered significant when P < 0.05.
Results
Histologic evidence of brain injury is present without evident MRI changes
Mice were subjected to either mTBI-1 or mTBI-2 closed head injury. Less than a 10% mortality rate was observed over the first week after injury and fatalities were due to skull fracture, respiratory or cardiovascular failure. We first evaluated whether our models caused histologic brain injury. Gross visualization of brains from mice after mTBI-2 demonstrated areas of injury on the olfactory bulbs and inferior surface of the frontal lobes, whereas brains from mice with mTBI-1 showed virtually no gross evidence of injury (data not shown). Histological examination showed hemorrhage into the frontal lobes of the mTBI-2 group (Figure 1). However the mTBI-1 group had little to no histological evidence of injury (Figure 1). MRI studies with both TBI groups were conducted in vivo and ex vivo. No significant differences were observed using standard MRI or diffusion tensor anisotropy-MRI in either mTBI-1 or mTBI-2 (data not shown).
Figure 1.

Histological analysis of the brain in the frontal cortex and olfactory bulbs 1.5 and 6 hours after mTBI-1 or mTBI-2. Sections were stained with hematoxylin and eosin. Magnification is 10x.
Blood brain barrier disruption has been stated to play an important role in many post-injury changes(Marmarou 2007). To determine whether mTBI-1 or mTBI-2 disrupts the blood brain barrier (BBB), systemic injections of Lucifer yellow and FITC-albumin were utilized to demonstrate differential vascular leakage. Lucifer yellow, a micromolecular marker (0.45 kDa), showed leakage in both TBI groups (Figure 2). Interestingly, this micromolecular leakage was only present at 90 minutes post injury in the mTBI-1 group, yet persistent leakage was present out to 24 hours post-injury in the mTBI-2 group. FITC-albumin, a macromolecular marker (76 kDa), only demonstrated leakage in the mTBI-2 group at all time points (Figure 3). Disruption of the BBB was seen in the areas of injury observed in histological analyses. These data suggest differential leakage of molecules that parallels the severity of injury.
Figure 2.

Micromolecular leakage through blood brain barrier 1.5 and 6 hours after mTBI-1 or mTBI-2. Micromolecular leakage was determined using Lucifer yellow (0.45 kDa). Fluorescent microscopy was used to visualize extravascular Lucifer yellow in brain sections.
Figure 3.

Macromolecular leakage through blood brain barrier 1.5 and 6 hours after mTBI-1 or mTBI-2. Macromolecular leakage was determined using FITC-labeled albumin (76 kDa). Fluorescent microscopy was used to visualize extravascular FITC-albumin in brain sections.
Biochemical evidence of Injury
Since differential histopathologic evidence was present in both TBI groups, further evaluation with two well-known markers of brain injury, neuron specific enolase (NSE) and glial fibrillary acidic protein (GFAP), were performed. Levels of both NSE and GFAP were significantly increased within 90 minutes after injury in both mTBI-1 and mTBI-2 groups (Figure 4). Levels of NSE and GFAP remained significantly elevated in both mTBI groups 6 hours after injury (Figure 4). Twenty-four hours after injury, NSE and GFAP levels returned to near normal, with NSE levels in the mTBI-2 group still significantly increased (Figure 4).
Figure 4.
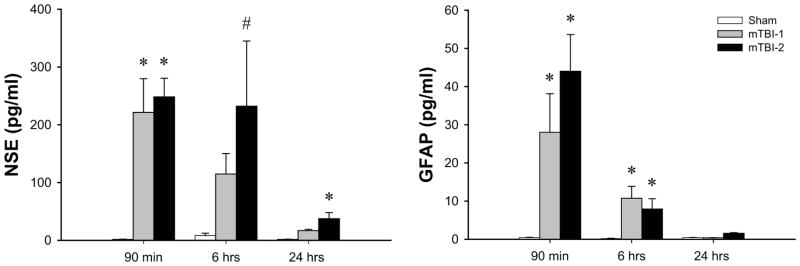
Brain injury after mTBI-1 or mTBI-2. Serum neuron specific enolase (NSE) and glial fibrillary protein (GFAP) were used as biochemical markers of brain injury. Serum samples were collected at 1.5, 6, and 24 hours after injury, and samples analyzed by ELISA. Data are mean ± SEM with n=5 per group. *P<0.05 compared to sham. # P<0.05 compared to all other groups.
Functional Analysis
It is well documented that motor and cognitive function are decreased after TBI. In order to evaluate the effects of mTBI on these parameters, motor and cognitive tests were performed using rotarod and novel object recognition, respectively. Cognitive testing began 24 hours after injury (day 1) with two identical objects. All mice spent approximately 50% of the time with each object, since both objects were identical (Figure 5A). Twenty-four hours later (day 2), a novel object was introduced. Both mTBI-1 and mTBI-2 had significantly decreased recognition of the novel object, as demonstrated by reduced amount of time spent investigating the novel object (Figure 5A). On post injury day 4, both TBI groups showed a continued decreased curiosity for the novel object. Seven days post-injury, both TBI groups demonstrated no statistically differences from sham.
Figure 5.
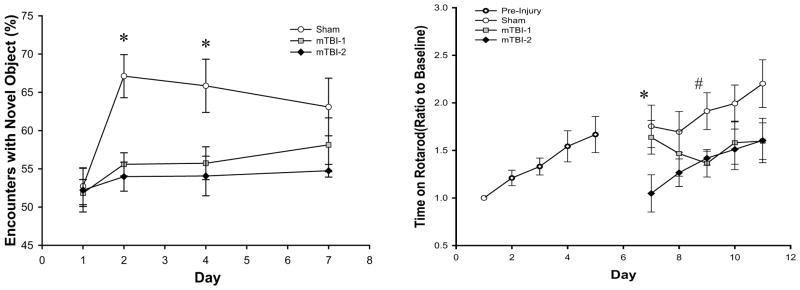
Effects of mTBI-1 or mTBI-2 on cognition and motor coordination. (A) Novel object recognition was used as a cognitive test to evaluate visuospatial changes after TBI. Testing was completed on days 1, 2, 4, and 7 after TBI. Data are mean ± SEM with n=5 per group. *P<0.05 compared to sham. (B) Rotarod testing was used to evaluate motor coordination. All mice were initially pretrained from days 1 to 5 to obtain a baseline skill level on rotarod. Mice received TBI on day 6 and training was resumed 24 hours after injury on day 7 and continued for 5 additional days. Data are mean ± SEM with n=6 per group. *P<0.05 compared to sham. # P<0.05 compared to all other groups.
To determine motor function, all mice were trained on the rotarod for 5 days. During this period of training, increased motor skills (as evidenced by increased time on the rotarod) were observed as a result of continued training (Figure 5B). After receiving a TBI, there were notable decreases in rotarod times in both mTBI-1 and mTBI-2 groups. Sham control mice continued to improve rotarod times throughout the period of analysis (Figure 5B). Mice receiving a mTBI-1 displayed rotarod times similar to sham for the first two days after injury (Figure 5B). However, there was a progressive decrease in rotarod times during this period and by the third day after injury (day 9), rotarod times were significantly lower than sham controls (Figure 5B). Mice receiving a mTBI-2 showed significant blunting of rotarod time within 24 hours after injury compared to both mTBI-1 and sham (Figure 5B). The mTBI-2 group continued to demonstrate decreased rotarod times compared to sham TBI throughout the 5-day period of analysis (Figure 5B).
Systemic and Neuroinflammatory Response
We next examined mediators involved in the neuroinflammatory response to TBI. Serum and brain samples were analyzed for thirteen different cytokines using a multiplex ELISA as described in the materials and methods. Of these thirteen analytes, we detected significant differences in four, IL-6, KC, MDC, and MIP-1α. In serum samples, IL-6 and KC were significantly increased within 90 minutes of injury in both mTBI-1 and mTBI-2 (Figure 6). Six hours after injury, levels of IL-6 and KC remained increased and were proportional to the severity of TBI (Figure 6). By 24 hours after injury, levels of IL-6 were significantly elevated in only the mTBI-2 group and KC levels returned to baseline (Figure 6). Serum levels of MDC were significantly increased only 24 hours after injury, whereas MIP-1α levels in the serum did not change (Figure 6).
Figure 6.

Systemic inflammation after mTBI-1 or mTBI-2. Serum cytokines were evaluated at 1.5, 6, and 24 hours after injury through multiplex ELISA. Data are mean ± SEM with n=10 per group. *P<0.05 compared to sham. # P<0.05 compared to all other groups.
Because serum IL-6 levels six hours after injury appeared to be directly proportional to the severity of TBI and because serum IL-6 levels at this time point have been shown in other models to be predictive of injury severity and outcome, we conducted receiver operator characteristic curve analyses. The area under the curve is 0.86 with p = 0.0065. The relative risk is 0.25, with p = 0.023. As part of these calculations a threshold of 172 pg/ml of IL-6 was determined. Serum levels of IL-6 below or above 172 pg/ml indicate a mTBI-1 or mTBI-2, respectively, with 80% sensitivity and 80% specificity (Figure 7).
Figure 7.
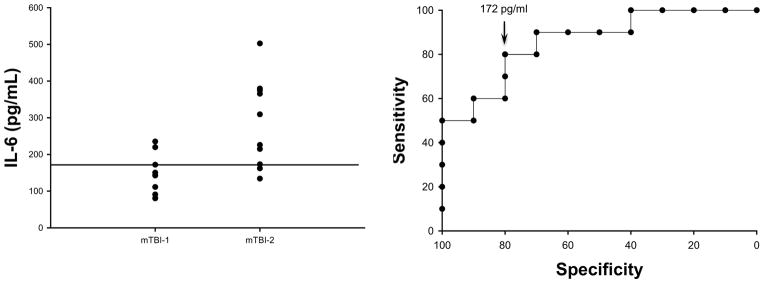
Serum levels of IL-6 discriminate between mTBI-1 and mTBI-2. Serum IL-6 in experimental animals 6 hours after mTBI-1 or mTBI-2 (left panel). Receiver operating characteristic curve, a plasma concentration of 172 pg/ml has 80% sensitivity and 80% specificity to discriminate between mTBI-1 and mTBI-2. The area under the curve is 0.86 with a p value of 0.0065. The relative risk is 0.25, with a p value of 0.023.
In contrast, IL-6 and KC levels in brain tissues did not change over the 24-hour time course (Figure 8). However, brain levels of MDC and MIP-1α were increased 6 hours after injury in the mTBI-2 group and were in both mTBI groups 24 hours after injury (Figure 8).
Figure 8.

Neuroinflammation after mTBI-1 or mTBI-2. Brain cytokines were evaluated at 1.5, 6, and 24 hours after injury through multiplex ELISA. Data are mean ± SEM with n=10 per group. *P<0.05 compared to sham. # P<0.05 compared to all other groups.
Discussion
In the present study, we developed a murine model of mild TBI using a weight drop model. Our model consistently displays significant acute cognitive and coordination defects similar to injuries in humans(McCrea, Guskiewicz et al. 2003). Unlike other well-established animal models of TBI, our model does not require scalp incision, craniotomy, or a direct cortical impact (Fujimoto, Longhi et al. 2004). Fluid percussion and controlled cortical impact models of head injury are used for more severe head injury and cause focal brain injury. We believe that the closed head weight drop model more accurately models TBI that occur due to blunt trauma, the most common type of head injury. To provide a consistent site of central injury, we use an alignment device on our weight drop apparatus. Other weight drop models of mTBI have focused the injury laterally (Flierl, Stahel et al. 2009). By varying the weight that was dropped, we effectively developed two severities of mild TBI. The more severe mTBI-2 was defined by having areas of parenchymal hemorrhage on the inferior surface of both frontal lobes, suggestive of the site of contra-coup injury after impact. In contrast, our mTBI-1 group had no evidence of histological injury.
The brain has been described as being immunologically privileged due to the blood brain barrier and the disruptions of the BBB play an additive role to the initial insult(Schmidt, Heyde et al. 2005). Previous studies in stroke models have evaluated differential leakage of molecules (Michalski, Grosche et al. 2010). However, to our knowledge, our study is the first to document differential disruption of the BBB in a mild closed-head injury model. Given our findings this may give insight into the processes of secondary brain injury. Due to the size of molecules allowed to cross the BBB after injury, circulating inflammatory mediators may enter the injured brain and modulate the injury response. The capability of larger proteins to cross the BBB also allows for increasing osmotic force and resulting brain edema and increased intracranial pressures. All of these factors synergistically worsen the extent of the initial insult.
There have been several studies that have evaluated acute TBI using standard MRI (Hughes, Jackson et al. 2004; Mac Donald, Johnson et al. 2011; Bennett, Mac Donald et al. 2012). Most of these found no acute changes(Morey, Haswell et al. 2012). Similarly, our experiments using standard MRI found no acute changes induced by TBI. Advancements in imaging devices and analysis, such as the use of diffuse tensor anisotropy (DTI), have been applied to help diagnose mTBI. Some studies have demonstrated axonal injuries and changes in white matter demyelination (Arfanakis, Haughton et al. 2002; Mac Donald, Johnson et al. 2011; Bennett, Mac Donald et al. 2012; Morey, Haswell et al. 2012). Changes detected using DTI have been made in soldiers with mTBI within ninety days after injury (Mac Donald, Johnson et al. 2011). Further murine models of TBI have demonstrated similar DTI changes, however these positive injury results were only found in repetitive injury models, and axonal injuries were only seen 7 days post injury rather than in the more acute setting(Bennett, Mac Donald et al. 2012). Therefore, differences in imaging results may be due to the disparities in technology application as well as differing time points after injury and differing analysis. We will further evaluate sequential time points after injury as well as proper use and administration of contrast to better characterize imaging studies for mTBI.
There are many lifelong effects after traumatic brain injuries, two of which, cognitive and motor changes provide quantifiable measures in small animal models. In weight drop models of mTBI, behavioral changes have been shown up to 72 hours after injury (Flierl, Stahel et al. 2009). In our study, there are clear deficits in cognition and motor function for up to a week post injury. Furthermore, by utilizing the rotarod on a daily basis, we demonstrate the functional progression of the injury on a day-to-day basis (Fujimoto, Longhi et al. 2004). The cognitive and functional motor deficits demonstrated in our study mirror the effects in humans suffering mild TBI. The recovery time necessary to return to baseline in humans may take 1 week to 3 months following injury(McCrea, Guskiewicz et al. 2003). Similarly, our data demonstrates return of cognitive function at 7 days. A potential limitation of our study is that we did not follow animals for long-term functional outcomes. We did not do this because the rotarod device, while accurate for testing motor function in the acute setting, involves acclimation to the task and, therefore, may lack specificity as a long-term evaluation tool(Fujimoto, Longhi et al. 2004). Novel object recognition testing was analyzed by the calculating the number of encounters with each object during a session rather than total time spent with each object, which may change the data minimally. Further work will need to be done to see the validity of these tests in long-term outcomes and the use of rotarod as a time-point evaluation rather than continual performance evaluation.
The neuroinflammatory process after TBI has been well-studied. It is evident that the brain plays a crucial role in regulating inflammatory responses after injury(Morganti-Kossmann, Rancan et al. 2002; Lucas, Rothwell et al. 2006; Morganti-Kossmann, Satgunaseelan et al. 2007; Cederberg and Siesjo 2010). There is a robust pro-inflammatory response immediately after TBI, which in previous studies in our laboratory; we demonstrated elevated levels of IL-6 and KC after TBI (Goodman, Makley et al. 2010). IL-6 has been extensively studied in sepsis, trauma, and TBI (Damas, Ledoux et al. 1992; Foex, Lamb et al. 1993; Pinsky, Vincent et al. 1993; Patel, Deen et al. 1994; Minambres, Cemborain et al. 2003). Circulating levels of IL-6 have been shown to be predictive of mortality at six hours after initiation of sepsis(Remick, Bolgos et al. 2002). In addition, increased levels of IL-6 expression have been associated with higher injury severity scores in trauma(Foex, Lamb et al. 1993). Our study provides strong evidence that circulating IL-6 levels may predict injury severity and functional outcomes. Furthermore, our data supports clinical studies of TBI that show more severe head injuries have higher levels of serum IL-6(Minambres, Cemborain et al. 2003; Hergenroeder, Moore et al. 2010). Therefore, IL-6 may have a potential role in grading severities of TBI, and it may also play a role in head injury and the functional deficits.
The current study has characterized a closed head injury model of mild TBI that displays cognitive and motor deficits. In addition, we observed significant changes in histopathology and BBB compromise that correlate to severity of injury. We also found significant neuroinflammatory changes after mild TBI, with the most significant observations related to the cytokine, IL-6. IL-6 appears to be a predictor and or direct modulator of the brain inflammatory response. The model we describe may serve as a valuable research tool to elucidate the mechanistic underpinnings of mild TBI.
Acknowledgments
Sources of Support: This work was supported by United States Air Force grant FA8650-10-2-6B01 and NIH training grant T32 GM08478.
Footnotes
Publisher's Disclaimer: This is a PDF file of an unedited manuscript that has been accepted for publication. As a service to our customers we are providing this early version of the manuscript. The manuscript will undergo copyediting, typesetting, and review of the resulting proof before it is published in its final citable form. Please note that during the production process errors may be discovered which could affect the content, and all legal disclaimers that apply to the journal pertain.
References
- Arfanakis K, V, Haughton M, et al. Diffusion tensor MR imaging in diffuse axonal injury. AJNR Am J Neuroradiol. 2002;23(5):794–802. [PMC free article] [PubMed] [Google Scholar]
- Bennett RE, Mac Donald CL, et al. Diffusion tensor imaging detects axonal injury in a mouse model of repetitive closed-skull traumatic brain injury. Neuroscience letters. 2012;513(2):160–165. doi: 10.1016/j.neulet.2012.02.024. [DOI] [PMC free article] [PubMed] [Google Scholar]
- Cederberg D, Siesjo P. What has inflammation to do with traumatic brain injury? Childs Nerv Syst. 2010;26(2):221–226. doi: 10.1007/s00381-009-1029-x. [DOI] [PubMed] [Google Scholar]
- Damas P, Ledoux D, et al. Cytokine serum level during severe sepsis in human IL-6 as a marker of severity. Ann Surg. 1992;215(4):356–362. doi: 10.1097/00000658-199204000-00009. [DOI] [PMC free article] [PubMed] [Google Scholar]
- Elder GA, Cristian A. Blast-related mild traumatic brain injury: mechanisms of injury and impact on clinical care. Mt Sinai J Med. 2009;76(2):111–118. doi: 10.1002/msj.20098. [DOI] [PubMed] [Google Scholar]
- Faul MXL, Wald MM, Coronado VG. Traumatic Brain Injury in the United States: Emergency Department Visits, Hospitalizations, and Deaths, 2002–2006. Centers for Disease Control and Prevention, National Center for Injury Prevention and Control; 2010. [Google Scholar]
- Flierl MA, Stahel PF, et al. Mouse closed head injury model induced by a weight-drop device. Nat Protoc. 2009;4(9):1328–1337. doi: 10.1038/nprot.2009.148. [DOI] [PubMed] [Google Scholar]
- Foex BA, Lamb WR, et al. Early cytokine response to multiple injury. Injury. 1993;24(6):373–376. doi: 10.1016/0020-1383(93)90098-q. [DOI] [PubMed] [Google Scholar]
- Fujimoto ST, Longhi L, et al. Motor and cognitive function evaluation following experimental traumatic brain injury. Neuroscience and biobehavioral reviews. 2004;28(4):365–378. doi: 10.1016/j.neubiorev.2004.06.002. [DOI] [PubMed] [Google Scholar]
- Goodman MD, Makley AT, et al. Traumatic brain injury and aeromedical evacuation: when is the brain fit to fly? The Journal of surgical research. 2010;164(2):286–293. doi: 10.1016/j.jss.2009.07.040. [DOI] [PMC free article] [PubMed] [Google Scholar]
- Hergenroeder GW, Moore AN, et al. Serum IL-6: a candidate biomarker for intracranial pressure elevation following isolated traumatic brain injury. Journal of neuroinflammation. 2010;7:19. doi: 10.1186/1742-2094-7-19. [DOI] [PMC free article] [PubMed] [Google Scholar]
- Hughes DG, Jackson A, et al. Abnormalities on magnetic resonance imaging seen acutely following mild traumatic brain injury: correlation with neuropsychological tests and delayed recovery. Neuroradiology. 2004;46(7):550–558. doi: 10.1007/s00234-004-1227-x. [DOI] [PubMed] [Google Scholar]
- Langlois JA, Rutland-Brown W, et al. The epidemiology and impact of traumatic brain injury: a brief overview. J Head Trauma Rehabil. 2006;21(5):375–378. doi: 10.1097/00001199-200609000-00001. [DOI] [PubMed] [Google Scholar]
- Lucas SM, Rothwell NJ, et al. The role of inflammation in CNS injury and disease. Br J Pharmacol. 2006;147 (Suppl 1):S232–240. doi: 10.1038/sj.bjp.0706400. [DOI] [PMC free article] [PubMed] [Google Scholar]
- Mac Donald CL, Johnson AM, et al. Detection of blast-related traumatic brain injury in U.S. military personnel. N Engl J Med. 2011;364(22):2091–2100. doi: 10.1056/NEJMoa1008069. [DOI] [PMC free article] [PubMed] [Google Scholar]
- Marmarou A. A review of progress in understanding the pathophysiology and treatment of brain edema. Neurosurg Focus. 2007;22(5):E1. doi: 10.3171/foc.2007.22.5.2. [DOI] [PubMed] [Google Scholar]
- McCrea M, Guskiewicz KM, et al. Acute effects and recovery time following concussion in collegiate football players: the NCAA Concussion Study. JAMA. 2003;290(19):2556–2563. doi: 10.1001/jama.290.19.2556. [DOI] [PubMed] [Google Scholar]
- Michalski D, Grosche J, et al. A novel quantification of blood-brain barrier damage and histochemical typing after embolic stroke in rats. Brain Res. 2010;1359:186–200. doi: 10.1016/j.brainres.2010.08.045. [DOI] [PubMed] [Google Scholar]
- Minambres E, Cemborain A, et al. Correlation between transcranial interleukin-6 gradient and outcome in patients with acute brain injury. Critical care medicine. 2003;31(3):933–938. doi: 10.1097/01.CCM.0000055370.66389.59. [DOI] [PubMed] [Google Scholar]
- Morey RA, Haswell CC, et al. Effects of chronic mild traumatic brain injury on white matter integrity in Iraq and Afghanistan war veterans. Human brain mapping. 2012 doi: 10.1002/hbm.22117. [DOI] [PMC free article] [PubMed] [Google Scholar]
- Morganti-Kossmann MC, Rancan M, et al. Inflammatory response in acute traumatic brain injury: a double-edged sword. Curr Opin Crit Care. 2002;8(2):101–105. doi: 10.1097/00075198-200204000-00002. [DOI] [PubMed] [Google Scholar]
- Morganti-Kossmann MC, Satgunaseelan L, et al. Modulation of immune response by head injury. Injury. 2007;38(12):1392–1400. doi: 10.1016/j.injury.2007.10.005. [DOI] [PubMed] [Google Scholar]
- Okie S. Traumatic brain injury in the war zone. N Engl J Med. 2005;352(20):2043–2047. doi: 10.1056/NEJMp058102. [DOI] [PubMed] [Google Scholar]
- Patel RT, Deen KI, et al. Interleukin 6 is a prognostic indicator of outcome in severe intra-abdominal sepsis. Br J Surg. 1994;81(9):1306–1308. doi: 10.1002/bjs.1800810914. [DOI] [PubMed] [Google Scholar]
- Pinsky MR, Vincent JL, et al. Serum cytokine levels in human septic shock. Relation to multiple-system organ failure and mortality. Chest. 1993;103(2):565–575. doi: 10.1378/chest.103.2.565. [DOI] [PubMed] [Google Scholar]
- Remick DG, Bolgos GR, et al. Six at six: interleukin-6 measured 6 h after the initiation of sepsis predicts mortality over 3 days. Shock. 2002;17(6):463–467. doi: 10.1097/00024382-200206000-00004. [DOI] [PubMed] [Google Scholar]
- Schmidt OI, Heyde CE, et al. Closed head injury--an inflammatory disease? Brain Res Brain Res Rev. 2005;48(2):388–399. doi: 10.1016/j.brainresrev.2004.12.028. [DOI] [PubMed] [Google Scholar]
- Thurman DJ, Alverson C, et al. Traumatic brain injury in the United States: A public health perspective. J Head Trauma Rehabil. 1999;14(6):602–615. doi: 10.1097/00001199-199912000-00009. [DOI] [PubMed] [Google Scholar]
- Wojcik BE, Stein CR, et al. Traumatic brain injury hospitalizations of U.S. army soldiers deployed to Afghanistan and Iraq. American journal of preventive medicine. 2010;38(1 Suppl):S108–116. doi: 10.1016/j.amepre.2009.10.006. [DOI] [PubMed] [Google Scholar]