

Abstract
The class III ribonucleotide reductases (RNRs) are glycyl radical (G•) enzymes that provide the balanced pool of deoxynucleotides required for DNA synthesis and repair in many facultative and obligate anaerobic bacteria and archaea. Unlike the class I and II RNRs, where reducing equivalents for the reaction are delivered by a redoxin (thioredoxin, glutaredoxin, or NrdH) via a pair of conserved active site cysteines, the class III RNRs examined to date use formate as the reductant. Here, we report that reaction of the Escherichia coli class III RNR with CTP (substrate) and ATP (allosteric effector) in the absence of formate leads to loss of the G• concomitant with stoichiometric formation of a new radical species and a “trapped” cytidine derivative that can break down to cytosine. Addition of formate to the new species results in recovery of 80% of the G• and reduction of the cytidine derivative, proposed to be 3′-keto-deoxycytidine, to dCTP and a small amount of cytosine. The structure of the new radical has been identified by 9.5 and 140 GHz EPR spectroscopy on isotopically labeled varieties of the protein to be a thiosulfuranyl radical [RSSR2]•, composed of a cysteine thiyl radical stabilized by an interaction with a methionine residue. The presence of a stable radical species on the reaction pathway rationalizes the previously reported [3H]-(kcat/KM) isotope effect of 2.3 with [3H]-formate, requiring formate to exchange between the active site and solution during nucleotide reduction. Analogies with the disulfide anion radical proposed to provide the reducing equivalent to the 3′-keto-deoxycytidine intermediate by the class I and II RNRs provide further evidence for the involvement of thiyl radicals in the reductive half-reaction catalyzed by all RNRs.
Introduction
Ribonucleotide reductases (RNRs) perform an essential function in all organisms, catalyzing the conversion of ribonucleotides into deoxynucleotides and providing the monomeric precursors required for DNA synthesis and repair (Chart 1).1,2 All RNRs initiate nucleotide reduction via a transient protein-based thiyl radical3 that abstracts a hydrogen atom from the 3′-position of the nucleotide.4 RNRs have been divided into three classes (I, II, and III) based on the metallo-cofactors required to generate this initiating thiyl radical.5 This paper focuses on the E. coli class III RNR and the identification of a new radical species involving a three-electron bond between a cysteine and a methionine residue playing a role in the reductive half-reaction. Despite the sequence differences between the three RNR classes, the first evidence for the involvement of thiyl radicals in the reductive half-reaction of all classes is presented.
Chart 1.
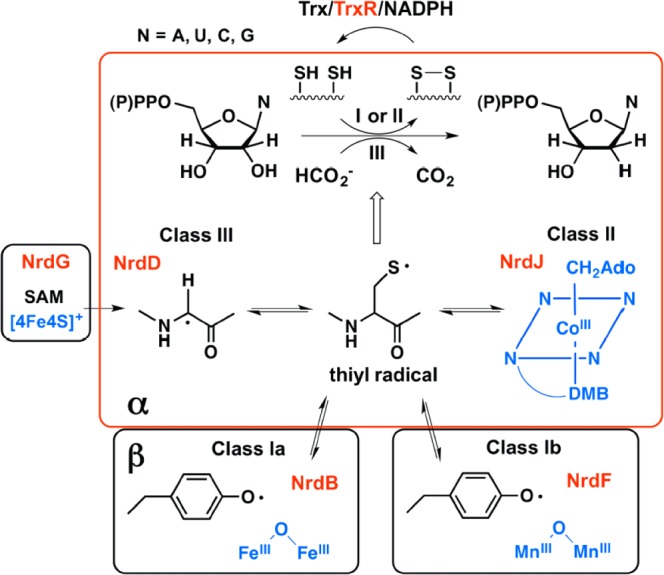
The class I, II, and III RNRs catalyze the conversion of nucleoside di or triphosphates to deoxynucleotides. They differ in the metallo-cofactor that initiates the reduction process and in the reductant itself. Reproduced from Rhodes et al.10
Many organisms possess multiple RNRs: Escherichia coli possess three. Two of them are class I RNRs, one with a diferric-tyrosyl radical (Y•) cofactor (class Ia) and one with a dimanganese-Y• cofactor (class Ib). Both the Ia and Ib cofactors require O2 for their biogenesis. The Ia enzyme is the workhorse in DNA replication, while the Ib RNR is expressed under iron limitation and oxidative stress. The third RNR, which is the focus of this paper, is a class III enzyme and is expressed only under anaerobic conditions. It is encoded by the nrdDG operon.6 Nucleotide reduction is catalyzed by the 80 kDa NrdD, which houses the O2-sensitive glycyl radical7 (G•) that is generated by the 17.5 kDa activating enzyme NrdG via chemistry involving S-adenosylmethionine (SAM) and a [4Fe4S]1+ cluster (Chart 1).8,9 The G•, as with the dimetallo-Y•s in the class Ia and Ib RNRs and adenosylcobalamin in the class II RNR, is reversibly involved in generation of the thiyl radical (Chart 1).
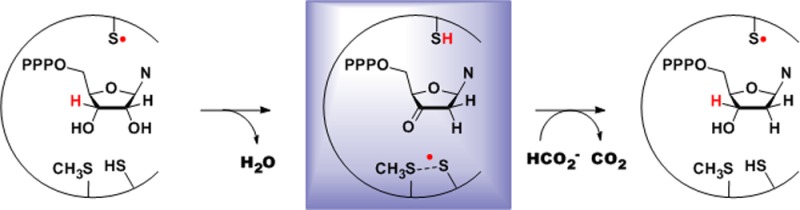
Recent studies on the class Ia RNR11 and earlier studies on the class II enzyme12 established that the chemistry of nucleotide reduction is fast (∼100 s–1), and in both cases it is masked in the steady state by conformational gating13,14 (kcat of ∼5 s–1). The mechanism of nucleotide reduction by the class I and II RNRs has been investigated using many methods resulting in the model shown in Figure 1A,B.15 The overall reaction is divided into two half reactions. In the first half-reaction (Figure 1A), a 3′-nucleotide radical4,16,17 (2) is generated by 3′-hydrogen atom abstraction by the transient thiyl radical located on the top face of the sugar. Water loss is then facilitated by protonation by a bottom face cysteine, in an irreversible step, to generate intermediate 3. These first two steps are likely facilitated by removal of the proton of the 3′-OH group.15 In the second half-reaction (Figure 1B), intermediate 3 is reduced to the 3′-keto-deoxynucleotide (4) concomitant with formation of the disulfide anion radical19 which then, in a proton-coupled electron-transfer step,18 generates the 3′-deoxynucleotide radical 5. In the final step, the hydrogen atom that was initially removed from the 3′-position of the nucleotide is returned to the same position in the product.
Figure 1.

Mechanistic model for nucleotide reduction by the E. coli class Ia RNR and E. coli (or bacteriophage T4) class III RNR. (A) First half-reaction common to all RNRs; (B) second half-reaction of class Ia RNR; and (C) second half-reaction of class III RNR.
The mechanism of nucleotide reduction by the class III RNRs has been less well characterized, but studies support a similar sequence of events for the first half-reaction (Figure 1A).20,21 A distinction between the RNR classes is apparent in the proposed mechanism of the second half-reaction (compare Figure 1B,C), as a pair of conserved, bottom face, cysteine residues are essential for nucleotide reduction by the class I and II RNRs,22 while formate is the reductant in the E. coli class III RNR.23 Studies on the class III RNR in D2O demonstrated that solvent replaces the 2′-OH with retention of configuration and that a small amount of exchange of deuterium into the 3′-position of the product takes place.24 These results are similar to previous studies with the class I and II RNRs.4,16,17 Studies with [3H]-formate also provided insight about the reduction process.23 First, 3H was found in the solvent, consistent with the oxidation of formate to a CO2•– via the conserved bottom face cysteine. Second, an unusual [3H]-(kcat/Km) isotope effect of 2.3 was observed, requiring exchange of formate between the active site and solvent prior to cleavage of the formate C–H bond and after the first irreversible step of nucleotide reduction, thought to be H2O loss. Thus, formate appears to be able to enter and leave the active site in the middle of nucleotide turnover.
A comparison of the active site structures of the E. coli class Ia α2 (NrdA) and the bacteriophage T4 class III α2 (NrdD, Figure S1A) reveals similar 10-stranded α/β barrels containing a finger loop with the essential cysteine C290 (equivalent to C439 in E. coli NrdA, C384 in E. coli NrdD) at its tip, that generates the substrate radical.25 Of the two cysteines that donate the reducing equivalents in the class I and II RNRs (C225 and C462 in E. coli NrdA), only C79 (C225 in E. coli NrdA, C175 in E. coli NrdD) is conserved in the class III enzyme. Mutagenesis studies showed that both C79 and C290 are essential for catalysis in the class III enzyme.26
Additional similarities between the class I, II,27−29 and III20 RNRs have been identified using mechanism-based inhibitors, 2′-chloro and fluoro 2′-deoxynucleotides, that can also function as alternative substrates (Figure 2). All RNRs react with these analogues to form 13, which can partition between the normal reduction reaction to generate the deoxynucleotide product (Figure 1B), or reduction from the top face or the bottom face of the sugar to generate a 3′-keto-deoxynucleotide (14), which dissociates from the active site and decomposes nonenzymatically to produce the nucleobase and pyrophosphate (tripolyphosphate). In the case of the class I and II RNRs, the furanone (15) has also been identified, and its reaction with the enzyme has been shown to result in their time-dependent inactivation.30 Similarities in the reactivity of all three classes of RNRs toward these substrate analogues suggest a common first half-reaction (Figure 1A) and provide a mechanism by which nucleobase (N) can be formed (Figure 2).
Figure 2.
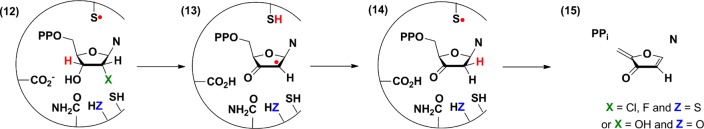
Mechanistic model for nucleotide reduction by the E. coli class Ia RNR with a mechanism-based inhibitor or an active site mutant (ZH) with CDP.
Reported here are our studies of the reaction of E. coli class III RNR that have provided insight about the reductive half-reaction of this and the class I and II RNRs. Incubation of the class III RNR with CTP (substrate) and ATP (allosteric effector) in the absence of formate leads to the disappearance of the G•, concomitant with formation of a new radical and release of cytosine (Cyt), a known breakdown product of 3′-keto-deoxycytidine (Figure 1C, 7, and Figure 2, 14).27 Subsequent addition of formate leads to the disappearance of the new radical, recovery of G•, and formation of dCTP and a small amount of Cyt. Isotopic labeling of NrdD with [β-2H]-cysteine, [ε-2H]-methionine and [β,γ-2H]-methionine, in combination with EPR spectroscopy of the new radical, identifies this species as a thiosulfuranyl radical (Figure 1C, 8), generated from the C175 thiyl radical stabilized by an interaction with the conserved M382. The role of the thiosulfuranyl radical in the class III RNR second half-reaction (Figure 1C) and its relationship to the disulfide radical anion in the second half-reaction of the class Ia RNR (Figure 1B) is discussed.
Materials and Methods
Materials and General Methods
All chemical reagents were purchased from Sigma–Aldrich, unless otherwise indicated. Primers were purchased from Integrated DNA Technologies. UV–vis absorption spectroscopy was performed on an Agilent 8453 Diode Array spectrophotometer. Anaerobic procedures were carried out in a custom-designed MBraun glovebox in a cold room at 4 °C or at room temperature (RT). All solutions and proteins were made anaerobic on a Schlenk line by 3 cycles of evacuation (5 min) followed by flushing with Ar gas (10 min) before being brought into the glovebox. Nucleotides and SAM were brought into the glovebox as lyophilized solids. The plasmids pRSS and PN9 containing the genes for E. coli NrdD and NrdG, respectively,31 were gifts from Professor Marc Fontecave, Collège de France (Paris, France).
Preparation of 5-[3H]-CTP by Phosphorylation of 5-[3H]-CDP
The synthesis was carried out by minor modifications of the procedure of Lohman et al.32 A reaction mixture (10 mL) containing 5-[3H]-CDP (2 mM, Vitrax, specific activity of 26880/nmol), PEP (4 mM), Tris-HCl (50 mM, pH 7.5), KCl (80 mM), MgCl2 (20 mM), and pyruvate kinase (rabbit muscle, 120 U/mL) was incubated at 37 °C for 1 h. The resulting 5-[3H]-CTP was purified on a DEAE column (60 mL, 10 × 2 cm) washed with water (50 mL), and eluted with a 400 × 400 mL linear gradient from 0 to 750 mM triethylammonium bicarbonate (TEAB). The triphosphate containing fractions eluting at 550 mM TEAB were combined, and the solvent removed in vacuo. The product 5-[3H]-CTP was isolated in 87% yield and the structure confirmed by 1H- and 31P NMR. The 5-[3H]-CTP used in all experiments had a specific activity of 2860 cpm/nmol.
Construction of pET24a-nrdD To Increase nrdD Overexpression
The plasmid pRSS contains a 1800 bp insert between the promoter and nrdD start codon. An NdeI restriction site was introduced at the 5′ position of the nrdD ORF by site-directed mutagenesis using the primer GTTCTTAAAAATATGGAGCGCATATGACACCGC (mutation underlined). PCR was carried out using PfuUltraII polymerase (Stratagene) according to the manufacturer’s protocol, followed by DpnI digestion of the methylated template plasmid. The resulting plasmid was digested with NdeI and EcoRI (NEB) and the nrdD fragment was ligated into pET24a (Novagen), which was linearized with the same restriction enzymes, to give pET24a-nrdD. The nrdD sequence and all cloned or mutant sequences were confirmed by DNA sequencing at the Massachusetts Institute of Technology Biopolymers Laboratory.
Construction of pTrc-nrdD for Expression in a Cysteine Auxotroph
To facilitate insertion of nrdD into pTrcHisA (Invitrogen) without an N-terminal His6-tag, an NdeI restriction site was introduced into the plasmid by site-directed mutagenesis using the primer CGATTAAATAAGGAGGAATAACATATGTATCGATTAAATAAGG (mutation underlined), and an internal NdeI restriction site present in the plasmid was mutated using the primer GGTATTTCACACCGCACATGGTGCACTC. The resulting plasmid was linearized using the restriction enzymes NdeI and EcoRI. The nrdD fragment was excised from pET24a-nrdD using the same restriction enzymes and ligated into pTrc to give pTrc-nrdD.
Construction of pET24a-nrdD-(S386E) and pTrc-nrdD-(S386E)
The S386E mutation was introduced by site-directed mutagenesis of the plasmids pET24a-nrdD and pTrc-nrdD using the primer CCGATGGGCTGCCGCGAGTTCCTCGGCGTGTGGG (mutation underlined).
Expression of E. colinrdD and Protein Purification
pET24a-nrdD was transformed into BL21 (DE3) cells (Invitrogen), grown on LB-agar plates with 50 μg/mL kanamycin (Kan) at 37 °C. A single colony was inoculated into 5 mL of LB (50 μg/mL Kan in all growths), grown at 37 °C until saturated (12 h), and transferred into 1.5 L of LB supplemented with 50 μM zinc acetate in a 6 L Erlenmeyer flask. The culture was grown at 37 °C with shaking at 220 rpm. At OD600 ∼ 0.6, the temperature was lowered to 25 °C and isopropyl β-d-1-thiogalactopyranoside (IPTG, Promega) was added to a final concentration of 1 mM. After 14 h, the cells were pelleted by centrifugation (5000 × g, 10 min, 4 °C) and frozen at −80 °C. Typically 4.7 g of cell paste per L of culture was obtained.
Cell paste (∼7.1 g) was resuspended in 35 mL of buffer A (50 mM Tris, 5% glycerol (BDH Chemicals), 5 mM dithiothreitol (DTT, Promega), pH 7.5) containing 1 mM PMSF. The cells were lysed by a single passage through a French pressure cell (14 000 psi). DNA was precipitated by dropwise addition of 0.2 vol of buffer A containing 6% (w/v) streptomycin sulfate. The mixture was stirred for an additional 10 min, and the precipitated DNA was removed by centrifugation (20 000 × g, 10 min, 4 °C). Solid (NH4)2SO4 was then added to 60% saturation. The solution was stirred for an additional 20 min, and the precipitated protein was isolated by centrifugation (20 000 × g, 10 min, 4 °C).
The pellet was dissolved in 20 mL of buffer A containing 0.8 M (NH4)2SO4 and loaded onto a butyl-Sepharose column (2 × 16 cm, 50 mL). The column was eluted with 2 column volumes (CV) each of buffer A containing 0.8, 0.6, 0.4, 0.2, and 0.0 M (NH4)2SO4, and the fractions were analyzed by SDS-polyacrylamide gel electrophoresis (SDS-PAGE, 10% gel). This analysis led to rechromatography of the protein on the butyl-Sepharose column with a gentler step-gradient. The fractions eluting at 0.6–0.4 M (NH4)2SO4 were pooled and precipitated with (NH4)2SO4 (60% saturation). The pellet was redissolved in buffer A containing 0.8 M (NH4)2SO4 and loaded onto the butyl-Sepharose column (2 × 16 cm, 50 mL). The column was then eluted with 2 CV each of buffer A containing 0.8, 0.7, 0.6, 0.5, and 0.4 M (NH4)2SO4. The fractions eluting at 0.7–0.5 M (NH4)2SO4 were pooled and precipitated with (NH4)2SO4 (60% saturation).
The pellet was dissolved in 100 mL of buffer A and was loaded onto a DEAE-Sepharose column (2 × 16 cm, 50 mL) and washed with 100 mL of buffer A. The flow-through and wash fractions were pooled and precipitated with (NH4)2SO4 (60% saturation). The pellet was dissolved in a minimal volume of buffer A (10 mL) and desalted using a Sephadex G-25 column (2 × 50 cm, 150 mL). The protein-containing fractions were pooled and concentrated by ultrafiltration (Amicon YM-30, Millipore). This procedure yielded 55 mg NrdD per g of cells (ε280 = 77 020 M–1cm–1), judged pure by SDS-PAGE.
Expression of E. colinrdG and Protein Purification
PN9 was transformed into BL21 (DE3) cells (Invitrogen), grown on LB-agar plates with 100 μg/mL ampicillin (Amp) at 37 °C. A single colony was inoculated into 5 mL of LB (100 μg/mL Amp in all growths), grown at 37 °C until saturated (12 h), and transferred into 6 × 1.5 L of LB in 6 L Erlenmeyer flasks. The cultures were grown at 37 °C with shaking at 220 rpm. At OD600 ∼ 0.7, the temperature was lowered to 28 °C, and IPTG was added to a final concentration of 1 mM. After 12 h, the cells were pelleted by centrifugation (4000 × g, 10 min, 4 °C) and frozen at −80 °C. Typically 2.1 g of cell paste per L of culture was obtained.
Cell paste (∼12.9 g) was resuspended in 50 mL of buffer B (30 mM Tris, 50 mM KCl, 10 mM DTT, pH 7.5) containing 0.1 mM PMSF. The cells were lysed by a single passage through a French pressure cell (14 000 psi). DNA was precipitated by dropwise addition of 0.2 vol of buffer A containing 6% (w/v) streptomycin sulfate. The mixture was stirred for an additional 10 min, and the precipitated DNA was removed by centrifugation (15 000 × g, 10 min, 4 °C). Solid (NH4)2SO4 was then added to 40% saturation. The solution was stirred for an additional 20 min, and the precipitated protein was isolated by centrifugation (15 000 × g, 40 min, 4 °C).
The pellet was dissolved in 10 mL of buffer B and desalted using a Sephadex G-25 column (5 × 50 cm, 1 L) equilibrated with buffer B. The colored fractions were combined and loaded onto a DEAE-Sepharose column (5 × 10 cm, 200 mL) and washed with 300 mL of buffer B. The flow-through and wash fractions were pooled and precipitated with (NH4)2SO4 (40% saturation). The pellet was dissolved in 4 mL of buffer B and loaded onto a Sephadex G-75 column (3 × 100 cm, 700 mL) equilibrated with buffer B. Fractions (15 mL) were collected and analyzed by SDS-PAGE. The fractions containing NrdG were pooled and concentrated by ultrafiltration (Amicon YM-10), yielding 4 mg NrdG per g of cells (ε280 = 28480 M–1cm–1), pure by SDS-PAGE.
Reconstitution of the [4Fe4S] Cluster of NrdG
The procedure was carried out in a glovebox in a 4 °C cold room. Solutions of Na2S and of Fe(NH4)2(SO4)2 in water (100 mM) were freshly prepared in the glovebox. A solution of NrdG (250 μM, 1 mL) was made anaerobic on a Schlenk line and brought into the glovebox. A solution of DTT (100 mM) was added to 10 mM, followed by ordered addition of a solution of Na2S (5 equiv) and Fe(NH4)2(SO4)2 (5 equiv), and incubation for 12 h. The solution was concentrated to 200 μL by ultrafiltration (Amicon YM-30). EDTA (5 equiv) was then added, and the solution was desalted using a Sephadex G-25 column (1 × 9 cm, 7 mL) equilibrated with triethanolamine (TEA) buffer (30 mM, pH 7.5). The final material typically contained ∼2 atoms of Fe per peptide determined by the ferrozine assay.33
Minimization of Formate Levels in Reaction Buffers
In order to carry out reactions in the absence of formate, substitutes were used for components of the NrdD storage buffer found to contain a formate contaminant (Tris base, glycerol, and DTT, see Results section). Inositol and TCEP, which contain undetectable levels of formate, effectively replaced glycerol and DTT in preserving NrdD activity. Tris buffer was replaced with Bicine, which also served as a coreductant for the photoreduction system. Bicine was later found to contain small amounts of formate and was thus replaced with TEA for experiments where complete removal of formate is desired.
Generation of the NrdD-G• Using a Catalytic Amount of NrdG
To generate NrdD-G•, a solution of NrdD (200 μM, 1.5 mL) was concentrated to 300 μL by ultrafiltration (Amicon YM-30). The protein was exchanged into Bicine buffer (30 mM, pH 7.5), 3% inositol, 5 mM tris(2-carboxyethyl)phosphine (TCEP), using a Sephadex G-25 column (1 × 20 cm, 15 mL). The protein-containing fractions were pooled and made anaerobic on a Schlenk line and brought into a glovebox in a 4 °C cold room.
A 50 μL mixture of NrdD (100 μM), NrdG (10 μM), SAM (1 mM), Bicine buffer (30 mM, pH 7.5) and Rose Bengal (50 μM) was exposed to a fluorescent lamp in the glovebox for 2 h. For inspection by X-band EPR spectroscopy, the solution was diluted to 250 μL with Bicine buffer (30 mM, pH 7.5), 3% inositol to give a final concentration of 20 μM NrdD, and sealed in an EPR tube with a rubber stopper. The solution was quenched in liquid N2 immediately after removal from the glovebox. The amount of G• in the solution was determined by comparing the EPR signal intensity to that of a CuSO4 standard.34 A typical yield of 0.45–0.50 radicals per NrdD polypeptide was reproducibly obtained.
Activity Assay for dCTP Formation
The assay mixture in 100 μL contained NrdD (0.2 μM), ATP (1 mM), 5-[3H]-CTP (1 mM, 2860 cpm/nmol) in Tris (30 mM, pH 7.5), KCl (30 mM), MgSO4 (10 mM), and HCO2Na (10 mM) and was incubated at 25 °C. Four, 20 μL aliquots were removed at 1 min intervals and quenched with 2% perchloric acid (20 μL). Subsequent to removal of the phosphates using calf intestine alkaline phosphatase (Roche), dCTP formation was analyzed by the method of Steeper and Steuart.35 One unit of activity is equivalent to 1 nmol of dCTP/min. The specific activity of NrdD is ∼1500 U/mg, consistent with literature values.36
Assay for Cyt Formation
The method of Steeper and Steuart involves chromatography on a Dowex-1-borate column where the cytidine is retained as a complex with borate, while dC is eluted. To assay for Cyt released from 3′-keto-dCTP, the dephosphrylation step was omitted. Controls showed that CTP and dCTP are retained on the Dowex anion-exchange column, while the Cyt passes directly through the column. 5-[3H]-CTP was lyophilized before the experiments, eliminating any 3H2O that would also pass directly through the column. Further characterization by reverse phase HPLC is described below.
Reaction of NrdD with CTP, ATP, and Analysis by X-Band EPR Spectroscopy
The final reaction mixture at 4 °C contained in a volume of 250 μL: NrdD (40 μM, activated as described above), CTP (1.5 mM), ATP (1.5 mM), Bicine (30 mM, pH 7.5), KCl (30 mM), MgSO4 (10 mM), and 3% inositol. The reaction was initiated by addition of NrdD, and the sample was rapidly transferred and sealed in an EPR tube with a rubber stopper, removed from the glovebox, and frozen in liquid N2. The total reaction time was 1 min for NrdD-wild-type (WT) and 60 min for NrdD-(S386E).
For reaction with formate, NrdD was reacted first with CTP and ATP for 1 min at 4 °C as described above, followed by addition of sodium formate to 10 mM (2.5 μL, 1 M). The total reaction time with formate was 1 min.
X-Band EPR Spectroscopy
Continuous wave (cw) X-band EPR spectra were recorded at 77 K in the MIT Department of Chemistry Instrumentation Facility on a Bruker ESP-300 X-band spectrometer equipped with a quartz finger Dewar filled with liquid N2. Experimental conditions were as follows: microwave frequency, 9.45 GHz; modulation amplitude, 0.15 mT; modulation frequency, 100 kHz; time constant, 5.12 ms; and scan time, 41.9 s. A microwave power of 10 μW and an average of 10 scans was used for G•, while a power of 160 μW and 100 scans was used for the thiosulfurnanyl radical.
Sample Preparation for 140 GHz EPR Analysis
The 140 GHz EPR spectrometer requires a more concentrated protein sample. A solution of NrdD and NrdG was concentrated by ultrafiltration (Amicon YM-30) in a glovebox in a 4 °C cold room. The final mixture for G• generation (5 μL) contained NrdD (800 μM), NrdG (80 μM), SAM (1.5 mM), Bicine (pH 7.5, 30 mM), KCl (30 mM), MgSO4 (10 mM), Rose Bengal (50 μM), and 3% inositol. The mixture was exposed to the fluorescent lighting in the glovebox at 4 °C for 2 h to generate G•. The reaction with the nucleotide was initiated by adding a solution (1 μL) containing CTP and ATP in reaction buffer, to give a final reaction concentration of 2 mM each. Loading and freezing the small 140 GHz EPR tubes (ID 0.5 mm, effective sample volume 200 nL) could not be done as swiftly as with the X-band tubes, and the total reaction time was extended to 2.5 min at 4 °C.
140 GHz EPR Spectroscopy
Echo-detected 140 GHz EPR spectra were obtained on a spectrometer developed by Smith et al.37 Pulsed EPR spectra were acquired at a temperature of 85 K using a Hahn echo pulse sequence (π/2 pulse = 35 ns and τ = 250 ns). The applied microwave power was 100 mW. At each field position, 400 shots were acquired with a repetition time of 1 ms. The 1H resonance frequency of a small water sample that resides just below the sample space in the magnet was used to set the magnetic field.38
Preparation of [β-2H]-cys-NrdD
This procedure was adapted from existing protocols.39 pTrc-nrdD or pTrc-nrdD-(S386E) was transformed into the E. coli cysteine auxotroph JW3582-2 (Yale E. coli Genetic Stock Center), containing the mutation ΔcysE720::kan.40 A single colony was inoculated into 5 mL of LB (100 μg/mL Amp in all growths), grown at 37 °C until saturated (12 h), harvested by centrifugation (3000 × g, 10 min, 4 °C), and transferred into M9 medium supplemented with l-amino acids and cofactors. The growth medium contained in 1 L: Na2HPO4 (6 g), KH2PO4 (3 g), NH4Cl (1 g), NaCl (1 g), glycerol (4 g), MgCl2.6H2O (210 mg), and CaCl2.2H2O (14 mg), alanine (0.50 g), arginine (0.40 g), aspartic acid (0.40 g), asparagine (0.40 g), glutamine (0.4 g), sodium glutamate (0.74 g), glycine (0.55 g), histidine hydrochloride (0.13 g), isoleucine (0.24 g), leucine (0.23 g), lysine hydrochloride (0.43 g), methionine (0.25 g), phenylalanine (0.15 g), proline (0.10 g), serine (2.10 g), threonine (0.23 g), tryptophan (0.06 g), valine (0.23 g), thiamine (50 mg), and racemic [β,β′-2H]-cystine (120 mg, 98%, Cambridge Isotope Laboratories). The cultures were grown at 37 °C with shaking at 220 rpm. At OD600 ∼ 0.6, the temperature was lowered to 25 °C, and IPTG was added to a final concentration of 1 mM. After 14 h, the cells were pelleted by centrifugation (5000 × g, 10 min, 4 °C) and frozen at −80 °C, yielding ∼2 g of cell paste per L of culture.
Preparation of [ε-2H]-met- and [β,γ-2H]-met-Labeled NrdD
The procedure was adapted from existing protocols.41 pET24a-nrdD or pET24a-nrdD-(S386E) was transformed into BL21 (DE3) cells, grown on LB-agar plates with 50 μg/mL Kan. A single colony was inoculated into 5 mL of LB (50 μg/mL Kan in all growths), grown at 37 °C until saturated (12 h), harvested by centrifugation (3000 × g, 10 min, 4 °C), and transferred into M9 medium containing in 1 L: Na2HPO4 (6 g), KH2PO4 (3 g), NH4Cl (1 g), NaCl (1 g), glycerol (4 g), MgCl2.6H2O (210 mg), CaCl2·2H2O (14 mg), and thiamine (50 mg). The cultures were grown at 37 °C with shaking at 220 rpm. At OD600 ∼0.3, the l-amino acids lysine (0.1 g), phenylalanine (0.1 g), threonine (0.1 g), isoleucine (0.05 g), leucine (0.05 g), and valine (0.05 g) were added. Additionally, 50 mg of [ε-2H]-methionine (98%, Cambridge Isotope Laboratories) or [β,γ-2H]-methionine (98%, CDN isotopes) was added per L of medium, followed by shaking for 20 min. The temperature was lowered to 25 °C, and IPTG was added to a final concentration of 1 mM. After 14 h, cells were pelleted by centrifugation (5000 × g, 10 min, 4 °C) and frozen at −80 °C. Typically 2 g of cell paste was obtained per L of culture.
Purification of [β-2H]-cys-, [ε-2H]-met-, and [β,γ-2H]-met-NrdD and NrdD-(S386E)
Cell paste (∼2 g) was suspended in 20 mL of buffer A containing 1 mM PMSF. The cells were lysed by a single passage through a French pressure cell (14 000 psi). DNA was precipitated by dropwise addition of 0.2 vol of buffer A containing 6% (w/v) streptomycin sulfate. The mixture was stirred for an additional 10 min, and the precipitated DNA was removed by centrifugation (20 000 × g, 10 min, 4 °C). Solid (NH4)2SO4 was then added to 60% saturation. The solution was stirred for an additional 20 min, and the precipitated protein was isolated by centrifugation (20 000 × g, 10 min, 4 °C). The pellet was dissolved in a minimal volume (0.3 mL) of buffer A and desalted using a Sephadex G-25 column (1 × 20 cm, 15 mL) equilibrated with buffer containing Bicine (30 mM, pH 7.5), TCEP (5 mM), and 3% inositol. This procedure yielded NrdD that was >90% pure by SDS-PAGE.
Exchange of Proteins into D2O Buffer
Reaction buffer containing Bicine (30 mM, pH 7.5), KCl (30 mM), MgSO4 (10 mM), and 3% inositol was prepared in D2O and lyophilized to remove exchangeable protons, brought into the glovebox, and redissolved in D2O (99.9%, Cambridge Isotope Laboratories). NrdD and NrdG were exchanged into this buffer by repeated dilution and concentration by ultrafiltration (Amicon YM-30), such that <1% H2O remained.
Single Turnover of NrdD with 5-[3H]-CTP and ATP in the Absence (A) or Presence (B) of Formate
(A) To minimize levels of formate in the assay, components of the protein storage and reaction buffers found to contain a formate contaminant (Tris base, glycerol, and DTT) were substituted with compounds containing undetectable levels of formate (TEA, inositol, and TCEP). The reaction was initiated in a glovebox in a 4 °C cold room by mixing a solution of activated NrdD (20 μL) with a solution containing 5-[3H]-CTP, ATP, and all other components of the reaction buffer (5 μL). The final reaction mixture contained NrdD (100 μM), 5-[3H]-CTP (1.5 mM), ATP (1.5 mM), TEA (30 mM, pH 7.5), KCl (30 mM), and MgSO4 (10 mM). After 40 s, the reaction was quenched by addition of 2% perchloric acid (20 μL).
(B) NrdD was incubated with 5-[3H]-CTP and ATP as described above, followed by addition of a mixture (1 mL) of HCO2Na (10 mM), MgSO4 (3 mM), TEA (10 mM, pH 7.5), and unlabeled CTP (1 mM). Subsequent to mixing, the sample was immediately quenched with 17 μL of 60% perchloric acid. The total reaction time with formate prior to quenching with acid was <5 s.
In both cases, the samples were neutralized with KOH while cooling on ice, and the precipitated KClO4 was removed by centrifugation. Quantification of 5-[3H]-Cyt and 5-[3H]-dC was carried out as described above. To a 7 mL portion of the eluate of the Dowex-1-borate column, containing a mixture of 5-[3H]-Cyt and 5-[3H]-dC, was added carrier Cyt and dC (10 nmol each). The mixture was concentrated by lyophilization, redissolved in water, cooled on ice, and the precipitated borate salts removed by centrifugation. The supernatant was analyzed by HPLC using an Alltech Econosil column (C18, 10 μm, 250 × 4.6 mm) on a Waters 515 HPLC system equipped with a 2996 photodiode array detector. The compounds were eluted with KPi (20 mM, pH 6.8) at a flow rate of 1.0 mL/min. Fractions were collected (0.5 mL) and analyzed by scintillation counting. Cyt and dC were identified by coelution with a standard.
Electronic Structure Calculations on a Model Thiosulfuranyl Radical
Ab initio calculations were performed using the Q-Chem software package, version 4.1.42 Unless otherwise specified, calculations were performed in the gas phase, using spin-unrestricted Kohn–Sham density functional theory (KS-DFT) with the B3LYP approximate functional43 and the 6-31++G** basis set.44 All spin-unrestricted calculations were verified to have spin contamination of <0.5% based on the calculated expectation of the spin operator ⟨S2⟩ and its deviation from the ideal value of 0.75 (for a doublet system with spin quantum number s = 0.5). Visualizations were generated using the Visual Molecular Dynamics (VMD)45 program using orthographic projection, with isosurface values of 0.05 for the orbitals and 0.0025 (0.052) for the spin densities, respectively.
The thiosulfuranyl radical formed from the methanethiyl radical and ethylmethylsulfide was used as a minimal model system to investigate the electronic structure of the NrdD thiosulfuranyl radical. The model was constructed using the atomic coordinates of the side chains of C79 and M288 in the crystal structure of bacteriophage T4 NrdD (PDB accession ID 1HK8, Figure S1A).25 Hydrogen atoms were added, and their positions optimized while fixing the heavy atoms in place. A plausible reaction coordinate for the formation of a thiosulfuranyl radical was then calculated. At each point along the reaction profile, the (methanethiyl) S1- (ethylmethylsulfide) S2 distance was fixed, and all the other coordinates were allowed to relax, to obtain the potential energy of the structure as a function of S1–S2 separation. The stationary points on the potential energy surfaces were verified to be true minima by ensuring that they contain no imaginary frequencies. The resulting reaction coordinate represents the enthalpic contribution to creating a structure of a given S1–S2 separation in the gas phase at 0K.
Results
Two experimental challenges had to be overcome in order to study the reaction of NrdD, CTP, and ATP in the absence of the reductant formate. The first was to optimize G• formation, and the second was to remove formate contaminants in the reaction mixture components so that the first half-reaction of RNR could be studied.
Generation of NrdD G•
E. coli NrdD and NrdG were expressed and purified by minimal modification of reported procedures,36,46 with the inclusion of 50 μM zinc sulfate in the expression media for NrdD. The generation of G• requires the activating enzyme NrdG, SAM, and a reductant for the NrdG-[4Fe4S] cluster. Previously studies have shown that generation of G• by NrdG can be carried out catalytically with the E. coli flavodoxin (FldA)/ flavodoxin reductase (Fpr) system36,47,48 or with a stoichiometric amount of NrdG and photoreduced deazaflavin.49 We wanted to activate NrdD catalytically to minimize possible interference from the activating components, which are difficult to routinely remove due to the O2-sensitivity of G•. We also wanted to avoid the FldA/Fpr system because an EPR signal from the FldA semiquinone might complicate analysis of the EPR spectra. We initially focused on using a catalytic amount of NrdG activated with photoreduced deazaflavin. However, this method proved unsuccessful as this photoreducant resulted in the reversible quenching of G•.
Several photoreductant/coreductant pairs were screened, including all combinations of photoreductants acriflavin, fluorescein, and Rose Bengal and coreductants EDTA, tetramethylethylenediamine, TEA, Bicine, and cysteine. The Rose Bengal/Bicine pair was chosen because it did not reduce the NrdD-G•. This pair was used for all EPR experiments. However, Bicine contains a small amount of formate (see Removal of Formate from Reaction and Protein Storage Buffers section), and thus it was replaced with Rose Bengal/TEA for all experiments involving product analysis, where the complete removal of formate is desired. NrdD purified and activated in either way had ∼0.5 G• per peptide (Figure 2i) and a specific activity of ∼1500 U/mg for CTP reduction, consistent with literature values.36
Removal of Formate from Reaction and Protein Storage Buffers
When NrdD, [3H]-CTP, and allosteric effector ATP were incubated in the absence of formate and analyzed for product, we were surprised to detect dCTP. Since the formation of dCTP requires a reductant, we suspected that formate contaminated one or more of our reagents. Several methods were used to assess its presence. Using a coupled assay with formate dehydrogenase, formate was detected in the Tris base and glycerol used in the protein storage and reaction buffers. These components were thus replaced with TEA and inositol. A second more sensitive assay monitored [3H]-dCTP formation, which suggested formate presence in DTT. DTT had been shown to be important for high activity of NrdD.36 We found that NrdD activity could be maintained by replacing it with 5 mM TCEP in the NrdD storage buffer. Using this formate-free buffer, dCTP production from the reaction of NrdD with CTP was largely eliminated.
A New Radical Generated by the Reaction of NrdD with CTP and ATP in the Absence of Formate
Figure 3i shows the cw X-band EPR spectrum of the G• that is generated by NrdG. Incubation of activated NrdD with CTP and allosteric effector ATP for 1 min at 4 °C led to the loss of G• and the appearance of a new radical shown in Figure 3ii, accompanied by a spin loss of ∼5%. Subsequent addition of saturating amounts of formate (10 mM, KM = 0.2 mM)23 led to the disappearance of the new radical and return of the G• spectrum with a yield of ∼80%.
Figure 3.
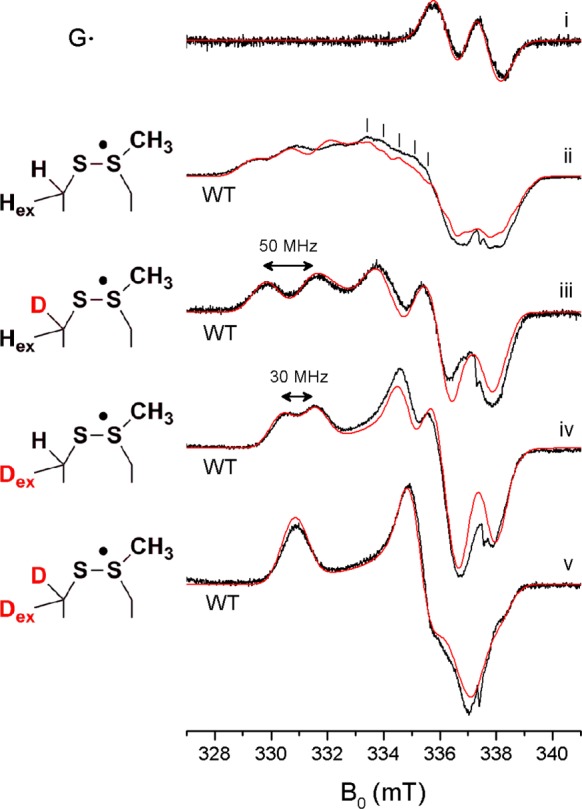
X-band cw EPR spectra (black) and simulations (red) of NrdD glycyl and thiosulfuranyl radicals. See the text and Table 1 for the simulation parameters. All experimental spectra were scaled to the simulation. The narrow signal of the G• was scaled by a factor of one-tenth for comparison with the broader signals of the new radical. The spectral artifact at 337.5 mT (ge) is due to an impurity in the cryostat. (i) The G• in activated NrdD. (ii–v) The thiosulfuranyl radical generated by reaction of CTP and ATP in the absence of formate with (ii) NrdD in H2O, (iii) [β-2H]-cys-NrdD in H2O, (iv) NrdD in D2O, and (v) [β-2H]-cys-NrdD in D2O.
The X-band spectrum of the new radical shows significant g-anisotropy. In addition, three peaks at 329, 331, and 332 mT and structure in the region of 333–340 mT suggest hyperfine interactions with several protons.
In analogy with the mechanism of the class Ia RNRs, we hypothesize that in the absence of formate, NrdD catalyzes cleavage of the 3′ C–H bond and loss of H2O from CTP to form 3′-keto-dCTP, generating a thiyl radical on C175 (Figure 1C, 7). Because the new radical is long-lived (t1/2 ∼10 min at 4 °C), we propose that it might be the C175 thiyl radical stabilized by a bonding interaction with the conserved M382 residue on the thiyl radical loop, in the form of a thiosulfuranyl radical (Figure 1C, 8),50−52 resembling the disulfide anion radical (Figure 1B, 4) of the class Ia RNR. In the crystal structure of T4 NrdD,25 the distance between the sulfur atoms of C79 and M288 is 4.4 Å (Figure S1A).
To test this hypothesis, we pursued further EPR spectroscopy of the new radical at high microwave frequency to separate g-anisotropy from hyperfine interactions, in combination with isotope labeling of NrdD at X-band frequency to identify the proton hyperfine interactions contributing to the spectrum.
Characterization of the New Radical by EPR Spectroscopy
g-Values Support a Thiosulfuranyl Radical
Figure 4 shows the echo-detected 140 GHz EPR spectrum of activated NrdD reacted with CTP and ATP. The spectrum is dominated by a broad signal stretching from 4.902 to 4.998 T arising from a radical with a rhombic g-tensor but also shows a narrow signal around 4.993 T. The narrow signal is readily assigned to residual G• present in the sample.53 The broad signal must therefore be due to a new radical(s). The principal values of its g-tensor are gx = 2.040, gy = 2.013, gz = 2.0016. These g-values are inconsistent with a thiyl radical, where the gx value is expected to be shifted further downfield54,55 but are similar to g-values previously reported for putative thiosulfuranyl radicals.55,56
Figure 4.
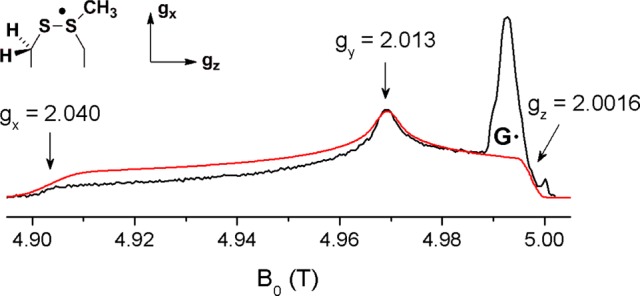
140 GHz echo-detected EPR spectrum (black) and simulation (red) of the NrdD thiosulfuranyl radical in H2O. See the text for the simulation parameters. At 5.00 T, an impurity from the sample tube is apparent.
[β-2H]-cys-NrdD Reveals a Hyperfine Interaction with a Cysteine β-Proton
If the new radical is partially localized on C175 it will likely exhibit hyperfine interactions with its β-protons. [β-2H]-cys-NrdD was prepared and reacted with CTP and ATP. The resulting X-band EPR spectrum is shown in Figure 3iii. It reveals, in comparison with the unlabeled NrdD (Figure 3ii), loss of a strong hyperfine interaction, providing evidence for localization of the radical on cysteine. Another, strong hyperfine interaction remains and now dominates the spectrum.
Reaction in D2O Suggests a Hyperfine Interaction with a Solvent-Exchangeable Proton
In search of the origin of this other proton hyperfine interaction (Figure 3iii), we obtained the X-band spectrum of the reaction of NrdD with CTP and ATP carried out in D2O (Figure 3iv). Again, the spectrum has clearly lost a strong hyperfine interaction, which suggests that the unpaired electron interacts with a solvent exchangeable proton. At 4 °C this exchange is complete within the 1 min required for sample preparation, and longer incubation does not lead to further changes in the signal profile.
Finally, carrying out the reaction of [β-2H]-cys-NrdD in D2O leads to a spectrum that no longer shows any resolved hyperfine interactions (Figure 3v). Comparison of this spectrum with unlabeled NrdD in D2O reveals an isotropic hyperfine interaction of ∼30 MHz with the nonexchangeable β-proton of cysteine. Comparison of this spectrum with [β-2H]-cys-NrdD in H2O, on the other hand, reveals a hyperfine interaction of ∼50 MHz associated with the exchangeable proton, possibly the second β-proton of cysteine.
NrdD-(S386E) Mutation Prevents Detectable Proton Exchange on the Radical
The exchange of a β-proton of cysteine is unexpected and thus requires further verification. We hypothesized that if this exchange involved deprotonation to form a thiyl radical anion (Figure 5A), then introduction of a negative charge near the radical could disfavor this process. The structure of T4 NrdD suggests that C175 of E. coli NrdD is positioned close to S386, which resides on the thiyl radical loop and aligns with E441 in E. coli NrdA, a residue thought to act as a general base/acid catalyst in the class Ia RNR (compare Figures S1A and S1B). We constructed the NrdD-(S386E) mutant and reacted it with CTP and ATP in D2O. NrdD-(S386E) has activity <1% that of NrdD-(WT), and the new radical also formed at a much slower rate than with NrdD-(WT), requiring a reaction time of ∼1 h. The X-band spectrum of NrdD-(S386E) in D2O resembles the spectrum of NrdD-(WT) in H2O (compare Figure 5Bi with Figure 3ii), which suggests that the proton exchange is blocked and that the structure of the radical remains largely unaffected.
Figure 5.
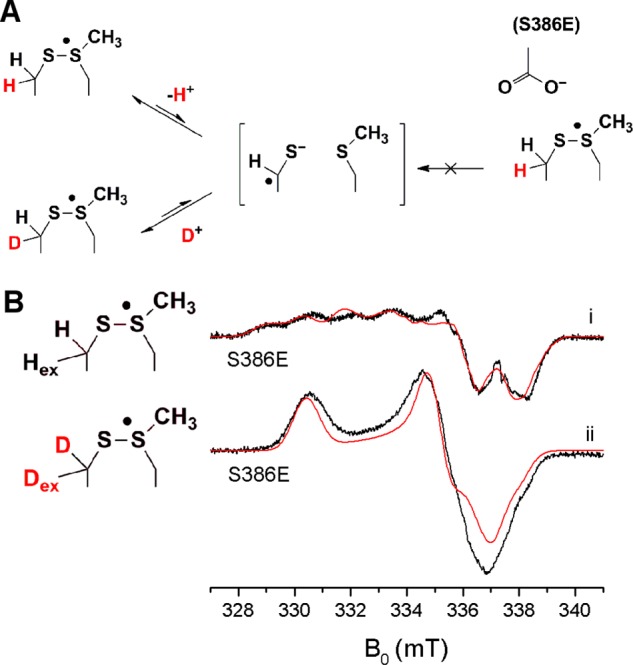
(A) Proposed mechanism for proton exchange on C175, which is prevented in NrdD-(S386E). (B) X-band cw EPR spectra (black) and simulations (red) of (i) NrdD-(S386E) in D2O and (ii) [β-2H]-cys-NrdD-(S386E) in H2O. See the text and Table 1 for the simulation parameters. The spectral artifact at 337.5 mT (∼ge) is due to an impurity in the cryostat.
[β-2H]-cys-NrdD-(S386E) Establishes That the Exchangeable Proton Is a Cysteine β-Proton
The suppression of the proton exchange by NrdD-(S386E) allows the site of the exchangeable proton to be unambiguously established. A reaction of [β-2H]-cys-NrdD-(S386E) in H2O with CTP and ATP revealed the spectrum in Figure 5Bii, which is very similar to that of [β-2H]-cys-NrdD-(WT) in D2O (Figure 3v). Thus, the exchangeable proton is a β-proton of C175, and the exchange occurs stereospecifically.
[ε-2H]-met- and [β,γ-2H]-met-NrdD Reveal Hyperfine Interaction with Methionine ε- and γ-Protons
We hypothesize that the new radical involves M382 (Figure 1C 7 and 8). To test this model, [ε-2H]-met-NrdD was prepared, and the resulting radical examined for the effects of isotopic substitution. Comparison of the spectrum of [ε-2H]-met-NrdD (Figure 6i) and unlabeled NrdD (Figure 3ii) in H2O revealed sharpening of the three peaks between 329 and 332 mT. Moreover, in the region 333–340 mT, a fine structure consisting of lines separated by 0.5 mT (marked with vertical lines in Figure 6i) has become clear. This fine structure is also present in the spectrum of unlabeled NrdD in H2O (Figure 3ii, see vertical lines) but is not fully resolved. This shows that in unlabeled NrdD, the fine structure is masked by a broadening of the peaks due to unresolved hyperfine interactions with the three ε-protons of methionine.
Figure 6.
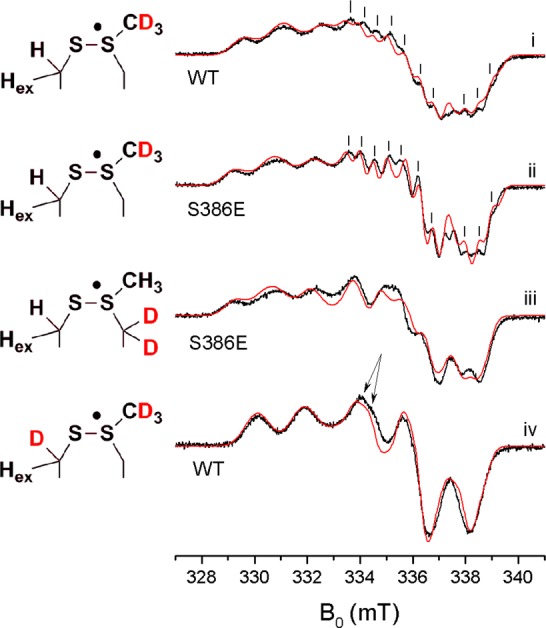
X-band cw EPR spectra (black) and simulations (red) of the NrdD thiosulfuranyl radical in (i) [ε-2H]-met-NrdD in H2O; (ii) [ε-2H]-met-NrdD-(S386E) in D2O; (iii) [β,γ-2H]-met labeled NrdD-(S386E) in H2O, and (iv) [β-2H]-cys,[ε-2H]-met-NrdD in H2O. See the text and Table 1 for the simulation parameters.
To further investigate the fine structure, we obtained the spectrum of [ε-2H]-met-NrdD-(S386E) in D2O (Figure 6ii). D2O exchanges the envelope protons around the active site, sharpening the features associated with the thiosulfuranyl radical, while the S386E mutation prevents exchange of the C175 β proton. Comparison of this spectrum (Figure 6ii) with that of the corresponding NrdD-(WT) (Figure 6i) reveals an almost identical radical signal with sharpened features. The fine structure could be reproduced in the simulation by including two additional hyperfine interactions of ∼14 MHz, which we propose to be associated with the two γ protons of M382.
Evidence for this hypothesis was obtained from the spectrum of [β,γ-2H]-met-NrdD-(S386E) in H2O (only the doubly labeled methionine is commercially available). The results shown in Figure 6iii reveal the loss of the two ∼14 MHz hyperfines, consistent with our model. Thus, our studies using a combination of [ε-2H]-met- and [β,γ-2H]-met-labeled proteins support the role of methionine in the thiosulfuranyl radical.
Simulation of the EPR Spectra
As shown in Figures 3–6, simulations of the EPR spectra using the EPR simulation package EasySpin57 were successfully performed, providing the underlying g-values and hyperfine interactions that support our electronic and structural assignments. The simulation of the spectrum of NrdD-(WT) in H2O (Figure 3ii) was built step-by-step. First, g-values obtained at 140 GHz were used. Then, the hyperfine interactions were estimated for each of the four different types of protons from the appropriately labeled NrdDs in H2O and D2O (Figure 3ii–v and Figure 6). Finally all hyperfine interactions were optimized in a manual, global fit of all acquired spectra. These hyperfine interactions are summarized in Table 1.
Table 1. Proton Hyperfine Interactions in MHz Used to Simulate the EPR Spectra of the NrdD Thiosulfuranyl Radical Shown in Figures 3–6.
| Az | Ay | Ax | |
|---|---|---|---|
| [ex β-1H]-cys | 50 | 49 | 48 |
| [nonex β-1H]-cys | 33 | 28 | 28 |
| [γ-1H]-met | 11 | 14 | 14 |
| [ε-1H]-met | 10 | 10 | 10 |
The quality of all of the 9 and 140 GHz simulations improved when we included an isotropic line-broadening of 0.4 mT peak–peak and a g-strain 10% of |gi - ge|, with i = x, y, z and ge the g-value for the free electron. Furthermore, all samples were found to contain a residual 5–10% G•. To simulate its contribution to the spectra, its g-values (gx = 2.0044, gy = 2.0035, gz = 2.0023),53 an isotropic hyperfine interaction with a proton of aiso = 39 MHz, and an isotropic line-broadening 1 mT peak–peak was included. For simulations of the thiosulfuranyl radical on NrdD-(S386E), the parameters derived from the spectra of NrdD-(WT) were used, except that gx was adjusted to 2.042.
Additional observations concerning the simulations require comment. First, the match between our spectra and the simulations improved with the introduction of a small anisotropy to three of the four proton hyperfine interactions listed in Table 1. This anisotropic contribution arises from a dipole–dipole interaction and is expected to be small between a “π-electron” and a “π-proton” that lies above or below the plane of the electron spin distribution58 (see Figure 7A and the quantum chemical calculations in the Quantum Chemical Calculations section). Because these dipolar contributions are small, we did not attempt to quantify them by using more advanced fitting methods as they depend on three unknown Euler angles for every proton, which cannot be accurately determined from our current data set.
Figure 7.

(A) Frontier molecular orbitals for the model thiosulfuranyl radical formed from methanethiyl radical and ethylmethylsulfide. Diagrams for the α and β spin orbitals are shown separately on the left and right, respectively, together with orbital energies in kcal/mol, which represent the ionization enthalpy of the electron in that orbital. For each diagram, the leftmost and rightmost orbitals represent the fragment molecular spin orbital of the methanethiyl and methylethylsulfide fragments, respectively, which mix to produce the σ bonding and σ* antibonding orbitals. Snpz refers to the 3pz orbital on the sulfur atom of fragment n (1 = methanethiyl, 2 = ethylmethylsulfide). (B) Atomic spin populations obtained from Löwdin population analysis on the model thiosulfuranyl radical, showing excess spin density localized primarily on the sulfur atoms and secondarily on two of the hydrogen atoms of the methanethiyl fragment. Values in red indicate significant spin populations exceeding 0.01 in magnitude.
Second, on the low-field side of the 140 GHz spectrum (Figure 4) the intensity is lower than predicted by the simulation. This is caused by anisotropy of the relaxation properties of the thiosulfuranyl radical, also observed for thiyl radicals.59,60
Third, although the spectrum of [β-2H]-cys-NrdD in H2O (Figure 3iii) does not show any resolved fine structure due to the two γ-protons of methionine, the quality of the simulation improves when these hyperfine interactions is included. The same is true for the spectrum of [β-2H]-cys and [ε-2H]-met NrdD in H2O (Figure 6iv), where including the γ-proton hyperfine interactions in the simulation reproduces the unresolved splitting of the 334 mT peak (marked with arrows).
Fourth, and in contrast with the above observation, in all samples where the exchangeable cysteine β-proton is replaced by deuterium (Figures 3iv,v and 5ii), inclusion of the hyperfine interactions with the methionine γ-protons in the simulation gives rise to features that are not observed in the experimental spectra. More advanced EPR techniques such as [2H]-ENDOR spectroscopy are required to investigate the presence of any interaction of the radical with the methionine γ-protons in these and other samples and to more accurately measure the hyperfine interactions that we have assigned.
Quantum Chemical Calculations
Molecular Orbitals of the Model Thiosulfuranyl Radical
To better understand the electronic structure and bonding in thiosulfuranyl radicals, we undertook a computational study using a minimal model system consisting of methanethiyl radical and ethylmethylsulfide. DFT calculations were performed to obtain a plausible reaction coordinate for the formation of a thiosulfuranyl radical. This analysis yielded the reaction profile shown in Figure S2, as a function of the separation of the thiyl (S1) and thioether (S2) sulfur atoms. An energetically minimal structure was found at a S1–S2 distance of 3.2 Å, with a binding energy of −1.8 kcal/mol relative to dissociated methanethiyl radical and ethylmethylsulfide.
The molecular orbitals involving the sulfur 3p orbitals of the nonoptimized structure derived from the X-ray structure coordinates are shown in Figure S3, while those of the energetically minimal structure are shown in Figure S4. The unrestricted DFT calculation yields separate spin orbitals for the α and β (up and down) spin electrons. While all the sulfur 3p orbitals of the nonoptimized structure are noninteracting (Figure S3), the S1 and S2 3pz orbitals of the energetically minimal structure engage in a bonding interaction (Figure S4). The σ* antibonding singly occupied molecular orbital (SOMO) and the σ bonding SOMO-1 are highlighted in Figure 7A. Together, they account for a S1–S2 three-electron σ-bond of order 1/2. The frontier orbitals show significant electron amplitude on two of the hydrogen atoms on the methanethiyl fragment. Localization of a hydrogen atom within the lobe of the βσ* orbital could account for its lability as observed in the EPR experiments. The lack of bonding in the nonoptimized protein structure, where S1 and S2 are separated by 4.4 Å suggests that a conformational change is required to bring C175 and M382 within bonding distance.
The spin density isosurfaces are shown in Figure S5. Excess spin density coincides with the σ* orbital, with a small component on two of the methanethiyl hydrogens. To quantify the spin excesses on an atomic level, Löwdin population analysis61 was performed on the spin density matrix, and the resulting spin charges are shown in Figure 7B. Most of the spin (83%) is localized on the methanethiyl sulfur, with a smaller population (15%) on the thioether sulfur. In addition, a small amount of excess spin is localized on two methanethiyl hydrogens (2.1% and 2.5%) and to a lesser extent on several protons adjacent to the thioether group (0.1–0.5%), which is consistent with the observation of hyperfine interactions with the cysteine β-protons and methionine γ- and ε-protons in the NrdD radical. In NrdD, the relative magnitude of the hyperfine interactions likely depends on the angle of rotation about the cysteine and methionine C–S bonds, which are dictated by the constraints of the protein scaffold.
Fate of CTP during the Production of the Thiosulfuranyl Radical
Reaction of NrdD with CTP and ATP in the Absence of Formate Generates Cytosine
As shown in Figure 1C, we propose that formation of the thiosulfuranyl radical involves NrdD catalyzing the conversion of CTP to 3′-keto-dCTP (Figure 1C, 7 and 8). To investigate the fate of CTP during the reaction, the thiosulfuranyl radical was generated by incubating NrdD with 5-[3H]-CTP and ATP in the formate-free buffer for 40 s at 4 °C followed by quenching in 1% perchloric acid. Workup of the reaction using a Dowex-1-borate column, as shown in Figure 8, gave 1.0 ± 0.14 equiv of 5-[3H]-Cyt and 0.38 ± 0.25 equiv of dC (identified by comigration with a standard using HPLC). The former is a breakdown product of 3′-keto-dCTP (Figures 2 and 8), consistent with our proposed model, and the latter is attributed to our inability to completely remove formate from the reactions components.
Figure 8.
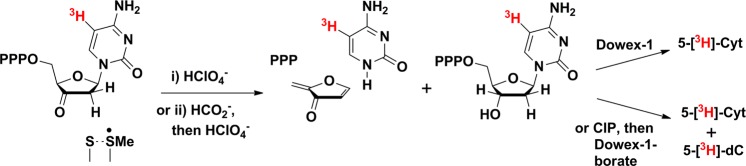
Products formed after quenching of the thiosulfuranyl radical generated by reaction of NrdD with 5-[3H]-CTP and ATP. (i) Quenching with perchloric acid leads to release of 5-[3H]-Cyt from breakdown of 5-[3H]-3′-keto-dCTP. (ii) Addition of formate prior to quench leads to conversion of 3′-keto-dCTP to 5-[3H]-dCTP. HPLC analysis distinguishes 5-[3H]-Cyt from 5-[3H]-dC. CIP is calf intestinal alkaline phosphatase.
Addition of Formate to the Thiosulfuranyl Radical Species Results in dCTP Formation
As noted above, addition of 10 mM formate to the thiosulfuranyl radical results in the recovery of 80% of the initial G•. We propose that during this reaction, NrdD-bound 3′-keto-dCTP is reduced to dCTP, completing the catalytic cycle. The experiment was repeated as described above, incubating NrdD, 5-[3H]-CTP, and ATP in formate-free buffer for 40 s at 4 °C. A 1 mL solution containing 10 mM formate and 1 mM CTP was then added, followed by immediate quenching by hand with 1% perchloric acid. The unlabeled CTP was added to dilute 5-[3H]-CTP 27-fold to limit the contribution of [3H]-dCTP to the first turnover.
The work-up is as described (Figure 8), and the results reveal 0.12 ± 0.03 equiv of 5-[3H]-Cyt and 1.57 ± 0.21 equiv of 5-[3H]-dC (see Table 2). Comparison with the products formed by acid quench without addition of formate reflects a decrease in the amount of Cyt and increase in the amount of dC detected. This suggests that 0.88 ± 0.14 equiv of enzyme-bound 3′-keto-dCTP is consumed and converted to dCTP and that NrdD carries out only 0.3 additional turnovers between addition of formate and acid quench.
Table 2. Amount of 5-[3H]-Cyt and 5-[3H]-dC Formed Per G• after Quenching the Thiosulfuranyl Radical via Method (i) or (ii) in Figure 8a.
| workup | Cyt (equiv) | dC (equiv) |
|---|---|---|
| (i) | 1.00 ± 0.14 | 0.38 ± 0.25 |
| (ii) | 0.12 ± 0.03 | 1.57 ± 0.21 |
Average of five experiments (results for the individual trials are given in Figure S6).
To account for the 0.12 equiv of Cyt remaining after reaction with formate, we suggest that during the reaction time of 40 s prior to addition of formate, some amount of the 3′-keto-dCTP dissociates from the enzyme and decomposes to Cyt before or during the acid quench. However, it is remarkable that the results suggest that the 3′-keto-dCTP remains largely sequestered in the active site during this period.
Discussion
Thiyl radicals have long been proposed to be involved in a diverse range of enzymatic reactions from the pyruvate-ferredoxin oxidoreductase62 to pyruvate formate lyase63 and all classes of RNRs.5 More recent examples include mechanistically diverse glycyl radical enzymes involved in fermentation,64−66 in the environmentally important processes of anaerobic hydrocarbon activation,67−69 and the noncanonical glycyl radical enzyme involved in the formation of methane from methyl phosphonate.70 However, the spectroscopic observation of thiyl radicals and the demonstration of their kinetic competence has been challenging due to their short lifetimes and the large spin–orbit coupling with the sulfur atom, which results in short relaxation times and large g-anisotropy and as a consequence broad EPR lines.71
In the class I and II RNRs, three cysteines are involved in nucleotide reduction (Figure 1A,B): the transient thiyl radical located on the top face of the nucleotide and two cysteines located on its bottom face that are converted to a disulfide in the reduction process. Only in the case of the Lactobacillus leichmannii class II RNR has evidence for the involvement of a kinetically competent top face thiyl radical in the first half-reaction (Figure 1A) been demonstrated.3,54 The evidence in support of this mechanism for the class I and III RNRs is inferred based on structural homology of all the classes of RNRs5 and extensive biochemical studies.
In the second half-reaction (Figure 1B), the involvement of a thiyl radical in the nucleotide reduction by the bottom face cysteines has been postulated.15 In the E. coli class Ia RNR, E441 is believed to provide the proton required for the reduction of the 3′-keto-deoxynucleotide by the disulfide anion radical via proton-coupled electron transfer (Figure 1B, 4 and 5). Support for this proposal has been provided by studies with the E441Q mutant that causes accumulation of the disulfide anion radical on the 10 s time scale, allowing its detection by pulsed, high-field EPR spectroscopy.19 However, a limitation from the mutant studies is that the trapped radical is not chemically competent for deoxynucleotide formation because the essential proton for the PCET step is missing. Thus, the detailed mechanism of the bottom face reduction chemistry, and specifically the involvement of thiyl radicals, has remained elusive.
Unlike class I and II RNRs, the class III RNRs studied to date use formate as a reductant.23 We hoped that examination of this RNR might shed light on the second half-reaction of all RNRs. Here we have shown that omission of formate from our assays leads to accumulation of a new radical upon reaction of NrdD with CTP and ATP, accompanied by formation of a bound cytidine species proposed to be 3′-keto-dCTP (Figure 1C, 7 and 8). Furthermore, addition of formate converts the bound nucleotide into dCTP with recovery of the G•. Our studies suggest that the new species is a thiosulfuranyl radical and demonstrate its chemical competence. These results provide further evidence for the involvement of a thiyl radical in the reductive half-reaction of RNRs in general.
Evidence for the Thiosulfuranyl Radical
Assignment of the structure of the new radical is based on results from isotopic labeling studies with various NrdDs accompanied by analysis of their X band EPR spectra, g-values obtained by 140 GHz EPR studies, structural insight from the bacteriophage T4 NrdD, and computational studies. Important insight is also provided by recent DFT and correlated ab initio calculations by Van Gastel et al.72 on the electronic structure of the cysteine thiyl radical and its unusual EPR parameters. Thiyl radicals exhibit broad g-anisotropy with gx-values (x axis parallel to the Cβ–S bond) that range from 2.10 to 2.49.60 In the cysteine thiyl radical, the EPR g-values are sensitive to the energy difference between the nearly degenerate singly occupied orbital (SOMO with a predominant py character in Van Gastel’s system) and one of the lone-pair orbitals (pz).72 This unusual property makes gx highly sensitive to radical conformation and H-bonds and requires an expression for the g-tensor in which third-order corrections must be taken into account.
The g-tensor for our new radical from the 140 GHz EPR spectrum is also anisotropic (Figure 4), with a gx value of 2.040. This value is distinct from the thiyl radicals and is consistent with the range of values reported for candidate thiosulfuranyl radicals generated by pulse radiolysis and laser flash photolysis of a range of thiols (2.027–2.058).55,56,73 The S–S bonds in these structures are weak and have only been observed in small molecules containing electronegative alkyl substituents (CF3SSR2• or R′COSSR2•),74 in glasses/solid matrices, or in intramolecular cases.52 Arguments in favor of the assignment of these species as thiosulfuranyl radicals are described by Symons and co-workers.56 In NrdD, the formation of the thiosulfuranyl radical is likely favored by the juxtaposition of the C175 and M382 sulfur atoms within the active site by the protein.
Our calculations on a model thiosulfuranyl radical provide an explanation for our observed gx value relative to that of a thiyl radical. They suggest that the σ* antibonding SOMO and the σ bonding SOMO-1 together account for a weak, S1–S2 three-electron σ-bond of order 1/2 due to the interaction between the sulfur 3pz orbital of the thiyl radical and a nonbonding orbital of the thioether. This interaction is expected to perturb both the symmetry and degeneracy of the thiyl radical 3py and 3pz orbitals, shifting the gx value closer to that of the free electron.
Our isotopic labeling studies with NrdD/CTP/ATP provide strong evidence for localization of the radical on cysteine and methionine as hyperfine interactions associated with both cysteine β-protons and the methionine ε- and γ-protons are observed. The spin densities from our DFT calculations also suggest that excess spin of the three-electron bond includes small packets of spin localized on the cysteine β-protons and to a lesser extent on the adjacent ε and γ protons of methionine (Figures 7B and S5).
One initially puzzling observation from our EPR analyses was that one of the cysteine β-protons on the thiosulfuranyl radical was exchangeable with the solvent. However, perusal of the literature focused on examining the fate of thiyl radials generated by a variety of different methods in small molecules (cysteine, penicillamine, glutathione) in D2O revealed reversible deuterium incorporation into both the β and/or α positions.73,75,76 In cysteamine radicals generated by pulse radiolysis in acidic solution, hydrogen-transfer reactions lead to the equilibration of +H3NCH2CH2–S• and +H3NCH2•CH–SH species with very fast forward and reverse rates of k12 ≈ 105 s–1 and k21 ≈ 1.5 × 10⁵ s–1, respectively.75 In the case of NrdD C175, we propose that its β-CH bond might be weakened by a hyperconjugative interaction with the singly filled sulfur pz orbital, facilitating its deprotonation and allowing exchange with deuterium from the solvent, although the mechanism remains to be determined. This result is also consistent with our DFT calculations showing the localization of a proton within a lobe of the S–S σ* orbital, and the observation that of the two diasteriotopic β-protons on cysteine (we do not know which one), the one with the largest hyperfine interaction is exchanged. The exchange is prevented in NrdD-(S386E), where the negative charge adjacent to the radical was designed to destabilize the conjugate anion and thus disfavor deprotonation (see Figure S1). Finally, the rapid exchange of hydrogens adjacent to the thiyl radical might provide a diagnostic for thiyl radicals in general which have been, for reasons outlined above, challenging to observe.
Mechanistic Insight into the Reductive Half-Reactions of RNRs in General
Based on earlier studies20,23,24,26,77 and our observations reported herein, we propose the mechanistic model for nucleotide reduction shown in Figure 1C for the class III RNR. The reaction is initiated by the generation of the CTP 3′-radical (2) by the C384 thiyl radical. In the absence of basic residues in the active site, formate has been proposed to act as a base to catalyze water loss to form a ketyl radical (3).77 The ketyl radical gains an electron from C175 and a proton from formic acid, forming 3′-keto-dCTP and generating the thiosulfuranyl radical (8). For the experiments in formate-free buffer, 3′-keto-dCTP can still be generated without base catalysis. This observation is analogous to the E441Q mutant in the class I RNR where the 3′-keto-dCDP is still formed, but at a much slower rate.
Exchange of formate between the active site and buffer after formation of this stable radical rationalizes the [3H]-formate isotope effect of 2.3 measured on the reduction process.23 Oxidation of formate by the thiosulfuranyl radical generates CO2•– (9). A similar reaction between formate and DTT radicals generated by pulse radiolysis has previously been reported.78 The relative reduction potentials of CO2•– (E° = −1.90 V) and (CH3)2CO•– (E° = −2.10 V)79 suggest that reduction of 3′-keto-dCTP to the dCTP 3′-radical (10) may require the concerted delivery of a proton from an unknown source. Alternatively, the delivery of the proton and electron may occur via a stepwise mechanism as shown in Figure S7. Reduction of the product radical generates dCTP and regenerates the C384 thiyl radical (11).
In our mechanistic model, the C175 thiyl radical serves as the oxidant for formate. Although the function of the thiosulfuranyl radical, a stabilized form of the C175 thiyl radical, is not understood, its stoichiometric formation and ability to catalyze the formation of deoxynucleotide upon formate addition suggest its mechanistic importance. We hypothesize that since formate can enter and leave the active site even after generation of radical intermediates, formation of this species might protect the C175 thiyl radical in vivo under conditions when formate levels are low and the enzyme is saturated with substrate and effector nucleotides.
Bioinformatics and the Nature of the Class III RNR Reductant
The unanticipated identification of a residue (M382) that plays a part in the reaction with formate provides us with a handle to search for NrdDs that use alternative reductants among the many metabolically diverse organisms with sequenced genomes. An examination of the RNRdb80 shows that M382 is not strictly conserved (Figure S8). However, all annotated archaeal and bacterial NrdD sequences lacking this M382 residue contain a cysteine residue in place of G383 on the thiyl radical loop adjacent to C384 (Figure S9), in a position that may allow formation of a disulfide with the bottom face thiol. In addition, the bacterial proteins contain a conserved glutamate residue aligning with Y542 in the active site (compare Figures S1A and S9), placing it in a position to act as a general base/acid catalyst analogous to the role of E441 in E. coli NrdA. These residues are shown in the homology model of the Thermotoga maritima NrdD given in Figure S9. Finally, archaeal NrdDs, like those found in Archaeoglobus veneficus and Methanosarcina barkerii, contain a thioredoxin-like protein in the nrdDG operon. All these observations suggest that there exist NrdDs that use disulfide chemistry instead of formate for nucleotide reduction. The recombinant production and characterization of some of these proteins are the focus of ongoing studies.
Summary
Despite the many enzymatic reactions proposed to involve thiyl radicals,5,62,63 there have been few systems that have allowed their spectroscopic and chemical characterization. In this study we found that reaction of the E. coli class III RNR with CTP in the absence of formate resulted in stoichiometric accumulation of a thiosulfuranyl radical, comprising a cysteine thiyl radical stabilized by a three-electron bond to a methionine residue. This new sulfur-based radical joins other sulfur-based radicals observed in the other two classes of RNRs: the class Ia disulfide anion radical19 proposed to be involved directly in nucleotide reduction and the class II exchange coupled thiyl radical-cob(II)alamin54 involved in 3′-hydrogen atom abstraction that have been experimentally detected. Our results suggest that detecting thiyl radicals and controlling their reactivity may require an orchestrated constellation of residues adjacent to the thiyl radical that protects it from alternative chemistry while allowing the reaction to proceed rapidly when the substrate (effectors) is in the appropriate conformation.
Acknowledgments
We are grateful to Prof. Marc Fontecave for the gift of plasmids pRSS and pN9 and Profs. Willem Koppenol, Christian Schöneich and Bernhard Jaun for advice regarding the electronic structure and reactivity of thiyl and thiosulfuranyl radicals. G.M. was supported by a Rubicon Fellowship from The Netherlands Organisation for Scientific Research (NWO). Y.W. was supported by ASTAR, Singapore. This work was supported by NIH grants GM29595 to J.S. and EB-002804 and EB-002026 to R.G.G.
Supporting Information Available
Active sites from crystal structures of E. coli NrdA, bacteriophage T4 NrdD and homology model of T. maritima NrdD; reaction profile, frontier molecular orbitals and spin density isosurface for the model thiosulfuranyl radical; quantitation of products formed in the reaction of the thiosulfuranyl radical; alternative mechanism of nucleotide reduction by NrdD; and NrdD sequence alignment. This material is available free of charge via the Internet at http://pubs.acs.org.
Author Present Address
⊥ Department of Biochemistry, Duke University Medical Center, Durham, North Carolina 27710, United States.
The authors declare no competing financial interest.
Funding Statement
National Institutes of Health, United States
Supplementary Material
References
- Nordlund P.; Reichard P. Annu. Rev. Biochem. 2006, 75, 681. [DOI] [PubMed] [Google Scholar]
- Hofer A.; Crona M.; Logan D. T.; Sjöberg B.-M. Crit. Rev. Biochem. Mol. Biol. 2012, 47, 50. [DOI] [PMC free article] [PubMed] [Google Scholar]
- Licht S.; Gerfen G. J.; Stubbe J. Science 1996, 271, 477. [DOI] [PubMed] [Google Scholar]
- Stubbe J.; Ackles D. J. Biol. Chem. 1980, 255, 8027. [PubMed] [Google Scholar]
- Stubbe J. Proc. Natl. Acad. Sci. U. S. A. 1998, 95, 2723. [DOI] [PMC free article] [PubMed] [Google Scholar]
- Fontecave M.; Eliasson R.; Reichard P. Proc. Natl. Acad. Sci. U. S. A. 1989, 86, 2147. [DOI] [PMC free article] [PubMed] [Google Scholar]
- Sun X.; Ollagnier S.; Schmidt P. P.; Atta M.; Mulliez E.; Lepape L.; Eliasson R.; Gräslund A.; Fontecave M.; Reichard P.; Sjöberg B. M. J. Biol. Chem. 1996, 271, 6827. [PubMed] [Google Scholar]
- Sofia H. J.; Chen G.; Hetzler B. G.; Reyes-Spindola J. F.; Miller N. E. Nucleic Acids Res. 2001, 29, 1097. [DOI] [PMC free article] [PubMed] [Google Scholar]
- Gambarelli S.; Luttringer F.; Padovani D.; Mulliez E.; Fontecave M. ChemBioChem 2005, 6, 1960. [DOI] [PubMed] [Google Scholar]
- Rhodes D. V.; Crump K. E.; Makhlynets O.; Snyder M.; Ge X.; Xu P.; Stubbe J.; Kitten T. J. Biol. Chem. 2013, 289, 6273. [DOI] [PMC free article] [PubMed] [Google Scholar]
- Yokoyama K.; Uhlin U.; Stubbe J. J. Am. Chem. Soc. 2010, 132, 15368. [DOI] [PMC free article] [PubMed] [Google Scholar]
- Licht S. S.; Lawrence C. C.; Stubbe J. J. Am. Chem. Soc. 1999, 121, 7463. [Google Scholar]
- Ge J.; Yu G.; Ator M. A.; Stubbe J. Biochemistry 2003, 42, 10071. [DOI] [PubMed] [Google Scholar]
- Seyedsayamdost M. R.; Stubbe J. J. Am. Chem. Soc. 2006, 128, 2522. [DOI] [PubMed] [Google Scholar]
- Licht S.; Stubbe J. In Comprehensive Natural Products Chemistry; Barton S. D., Nakanishi K., Meth-Cohn O., Poulter C. D., Eds.; Elsevier Science: New York, 1999; Vol. 5, p 163. [Google Scholar]
- Stubbe J.; Ator M.; Krenitsky T. J. Biol. Chem. 1983, 258, 1625. [PubMed] [Google Scholar]
- Stubbe J.; Ackles D.; Segal R.; Blakley R. L. J. Biol. Chem. 1981, 256, 4843. [PubMed] [Google Scholar]
- Lenz R.; Giese B. J. Am. Chem. Soc. 1997, 119, 2784. [Google Scholar]
- Lawrence C. C.; Bennati M.; Obias H. V.; Bar G.; Griffin R. G.; Stubbe J. Proc. Natl. Acad. Sci. U. S. A. 1999, 96, 8979. [DOI] [PMC free article] [PubMed] [Google Scholar]
- Eliasson R.; Pontis E.; Eckstein F.; Reichard P. J. Biol. Chem. 1994, 269, 26116. [PubMed] [Google Scholar]
- Eklund H.; Fontecave M. Structure 1999, 7, R257. [DOI] [PubMed] [Google Scholar]
- Mao S. S.; Holler T. P.; Yu G. X.; Bollinger J. M. Jr.; Booker S.; Johnston M. I.; Stubbe J. Biochemistry 1992, 31, 9733. [DOI] [PubMed] [Google Scholar]
- Mulliez E.; Ollagnier S.; Fontecave M.; Eliasson R.; Reichard P. Proc. Natl. Acad. Sci. U. S. A. 1995, 92, 8759. [DOI] [PMC free article] [PubMed] [Google Scholar]
- Eliasson R.; Reichard P.; Mulliez E.; Ollagnier S.; Fontecave M.; Liepinsh E.; Otting G. Biochem. Biophys. Res. Commun. 1995, 214, 28. [DOI] [PubMed] [Google Scholar]
- Logan D. T.; Andersson J.; Sjöberg B.-M.; Nordlund P. Science 1999, 283, 1499. [DOI] [PubMed] [Google Scholar]
- Andersson J.; Westman M.; Sahlin M.; Sjöberg B.-M. J. Biol. Chem. 2000, 275, 19449. [DOI] [PubMed] [Google Scholar]
- Stubbe J. A.; Kozarich J. W. J. Biol. Chem. 1980, 255, 5511. [PubMed] [Google Scholar]
- Ator M. A.; Stubbe J. Biochemistry 1985, 24, 7214. [DOI] [PubMed] [Google Scholar]
- Harris G.; Ashley G. W.; Robins M. J.; Tolman R. L.; Stubbe J. Biochemistry 1987, 26, 1895. [DOI] [PubMed] [Google Scholar]
- Harris G.; Ator M.; Stubbe J. Biochemistry 1984, 23, 5214. [DOI] [PubMed] [Google Scholar]
- Sun X.; Eliasson R.; Pontis E.; Andersson J.; Buist G.; Sjöberg B.-M.; Reichard P. J. Biol. Chem. 1995, 270, 2443. [DOI] [PubMed] [Google Scholar]
- Lohman G. J.; Gerfen G. J.; Stubbe J. Biochemistry 2010, 49, 1396. [DOI] [PMC free article] [PubMed] [Google Scholar]
- Fish W. Methods Enzymol. 1988, 158, 357. [DOI] [PubMed] [Google Scholar]
- Malmström B. G.; Reinhammar B.; Vänngård T. Biochim. Biophys. Acta, Bioenerg. 1970, 205, 48. [DOI] [PubMed] [Google Scholar]
- Steeper J.; Steuart C. Anal. Biochem. 1970, 34, 123. [DOI] [PubMed] [Google Scholar]
- Luttringer F.; Mulliez E.; Dublet B.; Lemaire D.; Fontecave M. J. Biol. Inorg. Chem. 2009, 14, 923. [DOI] [PubMed] [Google Scholar]
- Smith A. A.; Corzilius B.; Bryant J. A.; DeRocher R.; Woskov P. P.; Temkin R. J.; Griffin R. G. J. Magn. Reson. 2012, 223, 170. [DOI] [PMC free article] [PubMed] [Google Scholar]
- Maly T.; Bryant J.; Ruben D.; Griffin R. G. J. Magn. Reson. 2006, 183, 303. [DOI] [PMC free article] [PubMed] [Google Scholar]
- van der Donk W. A.; Stubbe J.; Gerfen G. J.; Bellew B. F.; Griffin R. G. J. Am. Chem. Soc. 1995, 117, 8908. [Google Scholar]
- Baba T.; Ara T.; Hasegawa M.; Takai Y.; Okumura Y.; Baba M.; Datsenko K. A.; Tomita M.; Wanner B. L.; Mori H. Mol. Syst. Biol. 2006, 2, 2006.0008. [DOI] [PMC free article] [PubMed] [Google Scholar]
- Van Duyne G. D.; Standaert R. F.; Karplus P. A.; Schreiber S. L.; Clardy J. J. Mol. Biol. 1993, 229, 105. [DOI] [PubMed] [Google Scholar]
- Shao Y.; Molnar L. F.; Jung Y.; Kussmann J.; Ochsenfeld C.; Brown S. T.; Gilbert A. T.; Slipchenko L. V.; Levchenko S. V.; O’Neill D. P. Phys. Chem. Chem. Phys. 2006, 8, 3172. [DOI] [PubMed] [Google Scholar]
- Clark T.; Chandrasekhar J.; Spitznagel G. W.; Schleyer P. V. R. J. Comput. Chem. 1983, 4, 294. [Google Scholar]
- Becke A. D. J. Chem. Phys. 1993, 98, 5648. [Google Scholar]
- Humphrey W.; Dalke A.; Schulten K. J. Mol. Graphics 1996, 14, 33. [DOI] [PubMed] [Google Scholar]
- Tamarit J.; Gerez C.; Meier C.; Mulliez E.; Trautwein A.; Fontecave M. J. Biol. Chem. 2000, 275, 15669. [DOI] [PubMed] [Google Scholar]
- Bianchi V.; Eliasson R.; Fontecave M.; Mulliez E.; Hoover D. M.; Matthews R. G.; Reichard P. Biochem. Biophys. Res. Commun. 1993, 197, 792. [DOI] [PubMed] [Google Scholar]
- Bianchi V.; Reichard P.; Eliasson R.; Pontis E.; Krook M.; Jörnvall H.; Haggård-Ljungquist E. J. Bacteriol. 1993, 175, 1590. [DOI] [PMC free article] [PubMed] [Google Scholar]
- Ollagnier S.; Mulliez E.; Schmidt P. P.; Eliasson R.; Gaillard J.; Deronzier C.; Bergman T.; Gräslund A.; Reichard P.; Fontecave M. J. Biol. Chem. 1997, 272, 24216. [DOI] [PubMed] [Google Scholar]
- Giles J. R. M.; Roberts B. P. J. Chem. Soc., Chem. Commun. 1978, 623. [Google Scholar]
- Anklam E.; Steenken S. J. Photochem. Photobiol., A 1988, 43, 233. [Google Scholar]
- Anklam E.; Margaretha P. Res. Chem. Intermed. 1989, 11, 127. [Google Scholar]
- Duboc-Toia C.; Hassan A. K.; Mulliez E.; Ollagnier-de Choudens S.; Fontecave M.; Leutwein C.; Heider J. J. Am. Chem. Soc. 2003, 125, 38. [DOI] [PubMed] [Google Scholar]
- Gerfen G. J.; Licht S.; Willems J. P.; Hoffman B. M.; Stubbe J. J. Am. Chem. Soc. 1996, 118, 8192. [Google Scholar]
- Engström M.; Vahtras O.; Ågren H. Chem. Phys. Lett. 2000, 328, 483. [Google Scholar]
- Nelson D. J.; Petersen R. L.; Symons M. C. R. J. Chem. Soc., Perkin Trans. 2 1977, 2005. [Google Scholar]
- Stoll S.; Schweiger A. J. Magn. Reson. 2006, 178, 42. [DOI] [PubMed] [Google Scholar]
- Heller C.; McConnell H. M. J. Chem. Phys. 1960, 32, 1535. [Google Scholar]
- Kolberg M.; Bleifuss G.; Sjöberg B.-M.; Gräslund A.; Lubitz W.; Lendzian F.; Lassmann G. Arch. Biochem. Biophys. 2002, 397, 57. [DOI] [PubMed] [Google Scholar]
- Lassmann G.; Kolberg M.; Bleifuss G.; Gräslund A.; Sjöberg B.-M.; Lubitz W. Phys. Chem. Chem. Phys. 2003, 5, 2442. [Google Scholar]
- Lowdin P.-O. Adv. Quantum Chem. 1970, 5, 185. [Google Scholar]
- Ragsdale S. W. Chem. Rev. 2003, 103, 2333. [DOI] [PubMed] [Google Scholar]
- Reddy S. G.; Wong K. K.; Parast C. V.; Peisach J.; Magliozzo R. S.; Kozarich J. W. Biochemistry 1998, 37, 558. [DOI] [PubMed] [Google Scholar]
- O’Brien J. R.; Raynaud C.; Croux C.; Girbal L.; Soucaille P.; Lanzilotta W. N. Biochemistry 2004, 43, 4635. [DOI] [PubMed] [Google Scholar]
- Yu L.; Blaser M.; Andrei P. I.; Pierik A. J.; Selmer T. Biochemistry 2006, 45, 9584. [DOI] [PubMed] [Google Scholar]
- Craciun S.; Balskus E. P. Proc. Natl. Acad. Sci. U. S. A. 2012, 109, 21307. [DOI] [PMC free article] [PubMed] [Google Scholar]
- Leuthner B.; Leutwein C.; Schulz H.; Hörth P.; Haehnel W.; Schiltz E.; Schägger H.; Heider J. Mol. Microbiol. 1998, 28, 615. [DOI] [PubMed] [Google Scholar]
- Jarling R.; Sadeghi M.; Drozdowska M.; Lahme S.; Buckel W.; Rabus R.; Widdel F.; Golding B. T.; Wilkes H. Angew. Chem., Int. Ed. 2012, 51, 1334. [DOI] [PubMed] [Google Scholar]
- Heider J. Curr. Opin. Chem. Biol. 2007, 11, 188. [DOI] [PubMed] [Google Scholar]
- Kamat S. S.; Williams H. J.; Dangott L. J.; Chakrabarti M.; Raushel F. M. Nature 2013, 497, 132. [DOI] [PubMed] [Google Scholar]
- Symons M. C. R. J. Chem. Soc., Perkin Trans. 2 1974, 1618. [Google Scholar]
- van Gastel M.; Lubitz W.; Lassmann G.; Neese F. J. Am. Chem. Soc. 2004, 126, 2237. [DOI] [PubMed] [Google Scholar]
- Hofstetter D.; Thalmann B.; Nauser T.; Koppenol W. H. Chem. Res. Toxicol. 2012, 25, 1862. [DOI] [PubMed] [Google Scholar]
- Giles J. R. M.; Roberts B. P. J. Chem. Soc., Perkin Trans. 2 1980, 1497. [Google Scholar]
- Nauser T.; Koppenol W. H.; Schöneich C. J. Phys. Chem. B 2012, 116, 5329. [DOI] [PMC free article] [PubMed] [Google Scholar]
- Mozziconacci O.; Williams T. D.; Schöneich C. Chem. Res. Toxicol. 2012, 25, 1842. [DOI] [PMC free article] [PubMed] [Google Scholar]
- Andersson J.; Bodevin S.; Westman M.; Sahlin M.; Sjöberg B.-M. J. Biol. Chem. 2001, 276, 40457. [DOI] [PubMed] [Google Scholar]
- Elliot A. J.; Simsons A. S.; Sopchyshyn F. C. Radiat. Phys. Chem. 1984, 23, 377. [Google Scholar]
- Schwarz H.; Dodson R. J. Phys. Chem. 1989, 93, 409. [Google Scholar]
- Lundin D.; Torrents E.; Poole A.; Sjöberg B.-M. BMC Genomics 2009, 10, 589. [DOI] [PMC free article] [PubMed] [Google Scholar]
Associated Data
This section collects any data citations, data availability statements, or supplementary materials included in this article.