

Abstract
We recorded neuronal activity in the supplementary eye field (SEF) while monkeys made saccades to targets that yielded rewards of variable amount and uncertainty of delivery. Some SEF cells (29%) represented the anticipated value of the saccade target. These neurons encoded the value of the reward option but did not reflect the action necessary to obtain the reward. A plurality of cells (45%) represented both saccade direction and value. These neurons reflect action value, i.e., the value that is expected to follow from a specific saccade. Other cells (13%) represented only saccade direction. The SEF neurons matched the monkey's risk-seeking behavior by responding more strongly to the uncertain reward options than would be expected based on their response to the sure options and the cued outcome probability. Thus SEF neurons represented subjective, not expected, value. Across the SEF population, option-value signals developed early, ∼120 ms prior to saccade execution. Action-value and saccade direction signals developed ∼60 ms later. These results suggest that the SEF is involved in transforming option-value signals into action-value signals. However, in contrast to other oculomotor neurons, SEF neurons did not reach a constant level of activity before saccade onset. Instead the activity level of many (52%) SEF neurons still reflected value at the time just before saccade initiation. This suggests that SEF neurons guide the selection of a saccade based on value information but do not participate in the initiation of that saccade.
INTRODUCTION
Value-based decision-making is the process of selecting an action among several alternatives based on the subjective value of their outcomes (Rangel et al. 2008). In everyday life, the outcomes of most actions are uncertain. Thus during value-based decision-making, possible benefits and risks need to be weighed, and an action should only be chosen if the resulting benefits are expected to outweigh the risks. The estimation of the overall value of an action depends on the integration of the anticipated value of the possible outcomes weighed by their probability.
The value of stimuli or behavioral states is represented in the neuronal activity of orbitofrontal cortex (OFC) (Padoa-Schioppa and Assad 2006; Wallis and Miller 2003), anterior cingulate cortex (ACC) (Kennerley et al. 2009), and amygdala (Nishijo et al. 1988a,b; Paton et al. 2006). Value signals in the OFC take into account the uncertainty of receiving a particular outcome (Kennerley et al. 2009; Kepecs et al. 2008; Tobler et al. 2007; Tom et al. 2007). However, the value signals in OFC and amygdala are related to the obtained reward option itself and do not reflect the motor actions necessary to obtain it (Padoa-Schioppa and Assad 2006; Paton et al. 2006; Rudebeck et al. 2008). These abstract “option-value” signals must therefore be combined with specific motor-related signals to compute “action-value” signals, i.e., the value that can be obtained by performing a particular action. These action-value signals form the basis for the selection of a motor response that is most likely to maximize reward.
The supplementary eye field (SEF) might participate in the process of value-based decision-making in the case of eye movements. SEF has appropriate connections for such a role because it receives input from areas that represent option value, such as the OFC and the amygdala (Ghashghaei et al. 2007; Huerta and Kaas 1990). SEF forms a cortico-basal ganglia loop with the caudate nucleus, which is known to contain saccadic action-value signals (Lau and Glimcher 2008; Shook et al. 1991). SEF projects to oculomotor areas, such as frontal eye field (FEF), lateral intraparietal (LIP) cortex, and superior colliculus (SC) (Huerta and Kaas 1990). Neurons in SEF become active before value-based saccades, much earlier than neurons in FEF and LIP (Coe et al. 2002).
Here we investigated the role of SEF in transforming option-value representations into action-value representations and selecting the final motor commands. We designed a behavioral task in which monkeys had to make saccades to different targets. The subjective value associated with the targets varied, due to different combinations of reward amount and uncertainty of delivery. The target locations and subjective values changed each trial, which required a different remapping of value onto motor signals. We found neurons carrying option-value signals, action-value signals, and motor-related signals. An analysis of the temporal dynamics of these signals showed that value-related signals preceded direction-related signals. Thus SEF might participate in value-based decision-making by using subjective estimates of the value associated with reward options to guide the selection of a saccade suitable to obtain the option.
METHODS
General
Two rhesus monkeys (both male; monkey A: 7.5 kg, monkey B: 8.5 kg) were trained to perform the tasks used in this study. All animal care and experimental procedures were approved by Johns Hopkins University Animal Care and Use Committee. During the experimental sessions, each monkey was seated in a primate chair, with its head restrained, facing a video screen. Eye position was monitored with an infrared corneal reflection system (Eye Link, SR Research, Ottawa, Canada) and recorded with the PLEXON system (Plexon, Dallas, TX) at a sampling rate of 1,000 Hz. We used a newly developed fluid delivery system that was based on two syringe pumps connected to a fluid container that were controlled by a stepper motor. This system was highly accurate across the entire range of fluid amounts used in the experiment.
Behavioral task
In the gambling task, the monkeys had to make saccades to peripheral targets that were associated with different amounts of water reward (Fig. 1A). The targets were squares of various colors, 2.25 × 2.25° in size. They were always presented 10° away from the central fixation point at a 45, 135, 225, or 315° angle. The task consisted of two types of trials, choice and no-choice trials. In choice trials, two targets appeared on the screen, and the monkeys were free to choose between them by making an eye movement to the target that was associated with the desired option. In no-choice trials, only one target appeared on the screen, so that the monkeys were forced to make a saccade to the given target. While the choice trials allowed us to measure behaviorally the subjective value of gambles, the no-choice trials allowed us to determine the effect of value and direction of a single target on neuronal activity.
Fig. 1.
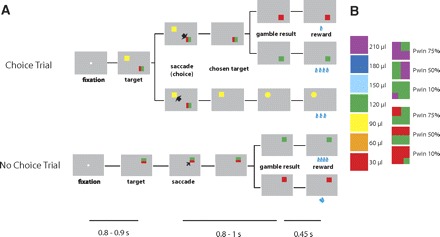
A: sequence of events during choice trials and no-choice trials in the gambling task. Below is indicated the duration of various time periods in the gambling task. The 1st line indicates the 1st fixation period. The 2nd line indicates the uncertainty period in which the monkey has to wait for the result of the trial when he had made a saccade to a gambling option. The 3rd line indicates the delay period between visual indication of the gamble result and reward delivery. Note that the decision time between target onset and saccade initiation depends on the monkey. B: visual cues used in the gambling task: left, sure options; right, gamble options.
Two targets in each choice trial were associated with a gamble option and a sure option, respectively. The sure option always led to a certain reward amount. The gamble option led with a certain set of probabilities to one of two possible reward amounts. We designed a system of color cues to explicitly indicate to the monkeys the reward amounts and probabilities associated with a particular target (Fig. 1B). Seven different colors indicated seven reward amounts (increasing from 1 to 7 units of water, where 1 unit equaled 30 μl). Targets indicating a sure option consisted of only one color. Targets indicating a gamble option consisted of two colors corresponding to the two possible reward amounts. The portion of a color within the target corresponded to the probability of receiving that reward amount. In the experiments, we used two different reward amount sets for the gamble options (minimum/maximum pair was either 1/4 or 4/7 units of water). Each of the reward amount sets was offered with three different probabilities of getting the maximum reward (10, 50, and 75%), resulting in six different gambles. In each choice trial, one of these six gamble options was compared with one of four sure options, ranging in value from the minimum to the maximum reward outcome of the gamble. This resulted in 24 different combinations of options that were offered in choice trials.
A choice trial started with the appearance of a fixation point at the center of the screen (Fig. 1A). After the monkeys successfully fixated for 800–900 ms, two targets appeared on two randomly chosen locations among the four quadrants on the screen. Simultaneously, the fixation point went off, and the monkeys were allowed to make their choice by making a saccade toward one of the targets. Following the choice, the nonchosen target disappeared from the screen. The monkeys were required to keep fixating the chosen target for 750 ms, after which the target changed either color or shape. If the chosen target was associated with a gamble option, it changed from a two-colored square to a single-colored square associated with the final reward amount. This indicated the result of the gamble to the monkeys. If the chosen target was associated with a sure option, the target changed its shape from a square to either a circle or a triangle. This change of shape served as a control for the change in visual display during sure choices and did not convey any behaviorally meaningful information to the monkeys. Following the target change, the monkeys were required to continue to fixate the target for another 450 ms until the water reward was delivered.
The sequence of events in no-choice trials was the same as in choice trials except that only one target was presented (Fig. 1A). The location of the target was randomized across the same four quadrants on the screen that were used during choice trials. In no-choice trials, we used individually all seven sure and six gamble options that were presented in combination during choice trials. We presented no-choice and choice trials interleaved in a pseudorandomized schedule in blocks of trials that consisted of all 24 different choice trials and 13 different no-choice trials. This procedure ensured that the monkeys were exposed to all the trial types equally often. Within a block, the order of appearance was randomized so that the monkeys could not make a decision before the targets were shown. Randomized locations of the targets in each trial also prevented the monkeys from preparing a movement toward a certain direction before the target appearance. In addition, presenting a target associated with the same option in different locations allowed us to separate the motor decision from the value decision.
The monkey was required to maintain fixation of the fixation spot until it disappeared and of the target until reward delivery. If the monkey broke fixation in either one of the two time periods, the trial was aborted and no reward was delivered. After the usual intertrial interval, a new trial started. In this trial, the target or targets represented the same reward options as in the aborted trial. In this way, the monkey was forced to sample every reward contingency evenly. The location of the targets however was randomized so that the monkey could not prepare a saccade in advance.
Estimation of subjective value of gamble options
In everyday life, a behavioral choice can yield two or more outcomes of varying value with different probabilities. A decision-maker that is indifferent to risk should base his decision on the sum of values of the various outcomes weighted by their probabilities, i.e., the expected value of the gamble. However, humans and animals are not indifferent to risk, and their actual decisions deviate from this prediction in a systematic fashion. Thus the subjective value of a gamble depends on the risk attitude of a decision-maker. In this study, we measured the subjective value of a gamble and the risk attitude of the monkeys with the following procedure.
We described the monkey's behavior in the gambling task by computing a choice function for each of the six gambles from each day's task session. The choice function of a particular gamble plots the probability of the monkey to choose this gamble as a function of the value of the alternative sure option (Fig. 3A). The choice function has a sigmoid form. When the value of an alternative sure option is small, monkeys are more likely to choose the gamble. As the sure option's value increases, monkeys increasingly choose the sure option. We employed a generalized linear model analysis to estimate the probability of choosing the gamble [P(G)] as a continuous function of the value of the sure option [EVs], i.e., the choice function
| (1) |
The choice function reached the indifference point (ip) when the probability of choosing either the gamble or the sure option are equal [P(G) = 0.5]. By definition, at this point, the subjective value of the two options must be equal, independent of the underlying utility functions that relate value to physical outcome. Therefore the subjective value of the gamble [SVg] is equivalent to the sure option value at the indifference point [EVs(ip)]. This value, sometimes also referred to as the certainty equivalent (Luce 2000) can be estimated by using Eq. 1 at the indifference point
| (2) |
If the monkey is insensitive to risk, the indifference point should be where the expected values of the sure and gamble option are equal. If the choice function is shifted to the right and the value of the sure option at the indifference point is larger than the expected value of the gamble, the risk increases the value of the gamble so that the equivalent sure reward amount has to be higher to compensate for the increased attraction of the gamble. The monkey behaves in a risk-seeking fashion. Conversely if the choice function is shifted to the left, the value of the sure option at the indifference point is smaller than the average reward of the gamble. The gamble is diminished in value, so that a smaller but sure reward has the same value as the gamble. In this case, the monkey behaves in a risk-aversive fashion.
Fig. 3.
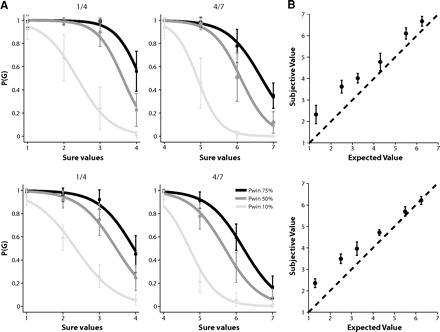
A: choice functions of monkeys A (top) and B (bottom). The probability that the monkey chooses a particular gamble option is plotted as a function of the value of the alternative sure option. The reward size is indicated as multiples of a minimal reward amount (30 μl). Left: gamble options that yield either 30 μl (1 unit) or 160 μl (4 units) with a 10% (light gray line), 50% (dark gray line), and 75% (black line) chance of receiving the larger outcome. Right: gamble options that yield either 160 μl (4 units) or 160 μl (7 units) with a 10% (light gray line), 50% (dark gray line), and 75% (black line) chance of receiving the larger outcome. B: comparison of subjective value (utility) and expected value of a gamble option. The subjective value of a gamble option was estimated from behavior and plotted against its expected value (the average amount of the 2 possible outcomes weighted by their probability). The reward size is indicated as multiples of a minimal reward amount (30 μl). The subjective value is consistently larger than the expected value, indicating that the monkey overvalued the gamble options and behaved in a risk-seeking fashion. The figure represents the grand average over all choice trials recorded from monkeys A (top) and B (bottom).
Electrophysiology
After training, we placed a square chamber (20 × 20 mm) centered over the midline, 25 mm (monkey B) and 27 mm (monkey A) anterior of the interaural line. During each recording session, single units were recorded using a single tungsten microelectrode with an impedance of 2–4 MΩs (Frederick Haer, Bowdoinham, ME). The microelectrodes were advanced using a self-built microdrive system. Data were collected using the PLEXON system. Up to four template spikes were identified using principal component analysis and the time stamps were then collected at a sampling rate of 1,000 Hz. Data were subsequently analyzed off-line to ensure only single units were included in consequent analyses.
Cortical localization
To determine the locations of the SEF we obtained magnetic resonance images (MRI) for monkey B (1.5 T). A three-dimensional (3-D) model of the brain was constructed using Brain Voyager (Brain Innovation, Maastricht, The Netherlands) and Rhinoceros (McNeel North America, Seattle, WA). As an anatomical landmark we used the location of the branch of the arcuate sulcus. The location of neuronal recording sites is shown in Fig. 2A. We found a cluster of task-related neurons during saccade preparation period in the region from 1 to 3 mm anterior to the genu of the arcuate branch (indicated in black; Fig. 2A). We designated these neurons as belonging to the SEF. Monkey B was also used in a previous arm movement countermanding study (Scangos and Stuphorn 2010). In this study, we found neurons with arm-movement-related activity in a region from 6 mm posterior to 5 mm anterior relative to the arcuate branch and within 3.5 mm of the longitudinal fissure. These regions belonged to the pre-SMA and SMA. The relative location of pre-SMA, SMA, and SEF in this monkey confirms with earlier reports (Liu et al. 2002; Luppino et al. 1991, 1993; Matelli et al. 1991; Matsuzaka et al. 1992).
Fig. 2.
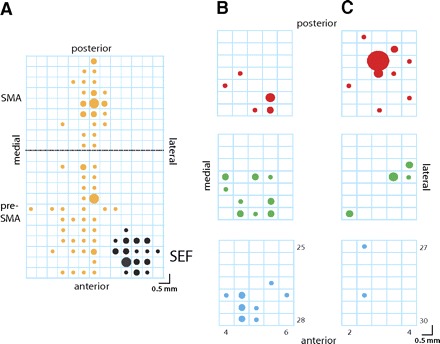
Localization of the supplementary eye field. A: a magnified version of the recording grid in monkey B is shown. The circles indicate the position of eye (black) and arm movement (yellow)-related neurons. The circle sizes in A indicate the number of neurons (large: 9–12 cells, medium: 5–8 cells, small: 1–4 cells). The dashed horizontal black line indicates the location of the branch of the arcuate sulcus (27.5 mm anterior to the interaural line). The 3 clusters of cells correspond to the supplementary eye filed (SEF), the presupplementary motor area (pre-SMA), and the supplementary motor area (SMA) as indicated in the margins of the recording grid. B: the section of monkey B's recording grid that contained the eye-movement-related neurons in stereotactic coordinates. The top grid indicates the location of value (V)-neurons (red circles), the middle grid the location of value-direction (VD)-neurons (green circles), and the bottom grid the location of direction (D)-neurons (blue circles). C: the section of monkey A's recording grid that contained the eye-movement-related neurons. The conventions are the same as in B. The circle sizes in B and C indicate the number of neurons (extra large: 8 cells, large: 3 cells, medium: 2 cells, small: 1 cell).
In monkey A, we recorded from a similar location in the dorsomedial prefrontal cortex as in monkey B. Neurons within the region 5 mm anterior to the arcuate branch and within 3.5 mm of the longitudinal fissure formed a cluster of neurons with saccade-related activity and were designated as belonging to the SEF.
Spike density functions
To represent neural activity as a continuous function, we calculated spike density functions by convolving the spike train with a growth-decay exponential function that resembled a postsynaptic potential. Each spike therefore exerts influence only forward in time. The equation describes rate (R) as a function of time (t)
| (3) |
where τg is the time constant for the growth phase of the potential, and τd, is the time constant for the decay phase. Based on physiological data from excitatory synapses, we used 1 ms for the value of τg and 20 ms for the value of τd (Sayer et al. 1990).
Task-related neurons
We concentrate in this paper on the analysis of SEF activity in no-choice trials. We will report the activity of these neurons during choice trials in a later paper. To test if a neuron was active while the monkey generated the saccade to the target, we analyzed its activity in the time period between target onset and saccade initiation. We performed t-test on the spike rates in 10 ms intervals throughout the saccade preparation time period in comparison to a baseline period that consisted of the average firing rates in the 200–100 ms prior to target onset. If P values were <0.05 for five or more intervals, the cell was deemed to have activity significantly different from baseline. We decided to include repetition trials following a fixation break into the analysis because we concentrate here exclusively on neuronal activity following target onset. In this time period, the target value is explicitly indicated by the visual cue so that there is no difference in the information available to the neurons during regular trials, where the value was not known at the beginning of the trial, and repetition trials, where the value was known in advance.
Regression analysis
We quantified the degree to which each neuron represented saccade value and direction by fitting a family of regression models to the neurons and determining the best-fitting model. We wanted to compare the influence of the different factors in each model on neuronal activity. Regression coefficients cannot be directly compared when the scale of the variables are different. We therefore chose the value [f(Val), Eq. 4] and the direction [g(Dir), Eq. 5] functions in such a way that the term that is multiplied by the weighting coefficients b1 and b2 can vary only in the range from 0 to 1. Because the range of f(Val) and g(Dir) without the weighting coefficients is the same, the relative strength of b1 and b2 are the only factors that explain differences in the degree to which each function influences neuronal activity. Therefore we can directly compare the weighting coefficients.
We described the influence of saccade value on neuronal activity using a sigmoid function
| (4) |
where t is the threshold value, s is the steepness, and b1 is a weighting coefficient. The threshold t was confined to be within the range of 1–7, the same as the range of values. This ensured that the maximum value f(Val) can reach without weighting coefficient b1 is 1, when [(t/Val)s] gets close to 0. In addition, steepness s was defined between −50 and 50 to give the sigmoid shape of f(Val) enough freedom to explain the neuronal activities best. We described the influence of saccade direction on neuronal activity using a circular Gaussian function
| (5) |
where w is the tuning width, p is the preferred direction, and b2 is a weighting coefficient. The cosine function has only values between −1 and 1. Therefore [cos(Dir − p) − 1] is defined only within −2 and 0, and the maximum value g(Dir) can reach without weighting coefficient b2 is 1, when {w[cos(Dir − p) − 1]} gets close to 0. In addition, we confined the tuning width w to be within the range of 0.1 and 10 and the preferred direction p to be within 0 and 2π. We described the interaction of value and direction using the product of f(Val) and g(Dir)
| (6) |
where b3 is a weighting coefficient.
For each neuron, we fitted the average neuronal activity before and during the saccade (100 ms before saccade onset to 20 ms following saccade onset) on each trial with all possible linear combinations of the three terms [f(Val), g(Dir), h(Val,Dir)] as well as with a simple constant baseline model (b0). We identified the best fitting model for each neuron by finding the model with the minimum Bayesian information criterium (BIC) value (Burnham and Anderson 2002; Busemeyer and Diederich 2010)
| (7) |
where n was the total trial number and K was the number of fitting parameters. Based on the best fitting model, we could classify the neurons as one of three functional groups. If the best model for a neuron was f(Val), which contains only value as a variable, the neuron was identified as a V-neuron. Likewise if the neuron was best described by g(Dir), the neuron was identified as a D-neuron. If the neuron's best model contained both value and direction as variables regardless of the relationship between the two variables in the function, the neuron was identified as a VD-neuron. Neurons described best by a model that contained only a baseline activity term were not counted as belonging to any of the three functional groups.
Mutual information
To compare the relative strength of the relationship between neuronal activity and saccade value and direction, we calculated separately for each neuron the mutual information between neuronal activity and value or direction, respectively. To capture the dynamics of value and direction encoding, we performed the calculation repeatedly for consecutive time periods during saccade preparation using a sliding time window. The analysis started with the middle of the 50 ms time window aligned on saccade onset. Then the time window was shifted backwards in 10 ms steps ≤300 ms before saccade onset and forwards ≤100 ms following saccade onset.
To reduce the bias in estimating the mutual information, we discretized the neuronal activities so that each bin could hold equal number of trials. We set the number of bins for neuronal activity (NF) as four. The boundaries between the bins were fixed across all time windows. At each particular time window, we collected the mean neuronal firing rates (F) from every trial. Neuronal activity below first quartile (Q1) was classified as F1, between Q1 and Q2 as F2, between Q2 and Q3 as F3, and finally, neuronal activity above Q3 was classified as F4.
The mutual information between neuronal activity F and the variable X, which can be either value or direction in our case, was approximated by the following
| (8) |
where Mij is the number of trials having both Fi and Xj, Mi· is the number of trials having Fi, and M·j is the number of trials having Xj· M is the number of total trials. As mentioned before, we set NF, the number of distinct states of neuronal activity, to four. In the case of direction, we set Nx, the number of distinct states of the relevant variable, to four because we tested four different saccade directions. In the case of value, we tested 13 different values. However, distinguishing 13 different value levels would have resulted in different maximum amounts of mutual information for the two variables (direction: 2 bits; value: ≤3.7 bits). This would have led to an overestimation of value information relative to directional information. To make the value and direction information estimations directly comparable, we set Nx for value to four as well. In grouping the 13 different values into four bins, we followed the same binning procedure as we did for the neuronal activities so that each bin held an equal number of trials. We computed a first approximation of the bias as follows
| (9) |
where UFX is the number of nonzero Mij's for all i and j, UF is the number of nonzero Mi· for all i, and UX is the number of nonzero M·j for all j. This procedure followed the approach described in Ito and Doya (2009).Finally, we performed a Bootstrap procedure to test whether the amount of mutual information was significant, and to further reduce any remaining bias. We generated a random set of Fi and Xj pairs, by permuting both F and X array, respectively. We calculated the mutual information between F and X, using the same method described in the preceding text and repeated this process for 100 times. The mean of the mutual information obtained from these 100 random processes represented remaining bias and was subtracted from I(F,X). To test whether the final estimated mutual information was significant (P < 0.05), we compared it with the sixth highest information obtained from the 100 random processes. If it was nonsignificant, we set the mutual information to zero. The bias reductions sometimes led to negative estimates of mutual information. In that case, we also set the final estimated information to be zero.
To classify neurons into different functional groups based on the mutual information, we computed the mean amount of directional (ID) and value information (IV) in the 100 ms before saccade onset for each neuron. The minimum amount of information was set to 10-5. The population fell into four clusters according to whether the ID and IV value fell above or below a criterion level of 10-4. Accordingly, V-neurons, representing only value, had IV values above and ID values below the criterion. D-neurons, representing only direction, had IV values below and ID values above the criterion. VD-neurons, representing both value and direction, had both IV and ID values above the criterion. The remaining neurons carried neither value nor direction information and had both IV and ID values below the criterion.
Onset of value and direction representation
We quantified the dynamics of the value and direction representation in the SEF population in consecutive 10 ms bins. First, we computed the fraction of neurons that represented a particular factor by counting the number of cells in each time bin that were best described by a regression model that contained either value (V), direction (D), or the interaction of value and direction (VD). Second, for the same 10 ms bins, we computed the average mutual information about value and direction in the neuronal population. To test whether there was a difference in the temporal dynamics of value and direction representation, we determined the onset of the rise in the fraction of sensitive neurons and of the rise in mutual information within the population of different cell groups. We identified the time bin at which the neuronal fraction or the information amount for the first time was larger than the mean value of the neuronal fraction or information amount during a baseline period (300–200 ms before saccade onset) plus 2 SD. To avoid brief spikes in each signal, we required in addition that this potential onset time was followed by at least four consecutive time windows in which the neuronal fraction or information amount also passed the criteria stated in the preceding text.
Threshold analysis
For each neuron, we identified the preferred direction, which was associated with the highest neuronal activity. Next we sorted these trials, in which the monkey made saccades toward the preferred direction, into five groups according to either target value or reaction time, respectively. For each group, we determined the average neuronal activity in the 10–20 ms before saccade onset and tested whether the neuronal activity significantly depended on target value or reaction time using a linear regression model.
RESULTS
Behavior
We trained two monkeys in a gambling task (Fig. 1A), which required them to choose between a sure and a gamble option by making an eye movement to one of two targets. Behavioral results showed that the monkeys' choices were based on the relative value of the two options. For each gamble, we plotted the probability of choosing the gamble as a function of the alternative sure reward amount (Fig. 3A). The probability of a gamble choice decreased as the alternative sure reward amount increased. In addition, as the probability of receiving the maximum reward (i.e., “winning” the gamble) increased, the monkey showed more preference for the gamble over the sure option. The choice functions allowed us to estimate the subjective value of the gamble to the monkeys in terms of sure reward amounts, independent of the underlying utility functions that relate value to physical outcome. We estimated the choice function for each gamble using a logistic regression function (Eq. 1). Both monkeys chose the gamble option more often than expected given the probabilities and reward amounts of the outcomes, indicating that the subjective value of the gamble option was larger than its expected value (Fig. 3B). Thus the monkeys behaved in a risk-seeking fashion, similar to findings in other gambling tasks using macaques (McCoy and Platt 2005). Interestingly, the tendency to over-value the gamble option seemed to decrease with increasing expected value of the gambles. The trend appears to be real, because it is present in both monkeys we tested in our paradigm (Fig. 3B). The reasons for this tendency, as well as for the general tendency for risk-seeking behavior, are not clear. It might be related to the specific requirements of our experimental setup, i.e., a large number of choices with small stakes. From the point of view of the present experiment, the most important fact is that we can measure the subjective value of the gambles, which is different from the “objective” expected value.
The mean saccade reaction times during no-choice trials reflected the value of the target (Fig. 4). For sure option targets, the reaction time was slowest for low value targets (30 μl for sure; monkey A: 232 ms, monkey B: 250 ms) and became increasingly faster for more valuable targets (210 μl for sure; monkey A: 148 ms, monkey B: 134 ms). Likewise the reaction times were slower for gamble options with outcomes in the low value range (30 μl/120 μl; monkey A: 184 ms, monkey B: 161 ms), compared with the ones with outcomes in the high value range (120 μl/210 μl; monkey A: 155 ms, monkey B: 138 ms). For a gamble option with a given set of outcomes, the reaction times became faster when the winning probability of the gamble increased. While there was a trend for value and reaction time to be correlated, the large error bars in Fig. 4 indicate that there was a large amount of remaining variability in reaction time that was not explained by changes in value. We tested the significance of the effects of subjective value on reaction time, using a linear regression model. For monkey A (Fig. 4A), the effect of value on reaction time was highly significant (P < 0.00001), but in the case of monkey B (B), the effect was not significant (P = 0.42).
Fig. 4.
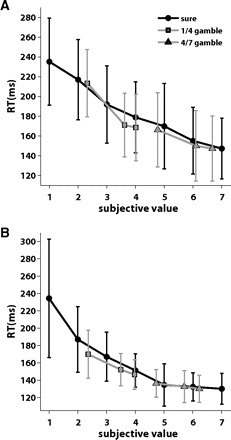
Mean reaction time in no-choice trials from monkeys A (A) and B (B). For each option, mean reaction time was plotted against the subjective value of the target. The reaction times of sure options (black circles and line), gamble options with outcomes in the lower reward range (gray squares and line), and gambles with outcomes in the higher reward range (gray triangle and line) were plotted separately. Error bars indicate 1 SD. Reaction time decreased as the subjective reward value increased. Both an increase in the range of reward amounts and in the winning probability resulted in a faster reaction time.
Figure 5 reports the percentage of fixation breaks as a function of the time period in the trial and the reward option indicated by the visual cues. In general, the monkeys broke fixation relatively often (monkey A: 1,371/15,005 trials, 9%; monkey B: 1,294/13,096 trials, 9.9%). However, the overall pattern indicates that the fixation breaks represented an aversive response to low reward trials instead of a more general lack of motivation.
Fig. 5.
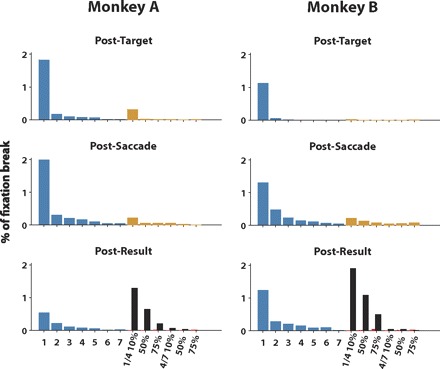
Rate of fixation breaks as a function of task value and time period. The histograms show the number of fixation breaks as a proportion of all recorded trials for monkey A (n = 15,005; left) and monkey B (n = 13,096; right). The trials are grouped by reward option. The rate of fixation breaks on sure option trials is indicated by the blue bars on the left hand side. The numbers 1–7 indicate multiples of the minimal fluid amount (30 μl). The rate of fixation breaks on gamble option trials before the gamble result was known is indicated by single yellow bars. The rate of fixation breaks after the gamble result was revealed is indicated by black bars in case of a loss and by red bars in case of a win. The gamble options are indicated by their possible outcomes (as multiples of the minimal fluid amount) and by their probability to win. The proportion of fixation breaks is indicated for 3 different trial periods: top, “posttarget”: between target onset and saccade onset; middle, “postsaccade”: following the end of the saccade until the gamble outcome was revealed; bottom, “postresult”: following gamble result disclosure until reward delivery.
First, the rate of fixation breaks increased, the later the trial period. There were no fixation breaks before target onset in either monkey. In the period between target onset and saccade (posttarget), monkey A broke fixation in 2.6% of trials (390/15,005) and monkey B in 1.2% of trials (158/13,096). In the period between saccade and the gamble result disclosure, (postsaccade), monkey A broke fixation in 3.3% of trials (489/15,005) and monkey B in 3% of trials (390/13,096). In the period between the gamble result disclosure and reward delivery (postresult), monkey A broke fixation in 3.3% of trials (492/15,005) and monkey B in 5.7% of trials (746/13,096). Thus in the majority of trials the monkeys broke fixation after they had worked in the task for some time (≤1,900 ms) and thereby forfeited the reward that would have been delivered after a comparatively short additional delay (as short as 450 ms). Such a behavior does not fit the hypothesis that fixation breaks indicate lack of motivation because in that case, the breaks should have occurred overwhelmingly at the beginning of the trials.
Second, there was a clear difference in the time period, when the fixation breaks occurred on sure versus gamble option trials. In the period between target onset and the moment the result of the gamble was revealed, the majority of fixation breaks occurred in the sure option trials (monkey A: 763/879, 87%; monkey B: 465/548, 85%). However, in the postresult period, the majority of fixation breaks occurred in the gamble option trials (monkey A: 339/492, 69%; monkey B: 477/746, 64%). The fixation breaks occurred once the monkey knew for certain the amount of reward that he was going to receive on the trial. In the case of sure options, this was true immediately after the target was presented; but on gamble option trials, the monkeys had to wait until the result of the gamble was revealed. Thus it was certain knowledge about the size of the reward that led to a break in fixation.
Third, there is a strong relationship between reward value and likelihood of a fixation break. During sure option trials, most of the fixation breaks occurred when the two smallest reward amounts are presented (monkey A: 758/916, 83%; monkey B: 583/734, 79%). During gamble option trials, most fixation breaks occurred when the gamble was lost (monkey A: 355/455, 74%; monkey B: 465/560, 83%). This was particularly true, when the 1/4 gamble was lost and the monkey received the smallest possible reward (monkey A: 321/455, 71%; monkey B: 454/560, 81%). Interestingly, the tendency to break fixation was lowest on trials with a high chance of winning (4/7, 75% winning chance) and also when a higher reward value was at stake. This indicates that the fixation breaks did not represent a deliberate strategy of the monkeys to repeat a gamble, the outcome of which they did not like. Altogether it was the anticipation of a small reward that led to the break of fixation.
Thus the monkeys broke fixation when a disappointingly small reward was indicated by a visual cue. This behavioral pattern is clearly disadvantageous to the monkeys because aborted trials are repeated. The fixation breaks might therefore be due to some automatic avoidance response to an insufficiently rewarding stimulus (Dayan 2008; Dayan et al. 2006).
Altogether the choices, reaction times, and fixation breaks of the monkeys systematically varied with the subjective value of the targets. This shows that they are aware of the differences in value between the different options and the factors that affect them (reward amount and probability).
Neuronal data base
We recorded 264 SEF neurons in two monkeys (171 neurons from monkey A, 93 neurons from monkey B). Of these, 182 cells showed significant activities during the saccade preparation period (94 neurons from monkey A, 88 neurons from monkey B). These task-related neurons form the neuronal data set that we analyze in this paper. For the task-related neurons, we recorded on average 27 trials per value condition (minimum: 7 trials/condition; maximum: 44 trials/condition). While the choice trials allowed us to estimate the subjective evaluation of the gamble options relative to the sure reward amounts, the no-choice trials allowed us to record the response of the neurons to a single target with a specific position and value without possible interference from an alternative target. We therefore concentrate here on analyzing the neuronal responses on no-choice trials. This will form the necessary basis for understanding the neuronal responses on the more complex choice trials, which will be the subject of another paper.
SEF neurons reflect saccade value and direction
If SEF is involved in the integration of value and motor-based representations, we would expect neurons to represent both value and direction. Indeed the activity of many task-related neurons in the SEF reflected saccade value and/or direction to varying degrees. The neuron shown in Fig. 6A showed no directional tuning, but it increased its activity for saccades with larger value. Conversely, the neuron shown in Fig. 6C was moderately tuned for saccades direction but was equally active for saccades of different value. The responses of many neurons fell between these two extremes and reflected both value and direction of saccades (Fig. 6B). In all three neurons, the value- or direction-specific response developed before saccade onset but continued to be present following the initiation of the saccade and while the monkey fixated the chosen target. In this paper, we will concentrate on the time period between target onset and saccade initiation. We quantified the degree to which each neuron represented saccade value and direction using two different methods: regression models and mutual information.
Fig. 6.
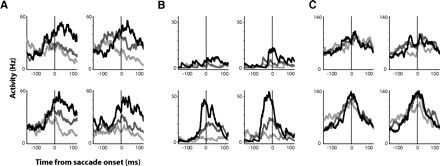
Three SEF neurons with different degrees of value and direction-selectivity. The spike density histograms show activity during saccades in 4 directions to sure option targets, which yielded small rewards (30–60 μl; light gray), medium-sized rewards (90–150 μl; dark gray), and large rewards (180–210 μl; black). A: a neuron representing exclusively value. B: a neuron representing both direction and value. C: a neuron representing exclusively direction.
First, we fitted a family of regression models to the activity of the neurons in the 100 ms preceding saccade onset and determined the best-fitting model. We used a sigmoid function to describe the influence of saccade value on neuronal activity (Eq. 4), and a circular Gaussian function to describe the influence of saccade direction on neuronal activity (Eq. 5). By comparing the Bayesian information criterium (BIC) values of the models, we identified the best fitting model for each neuron (for detail, see methods). By including a simple baseline model, we also determined whether a given neuron's activity was significantly influenced by either saccade value, saccade direction, or a combination of the two.
The best fitting regression models allowed us to classify the SEF neurons into three functional groups according to the factors that influenced their activity. Figure 7 shows a comparison of the observed neuronal data with the model prediction for one of each of these different types of SEF neurons. Among the 182 saccade-related SEF neurons, we identified 15% of neurons (27/182) as only value dependent (V-neurons; Fig. 7A), 12% of neurons (22/182) as both value and direction dependent (VD-neurons; B), and 7% of neurons (13/182) as only direction dependent (D-neurons; C). The SEF neurons that represented both direction and value consisted of neurons that were best described by the linear combination of value and direction (4/22; 18%) and neurons that were best described by the multiplicative interaction of value and direction (18/22; 82%). The activity of V- and VD-neurons could either increase or decrease as value increased. However, there was a difference between V- and VD-neurons because V-neurons were equally likely to show a positive or a negative correlation between spike rate and value (V-neurons with negative correlation: 40.7% (11/27); binary test, P = 0.25). In contrast, almost all VD-neurons showed a positive correlation between spike rate and value (VD-neurons with negative correlation: 13.6% (3/22); binary test, P < 0.001). Of the three neurons with a negative correlation, one was best fit by a linear combination of value and direction, and two were best fit by a multiplicative interaction of value and direction. There were no discernable functional differences between neurons with positive and negative correlation. We therefore grouped both types together in our manuscript as V- and VD-neurons, respectively.
Fig. 7.
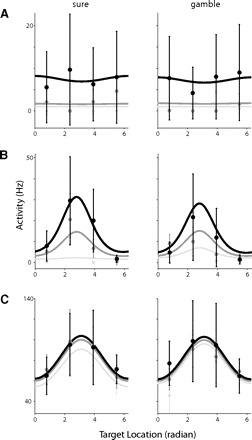
Comparison of observed neuronal activity (dot) and predicted neuronal activity (line) based on the full regression model. Neuronal activities were plotted against the 4 different target locations on screen. Left: the cases where the targets were sure options; right: the cases where the targets were gamble options. Black lines and dots represent the trials with a large reward [left: 7 sure option; right: 4/7 (win 75%) option], dark gray lines and dots represent the trials with a medium-sized reward [left: 4 sure option; right: 1/4 (win 75%) option], and light gray lines and dots represent the trials with a small reward [left: 1 sure option; right: 1/4 (win 10%) option]. Error bars indicate 1 SD. The 3 single cell examples represent V-neurons (A), VD-neurons (B), and D-neurons (C).
Second, we measured the mutual information between neuronal activity and variations in saccade value and direction. Mutual information, or just “information” in the following, is a measure of the degree to which to data sets are correlated (Ito and Doya 2009; Magri et al. 2009). It reflects both linear and nonlinear relationships and combines all of them into one dimensionless number. This allowed us to directly compare how strongly the neuronal activity reflected the value versus the direction of a saccade. For each SEF neuron, we computed the mean amount of directional (ID) and value information (IV) in the 100 ms before saccade onset (Fig. 8A). The minimum amount of information was set to 10−5. The population fell into four clusters according to whether the ID and IV value fell above or below a criterion level of 10−4. We identified 29% (52/182) neurons that carried only information about value, 13% (23/182) neurons that carried only information about direction, and 45% (82/182) neurons that carried information both about value and direction. The remaining neurons (14%; 25/182) carried neither value nor direction information. Overall, neuronal activity was modulated more by value than direction. Across all SEF neurons that carried significant information, 66.2% of neurons (104/157) carried more value information, while 33.8% of neurons (53/157) carried more direction information.
Fig. 8.
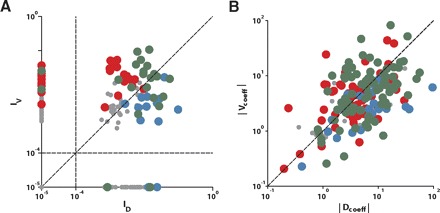
Comparison of the degree to which a neuron reflects saccade value or direction. Red, green, and blue dots: V-neurons, VD-neurons, and D-neurons, respectively. Remaining task-related cells that do not belong to any of those 3 functional groups are shown in gray dots. The classification of the neurons into the 3 functional groups, indicated by the color of the dots, was based on the regression analysis (A) and the information analysis (B). A: comparison of the mean information about saccade direction (ID) and value (IV) in the 100 ms before saccade onset. B: comparison of the coefficient strength of value (Vcoeff) and direction (Dcoeff) term in regression model in which those 2 terms are linearly connected. Absolute value of the coefficient was used to evaluate the degree of influence of each term.
There was a good match between the regression fits and the information analysis. Many of the neurons that were best described by a value-only regression model (Fig. 8A, red dots) also carried only information about value. Those that did carry some information about saccade direction carried more information about value than direction. The opposite was true for the neurons that were best described by a direction-only regression model (Fig. 8A, blue dots). They carried more information about direction than value and in many cases exclusively information about saccade direction. The neurons that were best described by a value-direction regression model could be found in all three clusters (Fig. 8A, green dots). Likewise, when we compared the coefficient strength between the value and the direction term from the linear regression model that contained only these two terms [i.e., c1*f(Val) + c2*g(Dir)], we could see again the general agreement between the functional groups based on the regression analysis and the ones based on the information analysis (Fig. 8B).
The results of the regression analysis and the information analysis mostly agreed with respect to their positive identification. However, there were a large number of neurons that could not be described well by any of the regression models (Fig. 8A, gray dots), but for which the information analysis nevertheless indicated that they carried a significant amount of information about saccade value and/or direction. This indicates that the regression analysis allowed very specific predictions of neuronal activity. However, it was also more restrictive and only identified activity pattern that match one of the models that we used in the analysis. In that regard, the regression analysis is complemented by the mutual information analysis, which is more inclusive and captures any existing relationship but at the cost of being unspecific about its exact form. The mutual information theory might therefore better capture the true fraction of the various neuron types in our recording sample.
These findings indicated that SEF neurons reflect the value of a saccade or its target. However, the saccade value was also systematically related to the reaction time (Fig. 4), which created a potential confound to our findings. We therefore performed an additional regression analysis to test whether the seemingly value-related modulations in SEF neurons were simply due to differences in reaction time. For each cell, we compared the best-fitting model from the initial regression analysis to two other models. One was the previous best model to which reaction time was added as an additional parameter. The other was a simple control model that only contained reaction time as a variable. We used the BIC value of each model as a criterion for the goodness of fit. Reaction time by itself or the inclusion of reaction time into the model did not lead to significantly better fitting model in 82% (51/62) of neurons that were previously best described by a regression model depending on value, direction, or a combination of both. Of those 62 neurons that were classified as belonging to one of the three functional groups, 15% (9/62) were best explained by a model that only depended on reaction time, while 3% (2/62) were best explained by a model that depended on reaction time and one or more other variables (Table 1). Taking into account reaction time, 21% (4/19) of VD-neurons encoded a linear sum of value and direction and 79% (15/19) encoded the interaction of value and direction.
Table 1.
Summary of regression analysis after taking account of reaction time as another dependent variable
| Original Regression Analysis | No. of Cells | Regression with RT | No. of Cells |
|---|---|---|---|
| V cell | 27 | V | 21 |
| V+RT | 1 | ||
| RT | 5 | ||
| D cell | 13 | D | 12 |
| D+RT | 0 | ||
| RT | 1 | ||
| VD cell | 22 | VD | 18 |
| VD+RT | 1 | ||
| RT | 3 | ||
| Baseline cell | 120 | B | 115 |
| RT | 5 |
V, value; D, direction; VD, value-direction; RT, reaction time.
In conclusion, we found that SEF neurons encode value and direction of saccades. Some neurons reflected only the value obtained by the saccade, independent of the specific saccade that needs to be generated. These V-neurons more closely resemble neurons found in the OFC and the amygdala, and seem to encode “option value” (Padoa-Schioppa and Assad 2006). Other neurons directly combined value and motor-related signals. These VD-neurons seem to encode action value (Lau and Glimcher 2008; Rangel et al. 2008; Samejima et al. 2005). A third group of neurons reflected only the saccade direction. These cells seem to encode the metric of the selected saccade.
SEF neurons reflected behavioral overvaluation of gamble options
We observed behaviorally that the monkeys chose the gamble option more often than expected given the probabilities and reward amounts of the outcomes (Fig. 3B), indicating that the subjective value of the gamble option was larger than its expected value. We therefore determined whether the SEF neurons represented subjective or expected value of the saccadic target.
We first fitted the activity of each neuron in the 100 ms preceding saccade onset with the value-dependent model (Eq. 4) plus reaction time using only sure option trials. We chose this simple model that ignored the influence of saccade direction because we wanted to compare the fit of expected value versus subjective value for all neurons in our recording sample. If we had chosen the best-fitting regression model for each neuron, we would have been able to test only a small number of neurons in our sample, namely the 27 neurons best described by a value-only model and the 22 neurons best described by a value/direction model. This would have excluded not only the 13 neurons best described by a direction-only model, but also the 120 neurons that could not be well described by any of the models we tested. However, the mutual information analysis indicated that a larger group of neurons was influenced by value than were identified by the regression method. We therefore decided to use the same value-only model for all neurons in our analysis because we were not so much interested in the absolute goodness of fit but rather if subjective value resulted in a better fit than expected value. As an additional test of the possible influence of reaction time on neuronal activity, we included reaction time as an independent factor to the regression model. If reaction time had high explanatory power, we would expect the difference between the predictions of the subjective and expected value models to be small.
Figure 9 shows an example neuron the activity of which was well explained by the value-dependent model (Fig. 9A, R2 = 0.99). Figure 9B shows that the utility function derived from the choices of the monkey while this neuron was recorded. The subjective value of the gamble options on that day was distinctively higher than their expected value. Next we used the value model derived from the sure option trials to predict the neuronal activities during the gamble option trials. For this prediction, we used the expected and the subjective value as two different estimates for the value of the gamble options and compared those two predictions with the observed data. The example neuron showed higher firing rates than predicted by the expected value estimate (Fig. 9C). In contrast, our prediction of the neuronal activity strongly improved when we used the subjective value estimate (Fig. 9D). The improvement in the prediction was evident from the difference in residual sum of squares (RSS) values for the two models (EV-based: RSS = 45.5; SV-based: RSS = 16.9).
Fig. 9.

Example of a SEF neuron representing subjective, not expected, value of gamble options. A: the value-dependent regression model (Eq. 4) was constructed using only the neuronal activities in the sure option trials. Black dots, the observed mean neuronal activities. Error bars indicate 1 SD. Gray triangles and gray line, the prediction of the regression model. B: subjective vs. expected value of the gambles estimated from the monkeys choices while the neuron was recorded. The monkey was risk-seeking. C and D: comparison between predicted and observed neuronal activity for gamble targets. Mean neuronal activities from gamble option trials were compared against predicted neuronal activities from the regression model using either expected value (C) or subjective value (D) of the gamble. Error bars indicate 1 SD. The neuron was more active than predicted based on the expected reward.
Across the population, we compared the normalized difference in the RSS value for the expected value-based model and the subjective value-based model for each neuron. We first determined the mean neuronal activity across all six gambles, and the predicted activity for these gambles based on the EV and the SV model. Next we divided all these values by the maximum activity. Last we computed the RSS values for the SV and the EV model based on this normalized activity. Figure 10 shows the resulting distribution of RSS differences for all neurons and for each functional group as classified by the information theoretical analysis.
Fig. 10.
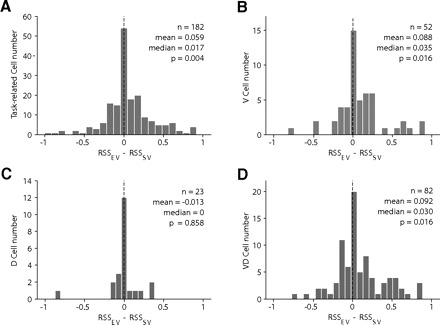
SEF population represents subjective, not expected, value of gamble options. Here we plotted the distribution of the difference between residual sum of squares (RSS) from expected value-based model (RSSEV) and RSS from subjective value-based model (RSSSV). Positive value in difference means that subjective value is a better predictor of neuronal activity than expected value. Distribution of the difference was plotted among all task-related neurons (A), V-neurons (B), D-neurons (C), and VD-neurons (D).
The median RSS difference across all value-related SEF neurons was positive (Fig. 10B, V cells: median RSS difference: 0.035; rank-sum test, P = 0.016; Fig. 10D, VD cells: median RSS difference: 0.03, rank-sum test, P = 0.016). This indicated that for most value-related neurons, the fit of the subjective value-based model was better than the one of the expected value-based model. In contrast, median RSS difference across all direction-related SEF neurons was zero (Fig. 10C, D cells: median RSS difference: 0; rank-sum test, P = 0.858). This confirms our prediction that for neurons, which are predominantly influenced by factors that are not captured by the model, the difference between subjective and expected value does not lead to great differences in explanatory power. It is therefore noteworthy that the higher explanatory power of subjective value in V- and VD-neurons was shown after taking into account any explanatory power of reaction time.
To summarize, our data indicate that many SEF neurons reflected the subjective, not the expected, value of the option that was obtained by the saccade. The motivation for generating a particular saccade depended on the subjective value associated with its target and influenced the reaction time of the saccade. Nevertheless in most cases, the neuronal activity showed a higher regression with subjective value than with reaction time. That confirms that SEF encodes primarily the saccade value, which indirectly influences reaction time.
Temporal dynamics of value and direction encoding in SEF
Our results from the analysis of the mean activity imply that the neuronal activities in SEF encode the value of reward options, the value of specific saccades, and saccade metric. These signals could be used to select and prepare the saccade that is necessary to obtain an available reward. We were interested in the time course of the value and direction-dependent signals in SEF neurons to better understand this action selection process. We used three different analyses to index the relationship between neuronal activity and the two variables throughout the trial.
First, we repeated the regression analysis on the SEF activity in nonoverlapping 10 ms time bins during the time period starting 300 ms before saccade onset and ending 200 ms after saccade onset. We determined the relative importance of the three regression terms at each time point by counting the number of neurons that were best described by a model that contained V, D, or VD. The results show a clear difference in the time course of the value (red)- and the direction-representation (blue) in the SEF population (Fig. 11). The number of neurons that represented value rose earlier (160 ms before saccade onset), while saccade direction started to be represented much later (100 ms before saccade onset). The representation of the interaction between value and direction fell somewhere in the middle between the other two time courses.
Fig. 11.

Temporal dynamics of regression terms with a significant influence on neuronal activity. For each time bin, we counted the number of cells with significant value (red), direction (blue), and value-direction interaction terms (green) in their best-fitting regression model. The number was plotted separately for all task-related neurons, V-neurons, VD-neurons, and D-neurons (from top to bottom) as a proportion of the total number of neurons in each group. Dotted lines, onset of selectivity in the population for each regression term.
These differences in the dynamics of value- and direction-representation were also evident when we studied separately the three different subpopulations as classified by the regression model that best explained the average neuronal activity in the 100 ms before saccade onset (Fig. 11). Value-only cells, encoding option value, started to represent value 140 ms before saccade onset and showed almost no significant influence of direction. The value-direction interaction was represented early (150 ms before saccade onset) but reduced over time during the saccade preparation. Value-direction cells, encoding action value, showed a steady increase in the influence of the value-direction interaction term that started 100 ms before saccade onset. There was a small rise in sensitivity to pure direction, starting at the same time (100 ms before saccade onset). In contrast, only a moderate number of these cells reflected pure value, and the onset of this representation started later (70 ms before saccade onset). Direction-only cells were equally influenced by direction and the value-direction interaction. The value-direction interaction was reflected slightly earlier (100 ms before saccade onset) than the direction by itself (90 ms before saccade onset). Thus even direction-only cells, when analyzed in more detail, did show some influence of action value, but they were not strongly influenced by value at any time before saccade onset. In comparison, the onset of selectivity for value in V-neurons (140 ms before saccade onset) preceded the onset for direction in both VD- and D-neurons (VD: 100 ms; D: 90 ms before saccade onset).
Second, this last analysis was performed at the population level. We were interested in whether we would see a similar result on the level of individual neurons. We therefore determined for each neuron the time bin at which the regression coefficient for V, VD, or D reached significance for the first time (Fig. 12). To avoid noise in our results from small fluctuations in the regression strength, we required that the coefficients in the following two time bins were also significant. In general, the results of the individual neurons support the findings on the population level. For all SEF neurons, the mean onset for value (31 ms before saccade onset) preceded the onset for value/direction interaction (16 ms before saccade onset), which in turn preceded the onset for direction (22 ms after saccade onset).
Fig. 12.
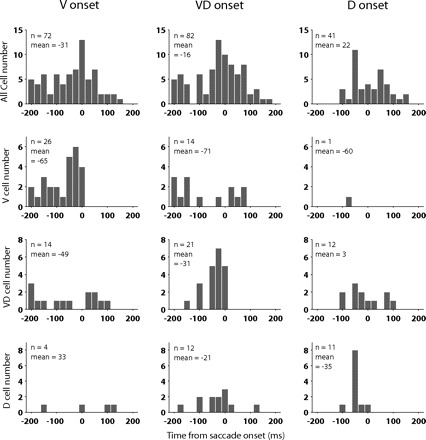
Distribution of onset of significant selectivity for value, direction, and their interaction. For each individual SEF neurons, the time bin relative to saccade onset was plotted, at which the regression function was 1st significantly influenced by value (left), value-direction interaction (middle), and direction (right). In the top row, we plotted the onset times of the 3 terms for all task-related neurons. In the next 3 columns, we plotted the onset times for the 27 V-neurons (top middle row), 22 VD-neurons (bottom middle row), and 13 D-neurons (bottom row) as classified by the regression method. For each neuronal population and regression term, we indicate the number of neurons, for which we could determine an onset time and the mean of the onset distribution.
The situation is more complicated, when we analyzed V-, VD-, D-neurons separately. It was not possible to determine onset times for the representation of all three variables for all neurons. However, almost all neurons of a particular group yielded onset times with respect to their “main” variable, which was used to classify them [V-neurons: 26/27 (96%); VD-neurons: 21/22 (95%); D-neurons: 11/13 (85%)]. Importantly, the onset times for the representation of these main variables were always before saccade onset. This contrasts with the representation of the other two “secondary” variables in each group of neurons. For example, the number of V-neurons for which we could determine an onset was much smaller (VD: 14/27, 52%; D: 1/27, 4%), and onset times were often after saccade onset (VD: 5/14, 36%). Similar results held for the VD-neurons and D-neurons, respectively. These findings are not surprising because we classified the neurons as belonging to the different functional groups by their high selectivity for value and direction and their interaction.
In comparison, the earliest onset times for the value representation in V-neurons started 200 ms before saccade onset, whereas the earliest onset times for the direction representation in D-neurons started 100 ms before saccade onset. Likewise, the mean onset time was earlier for V-neurons than for D-neurons (V: −65 ms; D: −35 ms), although this trend did not reach significance (permutation test, P = 0.07). However, a substantial number of them (8/26; 31%) was active >125 ms before saccade onset, which was before the onset of the earliest D-neurons. It is this group of early V-neurons that underlies the earlier onset of the value representation in the SEF population. The onset times for the value-direction interaction in VD-neurons were somewhere in the middle between these two extremes with the earliest onset occurring 150 ms before saccade onset and the mean onset time being 31 ms before saccade onset. Thus the analysis of the onset time in individual neurons also revealed a trend for SEF neurons first to represent the value and only later the direction of a saccade. The mean onset time estimates for the individual neurons are closer to saccade onset than the onset estimates for the entire population. This effect is most likely due to the fact that the analysis of individual neurons was noisier, and it took a larger modulation in the activity to reach significance. In sum, our dynamic regression analysis both on the population and on the individual neuron level revealed that SEF neurons early in the trial reflected the value of a saccade and only later its direction.
Third, we employed the information theoretic analysis in a similar way to study the evolution of value- and direction-representation in the SEF activity (Fig. 13). We used the same algorithm as in the case of the population level regression analysis to determine the onset of value and direction representation. Our findings confirmed our results from the regression analysis. The time course of the information about saccade value (red) and direction (blue) was significantly different (Kolmogrov-Smirnov test; P < 0.01). This was due to two effects. First, SEF population activity carried more value information than directional information. This reflected the fact that SEF neurons were more strongly modulated by value than by direction. Second, within the general SEF population, value information started to accumulate earlier than direction information (Fig. 13; value: 120 ms, direction: 60 ms before saccade onset). This difference in onset of the two information measures in the general population could be caused either by a temporal lag in the onset time at which value- or direction-only encoding cells begin to contribute to the population activity. Alternatively, there might be a temporal lag in the onset of information accumulation within the neuronal population that reflects both variables. In fact, we found that both factors contributed to the difference in onset in the general population when we analyzed the time course of information accumulation separately in the three populations as classified by the ratio of mean value and direction information in the 100 ms before saccade onset (Fig. 8A). First, the onset of the rise in value information in neurons that exclusively carried value information (Fig. 13; 110 ms before saccade onset) preceded the onset of rise of direction information in neurons that exclusively carried direction information (Fig. 13; 80 ms before saccade onset). Second, in neurons that carry value and direction information (Fig. 13), value information started to accumulate earlier than directional information (value: 120 ms, direction: 70 ms before saccade onset).
Fig. 13.
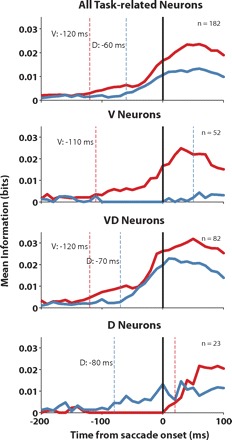
Temporal dynamics of value and direction information. For each time bin, the mean information carried by neurons was plotted. Red line, value; blue line, direction information; dotted lines, onset of information accumulation.
In summary, the analysis of the neuronal dynamics, using two different analytic techniques, suggests that at the beginning of the trial SEF neurons represented mainly option value independent of saccade metric, but later in the trial, they began to represent action-value and saccade direction. This difference in the timing of the two types of signals might reflect a selection process, whereby signals indicating the value of possible rewards drive the activation of specific action-related signals in SEF that are necessary to obtain the reward.
SEF neuronal activity at saccade initiation
Our findings indicate that the SEF is involved in the selection of saccades during value-based decision-making. This selection process starts with an option value estimate, proceeds to the computation of an action-value signal, and ends with the initiation of a specific action. We were interested to know whether the SEF activity also contributes to the final stage of this process. Neurons in FEF, SC, and LIP all reach a specific level of activity just before a saccade is initiated (Brown et al. 2008; Hanes et al. 1995; Pare and Hanes 2003; Roitman and Shadlen 2002; Stuphorn and Schall 2002). This activity threshold is different for each cell, but for a given cell, it is constant across a wide range of reaction times and task conditions. Crossing this neuronal threshold seems to constitute the trigger signal for saccade initiation, and the reaction time depends on the speed with which the activity ramps up and crosses the threshold. The activity that triggers the saccade initiation does not have to be the maximum activity because it is possible that neuronal activity further increases after crossing the threshold. However, logically the neuron should not reach the same or a higher activity level earlier in the trial because this would indicate that the same activity level is not consistently associated with the initiation of a response.
In the case of the countermanding saccade task, it has been shown that SEF activity is not sufficient to control saccade initiation (Stuphorn et al. 2010). In that task, saccades were generated or suppressed in response to external visual stimuli. However, it has been suggested that the medial frontal cortex (MFC), including SEF along with SMA and pre-SMA, is more specialized in “internally generated” actions (Passingham et al. 2009). According to this view, in some situations, external signals do not sufficiently constrain which action should be performed. Instead action selection is dominated by internal signals, such as reward expectations. The influence of these signals on behavior is thought to be mediated by MFC (Rudebeck et al. 2008). In our gambling task, saccades with identical metric had different action values, and these varying reward expectations had a systematic effect on reaction time (Fig. 4). We were therefore interested to see whether the SEF neurons were involved in triggering saccade initiation in the gambling task. In that case, they are expected to reach a constant activity level just before saccade initiation. Especially, because we identified three functionally different neuronal groups in SEF, we were interested to see whether the direction-only cells showed difference in their activities regarding the saccade initiation compared with the value encoding cells.
For each neuron, we compared the activities across groups of trials with the average value or reaction time of that group. We chose to group the neuronal activity by value because of the clear impact of this variable on neuronal activity. Because in a comparable analysis of FEF neurons the activity level was correlated with saccade reaction time (Brown et al. 2008; Hanes and Schall 1996), we also grouped the neuronal activity by reaction time even though our previous analysis showed that SEF neurons were better correlated with value than reaction time. If the SEF neuron had a constant activity threshold, we would expect to see no significant regression between activity and amount of value or length of reaction time, such as in the case of FEF neurons (Hanes et al. 1995). However, when we grouped the trials by value, 52% (95/182) of neurons showed a significant trend in their activity level, and 48% (88/182) of neurons showed a significant trend in their activity when we grouped the trials by reaction time. Thus about half of the SEF neurons behaved in a way that ruled out the existence of a constant threshold for these cells. Figure 14 shows an example of the change in firing rate as a function of value for each of the three groups of neurons. Even though the remaining cells did not show a significant trend, when sorted by value or reaction time, their activity level was not constant. Instead it fluctuated within a wide range (median span: 83% of the maximum firing rate) (Fig. 15).
Fig. 14.
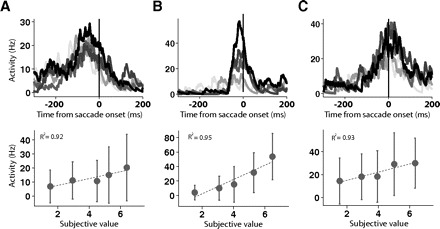
Neuronal activity at saccade initiation as a function of target. The 3 single cell examples represent V-neurons (A), VD-neurons (B), and D-neurons (C). The spike density histograms are aligned on saccade onset. Each column shows the activity of the same neuron sorted by target value. The saccade direction for all 5 trial groups is toward the preferred direction. The color of the spike density histogram represents the rank order of the trial groups from highest (black) to lowest (light gray) target value. Below each histogram is shown the mean activity in each trial group as a function of subjective value. Error bars indicate 1 SD. Dotted line, the linear regression.
Fig. 15.
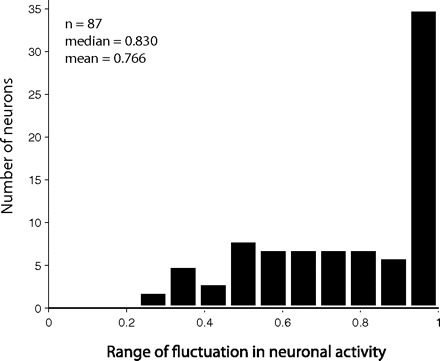
Range of fluctuation in neuronal activity at saccade initiation for the neurons not showing a significant trend with target value. The fluctuation range for each neuron was normalized against the maximum firing rate [range = (activitymax – activitymin)/activitymax].
Next we tested if any of the three subgroups (V-neurons, VD-neurons, D-neurons) was more or less likely to show a significant relationship between activity level at saccade onset and either value or reaction time. For this analysis, we used the classification of the SEF neurons by mutual information (Fig. 8A). The proportion of neurons that showed a significant relationship either to value or reaction time was similar among the three functional subgroups (Table 2). There was no significant difference among the three groups (value: χ2-test, P = 0.99; reaction time: χ2-test, P = 0.27). Thus even direction-only cells did not reach a constant activity level before saccade initiation. This finding might have been expected based on the dynamic regression analysis that showed that these cells often are significantly influenced by the interaction of value and direction (Fig. 11).
Table 2.
Proportion of SEF neurons that show a significant regression between their activity level immediately before saccade onset and the saccade's value or reaction time
| Grouped by | V-Neurons | VD-Neurons | D-Neurons |
|---|---|---|---|
| Value | 52 (27/52) | 52 (43/82) | 52 (12/23) |
| Reaction time | 44 (23/52) | 57 (47/82) | 35 (8/23) |
Values are expressed as percentages. SEF, supplementary eye field.
Our findings therefore confirm an earlier study (Stuphorn et al. 2010) that indicated that SEF neurons differ from other oculomotor neurons in that they do not show a constant activity threshold that, if exceeded, triggers the initiation of a saccade. While this finding was to be expected for SEF neurons that carry information about saccade value, it also holds true for neurons that only carry information about saccade direction. In conclusion, SEF neurons represent the motivation to act but do not determine if and when to act.
DISCUSSION
We show here that SEF neurons represent three different types of signals: a spatially nonspecific signal reflecting the value of targets (option-value signal), a spatially specific signal reflecting the value of saccades in particular directions (action-value signal), and a signal reflecting the saccade direction (motor signal). In our gambling task, option and action-value signals both represented the subjective, not expected, value of the reward options, and therefore directly reflected the monkeys' risk attitude. Value influenced SEF neurons more strongly than saccade direction and was represented earlier, by ∼60 ms. In addition, SEF neurons did not reach a fixed level of activity at which a saccade was initiated. Instead many reflected value even at the moment of saccade initiation. This was equally true for neurons carrying motor signals as for those neurons carrying either option-value or action-value signals. Thus SEF neurons are not well-suited to indicate the final commitment to perform a specific saccade. In sum, our findings support the hypothesis that SEF participates in value-based decision-making not by initiating the final saccade motor command but by transforming subjective value assessments of reward options in the environment (i.e., option-value signals) into the motivational drive to act on the reward option (i.e., action-value signals). These different action-value signals in SEF compete among each other and bias the saccade selection in other oculomotor areas that can initiate the final motor command.
Localization of SEF
We identified SEF as an area in the dorsomedial convexity that contained a cluster of saccade-related neurons, next to a cluster of arm-movement-related neurons in the medial wall (Fig. 2), but we did not reaffirm this localization using microstimulation. The location of the SEF can vary along the rostral-caudal axis (Tehovnik 1995; Tehovnik et al. 2000). However, we are not aware of any reports that indicate that the pre-SMA extends from the medial wall into the medial dorsal convexity where we recorded. As can be seen from Fig. 2, for this study, we recorded neurons in an area 4–6.5 mm lateral (monkey B) and 2–4.5 mm lateral (monkey A) to the longitudinal fissure. A careful map of saccade- and arm movement-related activity in the SEF, pre-SMA, and SMA showed that the SEF lay in the medial dorsal convexity apart from the medial wall (Fujii et al. 2002; Luppino et al. 1991). The highest number of saccade-related neurons was found on the dorsal surface of the MFC (SEF), while the highest number of primarily arm-movement-related neurons was found in the medial wall (pre-SMA, SMA). Thus our recordings were localized outside of the pre-SMA. Furthermore, if we had inadvertently included the pre-SMA into our recording sample, we would expect that most of the directional neurons to be found in the lateral extend of our recording area. However, as the maps showing the location of the V (red)-, VD (green)-, and D (blue)-neurons indicate, the three functional types are intermixed with each other (Fig. 2, B and C). If at all, then there is a tendency for the directional neurons to be found toward the medial extend of our recording area. Thus our neurons were most likely recorded in the SEF.
SEF represents value
Recently the influence of value on activity was studied in multiple frontal areas using a task design that was similar to the one used here (Roesch and Olson 2003). In this study, neurons in the SEF exhibited extremely weak modulation by expected reward size. The reason for the difference in our findings and this study are not fully clear. Because the number of SEF neurons recorded in the Roesch and Olson study (n = 144) is comparable in size to the number of neurons recorded in our study (n = 182), we do not think that the null result in this study is simply due to missing value-related neurons. We identified SEF not by microstimulation such as Roesch and Olson (2003). Nevertheless, as discussed in the preceding text, it seems extremely unlikely that we recorded in a different area of dorsomedial prefrontal cortex than they did.
One possible reason for the difference in value sensitivity of SEF neurons in our study and the study by Roesch and Olson (2003) is a difference in the task design. In our study, the single target (no-choice) trials were embedded in a stream of more numerous choice trials. If the SEF is more engaged in such choice trials, it might have been that SEF neurons continued to reflect value-related information in our task, even on no-choice trials, in which there was no need to select a target based on action-value signals because there is only one target and one reward offered. In contrast, in the study by Roesch and Olson (2003), the monkeys never had to make a choice about which saccade target to select. As a result, SEF might not have reflected value information with respect to the control of oculomotor behavior. Such a possibility would fit well with other recent reports (Coe et al. 2002; Seo and Lee 2009) that also report value-related modulations in SEF activity in choice tasks. This account has some difficulties in explaining the reward modulation of FEF neurons reported by Roesch and Olson (2003). However, this finding itself is at odds with an earlier report by Leon and Shadlen (1999). Altogether it seems that more experiments are necessary to settle this issue.
SEF represents option and action value
The SEF is part of a larger network of brain areas that is active during value-based decision-making (Kable and Glimcher 2009). Shortly after a cue indicates an available reward, neuronal signals in the OFC, ACC, and amygdala reflect the value of the cue (Matsumoto et al. 2003; Padoa-Schioppa and Assad 2006; Paton et al. 2006,Roesch and Olson 2004; Wallis and Miller 2003). The option-value signal, carried by the V-neurons in the SEF, likely reflects input from these areas, which all project to the SEF. The V-neurons are not spatially selective and therefore cannot contribute directly to the saccade selection or to related processes such as the allocation of attention in space (Maunsell 2004; Roesch and Olson 2004). It is possible that the V-neurons represent more general motivational arousal that reflects the target value (Roesch and Olson 2003, 2004). However, our finding that the V-neurons are better correlated with subjective value than reaction time argues strongly against this interpretation. In addition, a recent study found neurons in the dorsomedial frontal cortex (DMFC) that reflected in their activity the difference in value between two reward options in a matching-pennies task (Seo and Lee 2009). This value-difference signal was independent of the saccade direction that the monkey chose. Thus this signal might be related to the option-value signal we found in our study. The region of DMFC, where the neurons were recorded was in and around the same region as the one where we recorded. It is therefore very likely that the DMFC neurons described by Seo and Lee (2009) are in fact SEF neurons.
The VD-neurons do not encode pure value but rather the value associated with executing a particular action, i.e., an action-value signal. This hypothesis implies that these neurons do not carry primarily motor-related signals that are simply modulated by value. Instead we would suggest that these neurons reflect the level of incentive in favor of a particular behavioral act, independent of the specifics of the motor pattern associated with the act. This interpretation is supported by our finding that VD-neurons, like the V-neurons, are more influenced by saccade value than by saccade reaction time. Also the activity of VD-neurons is unsuitable to control saccade initiation. Conversely, the directional tuning of VD-neurons argues strongly against other interpretations such as general arousal, motor readiness, or the preparation of ingestive movements, which are all nondirectional (Roesch and Olson 2003). An action-value signal is of central importance in selecting an appropriate action during value-based decision-making (Kable and Glimcher 2009; Rangel et al. 2008). It represents the urge to act in a particular fashion and provides the basis on which a response is chosen. Action-value signals have also been reported in the human SEF and SMA (Wunderlich et al. 2009).
Latency difference between option and action-value signals
The transformation from option to action-value signals requires the combination of option-value signals with spatial sensory information about the location of the cues that indicate the available reward. As indicated in the preceding text, option-value signals likely reflect input from the limbic system. The SEF receives spatial visual information directly from visual cortex and indirectly from FEF and dorsolateral prefrontal cortex (DLPFC) (Huerta and Kaas 1990; Wang et al. 2005). It is therefore possible that the SEF directly participates in the transformation process from option-value to action-value signals. Alternatively, it is possible that transformation process takes place outside of the SEF, which simply reflects the input that arrives from different sources at different moments in time. At present, we do not know how and where the option-value and the spatial signals are combined, but we can assume that different stages in this process will appear at distinct points in time. In support of this hypothesis, we found that information about saccade direction in SEF developed later than the information about value, with a delay of ∼60 ms.
A similar transition has been reported for DLPFC (Kim et al. 2008). DLPFC neurons reflect reward size and preference (Kobayashi et al. 2006) but also the behavioral choices (Wallis and Miller 2003). DLPFC population activity reflects the chosen action later than the reward value (Kim et al. 2008). At present, we do not know what the functional differences are between DLPFC and SEF. One possibility is that DLPFC and SEF may interact cooperatively in transforming option into action-value representations because they are reciprocally connected with each other, and both cortical areas project to FEF, SC, and overlapping regions of the caudate (Huerta and Kaas 1990; Wang et al. 2005). In this context, it is of interest that the majority (82%) of action-value neurons in SEF showed a nonlinear interaction between spatial and value information. Many studies in frontal cortex have instead reported a reward modulation independent of direction (Roesch and Olson 2003). However, in DLPFC, it has been shown that spatial tuning is influenced by value (Kennerley and Wallis 2009; Kobayashi et al. 2002). This effect is particularly prominent in neurons that are located ventral to the principal sulcus (Kennerley and Wallis 2009). This region could therefore specifically influence activity in SEF neurons (Wang et al. 2005).
Another possibility is that activity in DLPFC and SEF reflect different aspects of the influence of reward on behavior. Neurons in DLPFC that integrate value and spatial information might reflect the impact of reward expectation on allocation of attention (Kennerley and Wallis 2009; Kobayashi et al. 2002; Maunsell 2004). In contrast, neurons in SEF might reflect more the impact of reward on the urge to act in a specific way. In support of this hypothesis, nearly half (47.4%) of DMFC neurons, but only a minority (7.9%) of DLPFC neurons, carried an option-value-like signal that indicates the difference in value of two targets in a matching pennies task (Seo and Lee 2009). Thus DMFC seemed more engaged in value-based decision-making. In humans, lesions in DLPFC led to cognitive deficits such as difficulties with planning and set-shifting, while lesions in the MFC, including SEF, led to difficulties with self-initiated behavior, i.e., a loss of the urge to act (Levy and Dubois 2006).
A third possibility is that DLPFC is the locus of transformation from option- to action-value signals and that option and action-value signals in SEF simply reflect input from the DLPFC, in particular from the area ventral to the principal sulcus (Kennerley and Wallis 2009). This hypothesis is supported by the fact that SEF does not receive direct input from the areas in OFC that carry option-value signals (Padoa-Schioppa and Assad 2006) but rather from intermediate areas in the ventral prefrontal cortex, such as area 12 (Wang et al. 2005). However, SEF might receive option-value signals from alternative sources, such as the basal ganglia (Haber et al. 2006) and the amygdala (Ghashghaei et al. 2007).
To distinguish between these possibilities, it is of importance to record from DLPFC and SEF using the same task design. In most other studies, a delayed-response paradigm was used. This allowed the presentation of cues that informed the monkey about the expected reward arbitrarily long before a second cue initiated the monkey's response. In contrast, in our study, we used a reaction-time paradigm in which the monkey could act as soon as possible on information regarding the expected reward of a response. Thus in our paradigm, there was a shorter interval between the onset of a value representation and the moment the monkey acts on this information. Reaction-time designs might therefore be more useful to determine the relative timing of signals across DLPFC and SEF.
SEF's role in value-based decisions
Decision-making and action selection is likely a distributed process that takes place within a larger network of areas, including SEF (Hernandez et al. 2010; Ledberg et al. 2007). The affordance competition hypothesis suggests that action selection (including value-based decision-making) is based on a competition within an interconnected network of parietal and frontal areas, such as FEF and LIP (Cisek 2007; Cisek and Kalaska 2010; Shadlen et al. 2008). The competition among the potential motor responses is strongly influenced and controlled by executive signals from the prefrontal cortex, including the SEF (Isoda and Hikosaka 2007; Johnston et al. 2007; Stuphorn and Schall 2006). In humans, lesions in SEF and SMA disrupt the automatic inhibitory control of motor plans that are evoked by external stimuli (Goldberg and Bloom 1990; Sumner et al. 2007).
The action-value signals we found in the SEF are an instance of such executive control signals. They guide the action selection in cases, such as in the gambling task, where external stimuli are not sufficient to select the best possible action. Instead option-value estimates are necessary to determine the degree of motivation to act on a particular reward option. Only if the motivation to act (i.e., the action value) is sufficiently larger than the motivation to respond in some other fashion (including not to act at all) should and will that particular action be executed. Even in the case of no-choice trials, the saccade to the single target has to compete with other task-unrelated responses (Herrnstein 1997). This interpretation is supported by findings that electrical stimulation of pre-SMA and SMA in humans generates the urge to perform particular actions (Fried et al. 1991).
While the neuronal activity in the SEF represents the urge to generate particular saccades, it is not sufficient to directly control saccade production (Stuphorn et al. 2010). Our finding that SEF neurons do not reach a fixed level of activity just before a saccade is initiated confirms this earlier finding and further supports the notion that there is a fundamental difference in the functional role of SEF and other oculomotor areas in motor control (Stuphorn et al. 2010). Studies of arm movement control in pre-SMA and SMA suggest that this is a general property of the MFC (Scangos and Stuphorn 2010).
In keeping with this interpretation, we found a relatively small number of purely direction-sensitive neurons in SEF, a fact that is not necessarily incongruent with earlier findings. In most other studies of SEF, the value obtained by saccades was held constant. In such studies, it would not have been possible to distinguish between purely directional neurons (D cells) and directional neurons that were influenced by value (VD cells). As a result many task-related neurons would be reported to be broadly directionally tuned, with a sizeable minority being active for all directions. Indeed this was reported in a number of earlier SEF recording studies (Moorman and Olson 2007; Schall 1991a,b).
SEF influences neuronal activity in oculomotor areas, such as FEF and SC (Huerta and Kaas 1990), that do directly control gaze (Hanes et al. 1998; Pare and Hanes 2003). Interestingly, FEF neurons do not reflect the value of saccadic targets (Leon and Shadlen 1999). SEF's influence could be exerted either directly through connections with FEF and SC or indirectly through projections to the caudate nucleus with which it forms a cortico-basal ganglia loop. Caudate neurons carry action-value signals (Lau and Glimcher 2008) and are thought to create an action bias that favors a motor response associated with a high reward (Lauwereyns et al. 2002a,b). The differences in the functional contributions of SEF and caudate are not known at present. One possibility is that the SEF represents a hierarchically higher structure that drives the caudate and is responsible for the action-value signals found in this structure. Another possibility is that SEF and caudate operate not independent of each other but rather as a functional unit. A third possibility is that the relative influence of either structure is context-dependent. In particular, SEF might be more important when action-value signals are not reliably associated with sensory stimuli. In the caudate studies, the average reward amount that resulted from an action into a particular direction was held constant for a block of trials. Therefore action values were constant for long periods of time and could be evoked automatically by sensory cues. In contrast, in our gambling task, the different reward options were presented in various positions, and action-value signals needed to be computed anew from option-value signals on every single trial. It will be important to determine the relative roles of SEF, DLPFC, and caudate in value-based decision-making, in particular their respective roles in shaping action-value signals.
Conclusion
The dynamics of neural information in SEF indicates that SEF participates in the computation of action-value signals based on spatially unspecific option-value signals. This transformation most likely occurs through interactive processing in a larger network of brain areas associated with value representation and saccade generation, in particular the DLPFC and the caudate nucleus. At present, it is difficult to directly compare the neuronal encoding dynamics in SEF and other brain areas because tasks with very different designs have been used. Therefore the examination of the neuronal encoding dynamics across this larger network using a common set of tasks will be a productive subject of future research. During value-based decision-making, the action-value signals in SEF associated with the possible saccades likely compete with each other. Under such circumstances, the relative strength of a particular action-value signal against its competitors will likely affect the probability that it will be chosen. However, SEF neurons do not carry a signal sufficient to control saccade initiation. It is therefore likely that the final decision that dictates which saccade will be executed takes place downstream of SEF.
DISCLOSURES
No conflicts of interest, financial or otherwise, are declared by the author(s).
REFERENCES
- Brown et al., 2008. Brown JW, Hanes DP, Schall JD, Stuphorn V. Relation of frontal eye field activity to saccade initiation during a countermanding task. Exp Brain Res 190: 135–151, 2008 [DOI] [PMC free article] [PubMed] [Google Scholar]
- Burnham and Anderson, 2002. Burnham KP, Anderson DR. Model Selection and Multimodal Inference. New York: Springer, 2002 [Google Scholar]
- Busemeyer and Diederich, 2010. Busemeyer JR, Diederich A. Cognitive Modeling. Thousand Oaks, CA: SAGE, 2010 [Google Scholar]
- Cisek, 2007. Cisek P. Cortical mechanisms of action selection: the affordance competition hypothesis. Philos Trans R Soc Lond B Biol Sci 362: 1585–1599, 2007 [DOI] [PMC free article] [PubMed] [Google Scholar]
- Cisek and Kalaska, 2010. Cisek P, Kalaska JF. Neural mechanisms for interacting with a world full of action choices. Annu Rev Neurosci 33: 269–298, 2010 [DOI] [PubMed] [Google Scholar]
- Coe et al., 2002. Coe B, Tomihara K, Matsuzawa M, Hikosaka O. Visual and anticipatory bias in three cortical eye fields of the monkey during an adaptive decision-making task. J Neurosci 22: 5081–5090, 2002 [DOI] [PMC free article] [PubMed] [Google Scholar]
- Dayan, 2008. Dayan P. The role of value systems in decision making. In: Better Than Conscious? edited by Engel C, Singer W. Cambridge, MA: The MIT Press, 2008 [Google Scholar]
- Dayan et al., 2006. Dayan P, Niv Y, Seymour B, Daw ND. The misbehavior of value and the discipline of the will. Neural Netw 19: 1153–1160, 2006 [DOI] [PubMed] [Google Scholar]
- Fried et al., 1991. Fried I, Katz A, McCarthy G, Sass KJ, Williamson P, Spencer SS, Spencer DD. Functional organization of human supplementary motor cortex studied by electrical stimulation. J Neurosci 11: 3656–3666, 1991 [DOI] [PMC free article] [PubMed] [Google Scholar]
- Fujii et al., 2002. Fujii N, Mushiake H, Tanji J. Distribution of eye- and arm-movement-related neuronal activity in the SEF and in the SMA and pre-SMA of monkeys. J Neurophysiol 87: 2158–2166, 2002 [DOI] [PubMed] [Google Scholar]
- Ghashghaei et al., 2007. Ghashghaei HT, Hilgetag CC, Barbas H. Sequence of information processing for emotions based on the anatomic dialogue between prefrontal cortex and amygdala. Neuroimage 34: 905–923, 2007 [DOI] [PMC free article] [PubMed] [Google Scholar]
- Goldberg and Bloom, 1990. Goldberg G, Bloom KK. The alien hand sign. Localization, lateralization and recovery. Am J Phys Med Rehabil 69: 228–238, 1990 [DOI] [PubMed] [Google Scholar]
- Haber et al., 2006. Haber SN, Kim KS, Mailly P, Calzavara R. Reward-related cortical inputs define a large striatal region in primates that interface with associative cortical connections, providing a substrate for incentive-based learning. J Neurosci 26: 8368–8376, 2006 [DOI] [PMC free article] [PubMed] [Google Scholar]
- Hanes and Schall, 1996. Hanes DP, Schall JD. Neural control of voluntary movement initiation. Science 274: 427–430, 1996 [DOI] [PubMed] [Google Scholar]
- Hanes et al., 1998. Hanes DP, Patterson WF, 2nd, Schall JD. Role of frontal eye fields in countermanding saccades: visual, movement, and fixation activity. J Neurophysiol 79: 817–834, 1998 [DOI] [PubMed] [Google Scholar]
- Hanes et al., 1995. Hanes DP, Thompson KG, Schall JD. Relationship of presaccadic activity in frontal eye field and supplementary eye field to saccade initiation in macaque: Poisson spike train analysis. Exp Brain Res 103: 85–96, 1995 [DOI] [PubMed] [Google Scholar]
- Hernandez et al., 2010. Hernandez A, Nacher V, Luna R, Zainos A, Lemus L, Alvarez M, Vazquez Y, Camarillo L, Romo R. Decoding a perceptual decision process across cortex. Neuron 66: 300–314, 2010 [DOI] [PubMed] [Google Scholar]
- Herrnstein, 1997. Herrnstein RJ. The Matching Law. Cambridge, MA: Harvard University Press, 1997 [Google Scholar]
- Huerta and Kaas, 1990. Huerta MF, Kaas JH. Supplementary eye field as defined by intracortical microstimulation: connections in macaques. J Comp Neurol 293: 299–330, 1990 [DOI] [PubMed] [Google Scholar]
- Isoda and Hikosaka, 2007. Isoda M, Hikosaka O. Switching from automatic to controlled action by monkey medial frontal cortex. Nat Neurosci 10: 240–248, 2007 [DOI] [PubMed] [Google Scholar]
- Ito and Doya, 2009. Ito M, Doya K. Validation of decision-making models and analysis of decision variables in the rat basal ganglia. J Neurosci 29: 9861–9874, 2009 [DOI] [PMC free article] [PubMed] [Google Scholar]
- Johnston et al., 2007. Johnston K, Levin HM, Koval MJ, Everling S. Top-down control-signal dynamics in anterior cingulate and prefrontal cortex neurons following task switching. Neuron 53: 453–462, 2007 [DOI] [PubMed] [Google Scholar]
- Kable and Glimcher, 2009. Kable JW, Glimcher PW. The neurobiology of decision: consensus and controversy. Neuron 63: 733–745, 2009 [DOI] [PMC free article] [PubMed] [Google Scholar]
- Kennerley et al., 2009. Kennerley SW, Dahmubed AF, Lara AH, Wallis JD. Neurons in the frontal lobe encode the value of multiple decision variables. J Cogn Neurosci 21: 1162–1178, 2009 [DOI] [PMC free article] [PubMed] [Google Scholar]
- Kennerley and Wallis, 2009. Kennerley SW, Wallis JD. Reward-dependent modulation of working memory in lateral prefrontal cortex. J Neurosci 29: 3259–3270, 2009 [DOI] [PMC free article] [PubMed] [Google Scholar]
- Kepecs et al., 2008. Kepecs A, Uchida N, Zariwala HA, Mainen ZF. Neural correlates, computation and behavioural impact of decision confidence. Nature 455: 227–231, 2008 [DOI] [PubMed] [Google Scholar]
- Kim et al., 2008. Kim S, Hwang J, Lee D. Prefrontal coding of temporally discounted values during intertemporal choice. Neuron 59: 161–172, 2008 [DOI] [PMC free article] [PubMed] [Google Scholar]
- Kobayashi et al., 2002. Kobayashi S, Lauwereyns J, Koizumi M, Sakagami M, Hikosaka O. Influence of reward expectation on visuospatial processing in macaque lateral prefrontal cortex. J Neurophysiol 87: 1488–1498, 2002 [DOI] [PubMed] [Google Scholar]
- Kobayashi et al., 2006. Kobayashi S, Nomoto K, Watanabe M, Hikosaka O, Schultz W, Sakagami M. Influences of rewarding and aversive outcomes on activity in macaque lateral prefrontal cortex. Neuron 51: 861–870, 2006 [DOI] [PubMed] [Google Scholar]
- Lau and Glimcher, 2008. Lau B, Glimcher PW. Value representations in the primate striatum during matching behavior. Neuron 58: 451–463, 2008 [DOI] [PMC free article] [PubMed] [Google Scholar]
- Lauwereyns et al., 2002a. Lauwereyns J, Takikawa Y, Kawagoe R, Kobayashi S, Koizumi M, Coe B, Sakagami M, Hikosaka O. Feature-based anticipation of cues that predict reward in monkey caudate nucleus. Neuron 33: 463–473, 2002a [DOI] [PubMed] [Google Scholar]
- Lauwereyns et al., 2002b. Lauwereyns J, Watanabe K, Coe B, Hikosaka O. A neural correlate of response bias in monkey caudate nucleus. Nature 418: 413–417, 2002b [DOI] [PubMed] [Google Scholar]
- Ledberg et al., 2007. Ledberg A, Bressler SL, Ding M, Coppola R, Nakamura R. Large-scale visuomotor integration in the cerebral cortex. Cereb Cortex 17: 44–62, 2007 [DOI] [PubMed] [Google Scholar]
- Leon and Shadlen, 1999. Leon MI, Shadlen MN. Effect of expected reward magnitude on the response of neurons in the dorsolateral prefrontal cortex of the macaque. Neuron 24: 415–425, 1999 [DOI] [PubMed] [Google Scholar]
- Levy and Dubois, 2006. Levy R, Dubois B. Apathy and the functional anatomy of the prefrontal cortex-basal ganglia circuits. Cereb Cortex 16: 916–928, 2006 [DOI] [PubMed] [Google Scholar]
- Liu et al., 2002. Liu J, Morel A, Wannier T, Rouiller EM. Origins of callosal projections to the supplementary motor area (SMA): a direct comparison between pre-SMA and SMA-proper in macaque monkeys. J Comp Neurol 443: 71–85, 2002 [DOI] [PubMed] [Google Scholar]
- Luce, 2000. Luce RD. Utility of Gains and Losses: Measurement-Theoretical and Experimental Approaches. Mahwah, NJ: Erlbaum, 2000 [Google Scholar]
- Luppino et al., 1991. Luppino G, Matelli M, Camarda RM, Gallese V, Rizzolatti G. Multiple representations of body movements in mesial area 6 and the adjacent cingulate cortex: an intracortical microstimulation study in the macaque monkey. J Comp Neurol 311: 463–482, 1991 [DOI] [PubMed] [Google Scholar]
- Luppino et al., 1993. Luppino G, Matelli M, Camarda R, Rizzolatti G. Corticocortical connections of area F3 (SMA-proper) and area F6 (pre-SMA) in the macaque monkey. J Comp Neurol 338: 114–140, 1993 [DOI] [PubMed] [Google Scholar]
- Magri et al., 2009. Magri C, Whittingstall K, Singh V, Logothetis NK, Panzeri S. A toolbox for the fast information analysis of multiple-site LFP, EEG and spike train recordings. BMC Neurosci 10: 81, 2009 [DOI] [PMC free article] [PubMed] [Google Scholar]
- Matelli et al., 1991. Matelli M, Luppino G, Rizzolatti G. Architecture of superior and mesial area 6 and the adjacent cingulate cortex in the macaque monkey. J Comp Neurol 311: 445–462, 1991 [DOI] [PubMed] [Google Scholar]
- Matsumoto et al., 2003. Matsumoto K, Suzuki W, Tanaka K. Neuronal correlates of goal-based motor selection in the prefrontal cortex. Science 301: 229–232, 2003 [DOI] [PubMed] [Google Scholar]
- Matsuzaka et al., 1992. Matsuzaka Y, Aizawa H, Tanji J. A motor area rostral to the supplementary motor area (presupplementary motor area) in the monkey: neuronal activity during a learned motor task. J Neurophysiol 68: 653–662, 1992 [DOI] [PubMed] [Google Scholar]
- Maunsell, 2004. Maunsell JH. Neuronal representations of cognitive state: reward or attention? Trends Cogn Sci 8: 261–265, 2004 [DOI] [PubMed] [Google Scholar]
- McCoy and Platt, 2005. McCoy AN, Platt ML. Risk-sensitive neurons in macaque posterior cingulate cortex. Nat Neurosci 8: 1220–1227, 2005 [DOI] [PubMed] [Google Scholar]
- Moorman and Olson, 2007. Moorman DE, Olson CR. Combination of neuronal signals representing object-centered location and saccade direction in macaque supplementary eye field. J Neurophysiol 97: 3554–3566, 2007 [DOI] [PubMed] [Google Scholar]
- Nishijo et al., 1988a. Nishijo H, Ono T, Nishino H. Topographic distribution of modality-specific amygdalar neurons in alert monkey. J Neurosci 8: 3556–3569, 1988a [DOI] [PMC free article] [PubMed] [Google Scholar]
- Nishijo et al., 1988b. Nishijo H, Ono T, Nishino H. Single neuron responses in amygdala of alert monkey during complex sensory stimulation with affective significance. J Neurosci 8: 3570–3583, 1988b [DOI] [PMC free article] [PubMed] [Google Scholar]
- Padoa-Schioppa and Assad, 2006. Padoa-Schioppa C, Assad JA. Neurons in the orbitofrontal cortex encode economic value. Nature 441: 223–226, 2006 [DOI] [PMC free article] [PubMed] [Google Scholar]
- Pare and Hanes, 2003. Pare M, Hanes DP. Controlled movement processing: superior colliculus activity associated with countermanded saccades. J Neurosci 23: 6480–6489, 2003 [DOI] [PMC free article] [PubMed] [Google Scholar]
- Passingham et al., 2009. Passingham RE, Bengtsson SL, Lau HC. Medial frontal cortex: from self-generated action to reflection on one's own performance. Trends Cogn Sci 14: 16–21, 2009 [DOI] [PMC free article] [PubMed] [Google Scholar]
- Paton et al., 2006. Paton JJ, Belova MA, Morrison SE, Salzman CD. The primate amygdala represents the positive and negative value of visual stimuli during learning. Nature 439: 865–870, 2006 [DOI] [PMC free article] [PubMed] [Google Scholar]
- Rangel et al., 2008. Rangel A, Camerer C, Montague PR. A framework for studying the neurobiology of value-based decision making. Nat Rev Neurosci 9: 545–556, 2008 [DOI] [PMC free article] [PubMed] [Google Scholar]
- Roesch and Olson, 2003. Roesch MR, Olson CR. Impact of expected reward on neuronal activity in prefrontal cortex, frontal and supplementary eye fields and premotor cortex. J Neurophysiol 90: 1766–1789, 2003 [DOI] [PubMed] [Google Scholar]
- Roesch and Olson, 2004. Roesch MR, Olson CR. Neuronal activity related to reward value and motivation in primate frontal cortex. Science 304: 307–310, 2004 [DOI] [PubMed] [Google Scholar]
- Roitman and Shadlen, 2002. Roitman JD, Shadlen MN. Response of neurons in the lateral intraparietal area during a combined visual discrimination reaction time task. J Neurosci 22: 9475–9489, 2002 [DOI] [PMC free article] [PubMed] [Google Scholar]
- Rudebeck et al., 2008. Rudebeck PH, Behrens TE, Kennerley SW, Baxter MG, Buckley MJ, Walton ME, Rushworth MF. Frontal cortex subregions play distinct roles in choices between actions and stimuli. J Neurosci 28: 13775–13785, 2008 [DOI] [PMC free article] [PubMed] [Google Scholar]
- Samejima et al., 2005. Samejima K, Ueda Y, Doya K, Kimura M. Representation of action-specific reward values in the striatum. Science 310: 1337–1340, 2005 [DOI] [PubMed] [Google Scholar]
- Sayer et al., 1990. Sayer RJ, Friedlander MJ, Redman SJ. The time course and amplitude of EPSPs evoked at synapses between pairs of CA3/CA1 neurons in the hippocampal slice. J Neurosci 10: 814–825, 1990 [DOI] [PMC free article] [PubMed] [Google Scholar]
- Scangos and Stuphorn, 2010. Scangos KW, Stuphorn V. Medial frontal cortex motivates but does not control movement initiation in the countermanding task. J Neurosci 30: 1968–1982, 2010 [DOI] [PMC free article] [PubMed] [Google Scholar]
- Schall, 1991a. Schall JD. Neuronal activity related to visually guided saccades in the frontal eye fields of rhesus monkeys: comparison with supplementary eye fields. J Neurophysiol 66: 559–579, 1991a [DOI] [PubMed] [Google Scholar]
- Schall, 1991b. Schall JD. Neuronal activity related to visually guided saccadic eye movements in the supplementary motor area of rhesus monkeys. J Neurophysiol 66: 530–558, 1991b [DOI] [PubMed] [Google Scholar]
- Seo and Lee, 2009. Seo H, Lee D. Behavioral and neural changes after gains and losses of conditioned reinforcers. J Neurosci 29: 3627–3641, 2009 [DOI] [PMC free article] [PubMed] [Google Scholar]
- Shadlen et al., 2008. Shadlen MN, Kiani R, Hanks TD, Churchland AK. Neurobiology of decision making, an intentional framework. In: Better Than Conscious? edited by Engel C, Singer W. Cambridge, MA: MIT Press, 2008, p. 71–101 [Google Scholar]
- Shook et al., 1991. Shook BL, Schlag-Rey M, Schlag J. Primate supplementary eye field. II. Comparative aspects of connections with the thalamus, corpus striatum, and related forebrain nuclei. J Comp Neurol 307: 562–583, 1991 [DOI] [PubMed] [Google Scholar]
- Stuphorn et al., 2010. Stuphorn V, Brown JW, Schall JD. Role of supplementary eye field in saccade initiation: executive not direct control. J Neurophysiol 103: 801–816, 2010 [DOI] [PMC free article] [PubMed] [Google Scholar]
- Stuphorn and Schall, 2002. Stuphorn V, Schall JD. Neuronal control and monitoring of initiation of movements. Muscle Nerve 26: 326–339, 2002 [DOI] [PubMed] [Google Scholar]
- Stuphorn and Schall, 2006. Stuphorn V, Schall JD. Executive control of countermanding saccades by the supplementary eye field. Nat Neurosci 9: 925–931, 2006 [DOI] [PubMed] [Google Scholar]
- Sumner et al., 2007. Sumner P, Nachev P, Morris P, Peters AM, Jackson SR, Kennard C, Husain M. Human medial frontal cortex mediates unconscious inhibition of voluntary action. Neuron 54: 697–711, 2007 [DOI] [PMC free article] [PubMed] [Google Scholar]
- Tehovnik, 1995. Tehovnik EJ. The dorsomedial frontal cortex: eye and forelimb fields. Behav Brain Res 67: 147–163, 1995 [DOI] [PubMed] [Google Scholar]
- Tehovnik et al., 2000. Tehovnik EJ, Sommer MA, Chou IH, Slocum WM, Schiller PH. Eye fields in the frontal lobes of primates. Brain Res Brain Res Rev 32: 413–448, 2000 [DOI] [PubMed] [Google Scholar]
- Tobler et al., 2007. Tobler PN, O'Doherty JP, Dolan RJ, Schultz W. Reward value coding distinct from risk attitude-related uncertainty coding in human reward systems. J Neurophysiol 97: 1621–1632, 2007 [DOI] [PMC free article] [PubMed] [Google Scholar]
- Tom et al., 2007. Tom SM, Fox CR, Trepel C, Poldrack RA. The neural basis of loss aversion in decision-making under risk. Science 315: 515–518, 2007 [DOI] [PubMed] [Google Scholar]
- Wallis and Miller, 2003. Wallis JD, Miller EK. Neuronal activity in primate dorsolateral and orbital prefrontal cortex during performance of a reward preference task. Eur J Neurosci 18: 2069–2081, 2003 [DOI] [PubMed] [Google Scholar]
- Wang et al., 2005. Wang Y, Isoda M, Matsuzaka Y, Shima K, Tanji J. Prefrontal cortical cells projecting to the supplementary eye field and presupplementary motor area in the monkey. Neurosci Res 53: 1–7, 2005 [DOI] [PubMed] [Google Scholar]
- Wunderlich et al., 2009. Wunderlich K, Rangel A, O'Doherty JP. Neural computations underlying action-based decision-making in the human brain. Proc Natl Acad Sci USA 106: 17199–17204, 2009 [DOI] [PMC free article] [PubMed] [Google Scholar]