

Abstract
Obesity and age are risk factors for feline diabetes. This study aimed to test the hypothesis that age, long-term obesity, and dietary composition would lead to peripheral and hepatorenal insulin resistance, indicated by higher endogenous glucose production (EGP) in the fasted and postprandial state, higher blood glucose and insulin, and higher leptin, free thyroxine, and lower adiponectin concentrations. Using triple tracer—2H2O, [U-13C3] propionate, and [3,4-13C2] glucose infusion, and indirect calorimetry—we investigated carbohydrate and fat metabolic pathways in overnight-fasted neutered cats (13 young lean, 12 old lean, and 12 old obese), each fed three different diets (high protein with and without polyunsaturated fatty acids, and high carbohydrate) in a crossover design. EGP was lowest in fasted and postprandial obese cats despite peripheral insulin resistance, indicated by hyperinsulinemia. Gluconeogenesis was the most important pathway for EGP in all groups, but glycogen contributed significantly. Insulin and leptin concentrations were higher in old than in young lean cats; adiponectin was lowest in obese cats but surprisingly highest in lean old cats. Diet had little effect on metabolic parameters. We conclude that hepatorenal insulin resistance does not develop in the fasted or postprandial state, even in long-term obese cats, allowing the maintenance of euglycemia through lowering EGP. Glycogen plays a major role in EGP, especially in lean fasted cats, and in the postprandial state. Aging may predispose to insulin resistance, which is a risk factor for diabetes in cats. Mechanisms underlying the high adiponectin of healthy old lean cats need to be further explored.
Keywords: nuclear magnetic resonance spectroscopy, adipocytokines, indirect calorimetry, glycogenolysis, insulin resistance, endogenous glucose production
in man and in cats, obesity and age are factors in the development of diabetes (8, 69). As in people, the incidence of feline obesity and diabetes has increased dramatically in the past 3 decades (2, 8). Obesity is now the most common nutritional disorder in cats, and diabetes is one of the most common endocrinopathies in aging cats. Little is known about the metabolic changes in obese cats and the influence of age and food intake on metabolic parameters that contribute to increasing obesity and diabetes.
Cats are obligatory carnivores that naturally subsist on a high-protein and high-fat diet. It has been stated anecdotally that glycogen contributes less to glucose production in cats than other species. Rogers et al. (61) reported that cats cannot readily adapt their sources of glucose production, a notion that has been refuted by others (25, 26, 65, 66). We have previously shown that, in fasted cats, fractional gluconeogenesis (GNG) and glycogenolysis is similar to humans (41). However, specific feline carbohydrate metabolism responses to a meal or to different diets has, to date, been unexplored.
Using nuclear magnetic resonance technology and an infusion method of three stable isotopes, we investigated key steps in glucose metabolism with a single blood sample. [3,4-13C2]-glucose was used to measure glucose turnover by conventional indicator dilution; 2H2O was used to measure the fractional contribution of glycogen, glycerol, and the TCA cycle to endogenous glucose production (EGP), and [U-13C3]- propionate was used as a anaplerotic tracer to measure fluxes through pathways associated with the TCA cycle.
We tested the hypothesis that age, long-term obesity, and dietary composition would lead to peripheral and hepatorenal insulin resistance, indicated by higher EGP in the fasted and postprandial state, higher glucose and insulin, leptin and free thyroxine, and lower adiponectin concentrations.
MATERIALS AND METHODS
Animals and Diets
In these studies, we included 25 lean (L; 12 female, 13 male) and 12 obese (obese; 6 female, 6 male) neutered adult cats. Thirteen of the lean cats were younger at ∼1 yr old (YL; 7 male and 6 female). Twelve of the lean cats were middle-aged to old (OL; equal gender distribution). The age for the OL females was 9.5 ± 0.2 yr, the age for the OL males was 8.3 ± 0.4 yr. All obese cats were middle-aged to old. The age for the obese females was 9.4 ± 0.2 yr, and for the obese males, the age was 8.2 ± 0.6 yr. The obese animals had been obese for over 5 yr prior to the beginning of the study. Obesity was originally induced by allowing ad libitum food intake, whereas lean animals were fed only the amount needed to maintain their body weight. The weight of the obese cats was ∼100% higher than their original lean adult weight. Cats were maintained at the University of Georgia, College of Veterinary Medicine Animal Care Facility under approved colony conditions. They were housed individually and were given free access to water. The University of Georgia Animal Care and Use Committee approved all animal studies and they were conducted in accordance with guidelines established by the Animal Welfare Act and the National Institutes of Health Guide for the Care and Use of Laboratory Animals. We determined that animals were healthy on the basis of results of a physical examination and clinical laboratory data. All cats were socialized with daily interactions. All cats ate the same diet before the beginning of the study (Nestlé Purina ProPlan, St. Louis, MO). They were then randomly allocated to start on one of three diets. Each cat received each of the three diets in a serial rotation for 5 mo at a time in a crossover design. The three diets included a high-protein regimen (HP), a high-carbohydrate regimen (HC), and a HP regimen with added polyunsaturated fatty acids (HPPUFA). Only two of the investigators (M. Waldron and A. Patil) knew the diet composition (Table 1), and they were not involved in execution of the experiments and data analyses. Food intake was recorded at each feeding. Caloric content of the ingested food was calculated using standard Atwater factors applied to the diet contents from Table 1 (49). We monitored the weight of the cats weekly and adjusted food intake to maintain body weight within a narrow range (<5%).
Table 1.
Diet composition
| Diet composition | HP | HPPUFA | HC |
|---|---|---|---|
| Protein, % | 48.10 | 46.60 | 32.60 |
| Fat, % | 11.40 | 12.90 | 10.50 |
| CHO (by subtraction), % | 24.16 | 23.37 | 37.74 |
| Fiber (crude), % | 0.94 | 1.19 | 1.32 |
| Ash, % | 6.68 | 6.25 | 6.94 |
| Moisture, % | 7.82 | 8.99 | 10.30 |
| ME, kcal/g (by calculation) | 3.57 | 3.61 | 3.41 |
| Fatty acid analysis, % of fat | |||
| 14:0 | 1.32 | 2.86 | 2.02 |
| 14:1 | 0.20 | 0.14 | 0.29 |
| 16:0 | 22.20 | 19.60 | 21.30 |
| 16:1n-7 | 3.15 | 4.40 | 2.47 |
| 18:0 | 9.61 | 7.88 | 13.20 |
| 18:1n-9 | 31.10 | 26.10 | 30.30 |
| 18:1n-7 | 1.55 | 2.30 | 1.33 |
| 18:1n-9 T | 1.90 | 1.29 | 3.32 |
| 18:2n-6 | 22.70 | 17.90 | 18.80 |
| 18:3n-3 | 1.32 | 1.50 | 1.04 |
| 20:0 | 0.16 | 0.19 | 0.23 |
| 20:2n-6 | 0.10 | 0.35 | <0.10 |
| 20:3n-6 | 0.11 | 0.17 | <0.10 |
| 20:4n-6 | 0.45 | 0.67 | 0.28 |
| 20:5n-3 | 0.34 | 3.61 | 0.34 |
| 22:5n-3 | <0.10 | 1.04 | <0.10 |
| 22:6n-3 | 0.29 | 2.90 | 0.26 |
| Total n-6 | 23.36 | 19.09 | 19.08 |
| Total n-3 | 1.95 | 9.05 | 1.64 |
HP, high-protein diet; HCPUFA, high-protein enriched in n-3 polyunsaturated fatty acids diet; HC, high-carbohydrate diet; CHO, carbohydrates; ME, malic enzyme.
We measured girth circumference (cm) and body mass index (BMI; expressed in kg/m2), as previously described (37) before each infusion experiment by the same person to minimize variability (E. Jordan). Dual emission X-ray absorptiometry was performed as previously described (75) once before the beginning of the infusion experiments during the second diet rotation.
Stable Isotope Method
Twice during each dietary rotation, the cats received infusions of stable nonradioactive isotopes, which were applied to study carbohydrate metabolism. After 4 mo on each of the three diets, we performed infusion experiments 5 h after feeding (postprandial groups) and, after an additional month, repeated the infusion procedures after fasting the animals for 24 h (fasting groups) using the methodology described in detail by Kley et al. (41) with minor modifications. We collected blood samples from the jugular vein, via a catheter, which was placed 48 h earlier, and maintained catheter patency by injection of 0.5 ml of 0.38% sterile citrate flush (citric acid, trisodium salt dihydrate; Sigma, St. Louis, MO) every 8–12 h. For the postprandial experiments, cats were initially fasted for 24 h, then fed their daily ration and mildly sedated [0.3–0.5 mg/kg body wt tiletamine/zolazepam (Telazol; Fort Dodge Animal Health, Fort Dodge, IA) intravenously]. We have previously shown that Telazol has no effect on glucose tolerance and insulin sensitivity (25). We collected a baseline blood sample (2.0 ml) and administered 6.0 ml/kg of a deuterium oxide [(2H2O, 99.9%,)/sodium [U-13C3] propionate, 99%; Cambridge Isotopes, Andover, MA] solution (200:1) via gastric tube. The cats then received a bolus intravenous infusion of [3,4-13C2] glucose (3.69 mg/kg as a 2 mg/ml in normal saline, 99%; Omicron Biochemicals, South Bend, IN) immediately followed by a continuous infusion (0.083 mg·kg−1·min−1) via the jugular vein catheter for 60 min. We collected another blood sample (12.0 ml) 60 min after the infusion to prepare for spectroscopy studies. For the experiments in the fasted state, the infusion of [3,4-13C2] glucose and oral administration of deuterium oxide and sodium propionate was performed after a 24-h fast.
Sample Processing
For the collection of plasma, we placed whole blood into chilled tubes containing EDTA and centrifuged the samples immediately at 4°C, and 890 g. We stored plasma samples at −80°C until further processing. For analysis by NMR, we isolated plasma glucose from the 60-min postinfusion blood sample and converted it to monoacetone glucose (MAG) as described in detail (41).
NMR Spectroscopy
We collected all NMR spectra with a Varian INOVA 14.1 T spectrometer (Varian Instruments, Palo Alto, CA) equipped with a 3-mm broadband probe (3 mm PFG Dual Broadband Probe, Varian, Palo Alto, CA), as previously described (32, 41). Spectral analysis was processed using the curve-fitting program MestRe-C (MestRe-C1; Mestrelab Research SL, Santiago de Compostela, Spain) a PC-based NMR spectral analysis program.
Metabolic Analysis
We estimated glucose turnover from the dilution of infused [3,4-13C2] glucose using 13C NMR of the MAG samples, as previously described (30). The fluxes from glycogen, glycerol, and phosphoenol pyruvate (PEP) into plasma glucose were estimated from the deuterium enrichment at position 2, 5, and 6 s (H2, H5, and H6s, respectively) based on the 2H NMR spectra (36, 46). 13C NMR analysis of the multiplets of carbon 2 of MAG yields the relative fluxes in the TCA cycle, as described previously (32, 35).
Other Assays
Insulin and glucose measurements were performed in samples taken before [3,4-13C2] glucose infusion in fasted and postprandial cats. Glucose was also measured on samples from the end of the 1-h infusion experiment. We measured glucose using a colorimetric glucose oxidase method (Genzyme Diagnostics, Cambridge, MA, USA), and insulin by radioimmunoassay, as described previously (23). We have previously shown that [3,4-13C2] glucose does not change plasma glucose concentrations (41). We measured adiponectin, leptin, and free thyroxine by equilibrium dialysis (FT4) concentrations in fasted cats with assays previously validated in our laboratory for use in cats (Refs. 17, 22, and 26, respectively). Plasma nonesterified fatty acids (NEFAs) were measured in fasted cats by use of an enzymatic test kit (NEFA-C; Wako Chemicals, Richmond, VA).
Indirect Calorimetry
We performed indirect calorimetry in each cat 1 wk before the postprandial infusion procedures (in the laboratory of Dr. William P. Flatt, Department of Food and Nutrition, University of Georgia, Athens, GA). The calorimetry system and calculations of respiratory exchange ratio (RER) and heat production have been described previously (25). The ambient temperature was 23°C. Cats were acclimated to the calorimetry chamber, baseline measurements were taken for 2 h after a 24-h fast, then the cats were fed their daily ration, and measurements continued for another 6 h. We used the measurements during the 6th h postfeeding for calculation of postprandial heat production.
Statistical Analysis
Preliminary analyses, including summary statistics, tests of normality (Anderson-Darling and Shapiro-Wilks tests), multinormality (Mardia's skewness and kurtosis coefficients, and the Henze-Zirkler test statistic), probability and quartile plots, and evaluation of transformations were carried out using Systat 13 (Systat, Chicago, IL). Analysis of repeated measures was carried out using PROC GLIMMIX (SAS 9.1.3; SAS Institute, Cary, NC). If sex, age, diet, or weight were not significant, the analysis was rerun after pooling by dropping all terms for the nonsignificant variable(s). Linear regression analysis was used to estimate associations among continuous variables in the data set. YL were compared with OL, and OL were compared with obese cats but not with YL. Data are expressed as means ± SE unless otherwise stated. Differences were declared to be significant when 0.05 ≤ P, and marginally significant when 0.05 < P ≤ 0.10.
RESULTS
Body Weight, BMI, Girth, % Fat, and Food Intake
Weight and BMI were higher in OL than YL groups, but % fat mass and girth were not different. Obese cats were significantly larger than age-matched OL controls in all four parameters (Table 2). There was no difference in cat weight among the different diets. In YL, the weight was 3.2 ± 0.1 during each of the three diet periods; in OL, it was 3.6 ± 0.1 kg when feeding HP and HC, and 3.5 ± 0.1 when feeding HPPUFA. In obese, it was 7.2 ± 0.3 in HPPUFA and 7.0 ± 0.3 in HP and HC. Total food consumed was greater in the obese cats compared with both YL and OL for all of the diets, and there was no significant difference between any of the food intake parameters for each diet preceding either postprandial or fasting experiments (data not shown), so the results presented combine both postprandial and fasting measurements. However, the food intake normalized to total body weight was consistently less in the obese cats. The dietary composition had only a modest effect on caloric intake. There was slightly greater intake of the HC diet (significant only for OL and obese) and slightly lower intake of the HFPUFA diet (significant only for OL) (Table 3).
Table 2.
Body weight, girth, % fat, and body mass index in 13 young lean, 12 old lean, and 12 old obese cats fed three different diets after fasting for 24 h
| Body Weight, kg | Girth, cm | % Fat | Body Mass Index, kg/m2 | |
|---|---|---|---|---|
| Young lean | 3.2 ± 0.1* | 30.8 ± 0.4 | 20 ± 2 | 33.1 ± 0.1* |
| Old lean | 3.6 ± 0.1*,# | 31.6 ± 0.5# | 20 ± 2# | 37.4 ± 0.1*,# |
| Obese | 7.0 ± 0.3# | 51.5 ± 1.2# | 61 ± 1# | 63.2 ± 0.3# |
Values are expressed as means ± SE. The results were combined because there was no difference among the diets. The % fat was measured in all cats only once at the end of the second diet rotation. * and #Significant differences between lean young and old cats and lean old and obese cats, respectively (P < 0.01).
Table 3.
Caloric intake in 13 young lean, 12 old lean, and 12 old obese cats fed three different diets
| HP, kcal/day | HPPUFA, kcal/day | HC, kcal/day | |
|---|---|---|---|
| Young lean | 159 ± 7 | 163 ± 10 | 172 ± 11 |
| Old lean | 167 ± 7#,a,b | 162 ± 7#,a,c | 177 ± 8#,b,c |
| Obese | 237 ± 8# | 223 ± 9#,d | 246 ± 12#,d |
| HP, kcal·kg−1·day−1 | HPPUFA, kcal·kg−1·day−1 | HC, kcal·kg−1·day−1 | |
| Young lean | 50 ± 2 | 51 ± 2 | 54 ± 2 |
| Old lean | 47 ± 1#,e,f | 45 ± 1#,e,g | 50 ± 2#,f,g |
| Obese | 35 ± 1# | 33 ± 1#,h | 36 ± 2#,h |
Values are expressed as means ± SE.
Significant differences between lean old and obese cats.
Values with the same superscript letter indicate diet differences within a group of cats (P < 0.05).
Glucose and NEFA Concentrations
There was no significant difference in baseline glucose concentrations between any of the experimental groups, nor was there any difference due to diet or between fasting and postprandial experiments (Table 4). There was also no change in glucose concentrations after the 1-h infusion (data not shown). Fasted NEFA concentrations were highest in obese cats (Table 4).
Table 4.
Glucose, insulin, NEFA, leptin, adiponectin, and free thyroxine measurements after a 24-h fast in 13 young lean, 12 old lean, and 12 old obese cats fed three different diets
| Young Lean | Old Lean | Obese | |
|---|---|---|---|
| Glucose, mg/dl | |||
| Fasting | 89 ± 2 | 89 ± 3 | 93 ± 4 |
| Postprandial | 90 ± 3 | 86 ± 3 | 90 ± 2 |
| Insulin, pmol/l | |||
| Fasting | 56 ± 9* | 69 ± 6*,# | 123 ± 14# |
| Postprandial | 63 ± 8* | 73 ± 8*,# | 136 ± 16# |
| NEFA, mEq/l | |||
| Fasting | 0.44 ± 0.04 | 0.51 ± 0.03# | 0.70 ± 0.04# |
| Adiponectin, μg/ml | |||
| Fasting | 3.3 ± 0.5* | 5.4 ± 1.0*,# | 1.5 ± 0.2# |
| Leptin, ng/ml | |||
| Fasting | 3.9 ± 0.3* | 4.9 ± 0.3*,# | 16.3 ± 2.2# |
| Free thyroxine, ng/dl | |||
| Fasting | 1.41 ± 0.07 | 1.44 ± 0.05 | 1.60 ± 0.07 |
Values are expressed as means ± SE. There were no diet differences and the data were combined. * and #Significant differences between young and old lean cats, and between lean old and obese cats, respectively (P < 0.05).
Hormonal Concentrations
Insulin and leptin concentrations were higher, and adiponectin concentrations were lower in obese cats compared with OL, as expected (Table 4). Insulin and leptin were also higher in OL cats compared with YL controls, but the adiponectin levels were also significantly increased in OL. The postprandial insulin levels were not significantly higher compared with fasting in all groups. Free thyroxine concentrations were highest in obese; however, this difference did not achieve significance (Table 4; P = 0.068).
Indirect Calorimetry
RER was not different among diets (data not shown). RER was not different between lean cats (0.77 ± 0.01 for both) but was significantly lower in obese cats (0.74 ± 0.01). There was an expected significant increase in RER measured 6 h postfeeding (P < 0.01) compared with baseline in all groups with a shift toward carbohydrate metabolism in the fed state. The total heat production per hour is shown in Fig. 1. The heat production per metabolic body weight [kcal/h/(body wt)0.75] in the fasted state was not different between YL and OL (2.5 ± 0.1 in YL, 2.5 ± 0.1 in OL) but was lower in obese cats (2.3 ± 0.1; P < 0.01). Postprandially, there was a significant increase in YL (2.9 ± 0.1) and OL (2.8 ± 0.1; P < 0.01 for both). In obese cats, postprandial heat production was not different compared with fasting; however, it was lower (2.2 ± 0.1) compared with OL (P < 0.01).
Fig. 1.
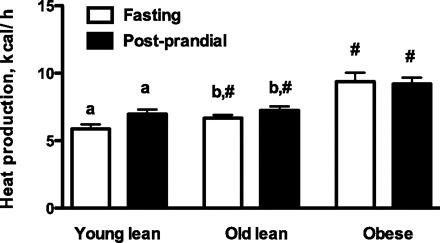
Total heat production (kcal/h) measured with indirect calorimetry after a 24-h fast (fasting) and from 5 to 6 h after feeding (postprandial). Values are expressed as means ± SE for 13 young lean, 12 old lean, and 12 old obese cats fed three different diets. The results were combined because there was no difference among the diets. #Significant differences between lean old and old obese cats. a,bValues with the same superscript letters indicate differences between fasting and postprandial values within a cat group (P < 0.01).
Glucose Turnover and Metabolic Fluxes
Postprandial EGP was significantly higher than fasting EGP in all cat groups. Comparing obese with OL, it was found that total EGP (mg/min) during fasting and postprandial experiments was higher, but EGP was significantly lower in obese cats, when it was expressed on a body weight basis (milligrams per kilograms per minute) (Fig. 2).
Fig. 2.
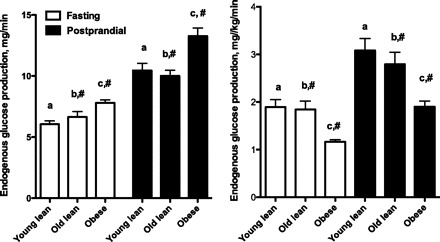
Endogenous glucose production (mg/min and mg·kg−1·min−1) in 13 young lean, 12 old lean, and 12 old obese cats fed three different diets. The results were combined because there was no difference among the diets. #Significant differences between lean old and obese cats. a,b,cValues with the same superscript letters indicate differences between fasting and postprandial values within a cat group (P < 0.05).
Origin of blood glucose by 2H NMR analysis.
Glucose produced by GNG was the major contributor to EGP in all groups, but there was also a considerable contribution from glycogenolysis in all groups (Fig. 3). There were no diet effects in any of the fluxes that were measured, and the data were combined.
Fig. 3.
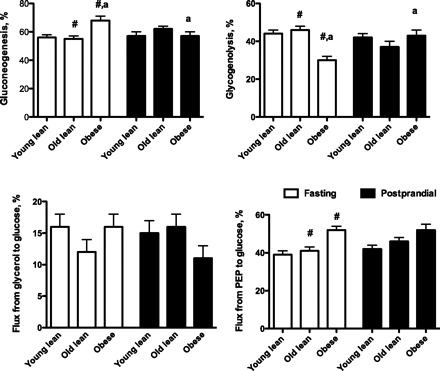
Relative fluxes through pathways in glucose production measured by 2H NMR analysis. Values are expressed as means ± SE for 13 young lean, 12 old lean, and 12 old obese cats fed three different diets. The results from each diet were combined because there was no difference among the diets. PEP, phosphoenolpyruvate; LY, young lean cats; LO, old lean cats; obese, old obese cats. #Significant differences between lean old and old obese cats. aValues with the same superscript letter indicate differences between fasting and postprandial values within a cat group (P < 0.05).
In fasting, the percentage of GNG and the % flux from PEP were significantly higher in obese cats compared with OL, whereas the percent glycogenolysis contributing to EGP was lower in obese cats than OL (Fig. 3). There was no difference in the % flux between OL and YL, and there was no difference in the % flux from glycerol to glucose among the three groups.
In contrast to fasting, postprandial values for the percentage of GNG, glycogenolysis, and % flux from glycerol and PEP to glucose were not different among any of the groups. This was due to the fact that GNG was lower in obese cats than it had been in fasting, and % glycogenolysis was higher.
Absolute fluxes were obtained by combining the relative fluxes with the measured EGP (36). In fasting, the absolute flux from glycogen was significantly lower in obese than lean but increased postprandially and was similar to the postprandial values seen in the lean cats. The fasting fluxes from glycerol or from PEP to glucose were not different among the groups (Table 5). Postprandially, the absolute flux from glycerol to glucose increased in lean cats, but this was not the case in obese cats. The postprandial absolute flux from PEP to glucose was higher in all cats compared with fasting. (Table 5).
Table 5.
Relative and absolute fluxes through pathways of glucose production
| Young Lean | Old Lean | Obese | |
|---|---|---|---|
| 13C NMR: Fluxes Relative to Citrate Synthase | |||
| Flux through PEPCK/CS | |||
| Fasting | 4.45 ± 0.36 | 5.25 ± 0.53 | 4.37 ± 0.27a |
| Postprandial | 4.25 ± 0.25 | 4.86 ± 0.51 | 5.41 ± 0.37a |
| Pyruvate cycling | |||
| Fasting | 3.25 ± 0.34 | 4.03 ± 0.47 | 3.47 ± 0.24 |
| Postprandial | 2.62 ± 0.24 | 3.42 ± 0.41 | 4.09 ± 0.32 |
| Flux from PEP to glucose/CS | |||
| Fasting | 1.20 ± 0.08b | 1.24 ± 0.12# | 0.90 ± 0.06c,# |
| Postprandial | 1.63 ± 0.09b | 1.44 ± 0.13 | 1.31 ± 0.11c |
| Derived Fluxes | |||
| Flux from glycogen to glucose | |||
| Fasting | 0.84 ± 0.07d | 1.00 ± 0.09# | 0.39 ± 0.06e,# |
| Postprandial | 1.40 ± 0.13d | 1.04 ± 0.11 | 0.80 ± 0.06e |
| Flux from glycerol to glucose | |||
| Fasting | 0.67 ± 0.1f,* | 0.36 ± 0.04g,* | 0.38 ± 0.05 |
| Postprandial | 1.04 ± 0.18f | 0.91 ± 0.13g,# | 0.38 ± 0.06# |
| Flux from PEP to glucose | |||
| Fasting | 1.52 ± 0.11h | 1.32 ± 0.10i | 1.16 ± 0.06j |
| Postprandial | 2.62 ± 0.19h | 2.66 ± 0.25i,# | 1.79 ± 0.13j,# |
| Flux through PEPCK | |||
| Fasting | 5.75 ± 0.51 | 6.46 ± 0.64j | 6.15 ± 0.45k |
| Postprandial | 6.97 ± 0.61 | 8.31 ± 0.61j | 7.99 ± 0.67k |
| Pyruvate cycling | |||
| Fasting | 4.25 ± 0.48 | 5.11 ± 0.60 | 4.99 ± 0.42$ |
| Postprandial | 4.38 ± 0.51 | 5.63 ± 0.50 | 6.23 ± 0.60$ |
| TCA cycle turnover | |||
| Fasting | 1.41 ± 0.12 | 1.42 ± 0.17l | 1.52 ± 0.13 |
| Postprandial | 1.71 ± 0.13 | 2.03 ± 0.20l | 1.61 ± 0.15 |
Values are means ± SE for 13 lean young, 12 lean old, and 12 old obese cats fed three different diets. Relative and absolute fluxes are given in mg·kg−1·min−1. The results from each diet were combined because there was no difference among the diets. PEP, phosphoenolpyruvate; PEPCK, phosphoenolpyruvate carboxykinase; CS, citrate synthase; OAA, oxaloacetate.
Significant differences between lean young and old cats and lean old and obese cats, respectively (P < 0.05).
Values with the same superscript letter indicate differences within a group of cats (P < 0.05).
P = 0.0650.
TCA cycle and related fluxes measured by 13C NMR analysis.
The fluxes through the TCA cycle and related fluxes measured by 13C NMR are shown in Table 5. Analyzing the C2 multiplets of the 13C NMR spectrum of MAG provides an estimate of fluxes through pyruvate carboxylase/phosphoenolpyruvate carboxykinase (PC/PEPCK) and pyruvate kinase/malic enzyme (PK/ME)-mediated pyruvate exchange with TCA cycle intermediates (pyruvate cycling), and GNG from the TCA cycle, all relative to citrate synthase flux. There was no effect of diet on these anaplerotic/cataplerotic fluxes through PC/PEPCK, pyruvate cycling, or GNG from the TCA cycle relative to the flux through citrate synthase, so the data were combined. Obese cats had higher fluxes through PEPCK/CS in the postprandial state compared with fasting, whereas there was no difference in the lean cats. There were no differences among fasting or postprandial groups in the flux through pyruvate kinase/CS (pyruvate cycling). GNG from the TCA cycle was higher in the postprandial state in all cats, but this was only significant for YL and obese cats.
Combining the results of fractional sources of glucose production by 2H NMR, TCA cycle fluxes obtained by 13C NMR and of the measured EGP yields the absolute fluxes through multiple pathways of the TCA cycle (Table 5). The results of the absolute fluxes were similar among all three groups in fasting, and there were no diet differences within any of the groups. Postprandial flux through PEPCK was higher in OL and obese cats, and pyruvate cycling tended to be higher in obese cats (P = 0.0650). There was a strong relationship between the absolute flux through PEPCK and the TCA cycle flux (citrate synthase) in fasting (r2 = 0.4303; P < 0.0001) and in the postprandial state (r2 = 0.3150; P < 0.0001).
DISCUSSION
This is the first report to our knowledge comparing the metabolic status of cats of different ages and body condition, and the metabolic consequences of food intake. We found that obese cats maintained euglycemia in the fasted and postprandial condition by adjusting EGP despite peripheral insulin resistance. While we did not measure insulin resistance directly in this study with the gold standard method—the euglycemic hyperinsulinemic clamp—we have previously shown that each increase in body weight by 1 kg leads to a decrease in insulin sensitivity by ∼30% (26). We also documented in the current study that glycogen plays a major role in glucose metabolism in cats in the fasted and postprandial state.
The long-term obese cats in the current study demonstrate insulin resistance characterized by fasting hyperinsulinemia, but maintain normal fasting and postprandial glucose concentrations, perhaps because they were able to lower EGP in response to the elevated insulin levels. We previously examined cats in the fasted state that had been obese for 1 yr, and also demonstrated lower fasting EGP in those obese cats compared with age-matched lean controls (41). We suggested that this might explain, in part, why obese cats maintain normal baseline glucose concentrations and glycosylated hemoglobin concentrations, and our current study confirms that obese cats compensate well for the lower peripheral insulin sensitivity. In that study, the low EGP was due to lower GNG and glycogenolysis; in the current study, only lower glycogenolysis was responsible for the lower EGP in the fasted state, whereas GNG from PEP, but not glycerol, was higher. In a study of lean and obese humans, increased contribution of GNG from PEP (but not GNG from glycerol) in the obese group has been linked to increased protein catabolism and insulin resistance of both glucose and protein metabolism. The hepatic glucose production, however, remained normal through a lower contribution from glycogenolysis, and this was attributed to relatively intact hepatic autoregulation (9), consistent with our results in obese cats. Because we did not specifically investigate protein metabolism, it is unclear whether there is also resistance to insulin suppression of protein catabolism in the obese cats. Other researchers have found that increased glycerol production contributes to the increase in fractional gluconeogenesis in people (31). It has also been suggested that the decrease in glycogenolysis in human obesity may either be due to the higher insulin concentrations, leading to suppression of glycogenolysis (5) or due to an increase in intracellular glucose-6-phosphate, favoring deactivation of glycogen phosphorylase (50). Our data suggest that obese cats reduce glycogenolyis but do not indicate the stoichiometric effects of intracellular glucose substrates. The relevance of glycogen to EGP in cats is also supported by early studies showing the presence of glycogen in liver of fasted cats (10, 59). We have recently measured glycogen in OL and old obese fasted cats and found that glycogen comprises ∼5% of the liver weight (unpublished data), which is similar to what is found in dogs (12) and humans (52). It is also noteworthy that, contrary to data from rats (33), glycogen is not depleted in cats after a 24-h fast and, even in fasted obese cats, glycogenolysis still contributes about 30% to glucose production. In a study of 22-h fasted people, glycogenolysis accounted for 36% to total glucose production (63), a value similar to cats in this study fasted for 24 h. It was not until a fast of 42 h that GNG accounted for essentially all of the glucose production in people (63). The lower glycogenolysis in fasted obese cats could be due to reduced hepatic glycogen content. We found that glycogen content in old obese fasted cats was ∼10% lower than that seen in lean age-matched cats, but this was not significant (unpublished data). Decreased glycogenolysis and increased GNG in obese people was actually associated with an increase in hepatic glycogen content (50). When net glycogenolysis was followed 5–12 h after a large, 1,000-kcal meal (54), net hepatic glycogenolysis contributed 45% to whole-body glucose production, a value almost identical to what we saw in cats 6 h postfeeding. When liver glycogen was monitored with 13C NMR following a mixed meal, liver glycogen increased over 30% at 5 h. It was calculated that ∼19% of the carbohydrate content in the meal was deposited as glycogen in one study (71). Others found that about 25% were deposited after an oral glucose load (58). Postprandial hepatic glycogen content has not been evaluated in cats. Because muscle is also involved in glycogen storage, it would be of interest to evaluate whether and how muscle glycogen stores change with fasting and feeding in cats, but this has not been reported. In people, it has been shown that muscle glycogen increases from 80 to 100 mmol/l by 5 h after a meal and then decreases (71), whereas in the liver, the postprandial increase is larger (from 265 mmol/l to 360 mmol/l) (45). Similarly, this study did not address gluconeogenesis by the kidney, and no previous data are available from cats. The contribution of the kidney in humans to EGP in the postprandial state has been small (∼5%), and even after 60 h of fasting, only represents 20–25% of EGP (16). It has also been shown in dogs that an overnight fast does not lead to significant net output of glucose from the kidney (14). The liver, therefore, is the predominant site for glucose production in the fasted and even more so in the postprandial state. Although it may seem unexpected that EGP is elevated in postprandial cats, EGP within 10 h postfeeding in people is similarly about 50% higher than EGP after a 1-day fast (60).
Relative and absolute fluxes of PEP to glucose, oxaloacetate to glucose, and pyruvate cycling (which refers to the combined flux through two distinct futile cycles: oxaloacetate-PEP-pyruvate-oxaloacetate, and oxaloacetate-malate-pyruvate-oxaloacetate) (34) were similar to our previous measurements in fasted cats (41). In YL cats, no changes between fasting and postprandial absolute fluxes were seen. In obese cats, fluxes through PC/PEPCK and citrate synthase were significantly more active in the postprandial state, and this was accompanied by a similar increase (∼30%) in pyruvate cycling, which was marginally significant (P = 0.0650). These data suggest that the hepatic TCA cycle is significantly more active in obese postprandial cats, but pyruvate cycling appears to modulate gluconeogenesis and EGP. A regulatory role for pyruvate cycling has also been described in Zucker (fa/fa) rats (34). We have previously shown that fasted female obese cats had similar changes, including higher pyruvate cycling (41). We hypothesized in that study that obese cats might compensate their overnutrition by enhancing these fluxes, creating a protective mechanism against oxidative stress (41). It is unclear why changes were not seen also in the fasted state in the current study. It is possible that prolonged obesity or the differences in the diets between the two studies led to this difference. Fluxes through PEPCK and TCA cycle fluxes were strongly correlated in all cats, an interdependence previously shown in several studies (7, 21) and consistent with the postulate that flux through PEPCK generates energy in the hepatic TCA cycle.
OL and obese cats had significantly higher insulin concentrations than the YL cats, whereas glucose concentrations were not different. This suggests that OL and obese cats have insulin resistance. We have previously shown in obese cats that the development of obesity leads to a change in insulin sensitivity (26). In a recent study, older cats (average age 5.8 yr) showed a higher area under the curve for insulin (AUCI) in the late phase of an intravenous glucose tolerance test than young cats (average age 1.1 yr). However, in that study, body fat mass was higher in the older cats and may have accounted for the higher AUCI. Fasting insulin and glucose concentrations were not different (3). An association between aging and peripheral insulin resistance has been known for many years in humans of both sexes (13, 18, 28, 64) and rodents (20, 51). Aging is also associated with changes in body composition, especially higher fat mass, making it difficult to isolate the role of aging on impaired insulin action. Several reports have shown that decreased insulin sensitivity occurs in nonobese elderly humans (13, 28, 64), others have shown that age-related changes in adiposity, and/or physical inactivity are the primary determinants of the declines in insulin sensitivity rather than chronological age (2, 5, 43). The higher insulin concentrations in the OL cats were not associated with a change in fat mass, nor did we document any specific changes in carbohydrate metabolism in the older cats with higher insulin levels. Studies using the gold standard method, the euglycemic hyperinsulinemic clamp, are necessary to confirm a decrease in insulin sensitivity in this age group. Insulin and glucose concentrations were not different in the postprandial state compared with the fasted state in all groups. We have recently shown that obese cats, unless prediabetic, do not have different glucose concentrations than lean cats and do not show great inter-day variability when monitored for a 7-day period during their daily routine with a continuous glucose monitoring system (27). Even when 40% of the diet consisted of glucose, only a small increase in blood glucose was seen at 1 h postfeeding but not at 3 or 6 h (39). Because only one blood sample was taken after food intake in the current study, it is possible that higher glucose and insulin concentrations might have been present at earlier time points.
It is interesting that leptin concentrations were also increased in OL cats. Our laboratory and others have shown that leptin increases with increasing fat mass (4, 26). However, fat mass was similar between the two lean groups, suggesting that not only body condition but also age, influence leptin concentration in cats. In people, plasma leptin concentrations have been found to be low (29, 53), unchanged (1), or increased with age (20, 70). The OL cats in our study had higher fasting insulin concentrations compared with YL cats. Several studies have shown that insulin may modulate serum leptin levels. Serum leptin has been shown to correlate with fasting insulin (11, 19, 70) and indices of insulin resistance in humans (68) independent of obesity. Some investigators documented that insulin increases plasma leptin concentrations in rodents or humans (44, 47), whereas others were unable to show regulation of leptin expression or secretion by insulin (74). It is not possible to show a cause-effect relationship between the two hormones with our study design.
Adiponectin is a hormone that is primarily secreted from adipocytes but can also be secreted from skeletal muscle cells (55). It is very abundant in plasma, modulates glucose and lipid metabolism, and is thought to be anti-inflammatory, insulin-sensitizing, and anti-atherogenic. We have previously shown that adiponectin is negatively correlated with obesity in cats (26), and similar findings have been reported from other species, including humans (15). Weight reduction increases adiponectin in obese cats and humans (26, 67). Higher concentrations of adiponectin in lean cats compared with obese cats in this study were expected, but increased concentrations in OL compared with YL, is a novel finding. Discrepant results have been reported from studies in humans regarding the effect of age on adiponectin. Adiponectin levels have been reported to increase with age in normal-weight, middle-aged, and older women, and were independently related to age, leptin, and insulin resistance values (37, 42), while others have not seen an increase with age (67). A recent study (40) of adults surviving to advanced old age showed that plasma adiponectin concentration increased longitudinally with age and was also independently related to physical decline in this population. A similar negative association between plasma adiponectin concentration and total mortality, as well as cardiovascular mortality, has been described in a large cohort of older adults (57). Increased concentrations of circulating adiponectin have been observed repeatedly in patients with congestive heart failure (CHF) and are associated with disease severity and inverse outcome (73), although CHF is an insulin-resistant state in which decreased adiponectin levels might be expected. It has been speculated that increased adiponectin concentrations in CHF reflect a compensatory mechanism to overcome insulin resistance and inflammatory changes associated with the disease (48). In other studies, high concentrations of circulating adiponectin have been associated with reduced risks of cardiovascular disease (56, 62). Others have suggested that the increase in adiponectin seen with age is due to declining renal function, leading to decreased clearance of the hormone (30). Because the biological significance of this elevation in plasma adiponectin in the elderly is not known, further investigation is necessary to clarify the role of increased adiponectin in older people and cats.
Diet only had a minor influence on any of the parameters measured in this study. This might be due to the fact that the differences among the diets were not very large. All diets had more than 30% protein, and the percentage of fat was approximately the same among the diets. In the cat, the minimum level to maintain nitrogen balance has been reported to be 10% (6). Neither age nor body condition led to changes in the RER, which is a measure of metabolic fuel source. Pure carbohydrate oxidation gives an RER of 1.00, whereas pure fat oxidation gives a ratio of ∼0.71. In the fasted state, more fat was oxidized in all groups of cats, whereas feeding decreased its oxidation, regardless of diet. The significantly lower RER of obese fasted cats indicates a preference for lipids as fuel and might have contributed to the lower EGP. This supports our earlier findings during a euglycemic hyperinsulinemic clamp of a higher fat oxidation in younger obese females than in lean cats of either sex (25). We included a diet containing PUFAs because we were able to show previously a beneficial effect of PUFAs on insulin sensitivity, although at different concentrations (75).
The metabolic rate and caloric intake of obese cats based on metabolic body size and body weight, respectively, were less than that of lean cats, supporting earlier findings from our laboratory (26). One might argue that results from obese cats based on metabolic size or body weight lead to erroneous conclusions because fat mass is inert. This has been challenged recently, and it has been suggested that fat mass is important in whole body energy expenditure (38). In this study, total intake and heat production was higher in obese cats; however, while total body weight was twice as high in obese than lean cats, both total heat production and caloric intake were only ∼50% higher, supporting the notion that fat contributes to energy expenditure, but it is not a linear relationship.
The higher fasting NEFA concentrations in obese cats were likely caused by lower lipoprotein lipase activity (24) and may have led to the trend toward an increase in FT4 concentration because we have previously shown that the in vitro addition of palmitate and oleate to cat plasma, within a physiological concentration range, leads to a significant increase of the free T4 fraction (17).
Perspectives and Significance
We have shown that long-term obese cats compensate well for peripheral insulin resistance by lowering endogenous glucose output in both the fasted and fed state. We have also shown that in lean and obese cats, the contribution of gluconeogenesis and glycogenolysis to endogenous glucose production was similar to that seen in humans. OL cats had higher insulin with normal glucose concentrations, suggesting that they were insulin resistant. Surprisingly, leptin and adiponectin levels were higher in OL cats than YL cats. The significance of these findings needs to be explored further. Diet had little influence on any of the parameters.
GRANTS
This study was, in part, supported by a grant from the Nestlé Purina Petcare, St. Louis, MO.
DISCLOSURES
No conflicts of interest, financial or otherwise, are declared by the authors.
ACKNOWLEDGMENTS
The authors thank Dr. David Schaeffer for statistical analysis, and Emily Kelso for expert technical assistance.
Present address for S. Kley: Boehringer Ingelheim Vetmedica, Binger Strasse 173, 55216 Ingelheim am Rhein, Germany.
REFERENCES
- 1. Ahren B, Pacini G. Age-related reduction in glucose elimination is accompanied by reduced glucose effectiveness and increased hepatic insulin extraction in man. J Clin Endocrinol Metab 83: 3350–3356, 1998 [DOI] [PubMed] [Google Scholar]
- 2. Amati F, Dube JJ, Coen PM, Stefanovic-Racic M, Toledo FG, Goodpaster BH. Physical inactivity and obesity underlie the insulin resistance of aging. Diabetes Care 32: 8: 1547–1549, 2009 [DOI] [PMC free article] [PubMed] [Google Scholar]
- 3. Backus RC, Cave NJ, Ganjam VK, Turner JB, Biourge VC. Age and body weight effects on glucose and insulin tolerance in colony cats maintained since weaning on high dietary carbohydrate. J Anim Physiol Anim Nutr(Berl) 94: e318–e328, 2010 [DOI] [PubMed] [Google Scholar]
- 4. Backus RC, Havel PJ, Gingerich RL, Rogers QR. Relationship between serum leptin immunoreactivity and body fat mass as estimated by use of a novel gas-phase Fourier transform infrared spectroscopy deuterium dilution method in cats. Am J Vet Res 61: 796–801, 2000 [DOI] [PubMed] [Google Scholar]
- 5. Basu R, Breda E, Oberg AL, Powell CC, Dalla Man C, Basu A, Vittone JL, Klee GG, Arora P, Jensen MD, Toffolo G, Cobelli C, Rizza RA. Mechanisms of the age-associated deterioration in glucose tolerance: contribution of alterations in insulin secretion, action, and clearance. Diabetes 52: 1738–1748, 2003 [DOI] [PubMed] [Google Scholar]
- 6. Burger IH, Blaza SE, Kendall PT, Smith PM. The protein requirement of adult cats for maintenance. Fel Prac 14: 8–14, 1984 [Google Scholar]
- 7. Burgess SC, He T, Yan Z, Lindner J, Sherry AD, Malloy CR, Browning JD, Magnuson MA. Cytosolic phosphoenolpyruvate carboxykinase does not solely control the rate of hepatic gluconeogenesis in the intact mouse liver. Cell Metab 5: 313–320, 2007 [DOI] [PMC free article] [PubMed] [Google Scholar]
- 8. Centers for Disease Control, and Prevention. Prevalence of diabetes and impaired fasting glcuose in adults-United States, 1999–2000. Morb Mortal Wkly Rep 52: 833–837, 2003 [PubMed] [Google Scholar]
- 9. Chevalier S, Burgess SC, Malloy CR, Gougeon R, Marliss EB, Morais JA. The greater contribution of gluconeogenesis to glucose production in obesity is related to increased whole-body protein catabolism. Diabetes 55: 675–681, 2006 [DOI] [PubMed] [Google Scholar]
- 10. Corey EL. Glycogen levels in the isolated liver perfused with cortico-adrenal extract, insulin, and other preparations. Am J Phsyiol 131: 783–789, 1941 [Google Scholar]
- 11. Dagogo-Jack S, Fanelli C, Paramore D, Brothers J, Landt M. Plasma leptin and insulin relationships in obese and nonobese humans. Diabetes 45: 695–698, 1996 [DOI] [PubMed] [Google Scholar]
- 12. de Bruijne JJ, de Koster P. Glycogenolysis in the fasting dog. Comp Biochem Physiol B 75: 553–555, 1983 [DOI] [PubMed] [Google Scholar]
- 13. De Fronzo RA. Glucose intolerance and aging. Diabetes Care 4: 493–501, 1981 [DOI] [PubMed] [Google Scholar]
- 14. Dies Federico Herrera J, Manuel M, Avelar E, Ramos G. Substrate uptake by the kidney in vivo. Am J Physiol 218: 405–410, 1970 [DOI] [PubMed] [Google Scholar]
- 15. Diez JJ, Iglesias P. The role of the novel adipocyte-derived hormone adiponectin in human disease. Eur J Endocrinol 148: 293–300, 2003 [DOI] [PubMed] [Google Scholar]
- 16. Ekberg K, Landau BR, Wajngot A, Chandramouli V, Efendic S, Brunenhraber H, Wahren J. Contributions by kidney and liver to glucose production in the postabsorptive state and after 60 hours of fasting. Diabetes 49: 292–298, 1999 [DOI] [PubMed] [Google Scholar]
- 17. Ferguson DC, Caffall Z, Hoenig M. Obesity increases free thyroxine proportionally to nonesterified fatty acid concentrations in adult neutered female cats. J Endocrinol 194: 267–273, 2007 [DOI] [PubMed] [Google Scholar]
- 18. Fink RI, Kolterman OG, Griffin J, Olefsky JM. Mechanisms of insulin resistance in aging. J Clin Invest 71: 1523–1535, 1983 [DOI] [PMC free article] [PubMed] [Google Scholar]
- 19. Gabriely I, Ma XH, Yang XM, Rossetti L, Barzilai N. Leptin resistance during aging is independent of fat mass. Diabetes 51: 1016–1021, 2002 [DOI] [PubMed] [Google Scholar]
- 20. Goodman MN, Dluz SM, McElaney MA, Belur E, Ruderman NB. Glucose uptake and insulin sensitivity in rat muscle: changes during 3–96 weeks of age. Am J Physiol Endocrinol Metab 244: E93–E100, 1983 [DOI] [PubMed] [Google Scholar]
- 21. Hakimi P, Johnson MT, Yang J, Lepage DF, Conlon RA, Kalhan SC, Reshef L, Tilghman SM, Hanson RW. Phosphoenolpyruvate carboxykinase and the critical role of cataplerosis in the control of hepatic metabolism. Nutr Metab (Lond) 2: 33, 2005 [DOI] [PMC free article] [PubMed] [Google Scholar]
- 22. Hoenig M, Ferguson DC. Effects of neutering on hormonal concentrations and energy requirements in male and female cats. Am J Vet Res 63: 634–639, 2002 [DOI] [PubMed] [Google Scholar]
- 23. Hoenig M, Ferguson DC. Impairment of glucose tolerance in hyperthyroid cats. J Endocrinol 121: 249–251, 1989 [DOI] [PubMed] [Google Scholar]
- 24. Hoenig M, McGoldrick JB, deBeer M, Demacker PN, Ferguson DC. Activity and tissue-specific expression of lipases and tumor-necrosis factor alpha in lean and obese cats. Domest Anim Endocrinol 30: 333–344, 2006 [DOI] [PubMed] [Google Scholar]
- 25. Hoenig M, Thomaseth K, Waldron M, Ferguson DC. Fatty acid turnover, substrate oxidation, and heat production in lean and obese cats during the euglycemic hyperinsulinemic clamp. Domest Anim Endocrinol 32: 329–338, 2007 [DOI] [PubMed] [Google Scholar]
- 26. Hoenig M, Thomaseth K, Waldron M, Ferguson DC. Insulin sensitivity, fat distribution, and adipocytokine response to different diets in lean and obese cats before and after weight loss. Am J Physiol Regul Integr Comp Physiol 292: R227–R234, 2007 [DOI] [PubMed] [Google Scholar]
- 27. Hoenig M, Pach N, Thomaset K, DeVries F, Ferguson DC. Evaluation of long-term glucose homeostasis on lean and obese cats using contiuous glucose monitoring. Am. J. Vet. Res. In press [DOI] [PubMed] [Google Scholar]
- 28. Houmard JA, Weidner MD, Dolan PL, Leggett-Frazier N, Gavigan KE, Hickey MS, Tyndall GL, Zheng D, Alshami A, Dohm GL. Skeletal muscle GLUT4 protein concentration and aging in humans. Diabetes 44: 555–560, 1995 [DOI] [PubMed] [Google Scholar]
- 29. Isidori AM, Strollo F, More M, Caprio M, Aversa A, Moretti C, Frajese G, Riondino G, Fabbri A. Leptin and aging: correlation with endocrine changes in male and female healthy adult populations of different body weights. J Clin Endocrinol Metab 85: 1954–1962, 2000 [DOI] [PubMed] [Google Scholar]
- 30. Isobe T, Saitoh S, Takagi S, Takeuchi H, Chiba Y, Katoh N, Shimamoto K. Influence of gender, age and renal function on plasma adiponectin level: the Tanno and Sobetsu study. Eur J Endocrinol 153: 91–98, 2005 [DOI] [PubMed] [Google Scholar]
- 31. Jahoor F, Klein S, Wolfe R. Mechanism of regulation of glucose production by lipolysis in humans. Am J Physiol Endocrinol Metab 262: E353–E358, 1992 [DOI] [PubMed] [Google Scholar]
- 32. Jin ES, Burgess SC, Merritt ME, Sherry AD, Malloy CR. Differing mechanisms of hepatic glucose overproduction in triiodothyronine-treated rats vs. Zucker diabetic fatty rats by NMR analysis of plasma glucose. Am J Physiol Endocrinol Metab 288: E654–E662, 2005 [DOI] [PubMed] [Google Scholar]
- 33. Jin ES, Jones JG, Merritt M, Burgess SC, Malloy CR, Sherry AD. Glucose production, gluconeogenesis, and hepatic tricarboxylic acid cycle fluxes measured by nuclear magnetic resonance analysis of a single glucose derivative. Anal Biochem 327: 149–155, 2004 [DOI] [PubMed] [Google Scholar]
- 34. Jin ES, Park BH, Sherry AD, Malloy CR. Role of excess glycogenolysis in fasting hyperglycemia among pre-diabetic and diabetic Zucker (fa/fa) rats. Diabetes 56: 777–785, 2007 [DOI] [PubMed] [Google Scholar]
- 35. Jones JG, Naidoo R, Sherry AD, Jeffrey FM, Cottam GL, Malloy CR. Measurement of gluconeogenesis and pyruvate recycling in the rat liver: a simple analysis of glucose and glutamate isotopomers during metabolism of [1,2,3-(13)C3]propionate. FEBS Lett 412: 131–137, 1997 [DOI] [PubMed] [Google Scholar]
- 36. Jones JG, Solomon MA, Cole SM, Sherry AD, Malloy CR. An integrated (2)H and (13)C NMR study of gluconeogenesis and TCA cycle flux in humans. Am J Physiol Endocrinol Metab 281: E848–E856, 2001 [DOI] [PubMed] [Google Scholar]
- 37. Jurimae J, Jurimae T. Plasma adiponectin concentration in healthy pre- and postmenopausal women: relationship with body composition, bone mineral, and metabolic variables. Am J Physiol Endocrinol Metab 293: E42–E47, 2007 [DOI] [PubMed] [Google Scholar]
- 38. Kaiyala KJ, Schwartz MW. Toward a more complete (and less controversial) understanding of energy expenditure and its role in obesity pathogenesis. Diabetes 60: 17–23, 2011 [DOI] [PMC free article] [PubMed] [Google Scholar]
- 39. Kienzle E. Blood sugar levels and renal sugar excretion after the intake of high carbohydrate diets in cats. J Nutr 124: 2563S–2567S, 1994 [DOI] [PubMed] [Google Scholar]
- 40. Kizer JR, Arnold AM, Strotmeyer ES, Ives DG, Cushman M, Ding J, Kritchevsky SB, Chaves PH, Hirsch CH, Newman AB. Change in circulating adiponectin in advanced old age: determinants and impact on physical function and mortality. The Cardiovascular Health Study All Stars Study. J Gerontol A Biol Sci Med Sci 65: 1208–1214, 2010 [DOI] [PMC free article] [PubMed] [Google Scholar]
- 41. Kley S, Hoenig M, Glushka J, Jin ES, Burgess SC, Waldron M, Jordan ET, Prestegard JH, Ferguson DC, Wu S, Olson DE. The impact of obesity, sex, and diet on hepatic glucose production in cats. Am J Physiol Regul Integr Comp Physiol 296: R936–R943, 2009 [DOI] [PMC free article] [PubMed] [Google Scholar]
- 42. Koh SJ, Hyun YJ, Choi SY, Chae JS, Kim JY, Park S, Ahn CM, Jang Y, Lee JH. Influence of age and visceral fat area on plasma adiponectin concentrations in women with normal glucose tolerance. Clin Chim Acta 389: 45–50, 2008 [DOI] [PubMed] [Google Scholar]
- 43. Kohrt WM, Kirwan JP, Staten MA, Bourey RE, King DS, Holloszy JO. Insulin resistance in aging is related to abdominal obesity. Diabetes 42: 273–281, 1993 [PubMed] [Google Scholar]
- 44. Kolaczynski JW, Nyce MR, Considine RV, Boden G, Nolan JJ, Henry R, Mudaliar SR, Olefsky J, Caro JF. Acute and chronic effects of insulin on leptin production in humans: Studies in vivo and in vitro. Diabetes 45: 699–701, 1996 [DOI] [PubMed] [Google Scholar]
- 45. Krssak M, Brehm A, Bernroider E, Anderwald C, Nowotny P, Dall Man C, Cobelli C, Cline GW, Shulman GI, Waldhausl W, Roden M. Alterations in postprandial hepatic glycogen metabolism in type 2 diabetes. Diabetes 53: 3048–3056, 2004 [DOI] [PubMed] [Google Scholar]
- 46. Landau BR, Wahren J, Chandramouli V, Schumann WC, Ekberg K, Kalhan SC. Contributions of gluconeogenesis to glucose production in the fasted state. J Clin Invest 98: 378–385, 1996 [DOI] [PMC free article] [PubMed] [Google Scholar]
- 47. Malmstrom R, Taskinen MR, Karonen SL, Yki-Jarvinen H. Insulin increases plasma leptin concentrations in normal subjects and patients with NIDDM. Diabetologia 39: 993–996, 1996 [DOI] [PubMed] [Google Scholar]
- 48. McEntegart MB, Awede B, Petrie MC, Sattar N, Dunn FG, MacFarlane NG, McMurray JJ. Increase in serum adiponectin concentration in patients with heart failure and cachexia: relationship with leptin, other cytokines, and B-type natriuretic peptide. Eur Heart J 28: 829–835, 2007 [DOI] [PubMed] [Google Scholar]
- 49. Merrill AL, Watt BK. Energy Value of Foods—Basis and derivation. Handbook No. 74, Washington, D.C.: U.S. Dept. Agric. Agric. 1955 [Google Scholar]
- 50. Muller C, Assimacopoulos-Jeannet F, Mosimann F, Schneiter P, Riou JP, Pachiaudi C, Felber JP, Jequier E, Jeanrenaud B, Tappy L. Endogenous glucose production, gluconeogenesis and liver glycogen concentration in obese non-diabetic patients. Diabetologia 40: 463–468, 1997 [DOI] [PubMed] [Google Scholar]
- 51. Narimiya M, Azhar S, Dolkas CB, Mondon CE, Sims C, Wright DW, Reaven GM. Insulin resistance in older rats. Am J Physiol Endocrinol Metab 246: E397–E404, 1984 [DOI] [PubMed] [Google Scholar]
- 52. Nilsson LH. Liver glycogen content in man in the absorptive state. Scand J Clin Lab Invest 32: 317–323, 1973 [DOI] [PubMed] [Google Scholar]
- 53. Ostlund RE, Jr, Yang JW, Klein S, Gingerich R. Relation between plasma leptin concentration and body fat, gender, diet, age, and metabolic covariates. J Clin Endocrinol Metab 81: 3909–3913, 1996 [DOI] [PubMed] [Google Scholar]
- 54. Petersen KF, Price T, Cline GW, Rothman DL, Shulman GI. Contribution of net hepatic glycogenolysis to glucose production during the early postprandial period. Am J Physiol Endocrinol Metab 270: E186–E191, 1996 [DOI] [PubMed] [Google Scholar]
- 55. Pineiro R, Iglesias MJ, Gallego R, Raghay K, Eiras S, Rubio J, Dieguez C, Gualillo O, Gonzalez-Juanatey JR, Lago F. Adiponectin is synthesized and secreted by human and murine cardiomyocytes. FEBS Lett 579: 5163–5169, 2005 [DOI] [PubMed] [Google Scholar]
- 56. Pischon T, Girman CJ, Hotamisligil GS, Rifai N, Hu FB, Rimm EB. Plasma adiponectin levels and risk of myocardial infarction in men. JAMA 291: 1730–1737, 2004 [DOI] [PubMed] [Google Scholar]
- 57. Poehls J, Wassel CL, Harris TB, Havel PJ, Swarbrick MM, Cummings SR, Newman AB, Satterfield S, Kanaya AM, Health Study ABC Association of adiponectin with mortality in older adults: the Health, Aging, and Body Composition Study. Diabetologia 52: 591–595, 2009 [DOI] [PMC free article] [PubMed] [Google Scholar]
- 58. Radziuk J, Lee WP. Measurement of gluconeogenesis and mass isotopomer analysis based on [U-(13)C]glucose. Am J Physiol Endocrinol Metab 277: E199–E207, 1999 [DOI] [PubMed] [Google Scholar]
- 59. Reid C. Insulin and the storage of liver glycogen in anesthetized cats. J Physiol 87: 121–128, 1936 [DOI] [PMC free article] [PubMed] [Google Scholar]
- 60. Roden M, Petersen KF, Shulman GI. Nuclear magnetic resonance studies of hepatic glucose metabolism in humans. Recent Prog Horm Res 56: 219–237, 2001 [DOI] [PubMed] [Google Scholar]
- 61. Rogers QR, Morris JG, Freedland RA. Lack of hepatic enzymatic adaptation to low and high levels of dietary protein in the adult cat. Enzyme 22: 348–356, 1977 [DOI] [PubMed] [Google Scholar]
- 62. Rothenbacher D, Brenner H, Marz W, Koenig W. Adiponectin, risk of coronary heart disease and correlations with cardiovascular risk markers. Eur Heart J 26: 1640–1646, 2005 [DOI] [PubMed] [Google Scholar]
- 63. Rothman DL, Magnusson I, Katz LD, Shulman RG, Shulman GI. Quantitation of hepatic glycogenolysis and gluconeogenesis in fasting humans with 13C NMR. Science 254: 573–576, 1991 [DOI] [PubMed] [Google Scholar]
- 64. Rowe JW, Minaker KL, Pallotta JA, Flier JS. Characterization of the insulin resistance of aging. J Clin Invest 71: 1581–1587, 1983 [DOI] [PMC free article] [PubMed] [Google Scholar]
- 65. Russell K, Lobley GE, Millward DJ. Whole-body protein turnover of a carnivore, Felis silvestris catus. Br J Nutr 89: 29–37, 2003 [DOI] [PubMed] [Google Scholar]
- 66. Russell K, Murgatroyd PR, Batt RM. Net protein oxidation is adapted to dietary protein intake in domestic cats (Felis silvestris catus). J Nutr 132: 456–460, 2002 [DOI] [PubMed] [Google Scholar]
- 67. Ryan AS, Berman DM, Nicklas BJ, Sinha M, Gingerich RL, Meneilly GS, Egan JM, Elahi D. Plasma adiponectin and leptin levels, body composition, and glucose utilization in adult women with wide ranges of age and obesity. Diabetes Care 26: 2383–2388, 2003 [DOI] [PubMed] [Google Scholar]
- 68. Ryan AS, Elahi D. The effects of acute hyperglycemia and hyperinsulinemia on plasma leptin levels: its relationships with body fat, visceral adiposity, and age in women. J Clin Endocrinol Metab 81: 4433–4438, 1996 [DOI] [PubMed] [Google Scholar]
- 69. Scarlett JM, Donoghue S. Associations between body condition and disease in cats. J Am Vet Med Assoc 212: 1725–1731, 1998 [PubMed] [Google Scholar]
- 70. Segal KR, Landt M, Klein S. Relationship between insulin sensitivity and plasma leptin concentration in lean and obese men. Diabetes 45: 988–991, 1996 [DOI] [PubMed] [Google Scholar]
- 71. Taylor R, Price TB, Katz LD, Shulman RG, Shulman GI. Direct measurement o changes in muscle glycogen concentration after a mixed meal in normal subjects. Am J Physiol Endocrinol Metab 265: E224–E229, 1993 [DOI] [PubMed] [Google Scholar]
- 72. Taylor R, Magnusson I, Rothman DL, Cline GW, Caumo A, Cobelli C, Shulman GI. Direct assessment of liver glycogen storage by 13C nuclear magnetic resonance spectroscopy and regulation of glucose homeostasis after a mixed meal in normal subjects. J Clin Invest 97: 126–132, 1996 [DOI] [PMC free article] [PubMed] [Google Scholar]
- 73. Van Berendoncks AM, Garnier A, Beckers P, Hoymans VY, Possemiers N, Fortin D, Martinet W, Van Hoof V, Vrints CJ, Ventura-Clapier R, Conraads VM. Functional adiponectin resistance at the level of the skeletal muscle in mild to moderate chronic heart failure. Circ Heart Fail 3: 185–194, 2010 [DOI] [PubMed] [Google Scholar]
- 74. Vidal H, Auboeuf D, De Vos P, Staels B, Riou JP, Auwerx J, Laville M. The expression of ob gene is not acutely regulated by insulin and fasting in human abdominal subcutaneous adipose tissue. J Clin Invest 98: 251–255, 1996 [DOI] [PMC free article] [PubMed] [Google Scholar]
- 75. Wilkins C, Long RC, Jr, Waldron M, Ferguson DC, Hoenig M. Assessment of the influence of fatty acids on indices of insulin sensitivity and myocellular lipid content by use of magnetic resonance spectroscopy in cats. Am J Vet Res 65: 1090–1099, 2004 [DOI] [PubMed] [Google Scholar]