

Abstract
We conducted, in persons with Parkinson's disease (PD), a thorough assessment of neuromotor function and performance in conjunction with phenotypic analyses of skeletal muscle tissue, and further tested the adaptability of PD muscle to high-intensity exercise training. Fifteen participants with PD (Hoehn and Yahr stage 2–3) completed 16 wk of high-intensity exercise training designed to simultaneously challenge strength, power, endurance, balance, and mobility function. Skeletal muscle adaptations (P < 0.05) to exercise training in PD included myofiber hypertrophy (type I: +14%, type II: +36%), shift to less fatigable myofiber type profile, and increased mitochondrial complex activity in both subsarcolemmal and intermyofibrillar fractions (I: +45–56%, IV: +39–54%). These adaptations were accompanied by a host of functional and clinical improvements (P < 0.05): total body strength (+30–56%); leg power (+42%); single leg balance (+34%); sit-to-stand motor unit activation requirement (−30%); 6-min walk (+43 m), Parkinson's Disease Quality of Life Scale (PDQ-39, −7.8pts); Unified Parkinson's Disease Rating Scale (UPDRS) total (−5.7 pts) and motor (−2.7 pts); and fatigue severity (−17%). Additionally, PD subjects in the pretraining state were compared with a group of matched, non-PD controls (CON; did not exercise). A combined assessment of muscle tissue phenotype and neuromuscular function revealed a higher distribution and larger cross-sectional area of type I myofibers and greater type II myofiber size heterogeneity in PD vs. CON (P < 0.05). In conclusion, persons with moderately advanced PD adapt to high-intensity exercise training with favorable changes in skeletal muscle at the cellular and subcellular levels that are associated with improvements in motor function, physical capacity, and fatigue perception.
Keywords: Parkinson's disease, high-intensity exercise, resistance training, muscle hypertrophy, mitochondria
parkinson's disease (PD) is a debilitating, neurodegenerative disease that manifests as disrupted motor behavior (bradykinesia, tremor, postural instability, rigidity), which dramatically impacts mobility function and life quality. Weakness, low muscle power, and fatigability are common findings in PD (28, 73). In fact, many with the disease suffer disabling, dopa-resistant fatigue (39), and those with severe fatigue are more sedentary and have lower functional capacity (31). Because risk increases with age (96% diagnosed >age 50), PD progresses concurrent with the obligatory losses of muscle mass and function consequent to aging that likely compound the deleterious effects of the primary disease. In apparently healthy older adults, we (43, 57) and others (15, 61) have documented aging-related muscle atrophy, weakness, low muscle power, and fatigability and have demonstrated robust improvements in muscle mass and function in response to high-intensity resistance exercise training (RT) (9, 16, 44, 56, 76). It is therefore not surprising that RT and other forms of exercise training have gained recent attention in PD research (3, 4, 19, 58, 79).
RT as well as endurance training (ET) each appear to benefit PD patients much like the general population, but PD-specific benefits are also emerging (28, 32). For example, in addition to improving muscle strength among persons with PD, RT appears to improve neuromuscular function, bradykinesia, and postural instability [reviewed in (20)]. Likewise, ET has been shown to improve cardiorespiratory capacity (71) and endurance (13, 14), as expected, but also enhances the efficacy of levodopa (52) and improves gait disturbances (4) and corticomotor excitability (4). Further, there is some evidence that RT and ET each improve quality of life (4, 20) and motor scores on the Unified Parkinson's Disease Rating Scale (UPDRS) (13, 14, 28), and combined RT and ET improves executive function (19, 74).
A notable omission from exercise training research in PD is the study of cellular changes in skeletal myofibers that likely contribute to functional deficits and play putative roles in exercise training-induced functional and metabolic improvements. In fact, studies of skeletal muscle tissue in general are quite sparse in PD. The current literature is devoid of a histological assessment of myofiber type distribution and myofiber size in PD, and whether the myofiber phenotype in individuals with PD adapts as expected to specific doses of exercise training. Further, while a few studies of muscle tissue in human PD suggest muscle mitochondrial dysfunction relative to age-matched healthy controls [deficiencies in mitochondrial complexes I, IV (11, 78)], whether muscle mitochondrial abnormalities in PD are associated with impairments in muscle function, exercise tolerance, or exercise training adaptations has yet to be investigated. Given the profound effects of PD on neuromotor function and fatigue, a better understanding of how PD affects limb skeletal muscle, and whether exercise adaptations progress normally, would fill a major knowledge gap in the field.
We therefore tested the adaptability of PD muscle to high-intensity exercise training. Furthermore, we tested and compared neuromotor function and muscle performance in conjunction with phenotypic analyses of skeletal muscle tissue in patients with PD compared with non-PD matched controls. The signature skeletal muscle adaptation to traditional RT is myofiber hypertrophy, while the signature muscle adaptation to ET is increased mitochondrial oxidative capacity. The former is associated with improved strength and power, while the latter reduces fatigability and improves metabolic function/fuel utilization. Both cellular adaptations (and associated functional corollaries) would be of great benefit to individuals with PD based on well-recognized weakness, low muscle power, and fatigability (20, 31). However, because divergent cell signaling mechanisms (5, 17) and transcriptional programs (64) are thought to drive RT-induced myofiber hypertrophy vs. ET-induced mitochondrial biogenesis/quality, compatibility at the myofiber level of combining traditional RT and ET has been the subject of debate. The typical approach to combined training involves bouts in series of traditional RT and moderate intensity, continuous ET. Rather than this approach, here we implemented a novel exercise prescription for PD that combined RT with brief intervals of functional, weight-bearing exercises (in lieu of rest periods) between sets of RT exercises to maintain a higher overall exercise intensity (as measured by heart rate). We tested the hypotheses that 1) this novel exercise prescription—which simultaneously challenges strength, power, balance, and endurance—would induce desired cellular improvements in skeletal muscle (myofiber hypertrophy and enhanced mitochondrial function) in parallel with a number of functional gains that would enhance physical capacity and well-being, and 2) comparisons to non-PD, age-matched healthy controls would reveal unique characteristics of the PD phenotype in muscle tissue and function.
METHODS
Human subjects.
Fifteen PD patients were recruited from the Birmingham, Alabama, metropolitan area via the Movement Disorders Clinic in the UAB Department of Neurology. Patients were diagnosed using the UK Brain Bank criteria (37). Eligible subjects were Hoehn and Yahr stage 2/3, 45–80 years of age, independent in the community, and medication stable for at least 4 wk. Subjects passed a physical exam performed by a neurologist and diagnostic graded, maximum exercise stress test with 12 lead ECG on a stationary cycle ergometer. Individuals were excluded for prescription anticoagulant therapy; lidocaine allergy; secondary parkinsonism or parkinson-plus syndromes; regular participation in an exercise program within the last 6 mo; participation in drug studies or the use of investigational drugs within 30 d prior to screening; acute illness or active infection; confounding medical, neurological, or musculoskeletal conditions; alcoholism or other drug addiction; or any known contraindication to exercise training or testing. The study was approved by the UAB Institutional Review Board. Each subject gave written, informed consent before participation. PD subjects were matched to non-PD, untrained controls (CON) on the basis of gender, age, body mass index (BMI), and exercise training history (i.e., untrained). CON data were derived from our de-identified tissue and data bank. In addition to assessing the effects of exercise training, PD were compared with CON on all outcomes that were commonly measured in both groups using identical tests.
Medication profiles.
A comprehensive medication history was collected during screening. All exercise testing and clinical evaluations were performed “on” medication. Participants were encouraged to maintain their usual physical activity and medication schedules throughout the trial. Specific antiparkinsonian medications and dosages varied widely among participants; thus using the conversion factors of Tomlinson et al. (75) we computed the levodopa (L-dopa) equivalent medication dosage (LED) for each participant to better standardize the data for a group summary. Among the 13 of 15 participants reporting antiparkinsonian medication usage, LED was 513 ± 105 mg/d (range 100–1,165 mg/d). An array of other prescription medications was consumed by various participants: anti-hypertensives (n = 7), statins (n = 5), other lipid lowering drugs (n = 1), sleep aids (n = 3), cyclooxygenase (COX) inhibitors/NSAIDs (n = 2), thyroxine (n = 2), antidepressants (n = 2), and bisphosphonates (n = 2). Among anti-hypertensive drugs used, four participants were taking β-blockers which reduce heart rate (HR) and contractility (one of the four was concurrently using a calcium channel blocker), rendering inadequate the maximum HR estimates based only on age (e.g., 220-age). It was therefore important to gauge exercise intensity [% heart rate reserve (HRR)] based on actual peak exercise HR (on β-blocker), which we determined prior to training via the graded, maximal cycle exercise test. Daily statin dosage was 40 mg/d for four participants and 80 mg/d for one subject. Three consumed a lipophilic (atorvastatin) and two a hydrophilic (pravastatin) statin, and 3 of 5 consumed an over-the-counter coenzyme Q10 supplement. Among statin users, no distinct effects on exercise tolerance or muscle pain were noted; however, three of five reported undue fatigue during the hours following exercise training. Common, nonprescription drug/supplement usage included aspirin (n = 9), multivitamin (n = 8), and vitamin D (n = 6).
Exercise training program.
The novel, high-intensity exercise prescription simultaneously challenged strength, power, endurance, balance, and mobility function. Participants completed 16 wk of high-intensity exercise training 3 d/wk, one-on-one with an experienced trainer in the UAB Center for Exercise Medicine's Clinical Exercise Facility. Before each session, seated resting blood pressure and HR were determined. Subjects then warmed up on a cycle ergometer or treadmill for 5 min and were outfitted with a Polar HR monitor. The core prescription for strength and power development consisted of progressive RT for the major muscle groups with five exercises (leg press, knee extension, chest press, overhead press, lat pull down), each for three sets × 8–12 repetitions to volitional fatigue. Initially, RT training loads were based on ∼70% of baseline one-repetition maximum (1RM) strength. Progression was incorporated as previously described (6, 44); briefly, resistance loads were increased when a subject completed 12 repetitions for two of three sets at a given resistance while maintaining proper form. Subjects also completed three sets of abdominal crunches each session. To simultaneously target endurance, balance, and mobility function, we prescribed additional exercises between sets of RT (in lieu of typical rest periods) to maintain heart rate above 50% HRR (42) throughout each session, as verified by continuous heart rate monitoring. Between RT sets, subjects performed one to two body weight exercises (e.g., squat, push-up, step-up, lunge, side lunge, modified dip) for 45–60 s, or a 60 s interval on a treadmill or stationary cycle. Short breaks for water or rest during exercise transitions were confined to nonexercise time spent above 50% HRR; therefore, once a subject's heart rate dropped near 50% HRR, exercise resumed. Exercise sessions averaged 35–45 min. Intersubject variability in exercise session time was based on individual differences in HR responses, perceived fatigue, and degree of bradykinesia.
Clinical assessments.
Before and after the 16-wk training program, subjects completed a battery of clinical questionnaires and assessments including the 39-item Parkinson's Disease Quality of Life Scale (PDQ-39), UPDRS, Fatigue Severity Scale (FSS), Pittsburgh Sleep Quality Index (PSQI), Beck's Depression Inventory-II (BDI-II), Freezing of Gait (FOG), single leg balance test, and 6-min walk test (6MWT). For the single leg balance test, maximum time to stand balancing on each leg (up to 20 s max) was determined with two trials per leg. The leg with the lower maximum time before training was then reevaluated posttraining. Within each subject, all pre- and posttraining assessments were conducted by the same trained member of the research team. Comparisons with CON were not possible for these tests.
Body composition and muscle mass.
Total body lean mass, limb (bilateral arm + leg) muscle mass, thigh muscle mass, and body fat percentage were assessed pre- and posttraining by dual energy X-ray absorptiometry (DXA) (Lunar iDXA, GE Healthcare) according to manufacturer's instructions and our routine methods (9, 43). The skeletal muscle index (SMI) (8, 77) was calculated [limb muscle mass (kg)/ht (m)2]. Results in PD were compared with CON.
Maximum voluntary strength.
Dynamic and isometric strength were assessed pre-, mid- (8 wk), and posttraining using established methods (44, 56, 57). Bilateral, dynamic strength was determined via 1RM leg press, knee extension, chest press, and overhead press. 1RM was expressed in kg and defined as the highest load lifted through a full range of motion prior to two failed attempts. 1RM testing was administered by a certified trainer who ensured a standardized range of motion within each subject over the course of training and testing. Unilateral knee extension isometric maximum voluntary contraction (MVC) strength was assessed on the most affected leg at ∼90° of knee flexion via a calibrated load cell attached to a fixed knee extension bench/chair. CON subjects were tested for 1RM using identical methods; thus PD vs. CON comparisons were made.
Maximum leg power.
Bilateral knee extension power was determined pre-, mid- (8 wk), and posttraining using a modified version of our previous protocol (57). Peak concentric power was determined at two different external resistance loads on a traditional knee extension weight stack machine: one relative load equal to 45% of that day's knee extension 1RM and one absolute load equal to 60% of pretraining knee extension 1RM. Subjects completed three full repetitions; the concentric phase was performed as rapidly as possible, while the eccentric phase was mitigated by a custom-built hydraulic braking system (hydraulic cylinder attached to the cable of the weight stack). Knee angle was recorded at 500 Hz by electrogoniometry (Model SG150, Biometrics, Gwent, UK), and velocity was determined across the change in knee angle from 50° up to 20° of knee flexion. Direct PD vs. CON comparisons were made.
Relative motor unit activation.
Using surface electromyography (EMG), we determined the magnitude of quadriceps neural activation (relative to maximum) required during a three-repetition sit-to-stand task pre-, mid- (8 wk), and posttraining as we previously described (56, 57). Ascent and descent were each completed in 2 s and standardized using an audiovisual metronome. Results were normalized to maximum RMS-EMG (during MVC) to yield indices of relative motor unit activation (MUA). Sit-to-stand EMG data were analyzed at the knee angle equivalent to the knee angle during isometric MVC (∼60° below horizontal). Higher values indicate a greater MUA requirement or more “difficulty.” Raw EMG recordings (for both the three-repetition sit-to-stand and knee extension MVC) from each of the three superficial quadriceps muscles (vastus medialis, vastus lateralis, and rectus femoris) were full-wave rectified, converted to root mean square (RMS) using a 100 ms sliding window, and averaged. Direct PD vs. CON comparisons were made.
Neuromuscular fatigability.
We evaluated neuromuscular fatigability with three tests pre-, mid- (8 wk), and posttraining. Two tests were dynamic and voluntary, based on peak power, and modified versions of tests we described previously (57): 1) 20-repetition maximum speed sit-to-stand (without jumping) and 2) 20-repetition bilateral knee extension against external resistance equal to 45% 1RM—encouraging maximum concentric velocity during each repetition (eccentric loading mitigated by a hydraulic braking system). In both tests, magnitude of fatigue was defined by the magnitude of decline in power from peak (repetitions 1–5) to final (repetitions 19–20). Power was determined as movement velocity (via knee electrogoniometry) × external resistance force (57). Resistance force in the sit-to-stand test was body weight.
The third fatigue test was isometric, electrically elicited, and unilateral (leg with most PD symptoms as determined pretraining). The quadriceps femoris muscle group was studied during a series of 90 contractions elicited by neuromuscular electrical stimulation (NMES), essentially as described previously (10). Briefly, subjects were secured in a custom-built chair with hip and knee at ∼90° flexion. The leg was firmly secured to a rigid lever arm to ensure that the quadriceps would perform only isometric contractions. The moment arm was established via a calibrated load cell parallel to the line of pull and perpendicular to the lever arm. Load cell (torque) data were collected at 1,000 Hz. After warm-up contractions, MVC torque was assessed (three trials) and the intensity of stimulation to elicit ∼25% MVC force was determined using a 50 Hz/600 μsec pulse train × 1 s duration (Grass Model SIU8T stimulus isolation unit, Grass Technologies, West Warwick, RI) via bipolar electrodes (7 × 10 cm) over the distomedial and proximolateral quadriceps (10). The protocol then consisted of 1-s contraction/1-s rest cycles for 90 total contractions as done previously (33). Comparable data were not available for CON.
Muscle biopsy and tissue preparation.
Muscle tissue specimens were collected from vastus lateralis of the most affected leg at baseline and again from the same muscle after training. Samples were collected by percutaneous needle biopsy under local anesthesia (1% lidocaine) with a 5-mm Bergstrom-type biopsy needle using established procedures (7, 44, 51, 55) in the Clinical Research Unit of the UAB Center for Clinical and Translational Science. All visible connective and adipose tissues were removed from the biopsy samples with the aid of a dissecting microscope. Portions used for immunohistochemistry were mounted cross-sectionally on cork in optimum cutting temperature mounting medium mixed with tragacanth gum, frozen in liquid nitrogen-cooled isopentane, and stored at −80°C. Portions used for mitochondrial assays were snap frozen in liquid nitrogen. Muscle tissue yield from one PD subject was not sufficient; thus n = 14 for tissue results in PD. For all assays, PD were compared with CON.
Muscle histology.
All pretraining and posttraining histological assays within subjects were performed together by the same technician, and all image analyses were conducted in blinded fashion. Myofiber type distribution (I, IIa, IIx) and type-specific myofiber size were assessed via myosin heavy chain isoform immunofluorescence microscopy as described (43, 44). Within subjects, myofiber size heterogeneity within each fiber type was expressed as coefficient of variation (CV%). Among PD, myofiber type distribution was determined from 1,448 ± 138 myofibers per sample at baseline and from 1,149 ± 98 myofibers posttraining. Similarly, myofiber type distribution among CON was determined from 1,609 ± 224 myofibers. We also assessed the degree of fibrosis between myofibers and fascicles using a lectin [wheat germ agglutinin (WGA) conjugated to Texas Red; Invitrogen W21405]. Texas Red WGA binds to sialic acid and N-acetylglucosaminyl residues and therefore reveals primarily collagen content in the extracellular matrix. For this assay, muscle tissue sectioning, staining, and imaging were performed in much the same way as previously described for myofiber typing and sizing (43, 44). Briefly, 6-μm sections were fixed for 20 min at room temperature in 3% neutral-buffered formalin, washed 3 × 5 min in 1X PBS, incubated in Texas Red WGA (1:50 in 1X PBS) for 1 h at room temperature, washed again (3 × 5 min in 1X PBS), mounted, and stored protected from light at −20°C. A grid of 10 × pictures encompassing the entire sample was analyzed for the percentage positive for WGA.
Muscle mitochondrial preparations.
Subsarcolemmal (SS) and intermyofibrillar (IMF) fractions of skeletal muscle mitochondria were isolated following a modification of Rasmussen et al. (60). Frozen samples were pulverized and put into a 20:1 (volume/weight) solution of ice-cold Chappell-Perry (C/P) isolation buffer [100 mM KCl, 50 mM Tris-HCl, 1 mM Na-ATP, 5 mM MgSO4, 0.1 mM EGTA, 0.2% BSA, pH 7.4] + protease inhibitor cocktail (Roche, mini-complete). Samples were maintained at 0–1°C while homogenized at 990 rpm using a customized Wheaton mortar and pestle.
SS MITOCHONDRIA ISOLATION.
Homogenate was centrifuged at 600 g (10 min, 4°C). The supernatant was then transferred to a separate ice-cold tube to be further centrifuged at 10,000 g (10 min, 4°C) yielding a mitochondrial pellet. In an effort to maximize SS mitochondrial quantity, the pellet from the 600 g centrifugation was rehomogenized with the supernatant from the 10,000 g centrifugation and subjected to another round of 600 g/10,000 g centrifugations as described above. The SS mitochondrial enriched pellets obtained from both rounds of homogenization were combined and resuspended with 60 μl CP+PIC and used immediately or stored at −80°C.
IMF MITOCHONDRIA ISOLATION.
All remaining supernatant from SS isolation was combined with the remaining 600 g pellet. To release the IMF fraction a protease (Protease XXIV, Sigma) was added to the mixture, and the sample was rehomogenized a third and final time. The IMF mitochondrial enriched pellet was resuspended with 60 μl CP+PIC and used immediately or stored at −80°C.
Measurement of respiratory complex activities.
Complex I activity was immediately measured on a DU800 spectrophotometer using 2,6-dichloroindophenol (DCIP) as the terminal electron acceptor at 600 nm with the oxidation of NADH reducing artificial substrates Coenzyme Q10 that then reduces DCIP. The reduction of DCIP is mostly dependent on complex I activity and has a very high rotenone-sensitive activity (41). Complex IV activity was measured by the oxidation of cytochrome c at 550 nm (16). Data are represented as the pseudo first order rate constant (k) divided by protein concentration. Citrate synthase was measured using the coupled reaction with oxaloacetate, acetyl-CoA, and 5,5-dithiobis-(2,4-nitrobenzoic acid) (68). Citrate synthase was used as a surrogate index of mitochondrial volume (36, 46).
Statistical analysis.
All statistical analyses were performed using STATISTICA v10 (StatSoft, Tulsa, OK). For dependent variables assayed at only two time points in PD [i.e., pretraining (week 0) and posttraining (week 16)], differences were tested by paired t-tests. For dependent variables assayed at all three time points (week 0, 8, 16) in PD, changes across time were tested by repeated measures ANOVA. Where appropriate, post hoc comparisons were conducted using Fisher's LSD tests. Group differences between PD (pretraining) and CON were tested by independent t-tests. Results are reported as means ± SE, except for subject characteristics which are reported as means ± SD. Significance was accepted at P < 0.05.
RESULTS
Descriptive characteristics.
Descriptive characteristics are shown in Table 1. PD and CON were well matched, as indicated by the age and body fat percentage results of the 12 men and 3 women in CON matched to PD. Further, there were no differences between PD (pretraining) and CON for total lean mass, thigh muscle mass, or skeletal muscle index. The targeted recruitment of PD patients rated as Hoehn and Yahr stages 2 or 3 resulted in ten stage 2 and five stage 3 patients at the time of enrollment. The 16-wk exercise training intervention led to a reduction in body fat percentage and gains in muscle mass (P < 0.05).
Table 1.
Descriptive characteristics and effects of exercise training on body composition and muscle mass
| Parkinson's Disease |
|||
|---|---|---|---|
| Control | Pretraining | Posttraining | |
| Age | 65.3 ± 6.0 | 66.5 ± 6.0 | — |
| Gender | 12M, 3F | 12M, 3F | — |
| Hoehn and Yahr stage | — | Stage 2 (n = 10) | — |
| Stage 3 (n = 5) | |||
| Years since PD diagnosis | — | 4.4 (range 1–16) | — |
| Body fat, % | 32.1 ± 5.5 | 32.2 ± 5.5 | 30.8 ± 5.5* |
| Thigh muscle mass, kg | 11.1 ± 2.4 | 11.9 ± 3.0 | 12.4 ± 3.3* |
| Skeletal muscle index, kg·m−2 | 7.41 ± 1.46 | 7.55 ± 1.41 | 7.73 ± 1.49# |
Skeletal muscle index [arm + leg muscle mass (kg)/height (m2)]; PD, Parkinson's disease. Clinical staging of PD disease progression defined by Hoehn and Yahr staging, with 1 as mild and 5 as most severe.
Different from pretraining, P < 0.05;
Trend toward difference from pretraining, P = 0.055. Values are means ± SD.
Exercise training intensity and adherence.
Overall exercise intensity throughout each bout averaged 60.2 ± 2.4% HRR across all participants and all training sessions, indicating that as physical capacity progressively improved, relative training intensity was maintained across the 16 wk. After the first week of ramping to full volume, intensity equaled 60.4 ± 3.0% HRR during weeks 2–3 (sessions 4–9); 60.0 ± 2.8% HRR during weeks 8–9; and 58.9 ± 3.6% HRR during weeks 15–16. Training progression was emphasized and incorporated throughout the program as individuals gained strength, power, and overall exercise tolerance. Adherence to the prescription averaged 95% (46/48 exercise sessions) and all but one subject (39/48) completed at least 44/48 sessions.
Skeletal muscle histology.
As shown in Fig. 1, exercise training-induced hypertrophy of both type I (Fig. 1A) and type II (Fig. 1B) myofibers, with the magnitude preferential to type II fibers as expected (9, 44). High-intensity training resulted in the IIx-to-IIa shift in myofiber type distribution among PD (Fig. 1C) that we consistently find in healthy adults (6, 9). This was coupled with an unexpected reduction in type I distribution after training (P < 0.05). Prior to exercise training the PD participants had larger type I myofibers and a higher distribution of type I fibers relative to CON (P < 0.05). We also found greater heterogeneity in PD vs. CON for both type IIa (CV% 27.9 ± 2.0 vs. 33.9 ± 1.9) and IIx (CV% 26.8 ± 3.0 vs. 37.0 ± 1.8) fibers (P < 0.05). Among PD, training reduced type IIa CV% to a value (30.9 ± 2.2), not different from CON. We found no difference in the degree of fibrosis between untrained PD vs. CON (fibrotic index 17% vs. 18%); however, after training there was a trend (P = 0.055) toward reduced fibrotic index (14%) in PD muscle.
Fig. 1.
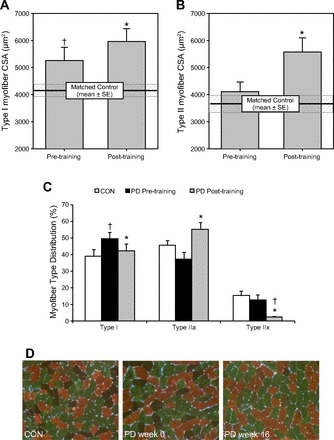
Skeletal myofiber morphometry. Effects of Parkinson's disease (PD) and high-intensity exercise training on type I (A) and type II (B) skeletal myofiber size, and the relative distribution of myofibers by type (I, IIa, IIx) (C). Representative immunohistological images are shown in D (type I, copper; type IIa, green; type IIx, dark/negative). CSA, cross-sectional area; PD, Parkinson's disease; CON, non-PD, untrained, matched controls. *Different from pretraining, P < 0.05. †Different from control, P < 0.05. Values are means + SE.
Muscle mitochondrial complex activities.
As summarized in Fig. 2, we found no significant differences between untrained PD and CON in muscle mitochondrial function in either subfraction (IMF or SS). Although the means suggest PD deficits in SS complex I (Fig. 2B) and complex IV (Fig. 2D) activities, significance was not detected (P = 0.15–0.34). With exercise training; however, robust improvements (P < 0.05) in mitochondrial complex activities were found in PD: complex I IMF (45%) and SS (56%) (Fig. 2, A and B), complex IV IMF (39%), and SS (54%) (Fig. 2, C and D). Citrate synthase (CS) activity—used as a surrogate biomarker of total mitochondrial volume—was not different between untrained PD and CON in either fraction and did not change with training in PD.
Fig. 2.

Skeletal muscle mitochondrial function. Effects of Parkinson's disease (PD) and high-intensity exercise training on the activities of skeletal muscle mitochondrial complex I (A and B) and complex IV (C and D) in intermyofibrillar (IMF) (A and C) and subsarcolemmal (SS) (B and D) fractions of mitochondria. *Different from pretraining, P < 0.05. Values are means + SE.
Neuromuscular performance.
Assessments of strength, power, and fatigability are summarized in Fig. 3. Strength levels improved substantially after 8 and 16 wk of training (P < 0.05). Knee extension 1RM strength increased 46% by week 8 and 56% by week 16 (Fig. 3A). 1RM strength gains in other movements ranged 29–44% (not shown). Knee extension MVC strength also increased (P < 0.05) by week 8 (16%) and week 16 (27%) (not shown). Knee extension power also improved substantially with training. When working against a resistance load equivalent to 45% of current 1RM, power increased 33% by week 8 and 42% by week 16 (P < 0.05) (Fig. 3B). The second test of power, using the same absolute resistance load throughout the 16 weeks (equal to 60% of pretraining 1RM), is entirely dependent on movement velocity. By week 16, we noted a 16% increase, indicating the subjects were able to contract faster to lift the same resistance (P < 0.05). Using DXA-determined thigh muscle mass (TMM) as we have done previously (43, 56), specific strength (leg press 1RM strength/TMM) improved 39% by week 16 (P < 0.05, Fig. 3C). This is consistent with our prior findings in older adults (9, 56).
Fig. 3.

Neuromuscular performance. Effects of Parkinson's disease (PD) and high-intensity exercise training on one-repetition maximum (1RM) knee extension strength (A); peak knee extension power working against a resistance equal to 45% of current 1RM (B); specific strength (leg press 1RM/kg thigh lean mass) (C); motor unit activation (relative to maximum) during the concentric phase of standing from a seated position (D); fatigability during a 20-repetition maximum speed sit-to-stand test (E); and fatigability during electrically elicited isometric contractions (90 repeat 1 s contractions)(F). *Different from week 0, P < 0.05. #Different from week 8, P < 0.05. “f” indicates significant fatigue (final power during repetitions 19–20 different from peak power during repetitions 1–5), P < 0.05. Values are means ± SE.
Leg strength, specific strength, and power did not differ between pretraining PD and control, suggesting a relatively normal aging course for these outcomes in PD. On the other hand, the quadriceps MUA test indicated substantially greater sit-to-stand “difficulty” in PD, requiring nearly 90% of maximal MUA to stand from a bench prior to training compared with less than 60% in CON (Fig. 3D). By week 16, relative MUA dropped to 59% (P < 0.05), no longer different from CON (Fig. 3D).
All three tests of neuromuscular fatigue induced significant fatigue in PD at all three time points (week 0, 8, and 16) (P < 0.05). Rate of knee extension fatigue as determined by the decline in power across 20 repetitions averaged 15% at all three time points (Fig. 3E). However, initial (peak) and final knee extension power across the 20 repetitions improved in stepwise fashion across the 16 weeks of training; for example, by week 16, power production in the final, fatigued state far exceeded peak power pretraining (week 0). Rate of fatigue during the 20-repetition sit-to-stand averaged 40%, 18%, and 25% at week 0, 8, and 16, respectively (not shown). Although not statistically significant (P = 0.077), a trend toward improvement in rate of fatigue over the course of exercise training is suggested. Results of the electrically elicited knee extensor fatigue test are shown in Fig. 3F. These data are characteristic of this particular fatigue test—showing a rapid rate of fatigue during the first 20–25 contractions, followed by a subtle decline in torque thereafter. At week 0, 8, and 16, torque dropped to 50% of initial within the first 14–16 contractions. While the shape of the curve did not change with training, the upward shifts at week 8 and 16 indicate a greater torque generating capacity at any given point in the series of 90 repeat contractions. In fact, after 8 and 16 wk of exercise training, the number of contractions to reach 50% of the week 0 initial torque (12.8 Nm) was protracted to 19 contractions by week 8, and to 25 contractions by week 16.
Clinical outcomes.
Results for the battery of clinical assessments are summarized in Table 2. Pre- and posttraining results are provided for n = 15 on all measures except UPDRS (n = 13). Data from two subjects were excluded from UPDRS analysis because antiparkinsonian drug and/or dietary intakes during the hours prior to assessment were not consistent across the two testing time points (week 0 and week 16). With training, there was an improvement in the overall PDQ-39 index, and separation of PDQ-39 subscores revealed statistical improvements in activities of daily living (ADL) difficulty, emotional well-being, and cognitive impairment scores (P < 0.05). The number of participants who improved PDQ-39 scores beyond the minimal clinically important difference (CID) scores defined by Peto et al. (54) was overall PDQ-39 index, n = 11; mobility, n = 5; ADL difficulty, n = 10; emotional well-being, n = 11; stigma, n = 5; social support, n = 0; cognitive impairment, n = 11; communication, n = 4; and bodily discomfort, n = 5. Overall improvements in UPDRS Sections I (mentation, behavior, and mood) and III (motor) were noted, along with a 6-point reduction in the total UPDRS score after training (P < 0.05) (n = 13). According to the CID scores for UPDRS reported by Shulman et al. (70), n = 6 exceeded the minimal and moderate CID scores for section III motor and, for total UPDRS score, the numbers of subjects improving beyond the minimal, moderate, and large CIDs were n = 6, n = 5, and n = 3, respectively.
Table 2.
Effects of exercise training on clinical outcomes
| Pretraining | Posttraining | P Value | |
|---|---|---|---|
| PDQ-39 mobility subscore | 21.8 ± 5.0 | 16.7 ± 3.6 | 0.22 |
| PDQ-39 ADL subscore | 23.1 ± 3.3 | 15.6 ± 2.2* | 0.011 |
| PDQ-39 emotional well-being subscore | 25.8 ± 4.5 | 17.8 ± 4.5* | 0.011 |
| PDQ-39 stigma subscore | 23.3 ± 5.5 | 20.0 ± 4.3 | 0.31 |
| PDQ-39 social support subscore | 13.9 ± 2.7 | 14.4 ± 3.2 | 0.67 |
| PDQ-39 cognitive impairment subscore | 31.3 ± 5.4 | 25.0 ± 4.6* | 0.013 |
| PDQ-39 communication subscore | 27.2 ± 5.8 | 25.5 ± 4.5 | 0.70 |
| PDQ-39 bodily discomfort subscore | 28.8 ± 5.3 | 26.1 ± 4.6 | 0.465 |
| PDQ-39 index score | 37.6 ± 5.8 | 29.8 ± 4.8* | 0.05 |
| UPDRS Section I (mentation, behavior, mood) | 11.4 ± 1.7 | 8.8 ± 1.5* | 0.042 |
| UPDRS Section II (ADLs) | 11.7 ± 1.5 | 11.9 ± 1.3 | 0.80 |
| UPDRS Section III (motor) | 35.8 ± 2.9 | 33.1 ± 3.0** | 0.028 |
| UPDRS Section IV (dyskinesias) | 2.4 ± 0.7 | 1.8 ± 0.7 | 0.51 |
| UPDRS total score | 61.2 ± 4.0 | 55.5 ± 3.5** | 0.035 |
| PSQI total score | 5.8 ± 1.0 | 5.7 ± 1.0 | 0.90 |
| BDI-II total score | 10.7 ± 1.9 | 11.4 ± 1.7 | 0.73 |
| FOG total score | 5.4 ± 1.0 | 5.0 ± 0.8 | 0.56 |
| Single leg balance test, sa | 7.3 ± 1.6 | 9.8 ± 1.9* | 0.007 |
| Fatigue severity scale | 4.2 ± 0.4 | 3.5 ± 0.4* | 0.027 |
| Six-minute walk test, m | 466.5 ± 31.3 | 509.6 ± 30.3* | 0.022 |
PDQ-39, 39-item Parkinson's Disease Quality of Life Scale; ADL, activities of daily living; UPDRS, Unified Parkinson's Disease Rating Scale, PSQI, Pittsburgh Sleep Quality Index (PSQI); BDI-II, Beck's Depression Inventory-II; FOG, Freezing of Gait. n = 13 for UPDRS and n = 15 for all other measures.
Most affected leg pretraining and that same leg reassessed posttraining.
Different from pretraining, P < 0.05.
Lower than pretraining (one-tailed test). Values are means ± SE.
These improvements were coupled with improved balance (P < 0.05) and a self-reported reduction in fatigue (P < 0.05) via FSS from a score above the clinical threshold for “significant fatigue” (≥4) to a posttraining score below this threshold. Participants also increased the distance covered during the 6-min walk test by 43 meters, indicating improvements in neuromotor control and/or cardiorespiratory fitness. Considering the low initial, pretraining values, it is not surprising that exercise training had no effect on BDI, FOG, or PSQI scores. For example, only 2 of 15 participants were clinically depressed (BDI > 17) at enrollment, and one of these improved with training (BDI 23 to 10).
DISCUSSION
A number of key findings are noteworthy. First, the novel exercise prescription induced signature skeletal muscle adaptations to both traditional RT (myofiber hypertrophy) and traditional ET (increased mitochondrial oxidative capacity). Second, these muscle tissue adaptations were accompanied by a host of favorable, functional adaptations and clinical outcomes in PD. Lastly, a combined assessment of muscle tissue phenotype and neuromuscular function revealed several similarities and differences between older persons with PD and age-matched CON subjects. Here we discuss each of these key findings.
Individuals with PD were capable of exercise training at an intensity, volume, and frequency sufficient to achieve robust adaptations in skeletal muscle. Preferential hypertrophy of type II myofibers is a hallmark adaptation to RT (9) and, consequently, RT is considered an ideal intervention to counteract the type II atrophy of aging (38) by promoting “regrowth.” Aging-related type II atrophy was evident in both PD and CON—both showing particularly small type IIx myofibers which is common in aging (43, 44). Substantial type II and modest type I hypertrophy was indeed noted here in PD after 16 wk of training, and it is noteworthy that the magnitude of myofiber hypertrophy was comparable to our prior findings in young and old after 16 wk of progressive RT (9). Hypertrophy was coupled with marked gains in strength and power. Others have found significant strength gains in persons with PD in response to traditional, short-term RT (8–10 wk) (35, 67) and unconventional eccentric cycling (22, 23). A recent 2-yr, randomized RT clinical trial in PD showed limited strength improvement; however, the exercise prescription appeared to involve relatively low-intensity contractions (i.e., repetitions lasting 6–9 s), and strength testing (i.e., isometric elbow flexion/extension) was not specific to the training (18). Myofiber size was not assessed in any of these studies [muscle hypertrophy determined via thigh MRI noted in one study (22)]. It is well recognized in healthy adults that the bulk of strength and power gains during the initial weeks of RT result from nonmuscle mass dependent adaptations, as unaccustomed individuals rapidly improve their ability to activate motor units in agonist muscles and inhibit antagonist recruitment (i.e., “neural learning”) (65). In the current study, this is reflected in substantial performance gains seen after the first 8 wk of training. RT-induced neural learning may be particularly beneficial to PD patients with dyskinesia, contractile dysfunction, or general mobility impairment. As we have shown previously in healthy adults, continued increments in strength/power beyond these first few weeks are increasingly dependent on myofiber hypertrophy (6); thus the hypertrophy found here in PD presumably played a major role in the continued strength/power improvements from 8 to 16 wk.
The IIx-to-IIa shift in myofiber type distribution and marked improvements in the activities of mitochondrial complexes I and IV (in both SS and IMF fractions) noted in response to the training program are putative adaptations that enhance the oxidative capacity and fatigue resistance of skeletal muscle. In fact, using 31P-magnetic resonance spectroscopy, we found in humans that the oxidative capacity of contracting skeletal muscle is positively correlated with the distribution of type IIa myofibers (but not type I fibers) (45). The functional significance of the IIx-to-IIa myofiber type shift—a commonly found adaptation to both RT (6, 9) and ET (69)—should therefore not be overlooked. On the other hand, enhanced muscle mitochondrial oxidative capacity is typically only found in response to ET (21) or high-intensity interval training (40). Thus the marked improvements noted here in mitochondrial complex I and IV activities in both SS and IMF fractions are particularly exciting, given that the exercise prescription did not include traditional aerobic exercise. It is also noteworthy that the gains resulted in SS complex activities matching CON and IMF mitochondrial complex activities twice that of CON. The increases in complex I and IV activities occurred as citrate synthase activities in both SS and IMF fractions remained stable throughout the training program, suggesting an improvement in mitochondrial quality rather than quantity. Mitochondrial dysfunction has been found in both idiopathic PD (11, 53, 66, 78) and cases with known genetic mutations (29), and appears driven by complex I deficiency in substantia nigra neurons (66) and platelets (53), and deficiencies in both complexes I and IV in skeletal muscle (11, 78). However, a summary of the existing literature indicates skeletal muscle mitochondrial dysfunction is not universally found in PD and is generally considered mild compared with age-matched controls (78). While we found no significant differences between pretraining PD and age-matched CON in complex I or IV activity in either fraction, clearly muscle mitochondrial function is depressed with advancing age and has functional consequences (50). For example, mitochondrial function is well known to impact neuromuscular fatigue (1), and not surprisingly the increased mitochondrial function following high-intensity training in our participants was associated with improved performance on both voluntary and electrically stimulated muscle contraction fatigue tests, as well as 6-min walk distance.
The improvements noted on the 6-min walk test, UPDRS motor score, and voluntary strength were comparable to those found previously in response to traditional RT among persons with PD [reviewed in (12, 47)]. The 6-point improvement in UPDRS total score, determined “on medication,” is unique among exercise studies, and it is interesting to note that, after 40 wk of levodopa alone (300 mg/d), others have found no improvement in UPDRS total score (27). In addition, we observed encouraging improvements in perceived fatigue severity (FSS) and life quality (PDQ-39), as well as neuromuscular fatigability, leg power, balance, and motor unit activity during sit-to-stand. Up to 56% of individuals with PD rate themselves as experiencing undue fatigue (24); however, perceived fatigue is often overlooked in PD-related research (30). This is especially true for exercise research in the PD field, with no published studies of subjective fatigue levels during a controlled exercise training intervention (72). Currently, most investigational treatments for PD-related fatigue and fatigability center on the use of various drugs (48), whereas our results indicate intensive exercise training effectively reduces fatigue severity to an FSS score below that indicative of significant fatigue (average score of ≥4) (34). This is a particularly valuable finding because until now it was unknown whether exercise would improve or exacerbate PD-related fatigue (72). Both nonmotor symptoms (49) and physical functionality (26) have been shown to predict quality of life better than motor symptoms associated with PD. With this in mind, the improvements we found in nonmotor symptoms such as perceived fatigue severity, mentation and mood (UPDRS section I), and emotion and cognition (PDQ-39 subscores) likely combine with the improvements we noted in physical functionality resulting in an overall improvement in quality of life.
Some key neuromuscular adaptations to the training program offer novel insights with high clinical relevance. The increases in leg muscle power and balance are important for reducing falls risk (59), particularly for persons with PD who suffer an increased risk of falling (2, 3). Further, lower extremity power is a major predictor of functional limitation and disability among older adults (61), while compromised independent mobility is one of the most important determinants of morbidity and mortality (25, 62), and risk in PD is compounded by bradykinesia and other gait abnormalities (e.g., freezing). Thus the enhanced ability to generate leg power throughout 20 fatiguing, maximal effort contractions (both knee extension and sit-to-stand power) found here is highly significant because weight-bearing activities of daily living demand sufficient power throughout a series of repetitive actions to propel bodyweight (e.g., climbing stairs, level or grade walking). It is also important to point out that PD displayed an unusually high quadriceps MUA during the sit-to-stand task (requiring nearly 90% of maximal quadriceps MUA simply to stand from a seated position), suggesting substantially greater difficulty and/or extraneous motor unit firing compared with age-matched CON. Excessive or unnecessary MUA during motor tasks has also been shown during treadmill walking in PD but is improved with a progressive, high-intensity locomotor training program (63). Interestingly, we found after only 8 wk of training that sit-to-stand MUA was substantially reduced in PD and no longer different from CON. By 16 wk, the magnitude of improvement exceeded what we found in healthy older adults after RT (56), suggesting the exercise training program induced remarkable alterations in motor unit recruitment patterns among PD. Neuromotor learning tends to be fairly task-specific; thus the sit-to-stand improvements noted here likely resulted from the combination of heavy leg presses and bodyweight squats performed each training session.
Lastly, in our comparison of persons with PD (pretraining) with matched CON subjects, we noted several perhaps surprising similarities and differences. Considering the remarkable PD vs. CON difference in MUA during sit-to-stand, it was quite surprising to find no group differences in maximum voluntary strength or muscle power. Comparisons of neuromotor performance in PD vs. CON are extremely limited, but there is one report of lower knee extension strength in PD subjects with “high-PD motor signs” (UPDRS motor ≥ 31.7) vs. matched controls and PD subjects with “low-PD motor signs” (UPDRS motor < 31.7) (73). In our trial, the mean pretraining UPDRS motor score was 35.8, and 10 of 15 PD participants exceeded 31.7 (range 32–52); yet we found no differences between PD and CON in maximal voluntary strength or leg power. The inconsistent findings between the two studies may be attributable to differences in test mode (dynamic vs. isometric), but clearly more research in this area is warranted. Regarding myofiber size and type distribution in PD vs. matched CON, we noted a few curious differences. Compared with CON, in PD we found greater 1) type I myofiber distribution, 2) type I myofiber size, and 3) size heterogeneity of type IIa and IIx myofibers. The cause and consequence of these phenotypic differences are not known. Higher type I distribution in PD was unexpected, and it was also surprising that it “normalized” (compared to CON) after training; type I myofiber distribution is typically unchanged by exercise training (6, 9). We can only speculate that the relatively large type I myofibers in untrained PD may result from a compensatory mechanism—an attempt to restore/retain whole muscle mass in response to preferential type II motor unit loss. This concept is supported by the higher distribution of type I fibers and greater size heterogeneity of type II fibers (which suggests a pathological process involving concurrent atrophy and compensatory hypertrophy). On the other hand, the apparent type I hypertrophy could be the consequence of higher levels of type I motor unit activity in PD due to the extraneous EMG activity we and others (63) observed during motor tasks, as it is well established that smaller, type I motor units have the lowest activation threshold. These, and potentially other, dynamic changes in PD muscle independent of changes consequent to normal aging warrant further study.
In summary, the high-intensity exercise training program was well tolerated by individuals with PD (95% adherence). Additionally, persons with moderately advanced PD adapt quite well to high-intensity exercise training, with favorable changes in skeletal muscle at the cellular and subcellular levels that are associated ultimately with improvements in motor function, physical capacity, and fatigue perception. A limitation of the current study is the lack of a nonexercise PD control group; however, these findings bolster support for high-intensity training in the PD population. There remains a need for future studies to more effectively examine exercise dosing in persons with PD across multiple stages of disease, along with the potential interactions of exercise and medication usage on both motor and nonmotor consequences of PD.
GRANTS
This work was supported by the UAB Department of Neurology, UAB School of Medicine, UAB Center for Exercise Medicine, 1T32 HD071866 (NAK), P30 DK079626 (DRTC Bio-Analytical Redox Biology Core), and the UAB Center for Clinical and Translational Science (UL1 TR000165).
DISCLOSURES
No conflicts of interest, financial or otherwise, are declared by the author(s).
AUTHOR CONTRIBUTIONS
Author contributions: N.A.K., M.P.F., C.S.B., D.R.M., S.C.T., J.Y.W., L.L., and S.T.W. performed experiments; N.A.K., M.P.F., D.G.S., C.S.B., D.R.M., and M.M.B. analyzed data; N.A.K., M.P.F., D.G.S., R.L.W., C.S.B., D.R.M., S.C.T., and M.M.B. interpreted results of experiments; N.A.K. and M.M.B. prepared figures; N.A.K. and M.M.B. drafted manuscript; N.A.K., M.P.F., D.G.S., R.L.W., C.S.B., D.R.M., S.C.T., J.Y.W., L.L., S.T.W., and M.M.B. edited and revised manuscript; N.A.K., M.P.F., D.G.S., R.L.W., C.S.B., D.R.M., S.C.T., J.Y.W., L.L., S.T.W., and M.M.B. approved final version of manuscript; M.P.F., D.G.S., R.L.W., C.S.B., D.R.M., and M.M.B. conception and design of research.
ACKNOWLEDGMENTS
We sincerely appreciate the effort and dedication of the research participants. We thank K. Johnston for technical assistance.
REFERENCES
- 1.Allen DG, Lamb GD, Westerblad H. Skeletal muscle fatigue: cellular mechanisms. Physiol Reviews 88: 287–332, 2008 [DOI] [PubMed] [Google Scholar]
- 2.Allen NE, Sherrington C, Canning CG, Fung VS. Reduced muscle power is associated with slower walking velocity and falls in people with Parkinson's disease. Parkinsonism Relat Disord 16: 261–264, 2010 [DOI] [PubMed] [Google Scholar]
- 3.Allen NE, Sherrington C, Paul SS, Canning CG. Balance and falls in Parkinson's disease: a meta-analysis of the effect of exercise and motor training. Mov Disord 26: 1605–1615, 2011 [DOI] [PubMed] [Google Scholar]
- 4.Archer T, Fredriksson A, Johansson B. Exercise alleviates Parkinsonism: clinical and laboratory evidence. Acta Neurol Scand 123: 73–84, 2011 [DOI] [PubMed] [Google Scholar]
- 5.Atherton PJ, Babraj J, Smith K, Singh J, Rennie MJ, Wackerhage H. Selective activation of AMPK-PGC-1alpha or PKB-TSC2-mTOR signaling can explain specific adaptive responses to endurance or resistance training-like electrical muscle stimulation. FASEB J 19: 786–788, 2005 [DOI] [PubMed] [Google Scholar]
- 6.Bamman MM, Petrella JK, Kim JS, Mayhew DL, Cross JM. Cluster analysis tests the importance of myogenic gene expression during myofiber hypertrophy in humans. J Appl Physiol 102: 2232–2239, 2007 [DOI] [PubMed] [Google Scholar]
- 7.Bamman MM, Ragan RC, Kim JS, Cross JM, Hill VJ, Tuggle SC, Allman RM. Myogenic protein expression before and after resistance loading in 26- and 64-yr-old men and women. J Appl Physiol 97: 1329–1337, 2004 [DOI] [PubMed] [Google Scholar]
- 8.Baumgartner RN, Koehler KM, Gallagher D, Romero L, Heymsfield SB, Ross RR, Garry PJ, Lindeman RD. Epidemiology of sarcopenia among the elderly in New Mexico. Am J Epidemiol 147: 755–763, 1998 [DOI] [PubMed] [Google Scholar]
- 9.Bickel CS, Cross JM, Bamman MM. Exercise dosing to retain resistance training adaptations in young and older adults. Med Sci Sports Exerc 43: 1177–1187, 2011 [DOI] [PubMed] [Google Scholar]
- 10.Bickel CS, Slade JM, Warren GL, Dudley GA. Fatigability and variable-frequency train stimulation of human skeletal muscles. Phys Ther 83: 366–373, 2003 [PubMed] [Google Scholar]
- 11.Blin O, Desnuelle C, Rascol O, Borg M, Peyro Saint Paul H, Azulay JP, Bille F, Figarella D, Coulom F, Pellissier JF, et al. Mitochondrial respiratory failure in skeletal muscle from patients with Parkinson's disease and multiple system atrophy. J Neurol Sci 125: 95–101, 1994 [DOI] [PubMed] [Google Scholar]
- 12.Brienesse LA, Emerson MN. Effects of resistance training for people with Parkinson's disease: a systematic review. J Am Med Dir Assoc 14: 236–241, 2013 [DOI] [PubMed] [Google Scholar]
- 13.Burini D, Farabollini B, Iacucci S, Rimatori C, Riccardi G, Capecci M, Provinciali L, Ceravolo MG. A randomised controlled cross-over trial of aerobic training versus Qigong in advanced Parkinson's disease. Eura Medicophys 42: 231–238, 2006 [PubMed] [Google Scholar]
- 14.Cakit BD, Saracoglu M, Genc H, Erdem HR, Inan L. The effects of incremental speed-dependent treadmill training on postural instability and fear of falling in Parkinson's disease. Clin Rehabil 21: 698–705, 2007 [DOI] [PubMed] [Google Scholar]
- 15.Carabello RJ, Reid KF, Clark DJ, Phillips EM, Fielding RA. Lower extremity strength and power asymmetry assessment in healthy and mobility-limited populations: reliability and association with physical functioning. Aging Clin Exp Res 22: 324–329, 2009 [DOI] [PMC free article] [PubMed] [Google Scholar]
- 16.Chale A, Cloutier GJ, Hau C, Phillips EM, Dallal GE, Fielding RA. Efficacy of whey protein supplementation on resistance exercise-induced changes in lean mass, muscle strength, and physical function in mobility-limited older adults. J Gerontol A Biol Sci Med Sci 68: 682–690, 2012 [DOI] [PMC free article] [PubMed] [Google Scholar]
- 17.Coffey VG, Zhong Z, Shield A, Canny BJ, Chibalin AV, Zierath JR, Hawley JA. Early signaling responses to divergent exercise stimuli in skeletal muscle from well-trained humans. FASEB J 20: 190–192, 2006 [DOI] [PubMed] [Google Scholar]
- 18.Corcos DM, Robichaud JA, David FJ, Leurgans SE, Vaillancourt DE, Poon C, Rafferty MR, Kohrt WM, Comella CL. A two-year randomized controlled trial of progressive resistance exercise for Parkinson's disease. Mov Disord 28: 1230–1240, 2013 [DOI] [PMC free article] [PubMed] [Google Scholar]
- 19.Cruise KE, Bucks RS, Loftus AM, Newton RU, Pegoraro R, Thomas MG. Exercise and Parkinson's: benefits for cognition and quality of life. Acta Neurol Scand 123: 13–19, 2011 [DOI] [PubMed] [Google Scholar]
- 20.David FJ, Rafferty MR, Robichaud JA, Prodoehl J, Kohrt WM, Vaillancourt DE, Corcos DM. Progressive resistance exercise and Parkinson's disease: a review of potential mechanisms. Parkinson's Dis 2012: 124527, 2012 [DOI] [PMC free article] [PubMed] [Google Scholar]
- 21.Devries MC, Samjoo IA, Hamadeh MJ, McCready C, Raha S, Watt MJ, Steinberg GR, Tarnopolsky MA. Endurance training modulates intramyocellular lipid compartmentalization and morphology in skeletal muscle of lean and obese women. J Clin Endocrinol Metab 2013 [DOI] [PubMed] [Google Scholar]
- 22.Dibble LE, Hale TF, Marcus RL, Droge J, Gerber JP, LaStayo PC. High-intensity resistance training amplifies muscle hypertrophy and functional gains in persons with Parkinson's disease. Mov Disord 21: 1444–1452, 2006 [DOI] [PubMed] [Google Scholar]
- 23.Dibble LE, Hale TF, Marcus RL, Gerber JP, LaStayo PC. High intensity eccentric resistance training decreases bradykinesia and improves Quality Of Life in persons with Parkinson's disease: a preliminary study. Parkinsonism Relat Disord 15: 752–757, 2009 [DOI] [PubMed] [Google Scholar]
- 24.Earhart GM, Falvo MJ. Parkinson disease and exercise. Compr Physiol 3: 833–848, 2013 [DOI] [PubMed] [Google Scholar]
- 25.Elbaz A, Sabia S, Brunner E, Shipley M, Marmot M, Kivimaki M, Singh-Manoux A. Association of walking speed in late midlife with mortality: results from the Whitehall II cohort study. Age (Dordr) 35: 943–952, 2013 [DOI] [PMC free article] [PubMed] [Google Scholar]
- 26.Ellis T, Cavanaugh JT, Earhart GM, Ford MP, Foreman KB, Dibble LE. Which measures of physical function and motor impairment best predict quality of life in Parkinson's disease? Parkinsonism Relat Disord 17: 693–697, 2011 [DOI] [PMC free article] [PubMed] [Google Scholar]
- 27.Fahn S, Oakes D, Shoulson I, Kieburtz K, Rudolph A, Lang A, Olanow CW, Tanner C, Marek K, Parkinson Study Group. Levodopa and the progression of Parkinson's disease. N Engl J Med 351: 2498–2508, 2004 [DOI] [PubMed] [Google Scholar]
- 28.Falvo MJ, Schilling BK, Earhart GM. Parkinson's disease and resistive exercise: rationale, review, and recommendations. Mov Disord 23: 1–11, 2008 [DOI] [PubMed] [Google Scholar]
- 29.Finsterer J. Parkinson's syndrome and Parkinson's disease in mitochondrial disorders. Mov Disord 26: 784–791, 2011 [DOI] [PubMed] [Google Scholar]
- 30.Friedman JH, Brown RG, Comella C, Garber CE, Krupp LB, Lou JS, Marsh L, Nail L, Shulman L, Taylor CB, Working Group on Fatigue in Parkinson's Disease. Fatigue in Parkinson's disease: a review. Mov Disord 22: 297–308, 2007 [DOI] [PubMed] [Google Scholar]
- 31.Garber CE, Friedman JH. Effects of fatigue on physical activity and function in patients with Parkinson's disease. Neurology 60: 1119–1124, 2003 [DOI] [PubMed] [Google Scholar]
- 32.Goodwin VA, Richards SH, Taylor RS, Taylor AH, Campbell JL. The effectiveness of exercise interventions for people with Parkinson's disease: a systematic review and meta-analysis. Mov Disord 23: 631–640, 2008 [DOI] [PubMed] [Google Scholar]
- 33.Gregory CM, Dixon W, Bickel CS. Impact of varying pulse frequency and duration on muscle torque production and fatigue. Muscle Nerve 35: 504–509, 2007 [DOI] [PubMed] [Google Scholar]
- 34.Herlofson K, Larsen JP. Measuring fatigue in patients with Parkinson's disease - the Fatigue Severity Scale. Eur J Neurol 9: 595–600, 2002 [DOI] [PubMed] [Google Scholar]
- 35.Hirsch MA, Toole T, Maitland CG, Rider RA. The effects of balance training and high-intensity resistance training on persons with idiopathic Parkinson's disease. Arch Phys Med Rehabil 84: 1109–1117, 2003 [DOI] [PubMed] [Google Scholar]
- 36.Hoppeler H. Exercise-induced ultrastructural changes in skeletal muscle. Int J Sports Med 7: 187–204, 1986 [DOI] [PubMed] [Google Scholar]
- 37.Hughes AJ, Daniel SE, Kilford L, Lees AJ. Accuracy of clinical diagnosis of idiopathic Parkinson's disease: a clinico-pathological study of 100 cases. J Neurol Neurosurg Psychiatry 55: 181–184, 1992 [DOI] [PMC free article] [PubMed] [Google Scholar]
- 38.Hunter GR, McCarthy JP, Bamman MM. Effects of resistance training on older adults. Sports Med 34: 329–348, 2004 [DOI] [PubMed] [Google Scholar]
- 39.Hwang WJ, Lin TS. Evaluation of fatigue in Parkinson's disease patients with stimulated single fiber electromyography. Acta Neurol Scand 104: 271–274, 2001 [DOI] [PubMed] [Google Scholar]
- 40.Jacobs RA, Fluck D, Bonne TC, Burgi S, Christensen PM, Toigo M, Lundby C. Improvements in exercise performance with high-intensity interval training coincide with an increase in skeletal muscle mitochondrial content and function. J Appl Physiol (1985) 115: 785–793, 2013 [DOI] [PubMed] [Google Scholar]
- 41.Janssen AJ, Trijbels FJ, Sengers RC, Smeitink JA, van den Heuvel LP, Wintjes LT, Stoltenborg-Hogenkamp BJ, Rodenburg RJ. Spectrophotometric assay for complex I of the respiratory chain in tissue samples and cultured fibroblasts. Clin Chem 53: 729–734, 2007 [DOI] [PubMed] [Google Scholar]
- 42.Karvonen J, Vuorimaa T. Heart rate and exercise intensity during sports activities. Practical application. Sports Med 5: 303–311, 1988 [DOI] [PubMed] [Google Scholar]
- 43.Kim JS, Kosek DJ, Petrella JK, Cross JM, Bamman MM. Resting and load-induced levels of myogenic gene transcripts differ between older adults with demonstrable sarcopenia and young men and women. J Appl Physiol 99: 2149–2158, 2005 [DOI] [PubMed] [Google Scholar]
- 44.Kosek DJ, Kim JS, Petrella JK, Cross JM, Bamman MM. Efficacy of 3 days/wk resistance training on myofiber hypertrophy and myogenic mechanisms in young vs. older adults. J Appl Physiol 101: 531–544, 2006 [DOI] [PubMed] [Google Scholar]
- 45.Larson-Meyer DE, Newcomer BR, Hunter GR, Joanisse DR, Weinsier RL, Bamman MM. Relation between in vivo and in vitro measurements of skeletal muscle oxidative metabolism. Muscle Nerve 24: 1665–1676, 2001 [DOI] [PubMed] [Google Scholar]
- 46.Leek BT, Mudaliar SR, Henry R, Mathieu-Costello O, Richardson RS. Effect of acute exercise on citrate synthase activity in untrained and trained human skeletal muscle. Am J Physiol Regul Integr Comp Physiol 280: R441–R447, 2001 [DOI] [PubMed] [Google Scholar]
- 47.Lima LO, Scianni A, Rodrigues-de-Paula F. Progressive resistance exercise improves strength and physical performance in people with mild to moderate Parkinson's disease: a systematic review. J Physiother 59: 7–13, 2013 [DOI] [PubMed] [Google Scholar]
- 48.Lou JS. Physical and mental fatigue in Parkinson's disease: epidemiology, pathophysiology and treatment. Drugs Aging 26: 195–208, 2009 [DOI] [PubMed] [Google Scholar]
- 49.Martinez-Martin P, Rodriguez-Blazquez C, Kurtis MM, Chaudhuri KR, Group NV. The impact of non-motor symptoms on health-related quality of life of patients with Parkinson's disease. Mov Disord 26: 399–406, 2011 [DOI] [PubMed] [Google Scholar]
- 50.Marzetti E, Calvani R, Cesari M, Buford TW, Lorenzi M, Behnke BJ, Leeuwenburgh C. Mitochondrial dysfunction and sarcopenia of aging: from signaling pathways to clinical trials. Int J Biochem Cell Biol 45: 2288–2301, 2013 [DOI] [PMC free article] [PubMed] [Google Scholar]
- 51.Merritt EK, Stec MJ, Thalacker-Mercer A, Windham ST, Cross JM, Shelley DP, Tuggle SC, Kosek DJ, Kim JS, Bamman MM. Heightened muscle inflammation susceptibility may impair regenerative capacity in aging humans. J Appl Physiol 115: 937–948, 2013 [DOI] [PMC free article] [PubMed] [Google Scholar]
- 52.Muhlack S, Welnic J, Woitalla D, Muller T. Exercise improves efficacy of levodopa in patients with Parkinson's disease. Mov Disord 22: 427–430, 2007 [DOI] [PubMed] [Google Scholar]
- 53.Parker WD, Jr, Boyson SJ, Parks JK. Abnormalities of the electron transport chain in idiopathic Parkinson's disease. Ann Neurol 26: 719–723, 1989 [DOI] [PubMed] [Google Scholar]
- 54.Peto V, Jenkinson C, Fitzpatrick R. Determining minimally important differences for the PDQ-39 Parkinson's disease questionnaire. Age Ageing 30: 299–302, 2001 [DOI] [PubMed] [Google Scholar]
- 55.Petrella JK, Kim JS, Mayhew DL, Cross JM, Bamman MM. Potent myofiber hypertrophy during resistance training in humans is associated with satellite cell-mediated myonuclear addition: a cluster analysis. J Appl Physiol 104: 1736–1742, 2008 [DOI] [PubMed] [Google Scholar]
- 56.Petrella JK, Kim JS, Tuggle SC, Bamman MM. Contributions of force and velocity to improved power with progressive resistance training in young and older adults. Eur J Appl Physiol 99: 343–351, 2007 [DOI] [PubMed] [Google Scholar]
- 57.Petrella JK, Kim JS, Tuggle SC, Hall SR, Bamman MM. Age differences in knee extension power, contractile velocity, and fatigability. J Appl Physiol 98: 211–220, 2005 [DOI] [PubMed] [Google Scholar]
- 58.Petzinger GM, Fisher BE, Van Leeuwen JE, Vukovic M, Akopian G, Meshul CK, Holschneider DP, Nacca A, Walsh JP, Jakowec MW. Enhancing neuroplasticity in the basal ganglia: the role of exercise in Parkinson's disease. Mov Disord 25 Suppl 1: S141–145, 2010 [DOI] [PMC free article] [PubMed] [Google Scholar]
- 59.Pizzigalli L, Filippini A, Ahmaidi S, Jullien H, Rainoldi A. Prevention of falling risk in elderly people: the relevance of muscular strength and symmetry of lower limbs in postural stability. J Strength Cond Res 25: 567–574, 2011 [DOI] [PubMed] [Google Scholar]
- 60.Rasmussen HN, Andersen AJ, Rasmussen UF. Optimization of preparation of mitochondria from 25–100 mg skeletal muscle. Anal Biochem 252: 153–159, 1997 [DOI] [PubMed] [Google Scholar]
- 61.Reid KF, Fielding RA. Skeletal muscle power: a critical determinant of physical functioning in older adults. Exerc Sport Sci Rev 40: 4–12, 2011 [DOI] [PMC free article] [PubMed] [Google Scholar]
- 62.Robinson TN, Wu DS, Sauaia A, Dunn CL, Stevens-Lapsley JE, Moss M, Stiegmann GV, Gajdos C, Cleveland JC, Jr, Inouye SK. Slower walking speed forecasts increased postoperative morbidity and 1-year mortality across surgical specialties. Ann Surg 258: 582–590, 2013 [DOI] [PMC free article] [PubMed] [Google Scholar]
- 63.Rose MH, Lokkegaard A, Sonne-Holm S, Jensen BR. Effects of training and weight support on muscle activation in Parkinson's disease. J Electromyogr Kinesiol 2013 [DOI] [PubMed] [Google Scholar]
- 64.Ruas JL, White JP, Rao RR, Kleiner S, Brannan KT, Harrison BC, Greene NP, Wu J, Estall JL, Irving BA, Lanza IR, Rasbach KA, Okutsu M, Nair KS, Yan Z, Leinwand LA, Spiegelman BM. A PGC-1alpha isoform induced by resistance training regulates skeletal muscle hypertrophy. Cell 151: 1319–1331, 2012 [DOI] [PMC free article] [PubMed] [Google Scholar]
- 65.Sale DG. Neural adaptation to resistance training. Med Sci Sports Exerc 20: S135–145, 1988 [DOI] [PubMed] [Google Scholar]
- 66.Schapira AH, Cooper JM, Dexter D, Clark JB, Jenner P, Marsden CD. Mitochondrial complex I deficiency in Parkinson's disease. J Neurochem 54: 823–827, 1990 [DOI] [PubMed] [Google Scholar]
- 67.Schilling BK, Pfeiffer RF, Ledoux MS, Karlage RE, Bloomer RJ, Falvo MJ. Effects of moderate-volume, high-load lower-body resistance training on strength and function in persons with Parkinson's disease: a pilot study. Parkinsons Dis 2010: 824734, 2010 [DOI] [PMC free article] [PubMed] [Google Scholar]
- 68.Shepherd D, Garland PB. The kinetic properties of citrate synthase from rat liver mitochondria. Biochem J 114: 597–610, 1969 [DOI] [PMC free article] [PubMed] [Google Scholar]
- 69.Short KR, Vittone JL, Bigelow ML, Proctor DN, Coenen-Schimke JM, Rys P, Nair KS. Changes in myosin heavy chain mRNA and protein expression in human skeletal muscle with age and endurance exercise training. J Appl Physiol (1985) 99: 95–102, 2005 [DOI] [PubMed] [Google Scholar]
- 70.Shulman LM, Gruber-Baldini AL, Anderson KE, Fishman PS, Reich SG, Weiner WJ. The clinically important difference on the unified Parkinson's disease rating scale. Arch Neurol 67: 64–70, 2010 [DOI] [PubMed] [Google Scholar]
- 71.Shulman LM, Katzel LI, Ivey FM, Sorkin JD, Favors K, Anderson KE, Smith BA, Reich SG, Weiner WJ, Macko RF. Randomized clinical trial of 3 types of physical exercise for patients with Parkinson disease. JAMA Neurol 70: 183–190, 2013 [DOI] [PMC free article] [PubMed] [Google Scholar]
- 72.Speelman AD, van de Warrenburg BP, van Nimwegen M, Petzinger GM, Munneke M, Bloem BR. How might physical activity benefit patients with Parkinson disease? Nat Rev Neurol 7: 528–534, 2011 [DOI] [PubMed] [Google Scholar]
- 73.Stevens-Lapsley J, Kluger BM, Schenkman M. Quadriceps muscle weakness, activation deficits, and fatigue with Parkinson disease. Neurorehabil Neural Repair 26: 533–541, 2012 [DOI] [PubMed] [Google Scholar]
- 74.Tanaka K, Quadros AC, Jr, Santos RF, Stella F, Gobbi LT, Gobbi S. Benefits of physical exercise on executive functions in older people with Parkinson's disease. Brain Cogn 69: 435–441, 2009 [DOI] [PubMed] [Google Scholar]
- 75.Tomlinson CL, Stowe R, Patel S, Rick C, Gray R, Clarke CE. Systematic review of levodopa dose equivalency reporting in Parkinson's disease. Mov Disord 25: 2649–2653, 2010 [DOI] [PubMed] [Google Scholar]
- 76.Trappe S, Williamson D, Godard M. Maintenance of whole muscle strength and size following resistance training in older men. J Gerontol A Biol Sci Med Sci 57: B138–B143, 2002 [DOI] [PubMed] [Google Scholar]
- 77.Walsh MC, Hunter GR, Livingstone MB. Sarcopenia in premenopausal and postmenopausal women with osteopenia, osteoporosis and normal bone mineral density. Osteoporos Int 17: 61–67, 2006 [DOI] [PubMed] [Google Scholar]
- 78.Winkler-Stuck K, Kirches E, Mawrin C, Dietzmann K, Lins H, Wallesch CW, Kunz WS, Wiedemann FR. Re-evaluation of the dysfunction of mitochondrial respiratory chain in skeletal muscle of patients with Parkinson's disease. J Neural Transm 112: 499–518, 2005 [DOI] [PubMed] [Google Scholar]
- 79.Zigmond MJ, Cameron JL, Hoffer BJ, Smeyne RJ. Neurorestoration by physical exercise: moving forward. Parkinsonism Relat Disord 18 Suppl 1: S147–S150, 2012 [DOI] [PubMed] [Google Scholar]