

Abstract
The intermediate reticular formation (IRt) subjacent to the rostral (gustatory) nucleus of the solitary tract (rNST) receives projections from the rNST and appears essential to the expression of taste-elicited ingestion and rejection responses. We used whole cell patch-clamp recording and calcium imaging to characterize responses from an identified population of prehypoglossal neurons in the IRt to electrical stimulation of the rNST in a neonatal rat pup slice preparation. The calcium imaging studies indicated that IRt neurons could be activated by rNST stimulation and that many neurons were under tonic inhibition. Whole cell patch-clamp recording revealed mono- and polysynaptic projections from the rNST to identified prehypoglossal neurons. The projection was primarily excitatory and glutamatergic; however, there were some inhibitory GABAergic projections, and many neurons received excitatory and inhibitory inputs. There was also evidence of disinhibition. Overall, bath application of GABAA antagonists increased the amplitude of excitatory currents, and, in several neurons, stimulation of the rNST systematically decreased inhibitory currents. We have hypothesized that the transition from licks to gapes by natural stimuli, such as quinine monohydrochloride, could occur via such disinhibition. We present an updated dynamic model that summarizes the complex synaptic interface between the rNST and the IRt and demonstrates how inhibition could contribute to the transition from ingestion to rejection.
Keywords: taste-motor, central pattern generator, calcium imaging, patch clamp
gustatory outputs from the nucleus of the solitary tract (NST) include the parabrachial nucleus (63) or thalamus (primates) (6), but there is anatomic evidence for local medullary connections as well. Medullary projections include intrasolitary connections and projections to nearby preganglionic parasympathetic salivatory neurons, projections that likely serve as a substrate for reflex behaviors, including salivation and other taste-induced cephalic responses (59). However, the NST also projects to the subjacent reticular formation (RF) (5, 40, 62, 81), and there are considerable data to suggest that this pathway mediates the more complex taste-elicited ingestion and rejection oromotor consummatory behaviors that are known to be organized in the lower brain stem (37).
The intermediate zone of the medullary RF (IRt), which is subjacent to the rostral (gustatory) NST (rNST), is a major source of preoromotor neurons (42, 84) and likely serves as a common preoromotor output for consummatory behavior initiated from forebrain structures regulating food intake or from local, brain stem orosensory nuclei. The IRt receives a diffuse projection from the rNST (62, 81) and gustatory-responsive parabrachial nucleus (44), as well as forebrain projections from the hypothalamus, central nucleus of the amygdala, and cortex (17, 55, 70, 71, 92). Consistent with a role as a final common oromotor output pathway, functional inactivation studies show that infusions of the GABAA agonist muscimol or glutamate antagonists suppress voluntary and intraorally induced licking behavior, as well as the taste-mediated quinine monohydrochloride (QHCl; bitter)-evoked oral rejection response (gapes) (18, 19).
Although these studies suggest that projections from the rNST to the subjacent RF might be involved in mediating the switch between ingestion and rejection responses, this projection has not been studied physiologically. Because of the short distance between the structures, in vivo approaches are difficult but suitable for in vitro analysis. For example, in vitro techniques have proved successful in analyzing local circuit connections between the caudal NST (cNST) and dorsal motor nucleus (DMN) of the vagus (13, 21, 22, 79, 80). Although patch-clamp studies have begun to elucidate biophysical and synaptic properties of gustatory neurons in the rNST (8, 9, 11, 33, 35, 36, 77), the output of the rNST to the subjacent RF has not been studied.
The present series of experiments was designed to determine whether populations of preoromotor neurons in the IRt receive inputs from the overlying solitary nucleus. We began with live-cell confocal calcium imaging to determine whether a defined population of neurons within the RF, i.e., those that project to the hypoglossal nucleus (mXII), could be activated by electrical stimulation of the rNST. Because changes in free calcium can serve as a proxy for neuronal depolarization (32) and relatively large populations of neurons can be studied simultaneously, this technique allowed us to monitor multiple identified neurons within a field of view and proved an efficient means to quickly establish the presence of an rNST-RF connection. Subsequent whole cell patch-clamp studies confirmed these connections and provided the temporal resolution necessary for characterization of synaptic properties. These studies revealed a complex mono- and polysynaptic interface between the rNST and IRt.
To put these connections between the rNST and IRt into a functional context, we present an updated version of a previously published computational model of a lick-gape pattern switching network (87). In the original model, we used a network of three neurons, each representing a class of preoromotor neurons: 1) lingual protrudors (P), 2) lingual retractors (R), and 3) jaw openers (O). Using this model, we predicted that phase switching from two-phase licks (coincident activity in P and O, followed by activity in R) to three-phase gapes (initial activation of R followed by a sequence of activity in P-O and then R) could result from a change in the inhibition from R to P and R to O. This change in inhibition was postulated to arise from the rNST. In the present study, we document inhibitory currents in prehypoglossal interneurons originating from the rNST and incorporate them into the model architecture. In addition, although the original model did not include a mechanism for the increased amplitude and duration of EMG responses that characterize the gape response, behavioral pharmacology studies suggest that this mechanism could include the disinhibition of preoromotor interneurons (18). Indeed, the present results suggest that disinhibition could originate from the rNST, and we have incorporated this result into the extended model.
METHODS
For calcium imaging (n = 4) and whole cell patch recording (n = 33), brain stem slices were taken from neonatal rats at postnatal days 7–12 (P7–P12). Young animals were required, because the RF quickly becomes heavily myelinated during development, and this myelination obscures identification of retrogradely labeled neurons under differential interference contrast (DIC) optics used for patch-clamp studies. To record from an identified population of preoromotor neurons, we injected the mXII with a retrograde tracer 1–2 days before recording.
Hypoglossal Injections
All experimental protocols were approved by The Ohio State University Institutional Animal Care and Use Committee and the Pennington Biomedical Research Center in accordance with guidelines from the National Institutes of Health. Under aseptic conditions, neonatal rat pups (P7–P12) were given glycopyrrolate (0.02 mg/kg sc) to prevent excess pulmonary mucus secretion for 15 min and then anesthetized intraperitoneally with a combination of ketamine and xylazine (90 and 30 mg/kg, respectively). Mouse ear bars were used to mount pups on a stereotaxic frame, and a midline incision was made through the skin. Neck muscles were separated to expose the occipital plate and the first cervical vertebra. The foramen magnum was opened, exposing the caudal medulla at the level of the area postrema. Under stereotactic guidance, a micropipette (20–40 μm tip diameter) filled with 0.9% saline was used to determine the coordinates of the mXII by microstimulation (23). Coordinates from obex were typically 0.4 anterior-posterior, 0.3 medial-lateral, and 1.1 dorsal-ventral. This location was just in front of the area postrema, slightly rostral to the rostrocaudal midpoint of the nucleus. The saline-filled pipette was removed and replaced with a micropipette filled with rhodamine-labeled fluorescent microspheres (0.04 μm diameter; Invitrogen, Carlsbad, CA). The pipette was reinserted, and 50–150 nl of fluorescent microspheres were injected. The pipette was left in place for 10–20 min and removed. The incision was closed with 4.0 braided sutures, and a drop of cyanoacrylate glue was placed on the exposed end of the sutures to prevent their removal by the dam. Rat pups were returned to their home cage, where they survived for 24–48 h to allow retrograde transport of the fluorescent tracer.
Slice Preparation
Rat pups were anesthetized with 33% (wt/vol) urethane (ethylcarbamate; 3 ml/kg) and decapitated. The brain was rapidly removed and cooled to 4°C in a modified artificial cerebral spinal fluid (ACSF) “cutting solution” containing (in mM) 110 choline chloride, 25 NaHCO3, 3 KCl, 7 MgSO4·7 H2O, 1.5 NaH2PO4, 10 d-glucose, and 0.5 CaCl2·2 H2O. The brain was blocked ∼1 mm caudal to obex and rostrally at the level of the incoming VII nerve and glued to a ceramic block with cyanoacrylate glue for sectioning in the coronal plane on a Vibratome (model 1000, Vibratome, St. Louis, MO) at 350 μm. Coronal sections have been used for investigation of connections between the cNST and the DMN (13, 21) and investigation of the overlying the rNST (10, 46, 47, 88, 89). This plane of section allowed us to easily visualize the rNST and subjacent RF (Fig. 1). Sections used for recording started at the level where the NST starts to separate from the fourth ventricle and continued to the rostral pole of the NST. Typically, four 350-μm slices were cut from this area. Sections were placed in normal ACSF containing (in mM) 124 NaCl, 25 NaHCO3, 3 KCl, 1 MgSO4·7 H2O, 1.5 NaH2PO4, 10 d-glucose, and 1.5 CaCl2·2 H2O and continuously bubbled with 95% O2-5% CO2 at 32°C for 1 h and then held at room temperature before they were used for recording.
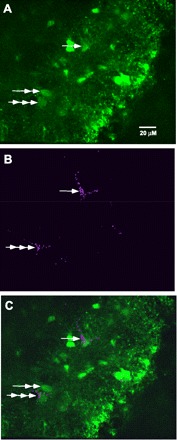
Fig. 1.
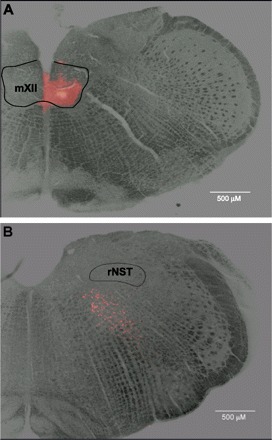
A: hypoglossal nucleus (mXII) of a rat pup injected with rhodamine fluorescent microspheres on postnatal day 10 (P10). B: retrogradely labeled neurons in reticular formation (RF) subjacent to rostral nucleus of solitary tract (rNST).
Calcium Imaging
For calcium imaging, slices were maintained in normal carboxygenated (95% O2-5% CO2) ACSF at 29°C before incubation in a solution of 8 μM calcium green (CG1-AM, Molecular Probes) for an additional 30 min. Slices were then gently rinsed and incubated in normal carboxygenated ACSF for the duration of the study. Individual slices to be imaged were transferred to a submersion chamber and held down with a gold wire nylon mesh “harp.” The normal ACSF medium was heated to 33°C using a thermoelectric assembly that maintained tissue temperature in the perfusion medium. The recording chamber was fixed to the stage of an upright microscope (model E600FN, Nikon) equipped with water immersion optics, and live-cell calcium images were obtained with a disk laser confocal-charge coupled device imaging system (Ultraview Nipkow, Perkin-Elmer). The system was equipped with a Sutter rapid filter wheel changer coupled to a multiline ion laser, which allowed us to study multiple fluorescent dyes. A ×40 immersion objective provided a 250 × 188 μm field of view. Collection rates were typically 3–5 frames/s. (For a complete description of this technique see Ref. 41.)
To map the RF, we initially centered the objective over a region subjacent to the rNST that contained double-labeled neurons, i.e., rhodamine-labeled RF neurons that projected to the mXII and were also prelabeled with calcium green. To activate neurons, we placed a twisted, bipolar stimulating electrode of 67-μm NiCr (51 μm bare) wire (∼140 μm overall diameter including insulation, ∼100-μm-diameter metal stimulating surface) in the center of the rNST (21, 35). Centered within the nucleus, the electrode physically occupied about one-third to one-half of the dorsal-ventral extent of the nucleus and was positioned to activate RF projection neurons to the RF (39). Trains of pulses delivered to the rNST consisted of monopolar square-wave pulses (0.15-ms duration) at a rate of 100 Hz for 0.5 or 1.0 s. Current intensity was maintained at 150 μA. A trial lasted 150 s, with the trains delivered at 30-s intervals beginning after an initial baseline period of 30 s. The polarity between the stimulating electrodes was switched for the last two stimulations. After the stimulation protocol under normal ACSF, a GABAA antagonist, SR-95531 (10 μM; Sigma, St. Louis, MO) was added to the perfusion medium, and the stimulation protocol was repeated after 5 min of perfusion. The drug was washed out for 15 min, and the stimulation procedure was repeated. Because both GABA and glycine receptors and interneurons have been identified in the medullary RF (12, 60), we wanted to determine whether suppression of glycine receptors modulated neuron excitability. Thus, in several experiments, the glycine antagonist strychnine (10 μM) was added to the perfusion medium immediately after testing with SR-95531 and then washed out. If we observed evidence of a return to baseline during the washout, we moved the objective to an adjacent area in the RF and repeated the stimulation protocol if double-labeled neurons were present.
Patch-Clamp Recording
Slices were transferred to a custom-made recording chamber affixed to a microscope (model E600FN, Nikon) with a custom stage (Syskiyou Instruments, Grants Pass, OR). The chamber was continuously perfused with carboxygenated ACSF warmed to 32°C at a rate of ∼2 ml/min. A custom-made gold harp fitted with nylon threads was used to hold the tissue slice in place. Under bright-field optics, a bipolar twisted wire was placed in the rNST. Patch pipettes were formed from 1.5-mm thin-walled borosilicate glass (AM Systems, Sequim, WA) pulled on a vertical pipette puller (model PP-83, Narashige); pipette resistance was 3–5 MΩ. Patch pipette solution consisted of (in mM) 140 gluconate, 10 EGTA, 10 HEPES, 1 MgCl2, 1 CaCl2, 2 ATP, and 5 NaCl. Lucifer yellow (0.1%) was added to the pipette solution for post hoc determination of double-labeled neurons. Under IR-DIC and epifluorescent optics, patch pipettes were guided to retrogradely labeled neurons within the RF and patch clamped in whole cell configuration (model 2400, AM Systems). Neurons were excluded from the study if they failed to achieve the following parameters: >1-GΩ seal, >100-MΩ membrane resistance, >40-mV action potential amplitude, and stable resting membrane potential below −40 mV. Action potential properties were determined under current clamp with a series of current steps: −0.3 to +0.2 nA in 0.05-nA steps. Resting membrane potential was monitored periodically throughout the recordings. The experiment was terminated if the resting membrane potential became unstable or dropped below criteria. Responses to electrical stimulation of the rNST were typically recorded under voltage clamp near the resting membrane potential using Clampfit 9.2 software (Molecular Devices, Union City, CA). Reported values were not corrected for a junction potential of ∼12 mV.
To presynaptically stimulate RF neurons, we delivered current to the rNST via a bipolar twisted wire stimulating electrode placed in the center of the rNST. To determine a response threshold, we delivered an ascending series of single pulses (0.15 ms width, 10–150 μA delivered every 5 s). Because single pulses did not always prove effective, they were followed by an ascending series of trains of pulses (100 Hz, 0.1 ms width, 100-ms train duration, 10–150 μA, delivered at 10-s intervals) (36). Twenty pulses or trains were then delivered at a stimulus current that induced a response. After identification of excitatory and/or inhibitory evoked currents, a stimulation series above threshold was repeated in the presence of drug treatments. Inward (excitatory) currents were blocked by addition of the glutamate ionotropic antagonist 6-cyano-7-nitroquinoxaline-2,3-dione (CNQX, 10–20 μM), alone or in combination with 1 μM MK-801 (Tocris, Ellisville, MO), to the bath solution for 5 min before NST stimulation. Although >15 μM CNQX may involve the N-methyl-d-aspartate receptor (3, 45), we were primarily interested in establishing whether identified RF neurons received glutamatergic input from the rNST, rather than uniquely specifying the nature of the ionotropic receptor involved. Inhibitory currents were blocked by addition of the GABAA antagonist bicuculline methiodide (30 μM) or SR-95531 (10 μM) to the bath solution for 5 min before NST stimulation. These doses are within the range used in similar brain stem preparations (21, 35, 79, 88, 91). Drugs were washed out for 10–20 min before the stimulation protocol was repeated.
Analysis
Calcium imaging.
Relative changes in intracellular calcium in response to electrical stimulation were quantified as changes in fluorescence (%) as follows: ΔF/F, where F is the fluorescence intensity within an area of interest (e.g., the outline of an RF neuron) averaged over the 3 s before stimulation and ΔF is the maximum change from this value during a 0.5-s window following electrical stimulation (41). This normalization of the amount (%) of change in activity/fluorescence of any given region of interest could then be compared by a paired t-test for drug effects on the response to electrical stimulation (P < 0.05 criteria). Although absolute changes in fluorescence tended to be rather small, they were comparable to other fluctuations observed in brain stem slices (49).
Patch-clamp recording.
For stimulation protocols that resulted in time-locked evoked postsynaptic currents (PSCs), we calculated latency, peak amplitude, and jitter. We first calculated peak current for the ascending stimulation series to determine whether “singular” events were being recorded, i.e., whether the evoked current increased with increasing stimulation values (4, 68). Response latency was measured as the interval between the peak of the stimulus artifact and the point at which the evoked PSCs exceeded the maximum level of noise during the baseline period (25). For those neurons in which there was no increase in current magnitude, we calculated jitter (standard deviation of the latency values) and failure rate. Failure rate was calculated as 1) failure to respond to single pulses at 1 Hz and 2) failure to respond to two closely spaced pulses at 100 Hz (25). Latencies were calculated for 10–20 repeated trials taken from single-pulse trials or from the first pulse of a stimulus train in normal ACSF. In several neurons, latencies were calculated in the presence of drug antagonists.
In addition to time-locked evoked PSCs, we frequently encountered non-time-locked miniature PSCs (mPSCs) that increased in frequency following stimulation, especially after train stimulation. These PSCs were analyzed using Mini Analysis software (Synapatosoft, Fort Lee, NJ). The criterion for including a given current in the count was a rapid, uninterrupted rise time followed by a slow exponential decay (16). We determined a stimulus effect by comparing the number of spontaneous PSC (sPSC) currents (no rNST stimulation) with the number of evoked mPSCs following stimulation (P < 0.05 by Student's 2-sample t-test). In some neurons, we evaluated the significance of the evoked response by calculating the regression between the number of evoked events and the stimulation intensity. We also evaluated the effects of drugs on sPSCs and evoked mPSCs by comparing the number of currents with and without stimulation in normal ACSF with spontaneous and evoked currents in the presence of drugs. Counts of the various currents were scored by an investigator who had no knowledge of drug treatment.
Neuron Reconstruction
Slices from which patched cells were recorded were removed from the chamber and fixed in 10% formalin for ≥24 h. Slices were then mounted on gelatin-coated slides, dried, and mounted with mounting medium (Vectashield, Vector Laboratories, Burlingame, CA). Lucifer yellow-filled cells were imaged with an upright microscope (Axioscope-2, Zeiss). Z stacks were viewed with epifluorescence using Axioview software in 2.5-μm steps at ×20 magnification to capture the dendritic field of each neuron. Z stacks were saved and imported into Neurolucida (Microbrightfield, Williston, VT) for reconstruction. We plotted the location of reconstructed neurons on standard sections and measured cell size (area), form factor, number of primary dendrites, number of dendritic endings, and total dendritic length (Neuroexplorer, Microbrightfield).
Computational Model
We have modified and extended our previous computational model of a switch between licking and gaping (87) to include several empirical observations made in the present study. As described previously (87), we consider a minimal single-compartment, conductance-based model of a bursting neuron to represent a class of preoromotor neurons: 1) P, 2) R, and 3) O. Each model neuron includes leak, potassium and calcium currents, and a calcium-dependent potassium current (IKCa) that allows for bursting oscillations. The system of ordinary differential equations for each cell and values of individual parameters are listed in the appendix (Tables A1 and A2). Simulations were performed using XPPAUT software (26).
Table A1.
Equations of the model
| Single-cell equations | ||
| Membrane potential (V) |  |
|
| Channel kinetics variable for K+ (w) |  |
|
| Intracellular Ca2+ concentration (Ca) |  |
|
| Synaptic coupling variable (s) |  |
|
| Intrinsic membrane currents | ||
| K+ leak (IL) |  |
|
| Ca2+ (ICa) |  |
|
| Delayed rectifier-type K+ (IK) |  |
|
| Ca2-activated K+ (IKCa) |  |
|
| Synaptic input currents | ||
| Inhibition from PRGly to R (IsynR) |  |
|
| Inhibition from RPGly and RPGABA to P and excitation from P′ (IsynP) |  |
|
| Inhibition from RPGly and RPGABA to P′ and excitation from P (IsynP′) |  |
|
| Excitation from R (IsynRPGABA) |  |
|
| Excitation from R and inhibition from RPGABA (IsynRPGly) |  |
|
| Excitation from P and P′ (IsynPRGly) |  |
|
| Nonlinear functions | ||
 |
||
 |
||
 |
||
 |
||
 |
Intracellular Ca2+-dependent variable | |
Table A2.
Parameter values used for lick and gape solutions
| Parameter | Description | Value |
|---|---|---|
| Cm | Membrane capacitance | 1μF/μm2 |
| VL | Leak reversal potential | −60mV |
| VCa | Ca2+ reversal potential | 120mV |
| VK | K+ reversal potential | −84mV |
| gL | Maximal leak conductance | 2nS/μm2 |
| gCa | Maximal Ca2+ conductance | 4nS/μm2 |
| gK | Maximal K+ conductance | 8nS/μm2 |
| gKCa | Maximal Ca2+-activated K+ conductance | 0.25nS/μm2 |
| Vin | Reversal potential for inhibitory synapses | −100mV |
| gin | Maximal conductance for inhibitory currents in R, P, and P′ | 0.027nS/μm2 |
| Vex | Reversal potential for excitatory synapses between P and P′ | 100mV |
| gex | Maximal conductance for excitatory currents between P and P′ | 0.01nS/μm2 |
| VexA | Reversal potential for excitatory synapses from R to RPGABA, RPGly and from P and P′ to PRGly | 20mV |
| gRPGABA | Maximal conductance for excitatory currents from R to RPGABA | 0.5nS/μm2 |
| gRPGly | Maximal conductance for excitatory currents from R to RPGly | 1nS/μm2 |
| gRPGlyin | Maximal conductance for inhibitory currents from RPGABA to RPGly | 5nS/μm2 |
| gPRGly | Maximal conductance for excitatory currents from P, P′ to PRGly | 1nS/μm2 |
| α | Rise rate of excitatory and inhibitory synaptic coupling variable | 2nS/μm2 |
| β | Decay rate of excitatory and inhibitory synaptic coupling variable | RPGABA→0.025 |
| Othercells→0.05 | ||
| ε | Constant | R→0.0014;P,P′→0.002 |
| κ | Constant | 0.02 |
| θ | Constant | −15 |
| φ | Constant | R,P,P′→0.23 |
| RPGABA,Gly,PRGly→5 | ||
| μ | Constant | 0.02 |
| a | Constant | R, P, P′ → 12 |
| RPGABA,Gly, PRGly → 0 | ||
| b | Constant | R, P, P′ → 17.4 |
| RPGABA,Gly, PRGly → 5 | ||
| I | Constant excitation from group 1 rNST neurons | 45.1 nA |
| Igape | Phase switching excitation to RPGABA posited from group 2 rNST neurons | 0 → licks |
| 21.05nA→gapes | ||
| Iionic | Tonic inhibition to P′ posited from group 3 rNST neurons | 3nA→licks |
| 0.91 nA → gapes |
Gly, glycinergic; GABA, GABAergic; rNST, rostral nuclus of solitary tract.
The extended model includes several classes of interneurons suggested by the results of the present study, including a subclass of protrudor and opener interneurons (P′ and O′) that incorporate the concept of recruitment during the switch of network activity from licks to gapes and GABAergic (RPGABA) and glycinergic (RPGly and PRGly) neurons to represent realistic reciprocal inhibitory connections between R and P. Similar interneuron connections exist between R and O. These connections are postulated on the basis of studies on vertebrate locomotion (14, 15) and rhythmic mastication (43). These additional cells are modeled similarly to R, P, and O, but, for simplicity, they do not include an IKCa; hence, there is no equation for intracellular calcium.
On the basis of the present results, three types of rNST inputs to the lick-gape network have been considered: 1) I represents mono- and polysynaptic glutamatergic excitatory inputs to cells R, P, and P′ from group 1 rNST neurons, 2) Igape represents polysynaptic GABAergic inhibition to P by group 2 rNST neurons that might originate, e.g., from bitter sensitive/gape-inducing neurons (30), and 3) Itonic represents a tonic GABAergic inhibition to P′ that can be shut off by group 3 rNST neurons (also potentially bitter sensitive/gape producing) via a disinhibition pathway (18).
RESULTS
Calcium Imaging
Injections of fluorescent microspheres into the mXII of P7–P12 rat pups labeled a dense population of neurons in the IRt, with fewer neurons in the more lateral parvocellular RF and rNST (Fig. 1). This pattern was identical to that observed in adult rats (85). Two such preparations were used for the calcium imaging studies. From these preparations, we obtained 4 slices from which we observed the activity of 34 retrogradely labeled neurons in the RF subjacent to the rNST.
Figure 2C shows an example of two retrogradely labeled neurons that incorporated calcium green. One of these two retrogradely labeled neurons gave a modest response to electrical stimulation of the rNST (Fig. 3A). When SR-95531 was added to the bath, the response to rNST stimulation was greatly enhanced: there was a response to all four stimulation trains, and they were of larger magnitude. In Fig. 3B, the results of electrical stimulation from a well-labeled calcium green profile (Fig. 2C) that was not double labeled are shown. The size and shape of this calcium green dye-filled profile suggest that the cell was a neuron, but not a neuron that necessarily projected to the mXII. Nevertheless, rNST simulation temporarily suppressed the spontaneous oscillations (Fig. 3B). SR-95531 reduced the spontaneous oscillations but did not block the suppression of calcium flux following stimulation. After 15 min of washout in ACSF, both cells partially recovered. The partial washout of the cell was seen as a small response to the third stimulation train and no response to the fourth train, which is quite different from the response under SR-95531. In addition, although the peak response to the first two trains following washout remained similar to the enhanced response to SR-95531, the durations of the responses were shorter. The partial recovery of the inhibitory response was manifested as the beginning of a return of oscillatory baseline activity toward the end of the trial. Thus the effects of blocking GABAA receptors enhanced the excitatory response in one neuron but failed to suppress inhibition in the other, suggesting the presence of non-GABAAergic pathways. Instances of inhibition were rare, and all the responses of the 34 double-labeled neurons to stimulation of the rNST shown in Fig. 4 were excitatory. The responses of five neurons to rNST stimulation before and after bath application of SR-95531 are shown in Fig. 4, inset. Of the five neurons, N2, N4, and N5 showed no response before SR-95531. After SR-95531, responses of all five neurons were enhanced. Averaged across the population of 34 neurons, SR-95531 increased the peak ΔF/F following stimulation from 1.1% to 2.5% (P < 0.001, paired t-test; Fig. 5), a nearly 1.3-fold increase. In three slices (20 neurons), strychnine applied to the bath after SR-95531 further increased mean peak ΔF/F by 68.9%, to 4.2% (P < 0.001 by paired t-test). A washout period of 15 min following SR-955331 or strychnine produced a partial recovery in peak response. The peak response to strychnine or SR-95531 was reduced by 41% (P < 0.033 by paired t-test).
Fig. 2.
A: calcium green incorporation in cells in the intermediate zone of medullary RF. B: 2 retrogradely labeled neurons in the same field (pseudocolored). C: superimposition of A and B.
Fig. 3.
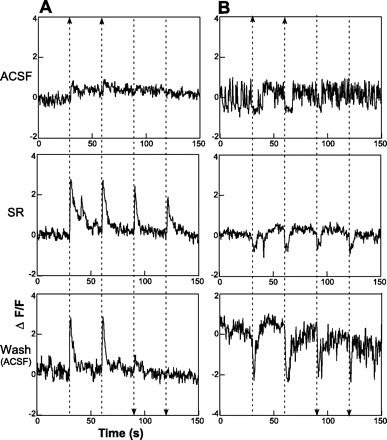
A: Ca2+ response of retrogradely labeled neuron shown in Fig. 2C (triple arrow) to a train of pulses delivered to the rNST at 30, 60, 90, and 120 s (arrowheads). A small response was evoked at 30 and 60 s. In the presence of the GABAA antagonist SR-95531 (SR), the response was larger, and responses at 90 and 120 s were evident when polarity between the 2 electrodes was reversed. Response began to return to baseline following 15 min of washout in artificial cerebrospinal fluid (ACSF). B: a second putative nonprojection neuron from Fig. 2C (double arrow) oscillated spontaneously before electrical stimulation, a response that was momentarily suppressed following electrical stimulation at 30 and 60 s. “Inhibitory” response was more pronounced following SR-95531. F, fluorescence intensity within an area of interest (e.g., outline of an RF neuron) averaged over the 3 s before stimulation; ΔF, change from F during a 0.5-s window following electrical stimulation.
Fig. 4.
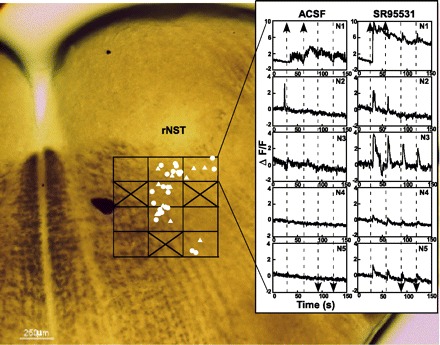
Map showing location of 34 retrogradely labeled neurons in RF subjacent to rNST that responded to rNST stimulation. Triangles, neurons that only responded in the presence of SR-95531; filled circles, neurons that responded to rNST stimulation in the presence of ACSF; ×, tested fields with no labeled neurons. Inset: response of 5 neurons (N1, N2, N3, N4, and N5) in top right quadrant of the map to electrical stimulation in ACSF and SR-95531 at 30, 60, 90, and 120 s (vertical dashed lines; spike in Ca2+ of N2 in ACSF was spontaneous and occurred several seconds before rNST stimulation). Responses were clearly enhanced following SR-95531. Direction of arrow indicates reversal of polarity of stimulating electrode in rNST.
Fig. 5.
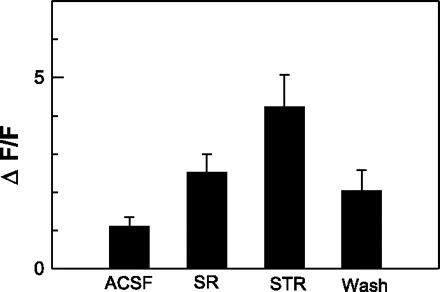
Mean peak response (%change of Ca2+) across 34 neurons following stimulation of rNST. Peak response was measured for each neuron as change in Ca2+ from baseline just preceding stimulation to the peak observed within 0.5 s after stimulation. SR-95531 significantly enhanced increase in Ca2+ across all 34 neurons. In 20 neurons, addition of strychnine (STR) to SR-95531 resulted in significantly higher-amplitude responses. After 15 min of washout in ACSF, responses began to return to baseline.
The results of the calcium imaging studies indicated that the RF subjacent to the rNST could be activated by stimulation of the overlying rNST. Many responses were modulated by inhibitory amino acid receptor antagonists, indicating that the responses were postsynaptic, rather than a result of direct electrical stimulation. In addition, it appeared that many of the RF neurons were under tonic inhibition. Despite this specificity, the relatively low temporal resolution afforded by live-cell imaging did not allow us to infer whether responses were mono- or polysynaptic.
Patch-Clamp Experiments
Whole cell patch-clamp recordings were obtained from 94 neurons in the RF subjacent to the rNST. Of these, 51 responded to stimulation of the rNST and 34 of these were retrogradely labeled. Five neurons appeared to be nonprojection neurons, and the projection status of another 12 cells was unknown because of failures to inject mXII. The results of the patch studies presented below are drawn exclusively from retrogradely labeled neurons. Figure 6 shows a double-labeled neuron under DIC optics and fluorescent filters to reveal the retrograde label and the Lucifer yellow from the patch pipette following recording; a double exposure shows the retrograde label and the Lucifer yellow at the conclusion of the experiment.
Fig. 6.
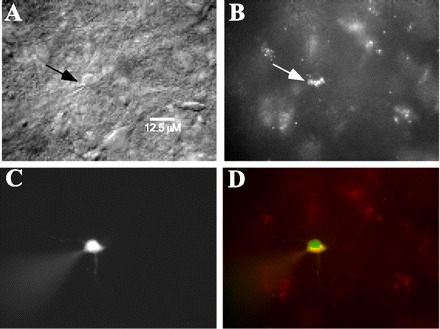
Photomicrographs of a retrogradely labeled neuron (arrows) in intermediate zone of RF under differential interference contrast optics (A) or a fluorescent filter (B). Cell was patched and filled with Lucifer yellow (C), and double exposure (D) shows Lucifer yellow together with rhodamine-labeled fluorescent microspheres.
Location and Reconstruction of Recorded Neurons
Twenty-two of the 34 driven projection neurons and 18 of the 25 nondriven projection neurons were reconstructed and localized within the RF. There was no obvious difference in the location of driven vs. nondriven neurons, and both types were intermingled within the dorsal region of the IRt. Figure 7 shows the reconstruction of nine driven neurons and six nondriven neurons from the most rostral level of the RF from which we recorded. An additional 13 driven and 12 nondriven neurons were similarly reconstructed at more caudal levels.
Fig. 7.
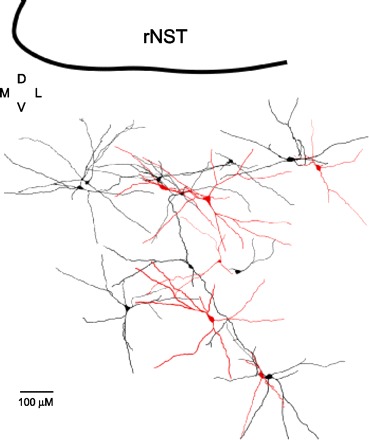
Reconstruction of 9 neurons activated by rNST stimulation (black) and 6 neurons that did not respond (red) were intermingled in RF subjacent to the rNST. M, medial; D, dorsal; V, ventral; L, lateral.
Driven and nondriven projection neurons were not differentiated by mean cell (soma) size or form factor. Mean soma area was 210.7 μm2 (SEM 27.1) for driven neurons and 180.1 μm2 (SEM 25.3) for nondriven neurons. The mean form factor was 0.65 for driven neurons and 0.66 for nondriven neurons, a value approximately midway between that of a circle (0) and a neuron with a completely flattened profile (1). Driven and nondriven neurons were multipolar, with extensive dendrites, but were not differentiated by the number of primary dendrites (mean 3.8 for driven and 4.3 for nondriven), number of dendritic endings (mean 8.5 for driven and 9.3 for nondriven), or total dendritic length (mean 1,309 μm for driven and 1,268 μm for nondriven). Dendrites radiated in all directions, sometimes extending in the direction of the rNST, but only rarely extending into it. These neurons thus appeared similar in overall shape and size to parotid gland parasympathetic preganglionic neurons, which are also located in the dorsal medullary RF (28). Although the number of primary dendrites and dendritic endings was similar to the number of parotid gland neurons, the overall length of the prehypoglossal interneurons appeared considerably longer than that of parotid neurons (mean length 1,309 vs. 660 μm).
Cell Classification
Responses to electrical stimulation of the rNST produced short-latency time-locked PSCs (Fig. 8, A and C) and/or longer-latency mPSCs (Fig. 9). In the case of mPSCs, a systematic pattern in the time course of the response was sometimes, but not always, observed. For example, the excitatory response in Fig. 9C shows a slow adaptation of the mPSCs over the first 1.5 s of the response, but the inhibitory response in Fig. 9D was stable over the same period. We categorized identified retrogradely labeled neurons into those with excitatory responses (n = 18), those with inhibitory responses (n = 4), and those with mixed responses, i.e., dual excitatory and inhibitory currents (n = 12). Because a subset of the neurons classified as purely excitatory (n = 6 of 18) or inhibitory (n = 1 of 4) were further challenged with glutamate or GABAA antagonists, it is unlikely that there were “hidden” currents that were not observed. For those neurons not tested, however, additional currents remain a possibility.
Fig. 8.
A: minimal variation of latency of an inward current (excitatory) in response to electrical stimulation of rNST across 5 replications. B: relatively invariant response of peak excitatory current of patched neuron in A to electrical stimulation of rNST at varying intensities. C: variable response latencies of a second RF neuron.
Fig. 9.
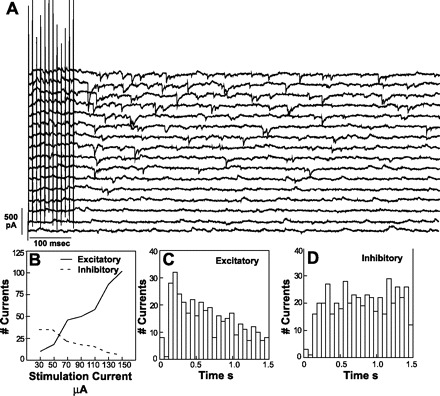
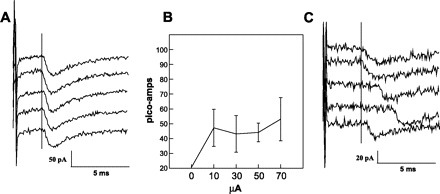
A: increase in frequency of non-time-locked postsynaptic currents (PSCs) with increasing stimulating currents of rNST (100 Hz, 0.1-ms pulse width). From bottom to top of raster display, 2 traces are shown at each of 8 stimulation intensities, starting at 0 stimulation current and followed by 30–150 μA in 20-μA increments. B: number of excitatory currents increased as inhibitory currents decreased at increasing rNST stimulation intensities. Number of evoked excitatory currents (C) was slightly greater than number of inhibitory currents (D)immediately after train stimulation.
Application of receptor antagonists was required for observation of both inputs in 6 of the 12 dual neurons. Because of an excitatory time-locked PSC in ACSF, five of these six neurons required a glutamatergic antagonist for observation of a time-locked inhibitory PSC (n = 4) or an increase in driven inhibitory mPSCs (n = 1). One additional neuron that was unresponsive in ACSF responded with an excitatory PSC in the presence of a GABAA antagonist and an increase in inhibitory mPSCs following application of a glutamate antagonist. Six neurons did not require receptor antagonists for observation of the presence of driven excitatory and inhibitory currents. These dual currents could be time-locked (n = 4; Fig. 10), non-time-locked (n = 1; Fig. 9), or time-locked for one polarity and non-time-locked for the other (n = 1). Excitatory time-locked currents preceded the inhibitory current in three of four neurons (Fig. 10). Of the four neurons with dual time-locked currents, three showed increases in excitatory mPSCs following stimulation and two of these also had driven inhibitory mPSCs.
Fig. 10.
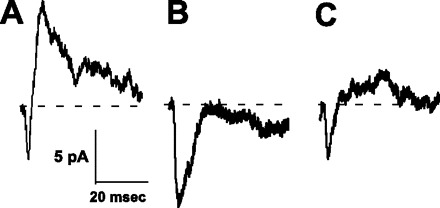
Excitatory and inhibitory currents evoked by single pulses (average of 35 pulses: 0.1 ms, 50 μA) to rNST (A). Inhibitory current is suppressed in the presence of bicuculline (B) and begins to return during washout (C).
Evoked Currents Following rNST Stimulation
Time-locked evoked currents.
In 23 neurons, rNST stimulation produced 25 time-locked currents that were determined to have originated from a single (unitary) source: the size of the evoked current did not change with increasing stimulation current, suggesting the lack of recruitment of additional inputs (4, 68) (Fig. 8B). Instances in which current amplitude increased with increasing rNST stimulation in a graded fashion were not included in the analysis, inasmuch as variation in the latency (jitter) could reflect different inputs and, thus, obscure interpretation of jitter as an index of potential monosynaptic input.
The latencies of excitatory currents with unitary inputs ranged from 2.2 to 9.1 (mean 4.4) ms (Fig. 11A). Jitter for excitatory currents ranged from 0.097 to 2.53 ms (Fig. 11B). The mean latency of the six inhibitory currents, 5.2 ms, was slightly longer than that of excitatory currents, but the small number precluded statistical comparison. Jitter for inhibitory currents ranged from 0.2 to 2.4 ms. Overall, there was a significant correlation between latency and jitter (Fig. 11C; r = 0.66, P < 0.001). Latency, however, did not correlate with the distance between the stimulating electrode and the recorded neuron (r = 0.1, P > 0.6). The mean distance between the two electrodes was 713 (range 397–1,173) μm.
Fig. 11.
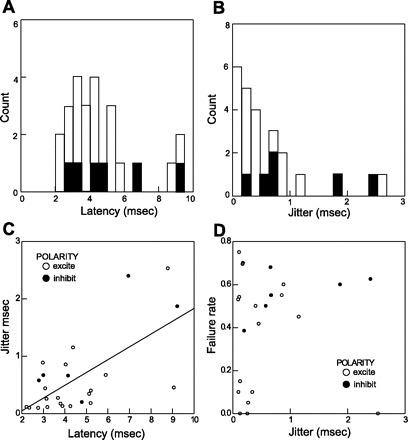
A: latency distribution of unitary excitatory currents (open bars) and unitary inhibitory currents (solid bars). B: distribution of jitter indicates a bimodal distribution with a break point at 0.5 ms. C: latency to respond is significantly correlated with increase in jitter. D: jitter of excitatory and inhibitory currents plotted against failure rate shows a population of low-jitter low-failure-rate neurons.
The distribution of jitter measurements had a somewhat bimodal appearance, and we took the break in the distribution at ∼0.5 ms to be our criterion for mono- vs. polysynaptic activation (Fig. 11B). This break point is midway between a point used to differentiate mono- and polysynaptic input in a thalamocortical pathway (68) and a point proposed for differentiating inputs onto second-order caudal solitary nucleus neurons (25). When jitter was plotted against the ability of a neuron to respond to single pulses (1/s), a cluster of neurons with low jitter and low failure were observed (Fig. 11D). When jitter was plotted against failure to follow two closely timed pulses (100 Hz), these same cells showed relatively low failure rates, but the distinct clustering was not as evident (not shown). None of the inhibitory currents were in the low-jitter, low-failure cluster; however, one inhibitory current did have a relatively low jitter value, indicating the possible presence of inhibitory monosynaptic input from the rNST.
Miniature non-time-locked currents.
In addition to time-locked PSCs, significant increases in excitatory mPSCs were also observed in 8 of 18 excitatory-only neurons during the 3-s period following a 100-Hz stimulus train (P ≤ 0.001 for all). For five of these cells, there was also a significant correlation (P < 0.05) between stimulus intensity and the number of mPSCs. In 5 of the 12 dual-input neurons, the number of excitatory mPSCs (P < 0.05) following train stimulation was significantly increased, and in three of these, inhibitory mPSCs were also significantly increased (P < 0.03).
rNST stimulation also caused decreases, as well as increases, in non-time-locked PSCs. These decrements usually involved inhibitory currents, thus providing evidence for disinhibition. In two dual-input neurons, there was a decrease in the number of inhibitory currents as stimulation intensity in the rNST increased (P < 0.04) and, in one of these neurons, a concomitant increase in the number of excitatory currents (Fig. 9, A and B). In one other neuron, increased stimulation of the rNST was associated with a decrease in excitatory non-time-locked PSCs.
Receptor Antagonist Effects
Application of ionotropic glutamate antagonists was highly effective in suppressing excitatory currents. CNQX (20 μM) completely suppressed excitatory currents in 7 of 10 neurons, and CNQX + MK-801 completely suppressed excitatory currents in 7 of 7 other neurons. The combined effects of these two treatments are shown in Fig. 12 (91% mean suppression; P < 0.001 by ANOVA). In two neurons, CNQX (20 μM) also completely suppressed evoked mPSCs. All five of the low-jitter low-failure currents were completely blocked with ionotropic glutamate antagonists, as were all six of the other low-jitter currents.
Fig. 12.
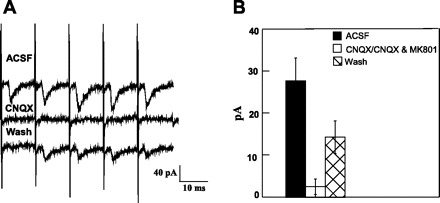
A: excitatory current (ACSF) blocked with the glutamate receptor antagonist blocker 6-cyano-7-nitroquinoxaline-2,3-dione (CNQX) with some recovery following 15 min of washout (Wash). B: mean peak response across 17 neurons was suppressed by CNQX (n = 10) or CNQX + MK-801 (n = 7).
The GABAA antagonists bicuculline and SR-95531 significantly suppressed time-locked inhibitory currents. Across the time-locked inhibitory currents tested, GABAA antagonists reduced the evoked current by a mean of 70.8% (n = 6, P < 0.01 by paired t-test; Fig. 13A). Similarly, in neurons with evoked inhibitory mPSCs, GABAA antagonists significantly reduced the number of driven inhibitory mPSCs by a mean of 55.6% (n = 2).
Fig. 13.
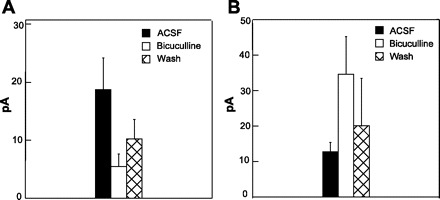
A: mean peak inhibitory current is significantly suppressed by bicuculline (P < 0.05). B: mean response of excitatory currents is significantly enhanced in the presence of bicuculline (P < 0.044).
One of the most pronounced findings of the calcium imaging studies was the increased amplitude of driven excitatory responses or the discovery of unseen excitatory evoked responses in the presence of a GABAA antagonist. Similar results were obtained with the patch-clamp studies. Increases in the magnitudes of fixed-latency PSCs were observed in five of eight neurons, with a mean increase of 172% in peak current response following bicuculline or SR-95531 (P < 0.04 by paired t-test; Fig. 13B). In addition, two of four neurons with rNST-evoked excitatory mPSCs showed further increases in the number of mPSCs following bicuculline (P < 0.02).
Network Simulations
Solutions of the computational model showing the two-phase lick pattern and the three-phase gape pattern are shown in Fig. 14. For the lick pattern, we set the excitatory rNST input I to a suitable positive value (Table A2) and the other two rNST inputs, Igape and Itonic, to zero. When only the I current is active, reciprocal glycinergic-like inhibition between R and P produces a lick pattern in the output voltages VR and VP, respectively (Fig. 14B). We note that O and P fire in synchrony, because both are released from inhibition from R at the same time. This is also true for the gape pattern, so, for simplicity, we will ignore O.
Fig. 14.
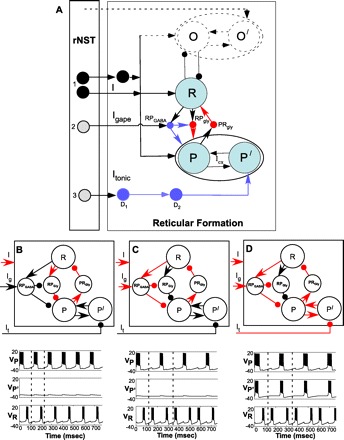
A: schematic of architecture of extended model. Network consists of 3 classes of preoromotor neurons: pre (tongue) protrudor (P), pre (tongue) retractor (R), and pre (jaw) opener (O). Protrudor and retractor interneurons recruited during gapes via disinhibition are designated P′ and O′, respectively, and are modeled as reciprocally connected through excitatory synapses. GABAergic (RPGABA) and glycinergic (RPGly and PRGly) interneurons provide coupling between P and R. Similar interneurons between O and R are included in the dynamic model but are not shown in detail. Neurons in rNST projecting to the network include mono- and polysynaptic excitatory projections originating from neurons responsive to taste stimulation (group 1). Neurons exclusively responsive to bitter stimuli that evoke gapes behaviorally include group 2 rNST neurons, which provide GABAergic currents to P (and O, not shown) via a polysynaptic pathway, and group 3 rNST neurons, which disinhibit P′ (and O′, not shown) neurons via polysynaptic inhibitory pathways (D1 and D2). Blue, GABAergic inhibitory interneurons; red, glycinergic interneurons. I, excitatory input. B: when only “I” current is active, reciprocal inhibition between R and P via glycinergic-like inhibitory decay kinetics produces a lick pattern in the output voltage of P (Vp) and R (VR); i.e., they are out of phase. C: when Igape (Ig) current is added, such as when a bitter stimulus activates a subset of rNST neurons, GABAergic interneuron (RGGABA) provides an inhibitory current with a longer delay, which induces a gapelike pattern between VP and VR. D: when I tonic (It) current is suppressed, releasing P′ interneurons, a pattern of recruitment is seen; i.e., VP′ bursts in phase with VP, providing a larger excitatory input to protrudor motoneurons. In B, C, and D, activated currents and (nonprojection) interneurons are shown in red. Bottom left: voltage traces corresponding to a lick pattern; bottom middle: gape pattern when the interneuron P′ is not activated; bottom right: gape pattern when P′ is activated.
To switch the pattern to three-phase gapes, we posit the additional activation of a GABAergic interneuron RPGABA via the group 2 rNST input Igape. We speculate that RPGABA inhibits RPGly, turning it off during gapes. When the Igape current is added, such as when a bitter stimulus activates a subset of rNST neurons, RGGABA provides an inhibitory current that is twice as slow as the decay of inhibition from RPGly to P and O. As described previously (87), this slower decay in inhibition allows for the gapelike pattern between VP and VR, i.e., retraction-protrusion-retraction (Fig. 14C). During licks, however, setting Igape equal to zero turns off RPGABA. In this case, excitatory input from R is not sufficient to recruit RPGABA neurons.
Because the present study provides evidence of disinhibition at a cellular level that complements previous behavioral pharmacological results (18), we incorporated disinhibition into the model. As discussed earlier, P′ is under tonic inhibition due to Itonic and, hence, remains inactive during licks. During gapes, we posit that activation of group 3 rNST neurons can activate the inhibitory interneuron D1, which, in turn, inhibits D2; this leads to disinhibition of P′ from tonic inhibition. Computationally, this mechanism is simulated by reducing Itonic to P′. Since P′ and P represent the same class of neurons driving the tongue protrudors, we assume mutual excitatory connections between them. During gapes, P can recruit P′, thus producing in-phase activity. This recruitment of additional preprotrudor interneurons P′ (Fig. 14D) thus drives protrudor motoneurons to produce the large-amplitude gape response.
Using multiple simulations, we tested sensitivity of the two patterns to variations in two additional parameters: Igape and Itonic. These parameters initiate pattern switching and enable recruitment of the additional protrudor interneurons (i.e., P′), respectively. We obtained robust lick and gape patterns over a wide range of values for both of these parameters. For example, a 20% change in Igape from its default value of 21.05 produced a robust gape pattern. For licks, Igape ranged from 0 to 13.2, and the former value was used for the simulations.
DISCUSSION
This study provides functional evidence for projections from the rNST to identified prehypoglossal neurons in the RF. Although there is a substantial amount of anatomic data, to our knowledge, this is the first study to physiologically demonstrate direct synaptic coupling. There is evidence for excitatory and inhibitory projections through mono- and polysynaptic pathways. As suggested by the calcium imaging studies, many of the prehypoglossal neurons appear to be under tonic inhibition, which masks excitatory inputs from the rNST. Some of this tonic inhibition may originate from or may be modulated by output from the rNST. This is evident from the significant number of neurons that received excitatory and inhibitory input from the rNST, as well as those neurons in which rNST stimulation diminished inhibitory currents in the prehypoglossal neurons. This complex synaptic interface may serve as a substrate for taste signals from the rNST to influence preoromotor neurons involved in the rhythmic oromotor activity of ingestion and rejection.
Technical Considerations
Developmental issues.
The goals of the present study were to examine synaptic connections between the rostral (gustatory) NST and the subjacent RF, which is strongly implicated in the production of consummatory ingestion and rejection behaviors. Furthermore, we sought to record from identified prehypoglossal projection neurons that are likely to be involved in mediating these behaviors. Because the RF quickly becomes myelinated during development, obscuring the identification of retrogradely labeled neurons, it was necessary to establish a time window within which we could record from identified neurons. We established that we could visualize live fluorescently labeled prehypoglossal neurons up to P12 and that the pattern of RF labeling was identical to that observed in the adult rat (85).
On the sensory side of the circuit, early studies indicated that glossopharyngeal input to the NST was still developing at P12 but that chorda tympani nerve input to the rNST was more fully developed (50). More recent studies, however, suggest that the chorda tympani and glossopharyngeal nerve terminal fields are maximally large at P15 and become smaller as they are pruned during development (58). The exact state or primary afferent development during our time window has not been precisely described, but this is clearly a time of developmental changes. In addition, in vitro physiological studies of developing neurons in the rNST also show significant differences compared with adults. For example, although rNST GABAergic receptors are hyperpolarizing as early as P0–P7, the rise and decay times of inhibitory potentials were slower in the younger animals than in the adults (34). Because we previously demonstrated in simulations using our dynamic model that inhibitory time constants can have a profound influence on the generation of motor patterns (87), additional study is required to clarify the potential significance of these time constants. Despite these developmental differences, it should be stressed that the rNST-RF-motor nuclei circuit appears functional in young animals. A study of oromotor responses following gustatory stimulation in rats as early as P2 showed differential responses to preferred and nonpreferred gustatory stimuli (29). Although another study indicated that rats did not develop oromotor aversion responses to QHCl until P12 (38), we confirmed that discrimination based on oromotor responses is evident by P5 (61). In short, the P7–P12 slice preparation is a valid model for analysis of taste-motor discrimination mechanisms organized in the lower brain stem.
Injection sites.
Pressure injections of fluorescent microspheres were relatively restricted, but some injection sites encroached minimally on the overlying DMN and, to an even lesser extent, on the cNST. Thus some retrograde label could potentially reflect innervation of these structures (42), although most tracing studies describe such projections as “scattered” (57, 67) or nonexistent (78), in stark contrast to the dense “nuclear-like” projections from the IRt to mXII (85). Because our injections were based on coordinates from obex and guided by microstimulation, they tended to be in the same location across animals. As a result, neither the extreme rostral nor caudal ends of the nucleus were specifically targeted. However, all functional lingual muscle groups were likely represented across our sample. Most injections involved multiple motoneuron compartments; e.g., the injection in Fig. 1 labeled the ventral and midline compartments, containing motoneurons innervating extrinsic lingual protrudor and intrinsic lingual muscles, respectively (1, 82). In addition, because hypoglossal neuron dendrites ramify extensively in the dorsal-ventral axis, as well as longitudinally along the rostral-caudal axis, it is likely that virtually all injections included terminals on the dendrites of motoneurons innervating a variety of lingual muscles (2, 65). Thus we did not try to functionally tag IRt neurons as “preprotrudor” or “preretractor” on the basis of which mXII compartments were or were not injected. By the same token, although we did not include rNST-driven nonretrogradely labeled neurons in our analysis, these may well be failures of omission, inasmuch as failure to retrogradely label a neuron could well reflect failure of the injection to include all terminals.
Stimulation sites.
The stimulating electrode was placed in the “center” of the solitary nucleus (see methods). In a transverse (coronal) section under bright-field optics, the nucleus appears translucent compared with the more heavily myelinated RF (Fig. 1; also see Fig. 1 in Ref. 10). Our observations suggest that this placement included the central subdivision of the nucleus and the dorsal portion of the ventral subdivision (90). Because neurons in both compartments project to the subjacent RF (39), stimulation at this location likely activated some neurons with projections to the RF. In the awake adult rat, similar placements are effective in producing licking and gaping in response to electrical stimulation (48). Although the ventral subdivision of the rNST has the greatest number of direct projections to the ventral RF (39), we deliberately avoided a more ventral placement to minimize direct activation of RF neurons that have dendrites extending in that direction. Nevertheless, in several instances, we observed direct neuronal stimulation, as evidenced by very short-latency action potentials (current clamp) or action currents (voltage clamp) that were refractory to glutamate antagonists. Such neurons were excluded. All the currents included in the present results had latencies consistent with at least one synapse, and almost all tests with receptor antagonists revealed some diminution of response. Moreover, there was no correlation between latency and the distance of the stimulating electrode from the recorded neuron, and we observed a number of inhibitory currents that would be difficult to explain by direct (dendritic) stimulation. Several attempts to activate RF neurons in the calcium imaging studies by placement of the stimulating electrode on the solitary tract were ineffective. Although neurons within the rNST were activated, we did not observe responses in the subjacent RF. It seems most likely, therefore, that activation of RF neurons was mainly achieved by stimulation of rNST output neurons and/or rNST interneurons. Polysynaptic responses could involve activation of rNST interneurons that contacted an output neuron or an output neuron that contacted an RF interneuron.
We cannot entirely rule out that electrical stimulation of the rNST may have activated axons traversing the nucleus en route to the subjacent RF. Such fibers have not been systematically characterized but could include projections from the parabrachial nucleus, the hypothalamus, the amygdala, and the cortex (17, 55, 70, 71, 92). Whether such pathways actually course through the rNST en route to the RF is unknown, but some data suggest that even if they do, they are probably not fully developed in the P7–P12 window. For example, oxytocinergic projections from the hypothalamus to the cNST and DMN are only ∼50% developed between P6 and P12 (66). Nor are descending somatomotor pathways influencing ingestive responses fully developed by P12 (7). Nevertheless, pharmacological activation of the rNST could more definitively eliminate these potential fibers of passage as sources of RF activation (21).
Mono- and polysynaptic connections.
Some of the projections from the rNST to prehypoglossal interneurons appeared to be monosynaptic. In particular, a group of neurons that responded with short-latency excitatory currents had both low jitter and low failure rates. Doyle and Andresen (25) concluded that jitter was the best metric for determining a monosynaptic connection and that anatomically defined second-order NST neurons with low jitter could still have relatively high failure rates and long latency. If we just consider the distribution of jitter values in the present study, the break in the distribution at ∼0.5 ms may be an indicator of mono- vs. polysynaptic connections. Although our jitter values were higher than those reported in the cNST, where monosynaptic connections from the solitary tract were shown to have jitter values <0.1 ms, the break in the distribution at ∼0.5 ms is not inconsistent with values from the auditory cortex, where jitter values <1.0 ms were used to distinguish between mono- and polysynaptic connections from the thalamus (68). Whether our low jitter responses coupled with higher failure rates also indicate monosynaptic connections is more problematic. Many RF neurons had relatively high failure rates, as evidenced by the single-pulse test (Fig. 11) or the ability to follow two closely timed pulses (not shown). The efficacy of trains over single pulses has also been observed in the adjacent rNST (33, 34, 36). This may reflect the need for sustained neural activity from the rNST to activate RF circuitry, a mechanism similar to that proposed for solitary tract stimulation of the rNST (33).
Most of the putative monosynaptic currents were excitatory and glutamatergic. This is consistent with several studies that have characterized rNST neurons as glutamatergic (31, 74, 75, 85). There was considerably less evidence for monosynaptic inhibitory connections. A low jitter value, indicative of a monosynaptic connection, was obtained in only one neuron and was not in the low-failure category. Thus the majority of inhibitory currents observed were likely through polysynaptic pathways. Complicating this interpretation, however, was the failure to block most inhibitory currents using glutamate antagonists. In the cNST (72) and rNST (35), the presence of inhibitory interneurons was inferred from blockade of inhibitory currents with glutamate antagonists. In the present studies, however, glutamate antagonists suppressed inhibitory currents in only one neuron. In the other neurons, ionotropic glutamate antagonists either unmasked inhibitory currents or enhanced existing currents. Some of these unmasked currents were of the time-locked variety and could conceivably be monosynaptic; however, in most neurons it was not possible to measure jitter. Thus the present study may have underestimated the degree of monosynaptic inhibitory pathways from the rNST to the RF, and/or there may be nonglutamatergic excitatory outputs from the rNST that drive inhibitory interneurons. Although few other putative excitatory neurotransmitters/neuromodulators have been identified in the rNST (56), nitric oxide (86) and substance P (20) are possible candidates.
GABAA antagonists partially blocked many inhibitory currents evoked from stimulating the rNST. Although GABA-containing neurons in the rNST (76) were originally characterized as local circuit interneurons (27, 51), recent double-labeling data from our laboratory indicate that GABAergic projections from the rNST might project to the medullary RF (unpublished data). Other inhibitory pathways are also likely present, inasmuch as inhibitory currents were not always entirely suppressed with GABAA antagonists. There is evidence of glycinergic interneurons in the medulla (53, 54), and our preliminary data suggest that several neuropeptides, including neuropeptide Y, and μ-opioid agonists produce inhibitory currents in these prehypoglossal interneurons (unpublished observations). On the other hand, failure to suppress inhibitory currents with bicuculline could reflect a developmental issue, inasmuch as GABAA receptors in the rNST of neonatal rats up to P21 were somewhat refractory to bicuculline and had characteristics of GABAC receptors (34).
Dual Inputs: Functional Significance
Our results indicate that a significant proportion of RF cells that received inputs from the rNST received inhibitory and excitatory inputs. These dual inputs were expressed as combinations of time-locked PSCs, as well as increases in mPSCs. Most of the data favor a combination of mono- and polysynaptic pathways as a source of these dual currents.
The convergence of excitatory and inhibitory influences from the rNST to identified prehypoglossal neurons is similar to outputs from the cNST to DMN neurons. DMN neurons appear to receive glutamatergic and GABAergic input from the cNST (21, 52, 79, 80, 91), and some DMN neurons appear under tonic inhibition. Application of the GABAA antagonist picrotoxin increased excitatory PSCs in the DMN in response to cNST stimulation (72). Control of gastric function involves the complex modulation by brain stem and forebrain pathways of a fundamental vagal-vagal reflex pathway from the cNST to the DMN (80). Taste-guided behavior may similarly involve multisource modulation of pathways between the rNST and subjacent RF.
Mixed excitatory and inhibitory inputs from the rostral (gustatory) NST to prehypoglossal interneurons may provide pathways through which taste signals switch oromotor activity in response to sweet or bitter tastants. We previously proposed that one mechanism by which gustatory information in the rNST could switch a motor response from ingestion to rejection is disinhibition of the subjacent RF. Specifically, we demonstrated that infusion of bicuculline into the RF in an awake preparation modulated the jaw-opening and tongue movements associated with ingestion to resemble those of rejection: small-amplitude “lick” responses were transformed into larger-amplitude “gape” responses (18). We speculated that “activation” of the rNST, by a bitter stimulus such as QHCl might suppress tonic inhibitory influences on preoromotor neurons, thus producing the larger responses associated with the rejection response. Recent studies show that QHCl and other bitter stimuli activate a rather specific set of neurons in the rNST (30). Although the output of such neurons to the RF is speculative, we have demonstrated that stimulation of an awake animal with QHCl “recruits” neurons in the RF. Intraoral infusions of QHCl are associated with an increase in the number of prehypoglossal neurons in the IRt/parvicellular reticular nucleus expressing Fos-like immunoreactivity compared with an animal licking sucrose (23), and chronic recording in the medullary RF showed that a small population of neurons were specifically active only during gaping (83). The present studies show that a subset of prehypoglossal neurons are under tonic inhibition and that removal of such inhibition reveals excitatory influences from the rNST. Furthermore, in some neurons, increased stimulation of the rNST specifically reduced inhibition in the RF.
Computational Model
To illustrate how projections from the rNST to the subjacent RF might influence oromotor behavior, we have modified and extended our previous computational model of a switch between licking and gaping (87) to include several empirical observations made in the present study. From a connectional viewpoint, this model illustrates the diversity of projections from the rNST to the RF substrate under study, and from a dynamical viewpoint, it demonstrates how the oromotor patterns of licking and gaping are more fully simulated by these connections than by the original model.
In the original model, we tested the sensitivity of solutions to variations in the decay rates, βGABA and βGly, of GABAergic and glycineric inhibition, respectively, and in the rise and decay rate of the gating variable of IKCa. These parameters were primarily responsible for pattern switching from licks to gapes. We predicted that the phase switching from two-phase licks (coincident activity in P and O, followed by activity in R) to three-phase gapes (initial activation of R followed by a sequence of activity in P-O and then R) results from a change in the decay kinetics of inhibition from R to P and R to O and noted that the decay kinetics of glycinergic and GABAergic chloride currents (24, 64, 69) differ by the same ratio as the decay parameters used in the model. The present study provides no direct evidence for glycinergic mediation of inhibition, but GABAergic antagonists only partially suppressed inhibitory inputs to RF cells, suggesting that multiple receptor types underlie these inhibitory currents. Our extended model incorporates the polysynaptic inhibition in prehypoglossal neurons observed in the present study to show how a GABAergic interneuron driven by rNST could produce phase switching. Although the phase switch from licks to gapes can occur by the above-described mechanism, the large-amplitude muscle responses during gapes relies on a different mechanism suggested by the present study and previous behavioral pharmacology, i.e., disinhibition (18).
Thus the computational model incorporates the connectional data provided by the present study with previous studies of the anatomy and behavioral pharmacology of the RF substrate. In addition, the model makes specific predictions about the presence of multiple classes of inhibitory interneurons and, furthermore, predicts that specific subcomponents of the rejection response can be dissociated from each other, specifically, that there are mechanisms for phase switching between oromusculature distinct from those mediating amplitude changes. Phase switching is predicted to involve differences in the kinetics of inhibitory currents, e.g., those associated with GABA and glycine. Amplitude and duration changes in the oromusculature are predicted to originate from disinhibition. These predictions await further empirical verification.
Perspectives and Significance
Neurons in the IRt project to the mXII and contribute to the oromotor patterns of ingestion (licking) and rejection (gaping). This area of the RF also appears to be responsible for the recruitment of the oral musculature during apoxia-induced gasping (73). The motor responses of licking, gaping, and gasping each have unique patterns of activity across a common set of lingual and masticatory muscles. Thus, depending on the nature of a specific sensory stimulus, e.g., sucrose, QHCl, or lack of O2, this common network of interneurons produces the appropriate oromotor response. The present study begins an investigation of how one sensory nucleus connects with this multifunctional network.
APPENDIX
GRANTS
This work was supported by National Institute of Dental and Craniofacial Research Grant DC-00417 (J. B. Travers) and by the National Science Foundation under Agreement 0112050 and DMS0514356 (D. Terman).
Acknowledgments
The authors thank Ken Herman for excellent technical help and Dr. Susan Travers for valuable comments on the manuscript.
Footnotes
The costs of publication of this article were defrayed in part by the payment of page charges. The article must therefore be hereby marked “advertisement” in accordance with 18 U.S.C. Section 1734 solely to indicate this fact.
REFERENCES
- 1.Aldes LD. Subcompartmental organization of the ventral (protrusor) compartment in the hypoglossal nucleus of the rat. J Comp Neurol 353: 89–108, 1995 [DOI] [PubMed] [Google Scholar]
- 2.Altschuler SM, Bao X, Miselis RR. Dendritic architecture of hypoglossal motoneurons projecting to extrinsic tongue musculature in the rat. J Comp Neurol 342: 538–550, 1994 [DOI] [PubMed] [Google Scholar]
- 3.Andreasen M, Lambert JD, Jensen MS. Effects of new non-N-methyl-d-aspartate antagonists on synaptic transmission in the in vitro rat hippocampus. J Physiol 414: 317–336, 1989 [DOI] [PMC free article] [PubMed] [Google Scholar]
- 4.Bailey TW, Hermes SM, Andresen MC, Aicher SA. Cranial visceral afferent pathways through the nucleus of the solitary tract to caudal ventrolateral medulla or paraventricular hypothalamus: target-specific synaptic reliability and convergence patterns. J Neurosci 26: 11893–11902, 2006 [DOI] [PMC free article] [PubMed] [Google Scholar]
- 5.Beckman ME, Whitehead MC. Intramedullary connections of the rostral nucleus of the solitary tract in the hamster. Brain Res 557: 265–279, 1991 [DOI] [PubMed] [Google Scholar]
- 6.Beckstead RM, Morse JR, Norgren R. The nucleus of the solitary tract in the monkey: projections to the thalamus and brain stem nuclei. J Comp Neurol 190: 259–282, 1980 [DOI] [PubMed] [Google Scholar]
- 7.Blumberg S, Schroeder M, Malkesman O, Torregrossa AM, Smith GP, Weller A. Gastric preloads of corn oil and mineral oil produce different patterns of increases of c-Fos-like immunoreactive cells in the brain of 9–12 day-old rats. Brain Res 1134: 140–147, 2007 [DOI] [PubMed] [Google Scholar]
- 8.Bradley RM, Grabauskas G. Neural circuits for taste. Excitation, inhibition, and synaptic plasticity in the rostral gustatory zone of the nucleus of the solitary tract. Ann NY Acad Sci 855: 467–474, 1998 [DOI] [PubMed] [Google Scholar]
- 9.Bradley RM, King MS, Wang L, Shu X. Neurotransmitter and neuromodulator activity in the gustatory zone of the nucleus tractus solitarius. Chem Senses 21: 377–385, 1996 [DOI] [PubMed] [Google Scholar]
- 10.Bradley RM, Sweazey RD. In vitro intracellular recordings from gustatory neurons in the rat solitary nucleus. Brain Res 508: 168–171, 1990 [DOI] [PubMed] [Google Scholar]
- 11.Bradley RM, Sweazey RD. Separation of neuron types in the gustatory zone of the nucleus tractus solitarii on the basis of intrinsic firing properties. J Neurophysiol 67: 1659–1668, 1992 [DOI] [PubMed] [Google Scholar]
- 12.Broussard DL, Li X, Altschuler SM. Localization of GABAA α1 mRNA subunit in the brainstem nuclei controlling esophageal peristalsis. Brain Res Mol Brain Res 40: 143–147, 1996 [DOI] [PubMed] [Google Scholar]
- 13.Browning KN, Kalyuzhny AE, Travagli RA. μ-Opioid receptor trafficking on inhibitory synapses in the rat brainstem. J Neurosci 24: 7344–7352, 2004 [DOI] [PMC free article] [PubMed] [Google Scholar]
- 14.Buchanan JT. Identification of interneurons with contralateral, caudal axons in the lamprey spinal cord: synaptic interactions and morphology. J Neurophysiol 47: 961–975, 1982 [DOI] [PubMed] [Google Scholar]
- 15.Buchanan JT, Cohen AH. Activities of identified interneurons, motoneurons, and muscle fibers during fictive swimming in the lamprey and effects of reticulospinal and dorsal cell stimulation. J Neurophysiol 47: 948–960, 1982 [DOI] [PubMed] [Google Scholar]
- 16.Burgoon PW, Boulant JA. Synaptic inhibition: its role in suprachiasmatic nucleus neuronal thermosensitivity and temperature compensation in the rat. J Physiol 512: 793–807, 1998 [DOI] [PMC free article] [PubMed] [Google Scholar]
- 17.Cassell MD, Freedman LJ, Shi C. The intrinsic organization of the central extended amygdala. Ann NY Acad Sci 877: 217–241, 1999 [DOI] [PubMed] [Google Scholar]
- 18.Chen Z, Travers JB. Inactivation of amino acid receptors in medullary reticular formation modulates and suppresses ingestion and rejection responses in the awake rat. Am J Physiol Regul Integr Comp Physiol 285: R68–R83, 2003 [DOI] [PubMed] [Google Scholar]
- 19.Chen Z, Travers SP, Travers JB. Muscimol infusions in the brain stem reticular formation reversibly block ingestion in the awake rat. Am J Physiol Regul Integr Comp Physiol 280: R1085–R1094, 2001 [DOI] [PubMed] [Google Scholar]
- 20.Davis BJ, Kream RM. Distribution of tachykinin- and opioid-expressing neurons in the hamster solitary nucleus: an immuno- and in situ hybridization histochemical study. Brain Res 616: 6–16, 1993 [DOI] [PubMed] [Google Scholar]
- 21.Davis SF, Derbenev AV, Williams KW, Glatzer NR, Smith BN. Excitatory and inhibitory local circuit input to the rat dorsal motor nucleus of the vagus originating from the nucleus tractus solitarius. Brain Res 1017: 208–217, 2004 [DOI] [PMC free article] [PubMed] [Google Scholar]
- 22.Davis SF, Williams KW, Xu W, Glatzer NR, Smith BN. Selective enhancement of synaptic inhibition by hypocretin (orexin) in rat vagal motor neurons: implications for autonomic regulation. J Neurosci 23: 3844–3854, 2003 [DOI] [PMC free article] [PubMed] [Google Scholar]
- 23.DiNardo LA, Travers JB. Distribution of Fos-like immunoreactivity in the medullary reticular formation of the rat after gustatory elicited ingestion and rejection behaviors. J Neurosci 17: 3826–3839, 1997 [DOI] [PMC free article] [PubMed] [Google Scholar]
- 24.Donato R, Nistri A. Relative contribution by GABA or glycine to Cl−-mediated synaptic transmission on rat hypoglossal motoneurons in vitro. J Neurophysiol 84: 2715–2724, 2000 [DOI] [PubMed] [Google Scholar]
- 25.Doyle MW, Andresen MC. Reliability of monosynaptic sensory transmission in brain stem neurons in vitro. J Neurophysiol 85: 2213–2223, 2001 [DOI] [PubMed] [Google Scholar]
- 26.Ermentrout G. Simulating, Analyzing and Animating Dynamical Systems. Philadelphia: SIAM Press, 2002
- 27.Fong AY, Stornetta RL, Foley CM, Potts JT. Immunohistochemical localization of GAD67-expressing neurons and processes in the rat brainstem: subregional distribution in the nucleus tractus solitarius. J Comp Neurol 493: 274–290, 2005 [DOI] [PubMed] [Google Scholar]
- 28.Fukami H, Bradley RM. Biophysical and morphological properties of parasympathetic neurons controlling the parotid and von Ebner salivary glands in rats. J Neurophysiol 93: 678–686, 2005 [DOI] [PubMed] [Google Scholar]
- 29.Ganchrow JR, Steiner JE, Canetto S. Behavioral displays to gustatory stimuli in newborn rat pups. Dev Psychobiol 19: 163–174, 1986 [DOI] [PubMed] [Google Scholar]
- 30.Geran LC, Travers SP. Single neurons in the nucleus of the solitary tract respond selectively to bitter taste stimuli. J Neurophysiol 96: 2513–2527, 2006 [DOI] [PubMed] [Google Scholar]
- 31.Gill CF, Madden JM, Roberts BP, Evans LD, King MS. A subpopulation of neurons in the rat rostral nucleus of the solitary tract that project to the parabrachial nucleus express glutamate-like immunoreactivity. Brain Res 821: 251–262, 1999 [DOI] [PubMed] [Google Scholar]
- 32.Gobel W, Helmchen F. In vivo calcium imaging of neural network function. Physiology (Bethesda) 22: 358–365, 2007 [DOI] [PubMed] [Google Scholar]
- 33.Grabauskas G, Bradley RM. Frequency-dependent properties of inhibitory synapses in the rostral nucleus of the solitary tract. J Neurophysiol 89: 199–211, 2003 [DOI] [PubMed] [Google Scholar]
- 34.Grabauskas G, Bradley RM. Postnatal development of inhibitory synaptic transmission in the rostral nucleus of the solitary tract. J Neurophysiol 85: 2203–2212, 2001 [DOI] [PubMed] [Google Scholar]
- 35.Grabauskas G, Bradley RM. Synaptic interactions due to convergent input from gustatory afferent fibers in the rostral nucleus of the solitary tract. J Neurophysiol 76: 2919–2927, 1996 [DOI] [PubMed] [Google Scholar]
- 36.Grabauskas G, Bradley RM. Tetanic stimulation induces short-term potentiation of inhibitory synaptic activity in the rostral nucleus of the solitary tract. J Neurophysiol 79: 595–604, 1998 [DOI] [PubMed] [Google Scholar]
- 37.Grill HJ, Norgren R. The taste reactivity test. II. Mimetic responses to gustatory stimuli in chronic thalamic and chronic decerebrate rats. Brain Res 143: 281–297, 1978 [DOI] [PubMed] [Google Scholar]
- 38.Hall WG, Bryan TE. The ontogeny of feeding in rats. IV. Taste development as measured by intake and behavioral responses to oral infusions of sucrose and quinine. J Comp Physiol Psychol 95: 240–251, 1981 [DOI] [PubMed] [Google Scholar]
- 39.Halsell CB, Travers SP, Travers JB. Ascending and descending projections from the rostral nucleus of the solitary tract originate from separate neuronal populations. Neuroscience 72: 185–197, 1996 [DOI] [PubMed] [Google Scholar]
- 40.Hermann GE, Kohlerman NJ, Rogers RC. Hepatic-vagal and gustatory afferent interactions in the brainstem of the rat. J Auton Nerv Syst 9: 477–495, 1983 [DOI] [PubMed] [Google Scholar]
- 41.Hermann GE, Nasse JS, Rogers RC. α1-Adrenergic input to solitary nucleus neurons: calcium oscillations, excitation, and gastric reflex control. J Physiol 562: 553–568, 2008 [DOI] [PMC free article] [PubMed] [Google Scholar]
- 42.Holstege G, Kuypers HG, Dekker JJ. The organization of the bulbar fibre connections to the trigeminal, facial and hypoglossal motor nuclei. II. An autoradiographic tracing study in cat. Brain 100: 264–286, 1977 [PubMed] [Google Scholar]
- 43.Inoue T, Chandler SH, Goldberg LJ. Neuropharmacological mechanisms underlying rhythmical discharge in trigeminal interneurons during fictive mastication. J Neurophysiol 71: 2061–2073, 1994 [DOI] [PubMed] [Google Scholar]
- 44.Karimnamazi H, Travers JB. Differential projections from gustatory responsive regions of the parabrachial nucleus to the medulla and forebrain. Brain Res 813: 283–302, 1998 [DOI] [PubMed] [Google Scholar]
- 45.Kessler M, Baudry M, Lynch G. Quinoxaline derivatives are high-affinity antagonists of the NMDA receptor-associated glycine sites. Brain Res 489: 377–382, 1989 [DOI] [PubMed] [Google Scholar]
- 46.King MS, Bradley RM. Relationship between structure and function of neurons in the rat rostral nucleus tractus solitarii. J Comp Neurol 344: 50–64, 1994 [DOI] [PubMed] [Google Scholar]
- 47.King MS, Wang L, Bradley RM. Substance P excites neurons in the gustatory zone of the rat nucleus tractus solitarius. Brain Res 619: 120–130, 1993 [DOI] [PubMed] [Google Scholar]
- 48.Kinzeler NR, Travers SP. Licking and gaping elicited by microstimulation of the nucleus of the solitary tract. Am J Physiol Regul Integr Comp Physiol 295: R436–R448, 2008 [DOI] [PMC free article] [PubMed] [Google Scholar]
- 49.Koshiya N, Smith JC. Neuronal pacemaker for breathing visualized in vitro. Nature 400: 360–363, 1999 [DOI] [PubMed] [Google Scholar]
- 50.Lasiter PS. Postnatal development of gustatory recipient zones within the nucleus of the solitary tract. Brain Res Bull 28: 667–677, 1992 [DOI] [PubMed] [Google Scholar]
- 51.Lasiter PS, Kachele DL. Organization of GABA and GABA-transaminase containing neurons in the gustatory zone of the nucleus of the solitary tract. Brain Res Bull 21: 623–636, 1988 [DOI] [PubMed] [Google Scholar]
- 52.Li CS, Davis BJ, Smith DV. Opioid modulation of taste responses in the nucleus of the solitary tract. Brain Res 965: 21–34, 2003 [DOI] [PubMed] [Google Scholar]
- 53.Li YQ, Takada M, Kaneko T, Mizuno N. Distribution of GABAergic and glycinergic premotor neurons projecting to the facial and hypoglossal nuclei in the rat. J Comp Neurol 378: 283–294, 1997 [DOI] [PubMed] [Google Scholar]
- 54.Li YQ, Takada M, Kaneko T, Mizuno N. GABAergic and glycinergic neurons projecting to the trigeminal motor nucleus: a double labeling study in the rat. J Comp Neurol 373: 498–510, 1996 [DOI] [PubMed] [Google Scholar]
- 55.Luiten PG, ter Horst GJ, Steffens AB. The hypothalamus, intrinsic connections and outflow pathways to the endocrine system in relation to the control of feeding and metabolism. Prog Neurobiol 28: 1–54, 1987 [DOI] [PubMed] [Google Scholar]
- 56.Lundy RF, Norgren R. Gustatory System. San Diego: Elsevier Academic, 2004
- 57.Lynn RB, Kreider MS, Miselis RR. Thyrotropin-releasing hormone-immunoreactive projections to the dorsal motor nucleus and the nucleus of the solitary tract of the rat. J Comp Neurol 311: 271–288, 1991 [DOI] [PubMed] [Google Scholar]
- 58.Mangold JE, Hill DL. Postnatal reorganization of primary afferent terminal fields in the rat gustatory brainstem is determined by prenatal dietary history. J Comp Neurol 509: 594–607, 2008 [DOI] [PMC free article] [PubMed] [Google Scholar]
- 59.Mattes RD. Orosensory considerations. Obesity (Silver Spring) 14 Suppl 4: 164S–167S, 2006 [DOI] [PubMed] [Google Scholar]
- 60.Murakami T, Araki T, Yamano M, Wanaka A, Betz H, Tohyama M. Localization of the glycine receptors in the rat central nervous system: an immunocytochemical analysis. Adv Exp Med Biol 236: 71–80, 1988 [DOI] [PubMed] [Google Scholar]
- 61.Nasse J, Travers JB. Solitary nucleus-reticular formation projections in neonatal slice preparation. Chem Senses 31: A1–A144, 2006 [Google Scholar]
- 62.Norgren R. Projections from the nucleus of the solitary tract in the rat. Neuroscience 3: 207–218, 1978 [DOI] [PubMed] [Google Scholar]
- 63.Norgren R, Leonard CM. Ascending central gustatory pathways. J Comp Neurol 150: 217–237, 1973 [DOI] [PubMed] [Google Scholar]
- 64.O'Brien JA, Berger AJ. Cotransmission of GABA and glycine to brain stem motoneurons. J Neurophysiol 82: 1638–1641, 1999 [DOI] [PubMed] [Google Scholar]
- 65.Odutola AB. Cell grouping and Golgi architecture of the hypoglossal nucleus of the rat. Exp Neurol 52: 356–371, 1976 [DOI] [PubMed] [Google Scholar]
- 66.Rinaman L. Oxytocinergic inputs to the nucleus of the solitary tract and dorsal motor nucleus of the vagus in neonatal rats. J Comp Neurol 399: 101–109, 1998 [DOI] [PubMed] [Google Scholar]
- 67.Rogers RC, Kita H, Butcher LL, Novin D. Afferent projections to the dorsal motor nucleus of the vagus. Brain Res Bull 5: 365–373, 1980 [DOI] [PubMed] [Google Scholar]
- 68.Rose HJ, Metherate R. Auditory thalamocortical transmission is reliable and temporally precise. J Neurophysiol 94: 2019–2030, 2005 [DOI] [PubMed] [Google Scholar]
- 69.Russier M, Kopysova IL, Ankri N, Ferrand N, Debanne D. GABA and glycine co-release optimizes functional inhibition in rat brainstem motoneurons in vitro. J Physiol 541: 123–137, 2002 [DOI] [PMC free article] [PubMed] [Google Scholar]
- 70.Shammah-Lagnado SJ, Costa MS, Ricardo JA. Afferent connections of the parvocellular reticular formation: a horseradish peroxidase study in the rat. Neuroscience 50: 403–425, 1992 [DOI] [PubMed] [Google Scholar]
- 71.Shammah-Lagnado SJ, Negrao N, Silva BA, Ricardo JA. Afferent connections of the nuclei reticularis pontis oralis and caudalis: a horseradish peroxidase study in the rat. Neuroscience 20: 961–989, 1987 [DOI] [PubMed] [Google Scholar]
- 72.Smith BN, Dou P, Barber WD, Dudek FE. Vagally evoked synaptic currents in the immature rat nucleus tractus solitarii in an intact in vitro preparation. J Physiol 512: 149–162, 1998 [DOI] [PMC free article] [PubMed] [Google Scholar]
- 73.St. John WM. Medullary regions for neurogenesis of gasping: noeud vital or noeuds vitals? J Appl Physiol 81: 1865–1877, 1996 [DOI] [PubMed] [Google Scholar]
- 74.Stornetta RL, Sevigny CP, Guyenet PG. Vesicular glutamate transporter DNPI/VGLUT2 mRNA is present in C1 and several other groups of brainstem catecholaminergic neurons. J Comp Neurol 444: 191–206, 2002 [DOI] [PubMed] [Google Scholar]
- 75.Sweazey RD. Distribution of aspartate and glutamate in the nucleus of the solitary tract of the lamb. Exp Brain Res 105: 241–253, 1995 [DOI] [PubMed] [Google Scholar]
- 76.Sweazey RD. Distribution of GABA and glycine in the lamb nucleus of the solitary tract. Brain Res 737: 275–286, 1996 [DOI] [PubMed] [Google Scholar]
- 77.Tell F, Bradley RM. Whole-cell analysis of ionic currents underlying the firing pattern of neurons in the gustatory zone of the nucleus tractus solitarii. J Neurophysiol 71: 479–492, 1994 [DOI] [PubMed] [Google Scholar]
- 78.Ter Horst GJ, Copray JC, Liem RS, Van Willigen JD. Projections from the rostral parvocellular reticular formation to pontine and medullary nuclei in the rat: involvement in autonomic regulation and orofacial motor control. Neuroscience 40: 735–758, 1991 [DOI] [PubMed] [Google Scholar]
- 79.Travagli RA, Gillis RA, Rossiter CD, Vicini S. Glutamate- and GABA-mediated synaptic currents in neurons of the rat dorsal motor nucleus of the vagus. Am J Physiol Gastrointest Liver Physiol 260: G531–G536, 1991 [DOI] [PubMed] [Google Scholar]
- 80.Travagli RA, Hermann GE, Browning KN, Rogers RC. Brainstem circuits regulating gastric function. Annu Rev Physiol 68: 279–305, 2006 [DOI] [PMC free article] [PubMed] [Google Scholar]
- 81.Travers JB. Efferent projections from the anterior nucleus of the solitary tract of the hamster. Brain Res 457: 1–11, 1988 [DOI] [PubMed] [Google Scholar]
- 82.Travers JB. Oral motor nuclei. In: The Rat Nervous System (3rd ed.), edited by Paxinos G. San Diego: Academic, 2004, p. 295–319.
- 83.Travers JB, DiNardo LA, Karimnamazi H. Medullary reticular formation activity during ingestion and rejection in the awake rat. Exp Brain Res 130: 78–92, 2000 [DOI] [PubMed] [Google Scholar]
- 84.Travers JB, Norgren R. Afferent projections to the oral motor nuclei in the rat. J Comp Neurol 220: 280–298, 1983 [DOI] [PubMed] [Google Scholar]
- 85.Travers JB, Yoo JE, Chandran R, Herman K, Travers SP. Neurotransmitter phenotypes of intermediate zone reticular formation projections to the motor trigeminal and hypoglossal nuclei in the rat. J Comp Neurol 488: 28–47, 2005 [DOI] [PubMed] [Google Scholar]
- 86.Travers SP, Travers JB. Taste-evoked Fos expression in nitrergic neurons in the nucleus of the solitary tract and reticular formation of the rat. J Comp Neurol 500: 746–760, 2007 [DOI] [PubMed] [Google Scholar]
- 87.Venugopal S, Travers JB, Terman DH. A computational model for motor pattern switching between taste-induced ingestion and rejection oromotor behaviors. J Comput Neurosci 22: 223–238, 2007 [DOI] [PubMed] [Google Scholar]
- 88.Wang L, Bradley RM. In vitro study of afferent synaptic transmission in the rostral gustatory zone of the rat nucleus of the solitary tract. Brain Res 702: 188–198, 1995 [DOI] [PubMed] [Google Scholar]
- 89.Wang L, Bradley RM. Influence of GABA on neurons of the gustatory zone of the rat nucleus of the solitary tract. Brain Res 616: 144–153, 1993 [DOI] [PubMed] [Google Scholar]
- 90.Whitehead MC. Neuronal architecture of the nucleus of the solitary tract in the hamster. J Comp Neurol 276: 547–572, 1988 [DOI] [PubMed] [Google Scholar]
- 91.Willis A, Mihalevich M, Neff RA, Mendelowitz D. Three types of postsynaptic glutamatergic receptors are activated in DMNX neurons upon stimulation of NTS. Am J Physiol Regul Integr Comp Physiol 271: R1614–R1619, 1996 [DOI] [PubMed] [Google Scholar]
- 92.Zhang GX, Sasamoto K. Projections of two separate cortical areas for rhythmical jaw movements in the rat. Brain Res Bull 24: 221–230, 1990 [DOI] [PubMed] [Google Scholar]