

Abstract
The axons that project into the striatum are known to segregate according to macroscopic cortical systems; however, the within-region organization of these fibers has yet to be described in humans. We used in vivo fiber tractography, in neurologically healthy adults, to map white matter bundles that originate in different neocortical areas, navigate complex fiber crossings, and project into the striatum. As expected, these fibers were generally segregated according to cortical origin. Within a subset of pathways, a patched pattern of inputs was observed, consistent with previous ex vivo histological studies. In projections from the prefrontal cortex, we detected a topography in which fibers from rostral prefrontal areas projected mostly to rostral parts of the striatum and vice versa for inputs originating in caudal cortical areas. Importantly, within this prefrontal system there was also an asymmetry in the subset of divergent projections, with more fibers projecting in a posterior direction than anterior. This asymmetry of information projecting into the basal ganglia was predicted by previous network-level computational models. A rostral-caudal topography was also present at the local level in otherwise somatotopically organized fibers projecting from the motor cortex. This provides clear evidence that the longitudinal organization of input fields, observed at the macroscopic level across cortical systems, is also found at the microstructural scale at which information is segregated as it enters the human basal ganglia.
Keywords: basal ganglia, diffusion imaging, topographic
although typically thought of as a motor control area, the basal ganglia processes information from a variety of cortical and subcortical regions (Alexander et al. 1986; Draganski et al. 2008; Joel and Weiner 2000; Kemp and Powell 1970, 1971a; Selemon and Goldman-Rakic 1985; Wiesendanger et al. 2004). Axons that project into the basal ganglia first terminate in the striatum. Histological studies in nonhuman animals have shown that the termination zones of cortical afferents, i.e., the corticostriatal projections, are organized in a highly topographic fashion along the striatum (Kemp and Powell 1970, 1971b, 1971c). Early studies in nonhuman primates had postulated a global rostral-caudal organization in which inputs from posterior cortical areas clustered in posterior regions of the striatum and vice versa for projections from anterior cortical areas (Kemp and Powell 1970). Later work suggested that input terminations were in fact clustered in longitudinal patterns along the nuclei (Selemon and Goldman-Rakic 1985), although subsequent mapping in humans using white matter imaging has shown that the interregion projections are still generally organized in a rostral-caudal fashion at the macroscopic level (Draganski et al. 2008). These projections also tend to be organized in patches that may reflect the biochemical parcellation of the striatal nuclei into striosome or matrix zones (Eblen and Graybiel 1995; Graybiel and Ragsdale 1978; Ragsdale and Graybiel 1990). Projections from a single cortical area will diverge to a fairly broad area of the striatum and be further subdivided into these smaller patched structures. Thus cortical information is topographically organized, but within this topography there is some divergence of information being conveyed (Eblen and Graybiel 1995; Flaherty and Graybiel 1991, 1994, 1995; Miyachi et al. 2006).
In humans, diffusion tensor imaging (DTI) studies have shown some utility in mapping the macroscopic organization of corticostriatal projections from cortical areas like prefrontal cortex, motor, limbic, etc. (Draganski et al. 2008; Leh et al. 2007; Lehéricy et al. 2004a, 2004b). Several of these studies show a global rostral-caudal organization of corticostriatal connectivity based on cortical origins used in the tractography process (Draganski et al. 2008; Lehéricy et al. 2004a, 2004b). While this pattern is in accordance with previous predictions from animal work (see Haber 2003), these studies did not provide details of the small-scale organization of inputs originating from the same cortical system (i.e., spanning only a few millimeters).
Functional imaging studies have also had some success at identifying large-scale organizational patterns in the corticostriatal pathways. Recent functional MRI (fMRI) work has shown a rostral-caudal spectrum of information representation across corticostriatal loops (Lopez-Paniagua and Seger 2011) and, more specifically, within the dorsolateral prefrontal cortex (DLPFC) in the middle frontal gyrus (Badre and Frank 2012; Badre et al. 2010). Here more abstract representations are processed by rostral areas of the DLPFC, which, in turn, regulates contextual information in anterior DLPFC regions. Activation of these different parts of the DLPFC coincided with engagement of different areas of the striatum. These findings lead to the prediction that rostral regions of cortex will be connected to rostral regions of the striatum while caudal areas of cortex communicate with caudal regions in the striatum. This is in agreement with previous theories that the global rostral-caudal organization of corticostriatal fibers is expressed as a gradient locally within individual subfields (see Haber 2003).
Here we set out to map both the large- and small-scale organizational patterns of basal ganglia inputs. Recently we showed how multishell, high-angular-resolution white matter imaging techniques (for review see Hagmann et al. 2006) can track fiber streamlines from cortex, through complex fiber crossings, to subcortical targets with at least millimeter resolution and a high degree of accuracy (Verstynen et al. 2011; Jarbo et al. 2012). Using this approach, we set out to test three specific hypotheses. First, we set out to determine whether the macroscopic rostral-caudal topography of the corticospinal projections could be visualized by using deterministic tractography methods on high-directional-resolution diffusion imaging data. If this macroscopic organization can be visualized, we then wanted to determine whether this approach could visualize the microstructural (i.e., millimeter level) organization of corticostriatal termination fields in the striatum that have previously only been reported in histological work (Graybiel and Ragsdale 1978; Ragsdale and Graybiel 1990; Selemon and Goldman-Racik 1985). Such resolution could also allow us to map the within-region organization of these projections. Specifically, we wanted to determine whether the global rostral-caudal continuum seen across cortical areas (for review see Haber 2003) persists more locally in projections from individual cortical areas (i.e., DLPFC; Badre and Frank 2012; Badre et al. 2010) and to quantify the specificity of these representations. For example, how does this rostral-caudal organization interact with the dorsal-ventral somatotopic organization of projections from the motor cortex (Miyachi et al. 2006)?
MATERIALS AND METHODS
Participants
Ten neurologically healthy adults (5 men, 5 women; all right handed; age range 22–32 yr) from the local University of Pittsburgh community took part in this experiment. All participants were prescreened prior to scanning to rule out any contraindications to MRI. The procedures used here were all approved by the internal review boards at the University of Pittsburgh and Carnegie Mellon University. Written consent was obtained from all participants prior to testing.
Image Acquisition and Reconstruction
Diffusion spectrum imaging (DSI) data were acquired on one of two Siemens 3T systems (Tim Trio System at the University of Pittsburgh Medical Center, 7 participants; Verio System on the Carnegie Mellon campus, 3 participants). Collection on both systems used the Siemens 32-channel head coil and identical acquisition parameters using the same works-in-progress sequence on both scanners that acquires 257 directions with a twice-refocused spin-echo EPI sequence and multiple q-values [TR = 9,916 ms, TE = 157 ms, voxel size = 2.4 × 2.4 × 2.4 mm3, field of view (FOV) = 231 × 231 mm, b-max = 7,000 s/mm2]. Scan time for this sequence lasted either 45 min (Trio) or 50 min (Verio). Pilot analysis showed no significant differences in signal to noise or resolution of tractography data between these two systems. Since head motion cannot be reliably accounted for with this type of diffusion imaging, we opted instead to minimize head motion during acquisition. All subjects were experienced at staying still in the magnet, and extra padding around the head was provided to minimize motion during the scan. In addition, scans with low signal to noise from movement (determined as the σ/μ of the diffusion signal across all volumes in the scan) were reacquired on subsequent dates and the best scanning session used for analysis (2 subjects). No correction for eddy current or geometric distortion was performed because of the low signal strength at high b-values. We elaborate on this more in discussion. All DSI data were reconstructed with a Generalized Q-sampling Imaging (GQI) approach (Yeh et al. 2010) in DSI Studio (http://dsi-studio.labsolver.org), with orientation distribution functions (ODFs) with 362 discrete sampling directions and a sampling distance of 1.2 mean diffusion distance.
Along with the DSI images, anatomical images were also acquired for each subject with a 7-min T1-weighted axial MPRAGE sequence (TR = 2,110 ms, TE = 2.63 ms, flip angle = 8°, 176 slices, FOV = 256 × 256 mm2, voxel size = 1.0 mm3). These scans were collected for all subjects on the Verio 3-T system and reconstructed with SPM8 software tools (Wellcome Trust Centre for Neuroimaging, London, UK).
Atlas Segmentation
For each subject, Freesurfer (http://surfer.nmr.mgh.harvard.edu/) was used to automatically segment cortical and subcortical regions from the T1 anatomical image (Fischl et al. 2004). To use as maps in the fiber tracking process, individual regions of interest (ROIs) were isolated from the template image (the aparc.a2009s+aseg.mgz output file from Freesurfer) and saved as separate NIfTI files. These individual ROIs were then coregistered to the b0 image and resliced so as to have the same voxel and matrix dimensions as the DSI data with a linear, rigid body transformation procedure in SPM8. To account for distortion artifacts and partial-volume effects, all ROI masks were expanded by 1 voxel.
For each hemisphere, 22 separate cortical ROIs were selected and categorized as to belonging to one of four systems: frontal, limbic, motor, and somatosensory. Table 1 details this categorical breakdown. Along with cortical areas, we also extracted the caudate and putamen ROI masks from each hemisphere. Both cortical and basal ganglia ROIs were used as masks in the fiber tracking process described in Fiber Tracking and Analysis.
Table 1.
Region classifications
| Frontal (lateral frontal) |
| Inferior frontal gyrus: operculum |
| Inferior frontal gyrus: triangularis |
| Middle frontal gyrus |
| Superior frontal gyrus |
| Insula |
| Limbic (orbital and medial frontal) |
| Orbital gyrus |
| Inferior frontal gyrus: orbital |
| Gyrus rectus |
| Cingulate gyrus and sulcus |
| Medial parahippocampal gyrus |
| Hippocampus |
| Motor (primary and premotor) |
| Precentral gyrus |
| Central sulcus |
| Paracentral gyrus and sulcus |
| Somatosensory |
| Postcentral gyrus and sulcus |
| DLPFC |
| Middle frontal gyrus |
| Inferior frontal sulcus |
| Superior frontal sulcus |
DLPFC, dorsolateral prefrontal cortex.
For display purposes we also generated a template of the striatum in Montreal Neurological Institute (MNI) space. To do this, we combined the caudate and putamen ROI masks. This combined mask was used to select voxels from the T1 image of each subject and saved as a separate file. A transformation matrix from individual subject T1 space to MNI template space was then estimated with a nonlinear registration method in SPM8 (ICBM space template regularization, 16 nonlinear iteration, 1-mm3 T1-MNI template). This transformation was then applied to the extracted striatum maps. These maps were then averaged across subjects to produce a template image of the striatum.
Fiber Tracking and Analysis
All fiber tracking was performed with DSI Studio (http://dsi-studio.labsolver.org). Rather than adopt a whole brain fiber tracking procedure, we chose to use an ODF-streamline ROI-based approach (Yeh et al. 2010) similar to that used in previous studies (Verstynen et al. 2011). This was done in order to maximize the number of corticostriatal projections detected and ignore irrelevant fiber pathways. Using a randomized seeding approach, we initiated tracking from random positions within the seed mask (anywhere within the brain) and a randomly assigned initial step direction. Fiber progression continued with a step size of 0.5 mm, minimum fiber length of 30 mm, and maximum of 60–80 mm (60 mm for frontal fibers, 70 mm for limbic and motor, and 80 mm for somatosensory). To smooth each track, the next directional estimate of each voxel was weighted by 80% of the previous moving direction and 20% by the incoming direction of the fiber. The tracking was terminated when the relative fractional anisotropy (FA) for the incoming direction dropped below a preset threshold (0.0256–0.0532 depending on the subject) or exceeded a turning angle of 60°. The FA termination threshold was adjusted on a per-subject basis depending on the relative signal to noise of each scan. The precise value was determined by tracking a set of corpus callosum fibers and resetting the FA threshold by hand to maximize coverage and minimize noise. Once an optimal FA threshold was identified for that subject, it was recorded and used for the corticostriatal pathway tracking. Separate fiber tracking was done for each ROI listed in Table 1 and each basal ganglia ROI (i.e., caudate and putamen). Tracks were generated with an ODF-streamline version of the FACT algorithm (Basser et al. 2000; Lazar et al. 2003; Yeh et al. 2010).
For the groupwise parametric mapping, we used a constrained, random seed approach in which each voxel in the brain was given the probability of being seeded 25 times, e.g., the number of seeds (Nseed) was set based on the total number of voxels in the brain (Nbrain). Only fibers that met the tracking constraints listed above and passed through both the target cortical and subcortical ROIs were kept for subsequent analysis. Tracking was done separately for the left and right hemispheres, and only ipsilateral projections were analyzed.
For the topographic mapping from the DLPFC and the motor system, we tracked 20,000 prefrontal and 75,000 motor streamlines that passed between the cortical and striatal ROIs. For the DLPFC pathways, the middle frontal gyrus, superior frontal sulcus, and inferior frontal sulcus were used as ROIs. Otherwise, we used the same tracking as for the frontal fiber system described above. For the motor system, the central sulcus, precentral gyrus, and paracentral gyrus and sulcus were used as ROIs. Otherwise, tracking parameters were the same as described above for the motor system. To account for partial voluming and geometric distortions between T1 and T2 image spaces, both cortical and subcortical ROIs were expanded by 1 voxel (2.4 mm). After tracking, fibers were filtered so that only streamlines that terminated within the striatum were kept for subsequent analysis. Tracking of these systems was also done separately for both the left and right hemisphere, focusing only on ipsilateral projections.
Data Analysis
Cortical system analysis.
All post hoc analysis on fiber data was performed with custom-written MATLAB software. For each ROI listed in Table 1, we removed all fibers with starting locations >1 voxel width outside the cortical ROI mask or with ending locations residing >1 voxel outside the striatum ROI mask. This was done to account for partial voluming effects and increase the reliability that the final data set consisted mainly of fibers that began in cortex and ended in the nuclei of the striatum. We then calculated the density of fibers that terminated within each voxel of the basal ganglia ROI mask and saved these maps as NIfTI-formatted images (http://nifti.nimh.nih.gov). The matrix and header information of these output maps matched the header information for DSI volumes. These fiber density images were then summed across ROIs to produce maps of projection densities for each of the four cortical systems identified in Table 1.
To analyze projection patterns at the group level, we first transformed the end point density maps for each subject into template MNI space. This was done by estimating the transformation matrix to warp each subject's generalized FA image into the FMRIB FA template brain (FMRIB58_FA_1mm.nii) with the same nonlinear registration method described above (SPM8, ICBM space template regularization, 16 nonlinear iterations). This normalization was applied to each of the target density maps. The resulting images were then smoothed with a 3-mm Gaussian kernel. Group-level analysis of projection patterns was performed by using a one-sample t-test on the transformed density images. Within each cluster, voxels were considered to have significant projection fields within the striatum if their P value was less than an adjusted threshold based on a false discovery rate of 0.05 (PFDR; Genovese et al. 2002). This was done in order to control for multiple comparisons.
Between-region directional shift analysis.
To quantify the directional shifts between fiber clusters in the striatum, from different cortical areas, we first measured the center of mass of fiber projection densities within the striatum as
where Di is the density of end points in each voxel i within the ROI mask with V voxels and Xi is the x, y, z coordinate position of that voxel. This returns the coordinate position of the center of projection densities for a given cluster. The differences in x, y, and z components between clusters of interest were then submitted to a MANOVA. The intercept term, reflecting the sum of the eigenvalues of the dot-product of the within-group and between-group sums of squares, provides a test for whether the direction of the spatial shift in fiber densities was consistent across subjects, i.e., the Hotelling's trace.
Topographic shift analysis.
To measure how a fiber's cortical position predicted its location in the striatal nuclei, we adopted a multivariate regression analysis approach previously used to map the corticospinal system (Verstynen et al. 2011). All spatial analysis of corticostriatal projections from the prefrontal and motor regions was performed separately per hemisphere on fiber streamlines in each individual subject's DSI space. For each streamline, we recorded two sets of coordinate values. First, we recorded the three-dimensional coordinates of the streamline's origin in the neocortex. Second, we recorded the two-dimensional coordinate values of a streamline's end point position in the striatum ROI mask, along the sagittal plane (i.e., y- and z-positions). Since the fiber streamlines are dimensionless lines, all coordinate positions are recorded in subvoxel, millimeter values, allowing for high spatial resolution.
Next, we identified the principal spatial direction of fibers in cortex, using a principal component analysis (PCA) on the set of cortical positions. The fiber streamlines for each cortical system were saved separately, and the PCA analysis was performed on these separate sets of fibers. In the DLPFC system, the first PCA component falls along the direction of the middle frontal gyrus. Individual fiber loadings onto this first component were sorted in the y-direction so that lower values reflect more rostral projections and higher values reflect caudal projections. In the motor system, the first PCA component reflects the ventral-anterior-lateral direction of the central sulcus and precentral gyrus, which is the principal direction of somatotopy in the motor system (see Geyer et al. 2000 for review). As with the prefrontal fibers, motor fibers were sorted such that low values reflect lower-body areas (i.e., dorsal aspects) and higher values reflect upper-body representations (i.e., ventral aspects). In addition, the motor fibers were further separated into those that terminate on the caudate and those that terminate on the putamen with a k-means clustering method (kmeans.m in MATLAB). This was not done for prefrontal fibers because the border between the two nuclei is not as easily discernible in rostral regions. For both systems, fibers were categorized on the basis of their loading onto the first PCA component, and this index value was normalized to be between 0 and 1.
To assess topographic projection patterns, these PCA-derived index values were used as a 1 × N regressor, Xcortex, to predict the two-dimensional fiber position in the striatum, Ypos, represented by a 2 × N vector, where N is the number of fibers in the set of fiber streamlines. This was done with the multivariate ordinary least-squares regression model
The coefficient matrix, β, is a 2 × 1 matrix reflecting the shift in striatum y- and z-positions as a fiber's cortical end point moves along the direction of the first PCA component (i.e., β = [Δy Δz]′), and μ is the mean fiber position within the striatum. The angle of this shift, in degrees, can then be computed from these shift values as
To account for slight differences caused by the subject's head orientation, we determined the angle of the head in the sagittal plane, using the most distal points of the genu and splenium of the corpus callosum. Estimated shift values were then normalized by subtracting the head angle from θshift. Finally, we determined the significance of each shift, across subjects, with the Rayleigh test (Fisher 1993) that compares the distribution of observed angles from a uniform null distribution. These values are reported as z-scores.
Projection asymmetry analysis.
To estimate the degree to which projections within a target pathway overlap with each other, we first isolated the plane of interest for analysis. In the DLPFC pathway this was the sagittal plane (i.e., y-axis coordinate values). A robust linear regression was used to estimate the relationship between a fiber's cortical position and its striatal position (see Fig. 5B). Assuming a normal distribution, we divided the probability distribution of the residuals into a tertiary split. Fibers within ±0.37 standard deviations of the mean (Fig. 5B) were determined to be convergent projections, i.e., fibers that project to similar points along the rostral-caudal topography. Fibers with residual values greater than the +0.37 standard deviation threshold (Fig. 5B) were categorized as projecting in a posterior direction, from more rostral areas of cortex to more caudal areas of striatum. Fibers with residual values below −0.37 standard deviations were classified as anterior projections that went from caudal cortex to rostral striatum. This analysis was only performed on the DLPFC pathways because there was very little convergent structure in projections from the primary motor cortex (see Fig. 7 and results).
Fig. 5.
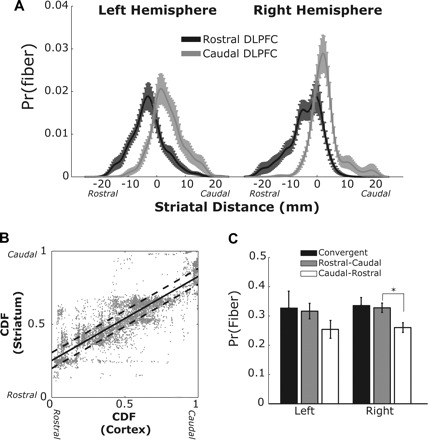
A: distribution of striatal end point locations along the sagittal plane. Fibers were classified as rostral or caudal based on the probability distribution (Pr) of their position in cortex (dashed lines in B). B: example distribution of cortical and striatal end point positions for a single subject. The cumulative distribution function (CDF) of spatial positions was estimated separately for cortical and subcortical positions in the y-plane. Solid line shows the best-fit regression for cortical CDF on striatal CDF. Dashed lines show upper and lower bounds of the 33% confidence interval (i.e., 1/3 of fibers fall between the lines). C: probability of fiber convergence (starting at one side of cortex and ending on the same side of the striatum) or divergence (starting at one side of cortex and projecting to a different segment of the striatum). Convergence and divergence were estimated based on the probability distribution of the residuals from the regression shown in B. All error bars reflect SE. *P < 0.01.
Fig. 7.

A: joint distribution of motor cortex fiber positions along the coronal plane in an example subject (left hemisphere) using plotting conventions similar to Fig. 5B. Fibers projecting to the caudate (light gray dots) and putamen (dark gray dots) were analyzed separately. B: same analysis as A but with striatal fiber positions isolated in the sagittal plane.
RESULTS
Regional Topography of Striatum
Our first goal was to confirm the organizational pattern of striatal inputs from major fiber pathways that are known to be segregated in both humans and nonhuman primates: lateral frontal, limbic, motor, and somatosensory (Draganski et al. 2008; Kemp and Powell 1970, 1971a; Lehéricy et al. 2004a, 2004b; Selemon and Goldman-Rakic 1985). Figure 1 shows an example set of fibers projecting to the putamen from a typical subject. Fibers were categorized based on their cortical origin (see Fig. 2A and Table 1) and exhibit a clear segmentation from each cortical region in this subject. There is also an apparent longitudinal organization of fiber end points in this subject (see below). The density of these end points in all striatum voxels was saved for each subject and normalized into template space, and regions of consistent end point densities were identified with a one-sample t-test across subjects. Although it is known that ventral parietal and temporal areas project into the striatum (Selemon and Goldman-Rakic 1985), pilot tractography analysis failed to demonstrate consistent projections from these regions. This is consistent with previous DTI studies that do not report projections from these regions (Draganski et al. 2008). Therefore, we excluded these areas from further analysis. We return to this issue in discussion.
Fig. 1.
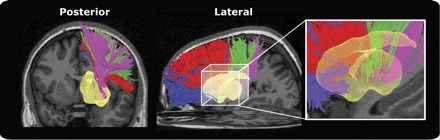
Tracked corticostriatal projections to the putamen (yellow) from all cortical regions for an example subject. These fibers project from region of interest (ROI) masks of limbic (blue), prefrontal (red), motor (green), and somatosensory (purple) areas.
Fig. 2.
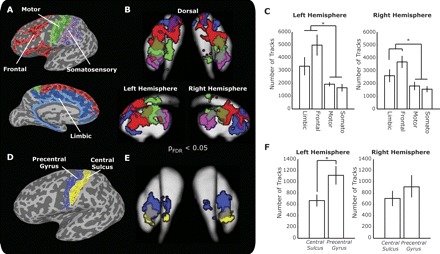
A: ROI masks for an example subject displayed on the inflated brain. B: thresholded group statistical maps for end point projections into the caudate and putamen. Significance threshold was adjusted for each cluster with a false discovery rate of <0.05 (PFDR). Results are displayed on the average segmented striatum ROI masks. Color definitions same as shown in A. C: distribution of tracked fibers across cortical regions. D: ROI masks separating precentral gyrus (blue) from central sulcus (yellow) displayed on the inflated surface for the same subject shown in A. E: thresholded group maps of end point distributions in the striatum. Display shows the dorsal view of the striatum template with the same color scheme as in D. F: fiber distributions between the precentral gyrus and central sulcus ROIs. Line connectors show significant post hoc t-tests, and error bars reflect SE. *P < 0.05.
Figure 2B shows that we were able to detect a regionally specific segregation of basal ganglia inputs. In general, limbic fibers projected to the head of the caudate and the most rostral parts of the putamen. Frontal projections terminated in the central and lateral aspects of the caudate body and caudally to the limbic voxels in the putamen. Fibers originating from motor areas were principally found on the lateral edges of the caudate and central portions of the putamen just caudal to frontal projection fields. Finally, somatosensory fibers were exclusively found on the most caudal aspects of the putamen. Despite the fact that participants were tested on two different 3T MRI systems, we did not observe a significant effect of acquisition system on overall fiber detection rates in either left [t(9) = −1.41, P = 0.167] or right [t(9) = −1.66, P = 0.104] hemisphere.
As reported previously elsewhere (Draganski et al. 2008), the frontal areas had the largest number of fibers projecting into the striatum (Fig. 2C). We observed nearly ∼2.5 times as many projections from lateral frontal cortex than motor or somatosensory projections [repeated measures F(3,9) = 8.04, P < 0.001]. A similar pattern was detected in right hemisphere [repeated measures F(3,9) = 8.15, P < 0.001]. In neither case did including the acquisition scanner as a control term in the model change the pattern of these effects. Post hoc paired tests revealed that limbic and frontal systems had significantly more corticostriatal projections than the motor or somatosensory regions in both the left and right hemispheres (all P < 0.05). The difference between frontal and limbic systems was significant in the right hemisphere [t(9) = 2.01, P = 0.037] and strong but not significant in the left hemisphere [t(9) = 1.78, P = 0.054]. There was no difference in fiber distribution between motor and somatosensory areas.
Of course, the dominance of frontal and limbic projections into the striatum is driven in large part by differences in cortical area of each system. The frontal mask had largest volume across subjects, with 2,713 ± 76 (mean ± SE) voxels per hemisphere, followed by limbic (2,297 ± 46), motor (950 ± 28), and somatosensory (548 ± 18) masks. The overall density of fibers (i.e., number of fibers divided by size of cortical mask) from each system, however, appears to be uniformly distributed across cortical systems (all F < 1). Therefore, as expected (see Haber 2003), frontal regions do reflect the largest representation of inputs to the striatum; however, the density of projections appears to remain constant across all cortical areas.
Neuroanatomical studies have shown that within the motor projections these fibers can be further broken down into premotor [i.e., axons originating from Brodmann area 6 (BA6)] and primary motor [i.e., Brodmann area 4 (BA4)] subfields (Takada et al. 1998). Since the cytoarchitectonic boundary between these regions is impossible to visualize by MRI, we approximated this separation by tracking fibers independently from the precentral gyrus ROI and the central sulcus ROI (Fig. 2D). The latter ROI should encompass primarily BA4 neurons, and the former should encompass primarily BA6 cells, including premotor cortex and supplementary motor area (Geyer et al. 2000; Verstynen et al. 2011). Consistent with previous human (Draganski et al. 2008) and nonhuman primate (Takada et al. 1998) work, we found that striatal projections from primary and premotor cortices were shifted such that premotor fibers terminated in a medial, anterior, and dorsal direction from fibers from M1 (Fig. 2E). This shift was generally consistent in all subjects. Using a spatial shift analysis on the center of mass of the fiber distributions (see materials and methods), we found that in the left putamen fibers from the precentral gyrus were shifted in a consistent medial (0.92 ± 0.40 mm, SE), anterior (5.18 ± 0.85 mm), and dorsal (2.66 ± 0.46 mm) direction from those projecting from the central sulcus (Hotelling's trace = 1.58, P = 0.001). In the right hemisphere, we observed a similar medial (0.61 ± 0.20 mm), anterior (5.59 ± 1.30 mm), and dorsal (1.96 ± 0.39 mm) shift of precentral fibers (Hotelling's trace = 0.88, P = 0.015). Thus the location of premotor and primary motor cortex projections within the putamen is consistent with findings in the nonhuman primate.
The distribution of fibers projecting from these two regions was relatively equal. In general, there were slightly more projections arising from the precentral than from the central sulcus (Fig. 2F). However, this difference was only slightly significant in the left hemisphere [t(9) = −1.97, P = 0.04] and not significant in the right hemisphere [t(9) = −1.51, P = 0.08]. Indeed, after accounting for differences in cortical area, this difference in fiber distribution disappears. Thus we were able to reliably detect a shift in the topographic representation of primary and premotor fibers in the striatum, with slightly more fibers projecting from the left premotor areas than primary motor cortex, likely reflecting the larger spatial area of premotor cortex.
Rostral-Caudal Topography of Prefrontal Projections
To characterize how well the global rostral-caudal organization seen across cortical regions is reflected within more local projection fields, we isolated a subset of DLPFC projections originating from the middle frontal gyrus. Figure 3A shows an example set of fibers from one subject. The top inset in Fig. 3A shows the collection of fiber positions in cortex, and the bottom inset shows the fiber end points in the striatum. At this fiber-level resolution, we detected two patterns of interest in the organization of the corticostriatal end points. First, the projections in the caudate and putamen appeared to be organized in a striated, longitudinal fashion (bottom inset, Fig. 3A). Indeed, this patched and striated pattern was consistently observed in every subject (Fig. 4).
Fig. 3.

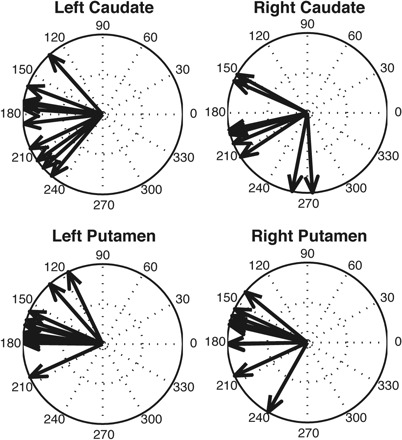
A: fibers projecting from the left dorsolateral prefrontal cortex (DLPFC) in an example subject (different subject than shown in Fig. 1). Top inset: distribution of fiber start locations in cortex along the sagittal plane (D, dorsal; V, ventral; R, rostral; C, caudal). Fibers are classified based on their position along the gyrus. Blue dots show the most anterior fibers, and red dots are the most posterior fibers. Bottom inset: end points of the same fibers shown above in the striatum. Color map reflects their position in cortex based on their loading to the first principal component of the spatial distribution of fibers along the gyrus. B: vector shifts for all 10 subjects. The direction of the vector shows the shift in fiber position in the striatum as its cortical position goes from anterior to posterior regions of the gyrus. The angles are shown in the sagittal plane with the same orientations labeled in the top inset of A.
Fig. 4.
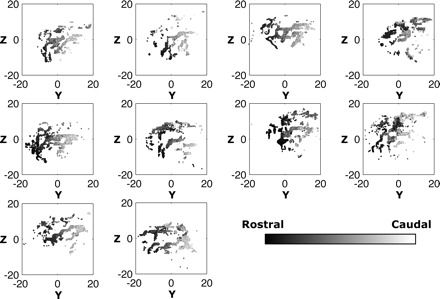
Distribution of fiber terminations within the striatum for the left hemisphere in all 10 subjects. Point of view and orientations are same as used in Fig. 3A.
We were also able to confirm the local rostral-caudal organization of corticostriatal projections from the middle frontal gyrus. To illustrate this, we classified fibers based on their cortical position along the direction of the middle frontal gyrus, where low values reflect fibers that start in anterior aspects of the gyrus and higher values reflect fibers that originate from posterior aspects (Fig. 3A). As can be seen in Fig. 3A, bottom inset, fibers with more rostral origins tended to terminate in rostral regions of the striatum, like the head of the caudate and front of the putamen. Fibers originating from caudal areas of cortex, clustered in more caudal striatal regions like the anterior portion of the body of the caudate and the central putamen.
Indeed, this shift was consistently observed in all subjects tested. Figure 4 qualitatively shows this rostral-caudal organization in the left striatum for all subjects. To come up with a more quantitative measure of this topography, we used a multivariate regression approach to quantify the directional shift (in the sagittal plane) of a fiber's subcortical position as its cortical origin moved in a posterior direction along the gyrus (see materials and methods). In both hemispheres we saw a consistent caudal and dorsal shift in end point positions as a fiber's start location shifted caudally along the middle frontal gyrus (Fig. 3B). This effect was highly consistent across all subjects, determined with a Rayleigh test, in both left (z = 9.35, P < 0.0001) and right (z = 8.30, P < 0.0001) hemispheres. Therefore, as predicted by previous fMRI work (Badre and Frank 2012; Badre et al. 2010) and histological studies in nonhuman species (Haber et al. 2006; Kemp and Powell 1970; Voorn et al. 2004), we were able to confirm that the global rostral-caudal organizational pattern of corticostriatal projections in humans persists at the local level within individual projection subfields.
So far we have shown that, within the corticostriatal projections from the DLPFC, fibers terminate in clusters along the subcortical nuclei and these clusters are macroscopically ordered according to their cortical origins. What remains unclear is to what degree information from cortex is segregated between these sections of the DLPFC. Both Fig. 3A and Fig. 4 show that while there is a continuum of information along the nucleus, there is some degree of divergence as well, i.e., striatal patches will contain a combination of fibers from rostral and caudal aspects of the DLPFC. To visualize this, we split the cortical fibers into two sets and looked at the spatial distribution of these clusters along the sagittal plane of the striatum (see Projection asymmetry analysis). Specifically, we measured the probability that a fiber originating in the rostral half of the DLPFC would project to the caudal half of the striatal termination zone and vice versa. Figure 5A shows these two distributions for the left and right hemispheres, respectively. In both cases, there is a slightly skewed distribution pattern, with the largest probability being for convergent, homologous projections (e.g., rostral cortical fibers ending in rostral areas of the striatum). However, there is also a small but consistent degree of overlapping projections between the two halves of the DLPFC. Using a regression analysis on the joint distribution of fiber end points along the sagittal plane (Fig. 5B), we next set out to quantify this asymmetry of the direction of these fiber projections. The residual distribution was separated into tertiles based on the assumption of a normal distribution. If there were no true asymmetry in projections, there should be equal numbers of fibers in each tertile. Points falling within the dashed lines in Fig. 5B show fibers that project to topographically similar areas of cortex and striatum, i.e., convergent projections. Points falling above the upper dashed line reflect fibers that project in a posterior direction, from more rostral cortical regions to more caudal striatal regions. Points falling below the lower dashed line reflect fibers that project in an anterior direction, from more caudal areas of cortex to more rostral areas of the striatum.
Both hemispheres showed a strong trend for more fibers projecting in a posterior direction (Fig. 5C). This confirms our qualitative assessment of an asymmetry in the corticostriatal projections from the DLPFC. This asymmetry was strong but not significant in the left hemisphere [t(9) = 1.51, P = 0.08] but was highly significant in the right hemisphere [t(9) = 2.88, P = 0.009]. So while DLPFC projections showed a strong convergence to topographically similar regions in the striatum, this distribution was also skewed such that there was a greater probability of fibers from rostral cortex projecting caudally along the striatum than vice versa. This asymmetry is particularly interesting because it matches the predicted direction of asymmetry put forth by an independent computational model of basal ganglia loops (Frank and Badre 2012). We elaborate on this in more detail in discussion.
Somatotopy of Motor Projections
The only other a priori predicted topographic pattern in the corticostriatal pathways is a somatotopic organization of fibers from motor cortex (Miyachi et al. 2006). Specifically, fibers projecting from lower extremity regions of the primary motor cortex, located in the dorsal aspects of the central sulcus, should terminate in dorsal and caudal areas of the striatum. Fibers originating in upper extremity regions of cortex, located in more ventral aspects of the central sulcus, should terminate in ventral and rostral regions of the striatum. To this end, we classified fibers based on their position along the somatotopic map of the central sulcus (Fig. 6A). Within the projections from the primary motor cortex, we noted several distinct patterns. First, we were able to confirm the striated structure of inputs along the subcortical nuclei that we observed in the prefrontal pathway. This is particularly salient in the sagittal view of Fig. 6B. Second, most of the fibers from lower extremity regions of cortex were represented in dorsal areas like the caudate, while fibers from upper extremity regions terminated in mostly ventral areas such as the putamen. To determine the consistency of this pattern, we took the integral of the categorization score, i.e., the first spatial PCA component of the cortical start points, for the caudate and putamen separately as an estimate of the degree of lower or upper extremity representations. In both hemispheres we consistently found more lower body representations in the caudate and more upper body representations in the putamen [Fig. 6C; left hemisphere: t(9) = 3.25, P = 0.005; right hemisphere: t(9) = 2.19, P = 0.03].
Fig. 6.

A: distribution of fiber start locations along the central sulcus and posterior aspects of the left precentral gyrus (i.e., primary motor cortex) for another example subject (D, dorsal; V, ventral; M, medial; L, lateral). Fibers originating in areas of cortex that represent lower extremity fibers are illustrated by blue dots, while projections from upper extremity areas are illustrated as red dots. B: end point locations of the same fibers in the striatum shown in 2 views. As in Fig. 5, the color of these dots represents their cortical origins shown in A. Because these project to more posterior areas, there is a clear separation of caudate and putamen projections. Orientations of coronal plane are same as in A, while orientations of sagittal plane are the same as in Fig. 5A. C: mean integral of the cortical principal component analysis (PCA) component loading used to categorize fibers for the caudate and putamen separately. Error bars reflect SE. *P < 0.05, **P = 0.005.
Thus it appears that there are two motor clusters along the striatum: one on the body/tail junction of the caudate and another on the lateral wall of the putamen (see also Fig. 2E). This dual representation suggests that motor fibers may be more broadly distributed along the striatal nuclei than the DLPFC projections. To get a better understanding of this, we looked at the joint distribution of fiber positions in cortex and the two segments of the striatum. A k-means clustering method was used to automatically separate caudate from putamen fibers. Within each cluster we looked at how a fiber's position along the central sulcus, from lower (dorsal sulcus) to upper (ventral sulcus) body representations, predicted its position along the coronal plane of the striatum. Figure 7A shows this distribution in a typical subject. Unlike the DLPFC fibers, the motor projections were highly variable, with no clear linear pattern. However, there was a trend for upper body representations to project to more dorsal aspects of the caudate and putamen.
One possibility for this noise is that the coronal plane may not be the appropriate direction to look for somatotopic organization of motor projections. Therefore, we repeated this analysis by classifying fiber positions along the sagittal plane of the striatum. Figure 7B shows this analysis for the same subject as Fig. 7A. As with the coronal analysis, there was no clear linear pattern like that visible in DLPFC fibers. However, there was a weak trend for upper body representations to project to more lateral aspects of the striatum. In both planes, this persistent within-subject variance precluded analysis of the asymmetry of fiber projections (e.g., Fig. 5, B and C).
To provide a more sensitive measure of the direction of somatotopic projections into the striatum, we applied the directional shift analysis described above (Fig. 3B; see Topographic shift analysis). This was performed separately for the caudate and putamen. In both striatal nuclei, we found that descending along the central sulcus tended to shift a fiber's position in a primarily rostral and slightly ventral direction (Fig. 8). This shift was significant across subjects in both left (caudate: z = 7.88, P = 0.0001; putamen: z = 8.37, P < 0.0001) and right (caudate: z = 7.51, P = 0.0001; putamen: z = 7.03, P = 0.0002) hemispheres. Thus we are able to confirm the global ventral-dorsal somatotopic organization of corticostriatal projections and a more local rostral-caudal organization of inputs, both of which have been recently described in the nonhuman primate (Miyachi et al. 2006).
Fig. 8.
Vector shifts of striatal positions as a fiber's origin moves from dorsal, lower-body regions of the primary motor cortex to ventral, upper-body regions. Same plotting conventions as Fig. 3B.
DISCUSSION
We were able to show the first in vivo evidence of the microstructural (i.e., millimeter resolution) topographies of inputs into the basal ganglia, using high-resolution diffusion imaging methods in humans. Consistent with histological work in nonhuman primates (Haber et al. 2006; Kemp and Powell 1970, 1971a; Ragsdale and Graybiel 1990; Selemon and Goldman-Rakic 1985) and rodents (see Voorn et al. 2004), human imaging (Draganski et al. 2008; Lehéricy et al. 2004b), and a single case report in humans (Wiesendanger et al. 2004), we found that lateral frontal, orbital, and medial frontal (e.g., limbic), premotor, primary motor, and somatosensory projections were topographically organized in the striatum. Based on our analysis, fibers from prefrontal areas were the most commonly mapped projections and this fits with previous observations in the primate (see Haber 2003); however, the overall density of projections appeared to be constant across cortical areas. Closer inspection of the termination fields revealed a patched organization of these termination fields. Indeed, at this millimeter level we were able to use the high spatial resolution of our methods to map within-region topographies that were predicted from previous functional imaging studies (Badre and Frank 2012; Badre et al. 2010; Staempfli et al. 2008) and histological work on the nonhuman primate (Kemp and Powell 1970; Miyachi et al. 2006; Haber et al. 2006; see Haber 2003 for review).
Of particular interest is the detection of a novel rostral-caudal organization within the DLPFC projections from the middle frontal gyrus. Previous imaging work had found that conditions that activated a focal portion of lateral frontal cortex also activated a restricted region of striatum at approximately the same rostral-caudal extent (Badre et al. 2010; Badre and Frank 2012). Notably, this observation was predicted by a computational model of learning and decision making, in which more rostral regions of prefrontal cortex modulate the cognitive control operations of caudal prefrontal areas via local corticostriatal loops (Frank and Badre 2012). This model proposes that such a nested corticostriatal organization may underlie complex planning and executive functions, and may be a basis for previously observed functional differences along the rostral-caudal axis of lateral frontal cortex (Badre 2008; Badre et al. 2009; Koechlin et al. 2003). Indeed, other imaging evidence in humans suggests that this information integration may happen across different segments of the cortico-basal ganglia pathways (i.e., interactions between separate computational loops in this system) during learning and cognitive control, suggesting that this convergence of information property is a global principle of cortico-basal ganglia processing (see for review Seger 2008; Seger and Spiering 2011). In fact, Lopez-Paniagua and Seger (2011) reported a similar rostral-caudal spectrum of information processing during category learning in humans, which is consistent with the overall direction of information processing predicted by Badre and Frank (2012). Our present findings provide the first visualization of this local rostral-caudal connection pattern in both prefrontal and motor pathways. Finally, while much of our work has been focused on describing the gradient of organization in the sagittal plane, histological work suggests that this organizational pattern is actually best described as a dorso-lateral-caudal directional shift as fibers move from anterior cortical regions to posterior regions (Haber 2003; Voorn et al. 2004). Future work should focus on more specifically mapping the gradient of information within local corticostriatal segments in a full three-dimensional context, rather than isolated along one two-dimensional plane.
As further confirmation of predictions made by computational models (Frank and Badre 2012), even though there was clear segregation of inputs, projections from each cortical area had some degree of overlap with projections from other cortical sites (Draganski et al. 2008). Even within the DLPFC, we were able to detect a small but significant overlap in representations from the rostral and caudal portions of the prefrontal cortex. Roughly 20% of fibers projected to overlapping termination zones along the striatum, validating that there may be some divergence of information in these corticostriatal loops. Moreover, in the left hemisphere, these divergent projections were asymmetrically distributed from rostral cortex to caudal striatum more than vice versa, an asymmetry also predicted by this computational model. This suggests that there is some divergence of information happening at the striatal level (Eblen and Graybiel 1995; Flaherty and Graybiel 1991, 1994, 1995). This would be in accordance with previous theories suggesting that information integration across corticostriatal systems is a key principle in basal ganglia processing (see Haber 2003; Seger 2008; Seger and Spiering 2011). However, as with any novel pattern identified with human brain imaging, only further ex vivo histological studies can definitively confirm the underlying neuroanatomical organization. Nonetheless, taken together with the previous functional imaging studies, our observations provide strong evidence for this organization of key corticostriatal loops involved in human decision making.
We were also able to confirm the striated, longitudinal organization of inputs into the striatum. In both prefrontal (Fig. 3A, Fig. 4) and motor (Fig. 6B) subfields, we observed distinct patches of fiber end points oriented primarily in the sagittal plane. This longitudinal organization was first reported for individual axon projections by Selemon and Goldman-Rakic (1985) and fundamentally altered the existing models of synaptic organization in the striatum (Kemp and Powell 1970, 1971a, 1971b, 1971c). Our findings suggest that the longitudinal organization reflects a local level pattern, while the rostral-caudal segmentation reflects a more global organization pattern. Within these longitudinal projection fields, we observed a patchy clustering of fiber end points. A similar patched/striated organization has been reported in the biochemical makeup of the striatal nuclei in the nonhuman primate (Graybiel and Ragsdale 1978; Miyachi et al. 2006; Selemon and Goldman-Rakic 1985), humans (Holt et al. 1997; Prensa et al. 1999; Roberts and Knickman 2002), and rodents (Voorn et al. 2004). Although there was a high degree of variability across subjects in the precise organization of these patches (see Fig. 4), this is not surprising given that the underlying biochemical systems, i.e., striosome and matrix, that may mediate this clustering have been shown to be highly variable in nonhuman animals as well (Graybiel and Ragsdale 1978; Ragsdale and Graybiel 1990). Future studies are needed to determine whether the patched clusters in fiber streamlines reflect the underlying compartmental biochemical organization of the striatal nuclei.
Finally, we confirmed a complex somatotopic organization of projections from the primary motor cortex that had been previously described in the nonhuman primate (Miyachi et al. 2006). While both the caudate and putamen appeared to receive projections from lower- and upper-body areas of cortex, a larger proportion of lower-body fibers terminated in the caudate. In contrast, upper extremity projections terminated more in the putamen. Unlike the prefrontal fibers, there was a stronger degree of overlap in the projections from motor cortex. These results do suggest a possible role for the caudate in motor functions in humans, which has yet to be reported in the literature. However, without a more specific functional localization method for the motor strip in cortex, it is impossible to provide more specific details about the precise lower extremity and upper extremity representations that project to the caudate and putamen independently.
By careful analysis within each segment of the striatum (i.e., caudate and putamen), we were able to resolve, for the first time, a more local and small-scale topographic representation in the sagittal plane. In this case, fibers originating in more ventral regions of the central sulcus (i.e., upper body regions) terminated in more anterior areas of the striatum compared with fibers that originated from dorsal areas of the central sulcus (i.e., lower body). Interestingly, this direction of representation matches previous fMRI studies showing that hand and face activation in the putamen happens in voxels anterior to those engaged during foot actions (Staempfli et al. 2008). In addition, a closer inspection of the rabies-labeled projections from motor cortex reported by Miyachi and colleagues (Miyachi et al. 2006, Fig. 3) also shows evidence of this smaller rostral-caudal pattern of projections. However, more definitive characterization of the spatial organization of these fibers is left to future histological studies in both human and nonhuman primates.
There were some differences between our findings and results from the nonhuman primate literature. First, the frontal projections in our study were much more broadly distributed across the striatum than what was found in the animal work. Indeed, frontal projections tended to dominate the basal ganglia, encompassing much of the putamen, whereas cells from lateral frontal cortex in primates solely terminate on the caudate. However, other diffusion imaging studies in humans have also found evidence of broad prefrontal projections into the putamen compared with motor or sensory inputs (Draganski et al. 2008; Leh et al. 2007; Lehéricy et al. 2004b). Any interpretation of this observation is difficult given that the frontal regions are spatially closer to the striatum and the fibers from this system navigate fewer fiber crossings on their way to the striatum. This suggests that the abundance of prefrontal fibers may reflect more of a methodological limitation with diffusion imaging than a true underlying pattern.
Second, we found relatively few projections into the medial wall of the caudate. This area of the basal ganglia has been shown to receive projections from medial wall regions like the cingulate cortex (Kemp and Powell 1970, 1971a; Miyachi et al. 2006; Selemon and Goldman-Rakic 1985; Takada et al. 1998). Indeed, we detected relatively few fibers from the cingulate in our analysis, indicating a persistent limitation in current diffusion-weighted imaging methods. It has also been shown that the basal ganglia receives input from the temporal (Saint-Cyr et al. 1990; Baizer et al. 1993) and ventral posterior parietal (Selemon and Goldman-Rakic 1985) regions. However, pilot work showed that these projections were not consistently detected in all subjects. In addition, these projections have not been reported by previous diffusion imaging studies (Draganski et al. 2008; Leh et al. 2007; Lehéricy et al. 2004a, 2004b). This is likely due to the fact that these fibers have to navigate several complex fiber crossings before they reach the ipsilateral striatum. Recent work in our lab has shown that contralateral projections from the parietal cortex to the caudate are occasionally detected in DSI-based tractography (Jarbo et al. 2012), suggesting that these projections may have to navigate less complex fiber crossings. As diffusion imaging and fiber tracking technologies improve, we expect that these fiber projections will also become visible.
Despite the robust resolution of our present approach, there are several ways that future white matter mapping technologies can be further optimized. First, the low signal to noise of very high b-value images and the length of scan time required to collect our DSI images preclude motion correction and corrections for geometric distortion from the T2 signal and eddy currents (see Jones and Cercignani 2010). This can impair the resolution of orientation information in certain voxels, thus limiting the ability to accurately map projections from more distal areas of cortex or areas that have to navigate complex fiber crossings (Hagmann 2006). In addition, the geometric distortion likely impairs our detection of fibers to more ventral regions of the putamen. Thus with optimization of preprocessing methods for high-angular-resolution data, as well as refined reconstruction and fiber tracking methods, the resolution of corticostriatal mapping can only further improve.
GRANTS
This work was supported by Defense Advanced Research Projects Agency (DARPA) contract NBCHC070104.
DISCLOSURES
No conflicts of interest, financial or otherwise, are declared by the author(s).
AUTHOR CONTRIBUTIONS
Author contributions: T.D.V., D.B., and K.J. conception and design of research; T.D.V. and K.J. performed experiments; T.D.V. analyzed data; T.D.V., D.B., and W.S. interpreted results of experiments; T.D.V. prepared figures; T.D.V. and D.B. drafted manuscript; T.D.V. and D.B. edited and revised manuscript; T.D.V., D.B., and W.S. approved final version of manuscript.
ACKNOWLEDGMENTS
The authors thank J. Phillips, A. Greenberg, and S. Pathak for helpful comments on the early stages of this project.
REFERENCES
- Alexander GE, DeLong MR, Strick PL. Parallel organization of functionally segregated circuits linking basal ganglia and cortex. Annu Rev Neurosci 9: 357–381, 1986 [DOI] [PubMed] [Google Scholar]
- Badre D. Cognitive control, hierarchy, and the rostro-caudal organization of the frontal lobes. Trends Cogn Sci 12: 193–200, 2008 [DOI] [PubMed] [Google Scholar]
- Badre D, Frank MJ. Mechanisms of hierarchical reinforcement learning in cortico-striatal circuits 2: evidence from FMRI. Cereb Cortex 22: 527–536, 2012 [DOI] [PMC free article] [PubMed] [Google Scholar]
- Badre D, Kayser AS, D'Esposito M. Frontal cortex and the discovery of abstract action rules. Neuron 66: 315–326, 2010 [DOI] [PMC free article] [PubMed] [Google Scholar]
- Badre D, Hoffman J, Cooney JW, D'Esposito M. Hierarchical cognitive control deficits following damage to the human frontal lobe. Nat Neurosci 12: 515–522, 2009 [DOI] [PMC free article] [PubMed] [Google Scholar]
- Badre D, D'Esposito M. FMRI evidence for a hierarchical organization of the prefrontal cortex. J Cogn Neurosci 19: 2082–2099, 2007 [DOI] [PubMed] [Google Scholar]
- Baizer JS, Desimone R, Ungerleider LG. Comparison of subcortical connections of inferior temporal and posterior parietal cortex in monkeys. Vis Neurosci 10: 59–72, 1993 [DOI] [PubMed] [Google Scholar]
- Basser P, Pajevic S, Pierpaoli C, Duda J, Aldroubi A. In vivo fiber tractography using DT-MRI data. Magn Reson Med 44: 625–632, 2000 [DOI] [PubMed] [Google Scholar]
- Booth J, Wood L, Lu D, Houk J, Bitan T. The role of the basal ganglia and cerebellum in language processing. Brain Res 1133: 136–144, 2007 [DOI] [PMC free article] [PubMed] [Google Scholar]
- Dale AM. Optimal experimental design for event-related fMRI. Hum Brain Mapp 114: 109–114, 1999 [DOI] [PMC free article] [PubMed] [Google Scholar]
- Draganski B, Kherif F, Klo S, Cook PA, Alexander DC, Parker GJ, Deichmann R, Ashburner J, Frackowiak SJ. Evidence for segregated and integrative connectivity patterns in the human basal ganglia. J Neurosci 28: 7143–7152, 2008 [DOI] [PMC free article] [PubMed] [Google Scholar]
- Eblen F, Graybiel AM. Highly restricted origin of prefrontal cortical inputs to striosomes in the macaque monkey. J Neurosci 15: 5999–6013, 1995 [DOI] [PMC free article] [PubMed] [Google Scholar]
- Fischl B, Halgren E, Salat DH, Busa E, Seidman LJ, Goldstein J, Kennedy D, Caviness V, Makris N, Rosen B, Dale AM. Automatically parcellating the human cerebral cortex. Cereb Cortex 14: 11–22, 2004 [DOI] [PubMed] [Google Scholar]
- Fisher NI. Statistical Analysis of Circular Data. Cambridge, UK: Cambridge Univ. Press, 1993 [Google Scholar]
- Flaherty AW, Graybiel AM. Corticostriatal transformations in the primate somatosensory system. Projections from physiologically mapped body-part representations. J Neurophysiol 66: 1249–1263, 1991 [DOI] [PubMed] [Google Scholar]
- Flaherty AW, Graybiel AM. Input-output organization of the sensorimotor striatum in the squirrel monkey. J Neurosci 14: 599–610, 1994 [DOI] [PMC free article] [PubMed] [Google Scholar]
- Flaherty AW, Graybiel AM. Motor and somatosensory corticostriatal projection magnifications in the squirrel monkey. J Neurophysiol 74: 2638–2648, 1995 [DOI] [PubMed] [Google Scholar]
- Frank MJ, Badre D. Mechanisms of hierarchical reinforcement learning in corticostriatal circuits 1: computational analysis. Cereb Cortex 22: 509–526, 2012 [DOI] [PMC free article] [PubMed] [Google Scholar]
- Genovese CR, Lazar NA, Nichols T. Thresholding of statistical maps in functional neuroimaging using the false discovery rate. Neuroimage 15: 870–878, 2002 [DOI] [PubMed] [Google Scholar]
- Geyer S, Matelli M, Luppino G, Zilles K. Functional neuroanatomy of the primate isocortical motor system. Anat Embryol (Berl) 202: 443–474, 2000 [DOI] [PubMed] [Google Scholar]
- Graybiel AM, Ragsdale CW. Histochemically distinct compartments in the striatum of human, monkeys, and cat demonstrated by acetylthiocholinesterase staining. Proc Natl Acad Sci USA 75: 5723–5726, 1978 [DOI] [PMC free article] [PubMed] [Google Scholar]
- Haber SN. The primate basal ganglia: parallel and integrative networks. J Chem Neuroanat 26: 317–330, 2003 [DOI] [PubMed] [Google Scholar]
- Haber SN, Kim KS, Mailly P, Calzavara R. Reward-related cortical inputs define a large striatal region in primates that interface with associative cortical connections, providing a substrate for incentive-based learning. J Neurosci 26: 8368–8376, 2006 [DOI] [PMC free article] [PubMed] [Google Scholar]
- Hagmann P, Jonasson L, Maeder P, Thiran J, Wedeen VJ, Meuli R. Understanding diffusion MR imaging techniques: from scalar diffusion-weighted imaging to diffusion tensor imaging and beyond. Radiographics 26: 205–224, 2006 [DOI] [PubMed] [Google Scholar]
- Holt DJ, Graybiel AM, Saper CB. Neurochemical architecture of the human striatum. J Comp Neurol 384: 1–25, 1997 [DOI] [PubMed] [Google Scholar]
- Jarbo K, Verstynen T, Schneider W. In vivo quantification of global connectivity in the human corpus callosum. Neuroimage 59: 1988–1996, 2012 [DOI] [PubMed] [Google Scholar]
- Joel D, Weiner I. The connections of the dopaminergic system with the striatum in rats and primates: an analysis with respect to the functional and compartmental organization of the striatum. Neuroscience 96: 451–474, 2000 [DOI] [PubMed] [Google Scholar]
- Jones DK, Cercignani M. Twenty-five pitfalls in the analysis of diffusion MRI data. NMR Biomed 23: 803–820, 2010 [DOI] [PubMed] [Google Scholar]
- Keller T, Just M. Altering cortical connectivity: remediation-induced changes in the white matter of poor readers. Neuron 64: 624–631, 2009 [DOI] [PMC free article] [PubMed] [Google Scholar]
- Kemp J, Powell T. The cortico-striate projection in the monkey. Brain 93: 525–546, 1970 [DOI] [PubMed] [Google Scholar]
- Kemp J, Powell T. The connexions of the striatum and globus pallidus: synthesis and speculation. Philos Trans R Soc Lond B Biol Sci 262: 441–457, 1971a [DOI] [PubMed] [Google Scholar]
- Kemp J, Powell T. The site of termination of afferent fibres in the caudate nucleus. Philos Trans R Soc Lond B Biol Sci 262: 413–427, 1971b [DOI] [PubMed] [Google Scholar]
- Kemp J, Powell T. The synaptic organization of the caudate nucleus. Philos Trans R Soc Lond B Biol Sci 262: 403–41, 1971c [DOI] [PubMed] [Google Scholar]
- Kiebel S, Holmes A. The General Linear Model. In Human Brain Function, edited by Frackowiak RSJ. San Diego, CA: Elsevier, 2004, p. 749–779 [Google Scholar]
- Koechlin E, Ody C, Kouneiher F. The architecture of cognitive control in the human prefrontal cortex. Science 302: 1181–1185, 2003 [DOI] [PubMed] [Google Scholar]
- Lazar M, Weinstein DM, Tsuruda JS, Hasan KM, Arfanakis K, Meyerand ME, Badie B, Rowley HA, Haughton V, Field A, Alexandar A. White matter tractography using diffusion tensor deflection. Hum Brain Mapp 18: 306–321, 2003 [DOI] [PMC free article] [PubMed] [Google Scholar]
- Leh SE, Ptito A, Chakravarty MM, Strafella AP. Fronto-striatal connections in the human brain: a probabilistic diffusion tractography study. Neurosci Lett 419: 113–118, 2007 [DOI] [PMC free article] [PubMed] [Google Scholar]
- Lehéricy S, Ducros M, Krainik A, Francois C, Van de Moortele PF, Ugurbil K, Kim DS. 3-D diffusion tensor axonal tracking shows distinct SMA and pre-SMA projections to the human striatum. Cereb Cortex 14: 1302–1309, 2004a [DOI] [PubMed] [Google Scholar]
- Lehéricy S, Ducros M, Van de Moortele PF, Francois C, Thivard L, Poupon C, Swindale N, Ugurbil K, Kim DS. Diffusion tensor fiber tracking shows distinct corticostriatal circuits in humans. Ann Neurol 55: 522–529, 2004b [DOI] [PubMed] [Google Scholar]
- Lopez-Paniagua D, Seger CA. Interactions within and between corticostriatal loops during component processes of category learning. J Cogn Neurosci 23: 3068–3083, 2011 [DOI] [PubMed] [Google Scholar]
- Middleton FA, Strick PL. Basal ganglia output and cognition: evidence from anatomical, behavioral, and clinical studies. Brain Cogn 200: 183–200, 2000 [DOI] [PubMed] [Google Scholar]
- Miyachi S, Lu X, Imanishi M, Sawada K, Nambu A, Takada M. Somatotopically arranged inputs from putamen and subthalamic nucleus to primary motor cortex. Neurosci Res 56: 300–308, 2006 [DOI] [PubMed] [Google Scholar]
- Nieuwenhuys R, Voogd J, van Huijzen C. The Human Central Nervous System: A Synopsis and Atlas. (5th rev. ed). Berlin: Springer, 2008 [Google Scholar]
- Prensa L, Giménez-Amaya JM, Parent A. Chemical heterogeneity of the striosomal compartment in the human striatum. J Comp Neurol 413: 603–618, 1999 [PubMed] [Google Scholar]
- Ragsdale CW, Graybiel AM. A simple ordering of neocortical areas established by the compartmental organization of their striatal projections. Proc Natl Acad Sci USA 87: 6196–6619, 1990 [DOI] [PMC free article] [PubMed] [Google Scholar]
- Rizk-Jackson A, Stoffers D, Sheldon S, Kuperman J, Dale A, Goldstein J, Corey-Bloom J, Poldrack RA, Aron AR. Evaluating imaging biomarkers for neurodegeneration in pre-symptomatic Huntington's disease using machine learning techniques. Neuroimage 56: 788–796, 2011 [DOI] [PubMed] [Google Scholar]
- Roberts RC, Knickman JK. The ultrastructural organization of the patch matrix compartments in the human striatum. J Comp Neurol 452: 128–138, 2002 [DOI] [PubMed] [Google Scholar]
- Saint-Cyr JA, Ungerleider LG, Desimone R. Organization of visual cortical inputs to the striatum and subsequent outputs to the pallido-nigral complex in the monkey. J Comp Neurol 298: 129–156, 1990 [DOI] [PubMed] [Google Scholar]
- Scholz J, Klein M, Behrens TE, Johansen-Berg H. Training induces changes in white-matter architecture. Nat Neurosci 12: 1367–1368, 2009 [DOI] [PMC free article] [PubMed] [Google Scholar]
- Seger CA. How do the basal ganglia contribute to categorization? Their roles in generalization, response selection, and learning via feedback. Neurosci Biobehav Rev 32: 265–278, 2008 [DOI] [PMC free article] [PubMed] [Google Scholar]
- Seger CA, Spiering BJ. A critical review of habit learning and the basal ganglia. Front Syst Neurosci 5: 66, 2011 [DOI] [PMC free article] [PubMed] [Google Scholar]
- Selemon L, Goldman-Rakic P. Longitudinal topography and lnterdigitation projections in the rhesus monkey. J Neurosci 5: 776–794, 1985 [DOI] [PMC free article] [PubMed] [Google Scholar]
- Sherman JH, Hoes K, Marcus J, Komotar RJ, Brennan CW, Gutin PH. Neurosurgery for brain tumors: update on recent technical advances. Curr Neurol Neurosci Rep 11: 313–319, 2011 [DOI] [PubMed] [Google Scholar]
- Staempfli P, Reischauer C, Jaermann T, Valavanis A, Kollias S, Boesiger P. Combining fMRI and DTI: a framework for exploring the limits of fMRI-guided DTI fiber tracking and for verifying DTI-based fiber tractography results. Neuroimage 39: 119–126, 2008 [DOI] [PubMed] [Google Scholar]
- Takada M, Tokuno H, Nambu A, Inase M. Corticostriatal input zones from the supplementary motor area overlap those from the contra- rather than ipsilateral primary motor cortex. Brain Res 791: 335–340, 1998 [DOI] [PubMed] [Google Scholar]
- Verstynen T, Jarbo K, Pathak S, Schneider W. In vivo mapping of microstructural somatotopies in the human corticospinal pathways. J Neurophysiol 105: 336–346, 2011 [DOI] [PubMed] [Google Scholar]
- Voorn P, Vanderschuren LJ, Groenewegen HJ, Robbins TW, Pennartz CM. Putting a spin on the dorsal-ventral divide of the striatum. Trends Neurosci 27: 468–474, 2004 [DOI] [PubMed] [Google Scholar]
- Wedeen J, Wang P, Schmahmann D, Benner T, Tseng I, Dai G, Pandya DN, Hagmann P, D'Arceuil H, de Crespigny AJ. Diffusion spectrum magnetic resonance imaging (DSI) tractography of crossing fibers. Neuroimage 41: 1267–1277, 2008 [DOI] [PubMed] [Google Scholar]
- Wedeen VJ, Hagmann P, Tseng WY, Reese TG, Weisskoff RM. Mapping complex tissue architecture with diffusion spectrum magnetic resonance imaging. Magn Reson Med 54: 1377–1386, 2005 [DOI] [PubMed] [Google Scholar]
- Wiesendanger E, Clarke S, Kraftsik R, Tardif E. Topography of cortico-striatal connections in man: anatomical evidence for parallel organization. Eur J Neurosci 20: 1915–1922, 2004 [DOI] [PubMed] [Google Scholar]
- Yeh F, Wedeen VJ, Tseng WI. Generalized Q-sampling imaging. IEEE Trans Med Imaging 29: 1626–1635, 2010 [DOI] [PubMed] [Google Scholar]