Abstract
Metformin is considered to be one of the most effective therapeutics for the treatment of type 2 diabetes (T2D) since it specifically reduces hepatic gluconeogenesis without increasing insulin secretion, inducing weight gain, or posing a risk of hypoglycemia1,2. For over half a century, this agent has been prescribed to T2D patients worldwide, yet the underlying mechanism by which metformin inhibits hepatic gluconeogenesis remains unknown. Here we show that metformin non-competitively inhibits the redox shuttle enzyme mitochondrial glycerophosphate dehydrogenase (mGPD), resulting in an altered hepatocellular redox state, reduced conversion of lactate and glycerol to glucose, and decreased hepatic gluconeogenesis. Acute and chronic low-dose metformin treatment effectively reduced endogenous glucose production (EGP), while increasing cytosolic redox and decreasing mitochondrial redox states. Antisense oligonucleotide (ASO) knockdown of hepatic mGPD in rats resulted in a phenotype akin to chronic metformin treatment, and abrogated metformin-mediated increases in cytosolic redox state, decrease in plasma glucose concentrations and inhibition of EGP. These findings were replicated in whole-body mGPD knockout mice. These results have significant implications for understanding the mechanism of metformin’s blood glucose lowering effects and provide a novel therapeutic target for T2D.
Initial investigations into metformin action found that this compound is a mild complex I inhibitor at millimolar concentrations3,4. More recent studies suggested that metformin activates AMPK through decreases in hepatic energy charge (increasing [AMP]:[ADP] and/or [ADP]:[ATP] ratio)5,6 or through the upstream AMPK kinase, LKB1, leading to reduction of gluconeogenic gene transcription6,7,8. This effect may, however, be due to sensitization of gluconeogenic transcription to insulin via AMPK-mediated decreases in hepatic lipid content9,10.
In contrast to these findings, it has been suggested that metformin suppresses gluconeogenesis independently of AMPK, instead altering hepatic energy charge11 and inducing allosteric inhibition of glycolytic enzymes or adenylate cyclase and glucagon-activated gluconeogenic transcription12. However, these hypotheses are inconsistent with findings that metformin does not alter hepatic adenine-nucleotide levels13.
Given these conflicting results, it is evident that the mechanisms by which guanide/biguanides exert their therapeutic effects remains to be elucidated. Variability in data on metformin action may arise due to differences in the dose of metformin administered in vivo ranging from 50 to 500 mg/kg, as well as observation of chronic versus acute responses to the drug.
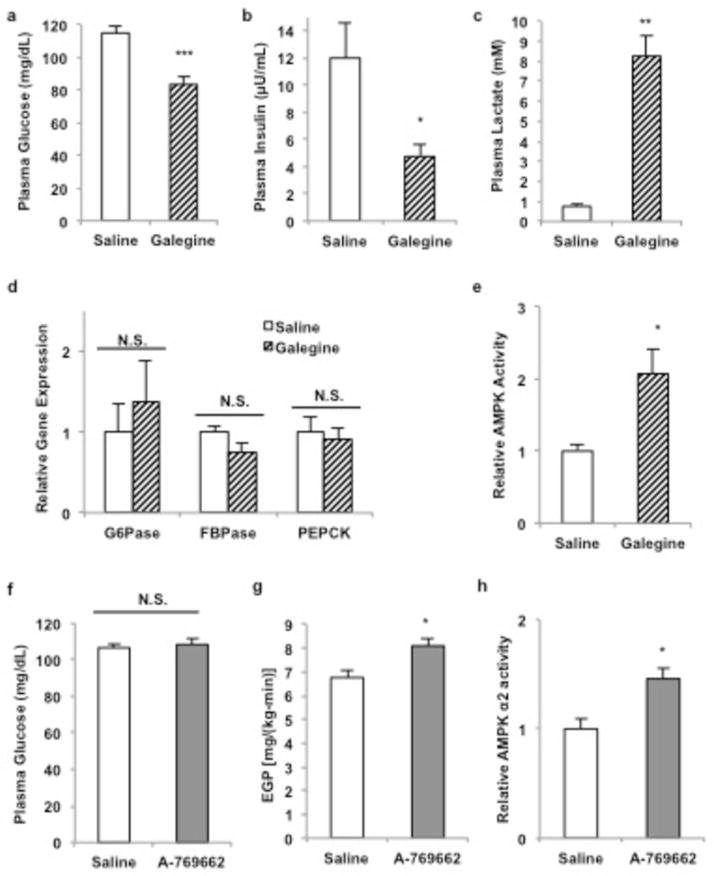
In tracing the development of this drug class to the rapid-acting parent compound galegine (a mono-guanide), we hypothesized that the acute glucose lowering effects reported might provide a model in which to investigate potential targets of action of the entire class. Within 20 minutes of intravenous (IV) infusion of galegine, plasma glucose and insulin concentrations decreased (Extended Data Fig. 1a,b), and plasma lactate concentrations increased 8-fold (Extended Data Fig. 1c), independently of any changes in hepatic gluconeogenic gene expression (Extended Data Fig. 1d). Galegine also increased total AMPKα2 activity (Extended Data Fig. 1e). However, IV administration of the AMPK activator A-769662 failed to decrease plasma glucose concentrations or EGP (Extended Data Fig. 1f,g) despite comparable increases in AMPK activity 20 minutes post-infusion (Extended Data Fig. 1h). Thus while guanide/biguanide treatment may activate AMPK, acute AMPK activation is not sufficient to reduce EGP.
Extended Data Figure 1.
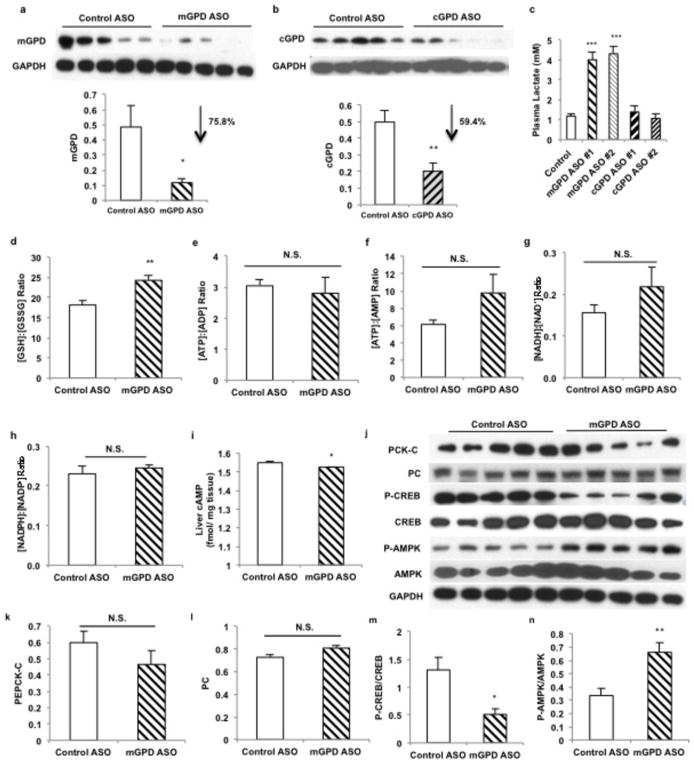
Effect of acute galegine treatment and acute AMPK activator treatment in vivo. A 20-minute infusion of galegine in rats (a) decreased fasting plasma glucose concentrations and (b) decreased fasting plasma insulin concentrations (c) increased plasma lactate concentrations, (d) independently of any changes in gluconeogenic gene expression. (e) AMPK was activated by acute galegine treatment. (f) 20-minute infusions of A-769662 in rats activated had no effect on fasting plasma glucose concentrations (g) or endogenous glucose production, in spite of (h) comparable activation of AMPK. Data are mean ± SEM, (saline, n=6; galegine, n=8; A-769662, n=5 biological replicates). * P<0.05, **P<0.01, ***P<0.001 by unpaired t-test.
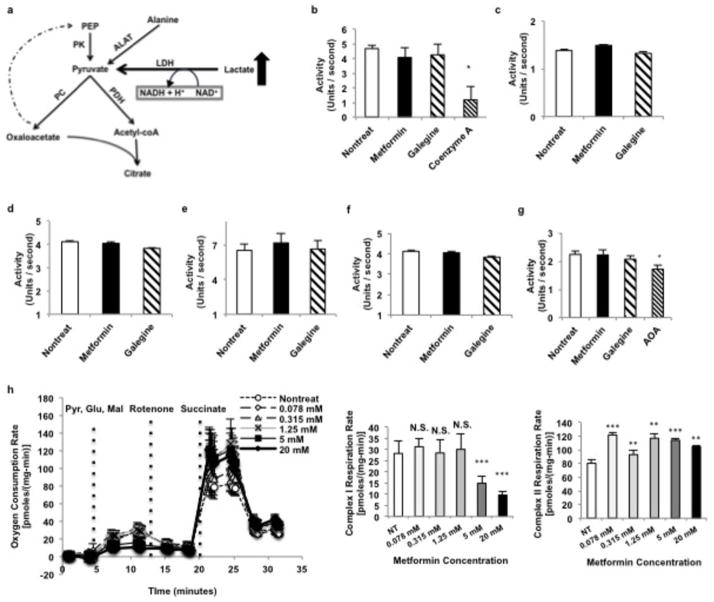
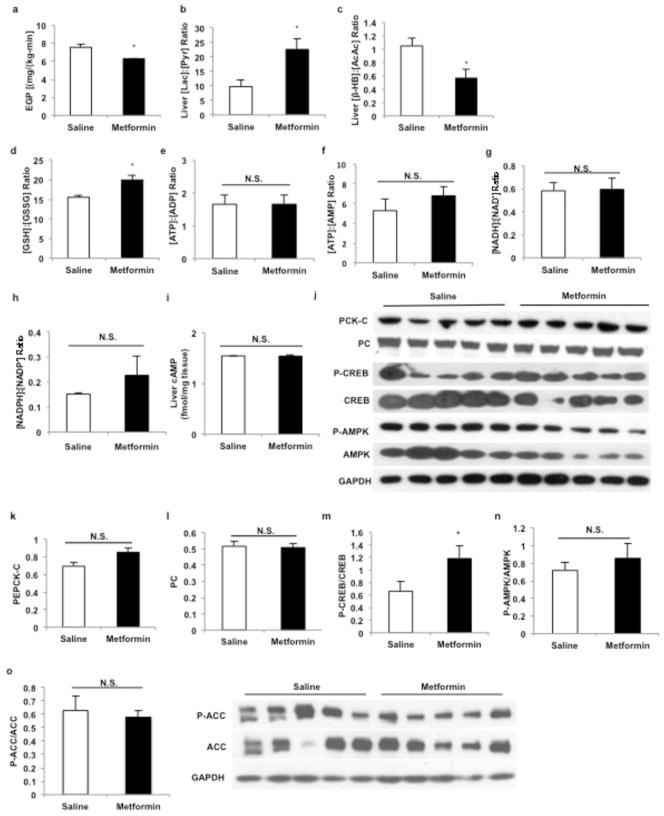
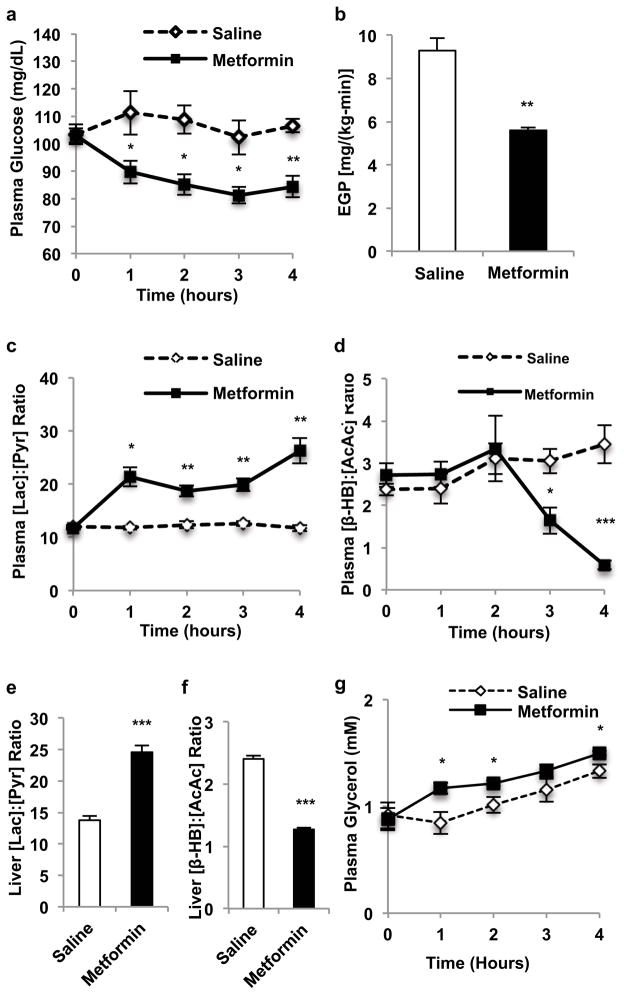
In considering other mechanisms for metformin action, we were struck by the consistent observation of a marked increase in plasma lactate concentrations in guanide/biguanide treated animals. This increase could not be attributed to reduced activity of enzymes regulating pyruvate metabolism (Extended Data Fig. 2a), as metformin, galegine and phenformin had no effect on pyruvate carboxylase (PC), citrate synthase and alanine aminotransferase (ALAT) activity (Extended Data Fig. 2b–d). We developed the alternative hypothesis that the striking increase in plasma lactate concentrations may be due to metformin-induced increases in the cytosolic redox state, known to manifest as an increase [lactate]:[pyruvate] ratio14–16. To verify this possibility we assessed the acute effects of metformin on fasting plasma glucose concentrations and rates of EGP in doses that are in the range used to treat T2D patients (20 mg/kg and 50 mg/kg) in awake rats. As early as 30 minutes post-administration, there was a marked reduction in fasting plasma glucose concentrations (Fig. 1a) and inhibition of EGP (Fig. 1b, Extended Data Fig. 3a). We measured the [lactate]:[pyruvate] and [β-hydroxybutyrate]:[acetoacetate] ratios as surrogates of the cytosolic and mitochondrial redox states, respectively14–16, and found that metformin elicited a significant increase in the cytosolic redox state and decrease in the mitochondrial redox state in both plasma and liver (Fig. 1c–f, Extended Data Fig. 3b,c). Consistent with these findings, metformin treatment increased the liver [GSH]:[GSSG] ratio, reflecting an increase in the cytosolic redox state (Extended Data Fig. 3d). These data support a mechanism for metformin’s rapid effect on hepatic glucose production through alteration of the redox state. We also observed a trend towards increased plasma glycerol concentrations, suggesting inhibition of glycerol conversion to glucose (Fig. 1g). In contrast, acute metformin treatment did not affect cellular energy charge ([ATP]:[ADP], [ATP]:[AMP], [NADH]:[NAD+], [NADPH]:[NADP+] (Extended Data Fig. 3e,f,g,h), or liver [cAMP] (Extended Data Fig. 3i). The lack of observed differences in [NADH]:[NAD+] and [NADPH]:[NADP+] ratios despite significant metformin-induced alterations in the cytoplasmic and mitochondrial redox state can most likely be attributed to the [NADH]:[NAD+] ratio moving in opposite directions in these two compartments such that total [NADH]:[NAD+] may remain the same. Finally, no differences in protein expression of the key gluconeogenic enyzmes cytosolic phosphoenolpyruvate carboxykinase (PEPCK-C) and PC were observed (Extended Data Fig. 3j–l). There was no significant AMPK activation as determined by relative levels of phosphorylated AMPK to total AMPK and no change in the phosphorylation of AMPK’s downstream target acetyl-coenzyme A carboxylase (ACC), although CREB activation was observed as determined by the ratio of phosphorylated CREB to total CREB (Extended Data Fig. 3j,m–o).
Extended Data Figure 2.
Effect of guanide/biguanide treatment on enzymes involved in pyruvate metabolism, redox regulation, and the malate-aspartate shuttle and on complex I mediated respiration. (a) Lactate enters metabolism through LDH via a redox-dependent reaction into the pyruvate pool. Pyruvate lies at the intersection of alanine influx, glycolysis, citric acid cycle and gluconeogenic flux. (b) Guanides/biguanides did not affect pyruvate carboxylase (PC) activity, compared to the known inhibitor coenzyme A, (c) and did not affect citrate synthase activity. (d) ALAT activity was also unaffected. (e) Guanides/biguanides did not affect MDH activity, (f) ASAT activity or (g) total shuttle rates. (h) Metformin had no effect on complex I mediated respiration in isolated mitochondria at concentrations less than 5 mM, and induced a slight increase in complex II respiration. Data are mean ± SEM, (n=5 technical replicates). * P<0.05, **P<0.01, ***P<0.001 by unpaired t-test.
Extended Data Figure 3.
Effect of acute metformin (20 mg/kg and 50 mg/kg, IV) treatment on EGP, liver redox, energy charge and liver gluconeogenic protein expression in Sprague-Dawley rats. (a) Acute metformin (20 mg/kg) treatment significantly lowered EGP, (b) increased the liver [lactate]:[:pyruvate] ratio and (c) decreased the liver [β-hydroxybutyrate]:[acetoacetate]. (d) Acute metformin (50 mg/kg) treatment increased liver [GSSG]:[GSH], (e) but had no effect on the liver [ATP]:[ADP] or (f) [ATP]:[AMP] ratios. (g) The [NADH]:[NAD+] and (h) [NADPH]:[NADP+] ratios also remained unchanged. (i) Acute metformin treatment had no effect on liver [cAMP] levels. (j) Acute metformin (50 mg/kg) treatment had no effect on the expression of key gluconeogenic enzymes or AMPK in the liver. (k) PEPCK-C protein expression or (l) PC protein expression were unchanged, though (m) activated CREB as determined by the ratio of phosphorylated CREB to total CREB levels was slightly increased. (n) There was no activation of liver AMPK as reflected by the ratio of phosphorylated AMPK to total AMPK levels, (o) and no change in the phosphorylation of AMPK downstream target ACC. Data are mean ± SEM, (n=6 biological replicates). * P<0.05, **P<0.01, ***P<0.001 by unpaired t-test.
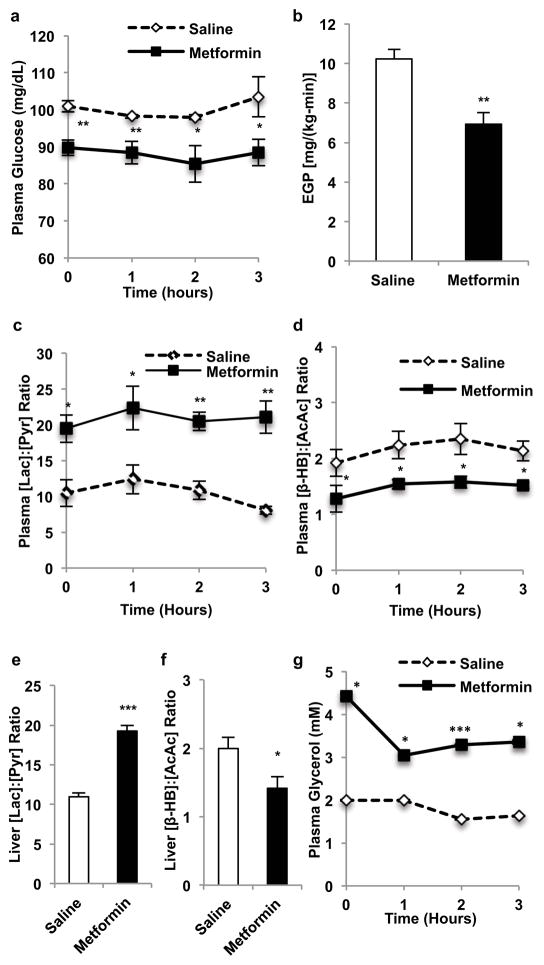
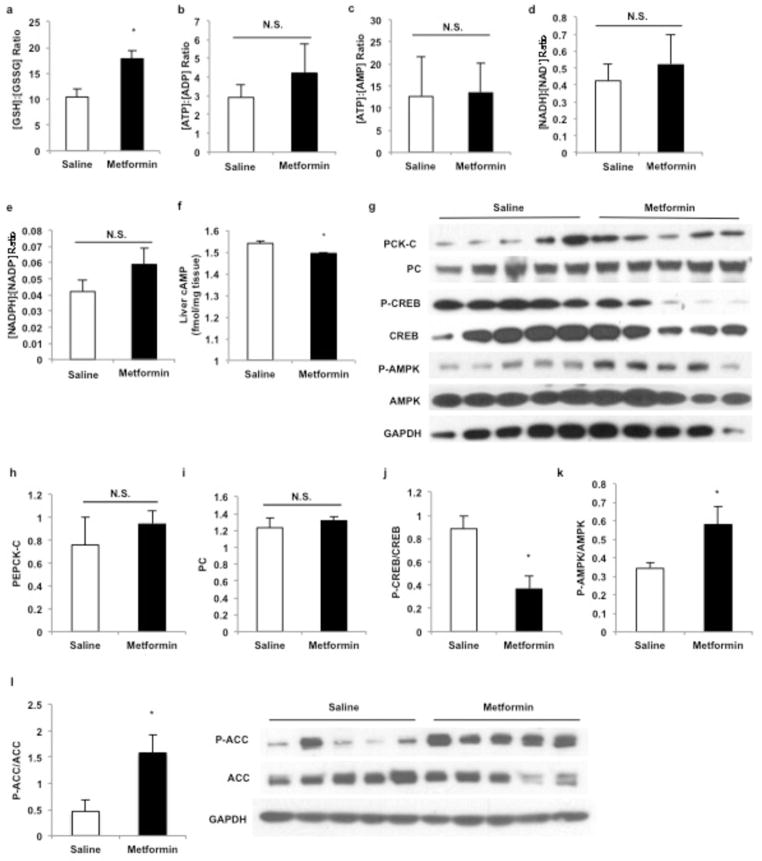
Similar to acute metformin treatment, chronic metformin treatment lowered fasting plasma glucose concentrations and EGP (Fig. 2a,b). These changes were also associated with an increase in the plasma and cytosolic redox state and a decrease in the mitochondrial redox state (Fig. 2c–f; Extended Data Fig. 4a). Plasma glycerol concentrations were also higher in these animals (Fig. 2g). Similar to what was observed with acute metformin treatment, chronic metformin treatment did not alter hepatocellular energy charge (Extended Data Fig. 4b–e), and there was only a slight reduction in liver [cAMP] (Extended Data Fig. 4f). Protein expression of the PEPCK-C and PC were also unchanged, however, AMPK was activated, ACC phosphorylation was increased and CREB activation was decreased (Extended Data Fig. 4g–l).
Figure 2.
Effects of chronic metformin (50 mg/kg, IP per day x 30 days) treatment in Sprague-Dawley rats on plasma glucose, EGP and hepatic redox state. (a) Chronic metformin treatment reduced fasting plasma glucose and (b) EGP. These changes were associated with (c) increased plasma [lactate]:[pyruvate], and (d) decreased plasma [β-hydroxybutyrate]:[acetoacetate]. Chronic metformin treatment (e) elevated hepatic cytosolic redox state, (f) decreased liver mitochondrial redox state and (g) increased plasma glycerol. Data are mean ± SEM, ((a) n=5; (b, d–g) saline n=6, metformin n=4; (c) n=4; biological replicates). * P<0.05, **P<0.01, ***P<0.001 by unpaired t-test.
Extended Data Figure 4.
Effect of chronic metformin (50 mg/kg per day, IP x 30 days) treatment on liver redox, energy charge and expression of gluconeogenic regulators. (a) Chronic metformin treatment increased the liver [GSSG]:[GSH] ratio, (b) but had no effect on the liver [ATP]:[ADP] or (c) [ATP]:[AMP] ratios. (d) The [NADH]:[NAD+] and (e) [NADPH]:[NADP+] ratios also remained unchanged. (f) Chronic metformin treatment slightly reduced liver [cAMP] levels. (g) Chronic metformin treatment had no effect on the protein levels of major gluconeogenic enzymes in the liver, (h) PEPCK-C protein expression and (i) liver PC protein levels both remaining unaltered. (j) Activated CREB as determined by the ratio of phosphorylated CREB to total CREB levels was decreased. (k) Chronic metformin treatment activated liver AMPK as indicated by the increased ratio of phosphorylated AMPK to total AMPK levels and (l) increased phosphorylation of ACC. Data are mean ± SEM, (n=6 biological replicates). * P<0.05, **P<0.01, ***P<0.001 by unpaired t-test.
Given that acute and chronic metformin treatment increased the cytoplasmic redox state and decreased the mitochondrial redox state, we next hypothesized that metformin may block one of the two major redox shuttle systems, the malate-aspartate and glycerophosphate shuttles17,18,19,20. Guanides/biguanides had no effect on total malate-aspartate shuttle activity or on malate dehydrogenase and aspartate aminotransferase activities (Extended Data Fig. 2e–g).
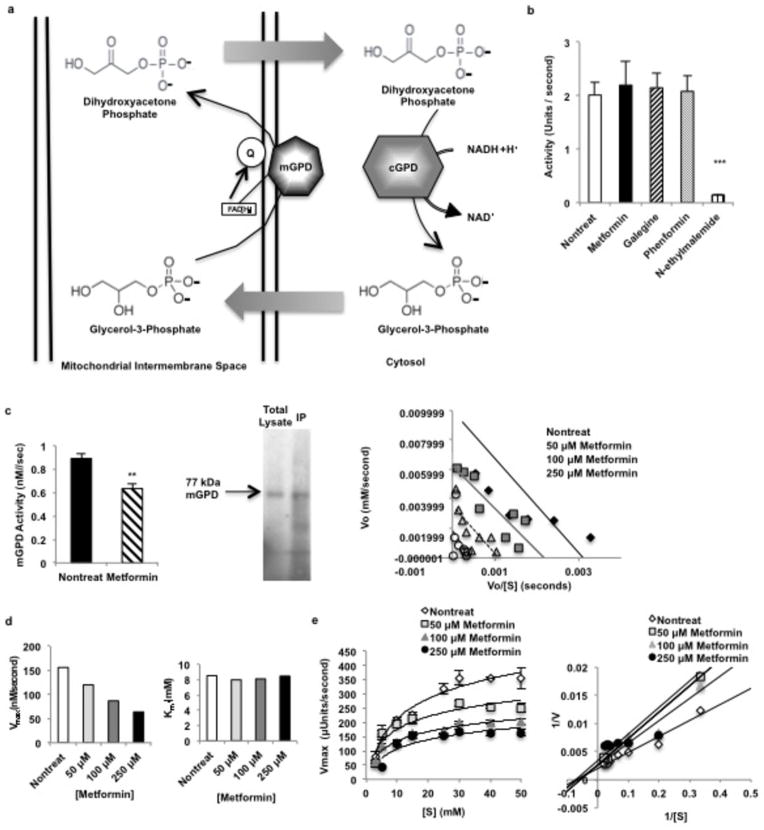
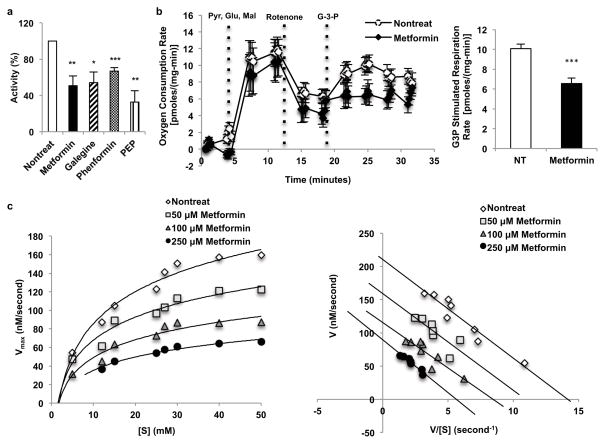
We next examined the effect of metformin on the glycerophosphate shuttle21, (Extended Data Fig. 5a). Guanides/biguanides did not alter the activity of purified, recombinant cGPD (Extended Data Fig. 5b). In contrast, all guanides/biguanides inhibited mGPD activity by 30–50% in rat mitochondrial lysates (Fig. 3a). These findings are supported by our data showing that metformin significantly inhibited mitochondrial respiration from G-3-P (Fig. 3b).
Extended Data Figure 5.
Effect of metformin on the glycerophosphate shuttle. NADH made in the cytosol via glycolysis cannot cross the mitochondrial membrane and contribute electrons to the electron transport chain (ETC) for ATP synthesis. Two mechanisms, the reversible malate-aspartate shuttle, and (a) the unidirectional glycerophosphate shuttle, oxidize NADH in the cytosol and transport electrons into the mitochondria via metabolic intermediates. The glycerophosphate shuttle is composed of cytosolic and mitochondrial glycerophosphate dehydrogenases, two structurally distinct enzymes. (b) Metformin had no effect on cGPD, which consists of two subunits and catalyzes the conversion of dihydroyacetone phosphate (DHAP) to glycerol-3-phosphate (G-3-P), oxidizing one NADH. (c) Metformin inhibited the activity of rat mGPD, a FAD+-linked enzyme that transmits electron pairs to the ETC via the quinone pool, purified from liver by immunopreciptation. Inhibition of rat mGPD was non-competitive. Data shown are the average of 5 separate experiments. (d) Metformin inhibited pure, recombinant human mGPD non-competitively, decreased Vmax without affecting Km. Data shown are representative of 2 experiments. (e) Metformin also inhibited the activity of the bacterial mGPD isoform, Pediococcus sp. α-glycerophosphate oxidase, showing non-competitive kinetics. Data are mean ± SEM, (n=4–5 technical replicates). * P<0.05, **P<0.01, ***P<0.001 by unpaired t-test.
Figure 3.
Guanides/biguanides non-competitively inhibit rat and human mGPD activity. (a) Guanides/biguanides inhibit rat mGPD activity by 30–50% in rat mitochondrial lysate. Data shown is the average of 3 experiments. (b) Metformin (50 μM) inhibited mitochondrial respiration from glycerol-3-phosphate. (c) Metformin inhibited recombinant human mGPD non-competitively as determined by Michaelis-Menten and Eadie-Hofstee plots of the kinetic data. Data shown is representative of 2 experiments. Data are mean ± SEM, (n=5 technical replicates for mGPD activity in lysate; nontreat n=12, metformin n=12 technical replicates for oxygen consumption). * P<0.05, **P<0.01, ***P<0.001 by unpaired t-test.
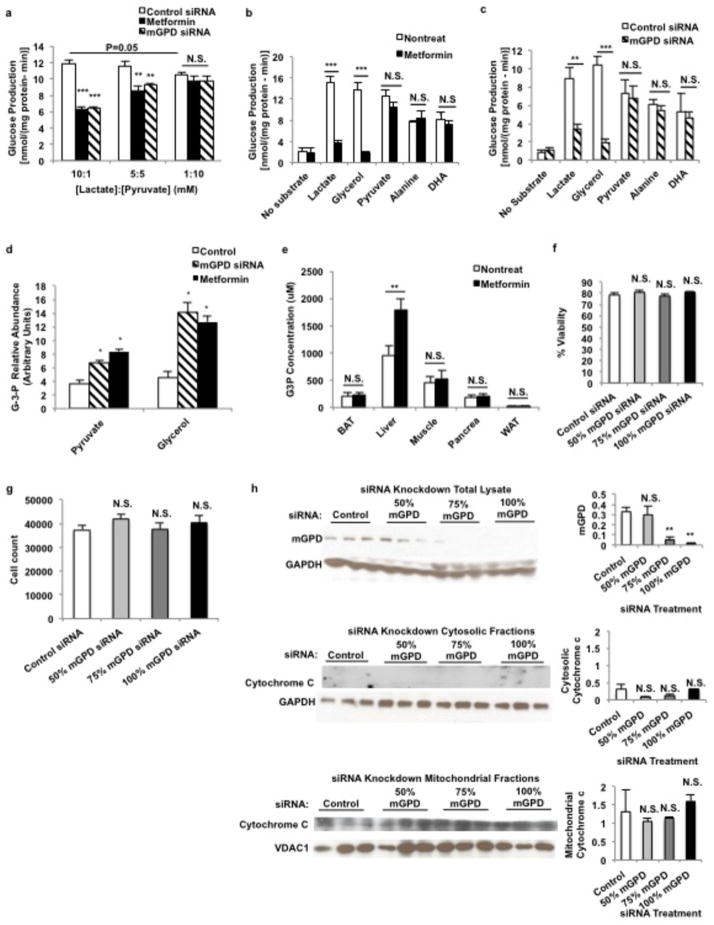
Given the impact of metformin on the cytosolic/mitochondrial redox state, we next examined whether we could influence metformin’s effectiveness by changing the cytosolic redox state by altering the extracellular [lactate]:[pyruvate] ratio22,23. Consistent with this hypothesis we found that at lower [lactate]:[pyruvate], metformin and mGPD siRNA treatment to knockdown expression of mGPD no longer significantly reduced glucose production from primary rat hepatocytes (Extended Data Fig. 6a). This finding suggests that an augmented cytosolic redox state is central to metformin-mediated reduction in hepatic gluconeogenesis.
Extended Data Figure 6.
Effect of metformin and knockdown of mGPD by siRNA on glucose production from various substrates in primary hepatocytes, and metformin-mediated increase in glycerol-3-phosphate concentrations [G-3-P]. (a) Metformin treatment (100 μM) and siRNA knockdown of mGPD in rat primary hepatocytes inhibited glucose production at higher [lactate]:[pyruvate] ratios, but lower at redox state induced by decreased [lactate]:[pyruvate] abrogated the ability of metformin and mGPD knockdown by siRNA to decrease glucose production. Decreasing redox state itself inhibited glucose production. (b) Metformin only inhibited glucose production from lactate and glycerol, but not from substrates that do not increase cytosolic redox state. (c) mGPD knockdown by siRNA showed a similar substrate-selective inhibition of glucose production. (d) Both metformin and mGPD siRNA treatment increased [G-3-P] levels in hepatocytes, and (e) acute metformin (50 mg/kg, IV) treatment in vivo increased liver [G-3-P] levels without significantly altering [G-3-P] levels in other tissues, suggesting an impasse at the mGPD catalytic step. (f) siRNA treatment did not induce cytotoxicity as determined by trypan blue exclusion, (g) CyQuant proliferation assay and (h) the absence of cytochrome c release into the cytosolic fraction from mitochondria of treated cells. Data are mean ± SEM, (n=5 technical replicates, n=3 for cytotoxicity tests (f–h)). * P<0.05, **P<0.01, ***P<0.001 by unpaired t-test.
Inhibition of mGPD would prevent glycerol from contributing to gluconeogenic flux, as glycerol must be phosphorylated by glycerol kinase to G-3-P and converted to DHAP by mGPD to contribute to glucose production. Furthermore, inhibition of mGPD would halt the glycerophosphate shuttle and lead to accumulation of cytosolic NADH, which is unfavorable for conversion of lactate to pyruvate by lactate dehydrogenase (LDH). Consistent with this hypothesis, glucose production in hepatocytes from both lactate and glycerol was inhibited by metformin and mGPD knockdown. In contrast, metformin and mGPD knockdown had no effect on gluconeogenesis from dihydroxyacetone, alanine and pyruvate, substrates that enter gluconeogenesis without augmenting the cytosolic [NADH]:[NAD+] ratio (Extended Data Fig. 6b,c). We also observed an increase in G-3-P concentrations in primary hepatocytes following metformin treatment and mGPD knockdown by siRNA, and specifically in liver following acute metformin treatment in vivo (Extended Data Fig. 6d,e) consistent with metformin inhibition of mGPD activity. These data indicate that both acute and chronic metformin treatment inhibit mGPD, limiting lactate and glycerol contributions to hepatic gluconeogenesis.
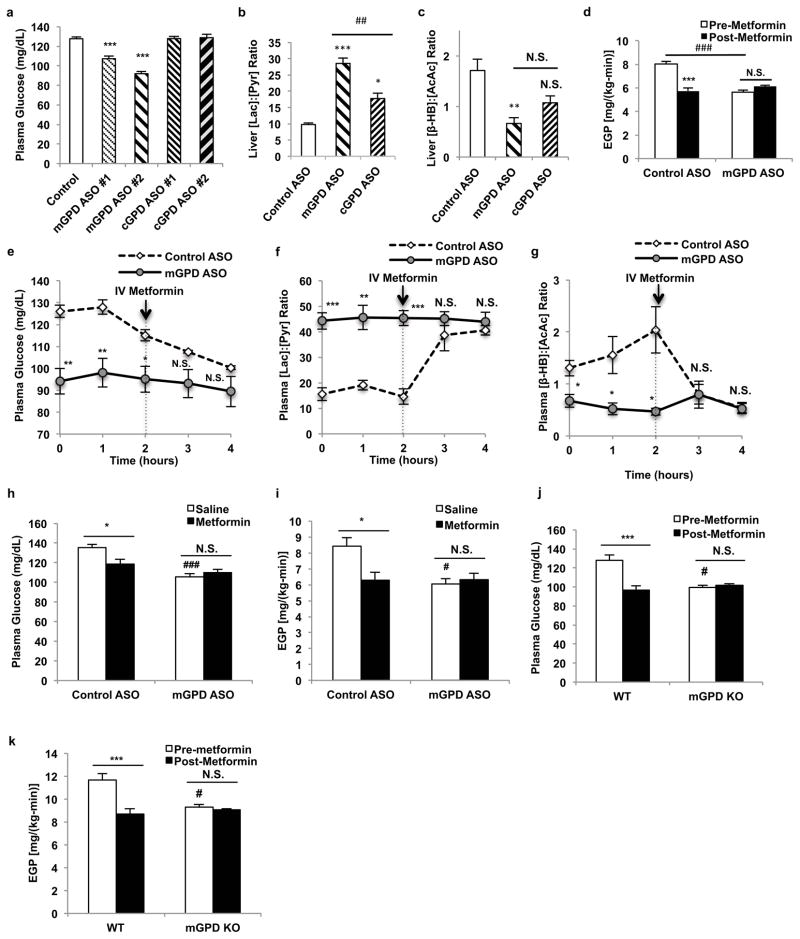
To examine whether mGPD is the molecular target for metformin in vivo, we treated rats with antisense oligonucleotides (ASO) to knock down hepatic mGPD and cGPD expression (Extended Data Fig. 7a,b). As seen with metformin treatment, mGPD ASO treatment reduced plasma glucose concentrations, increased cytosolic redox state and decreased mitochondrial redox state. In contrast, cGPD ASO treatment had only a mild effect on cytosolic and mitochondrial redox state, did not alter plasma glucose levels, and did not affect plasma lactate concentrations (Fig. 4a–c, Extended Data Fig. 7c). These data are consistent with previous studies showing that knockout of mGPD, but not cGPD, in mice results in a reduction in plasma glucose concentrations24,25.
Extended Data Figure 7.
Effect of mGPD and cGPD ASO treatment on liver redox, high-energy intermediates and expression of gluconeogenic regulators. (a) mGPD ASO effectively reduced expression of liver mGPD protein and (b) cGPD ASO effectively reduced liver cGPD protein levels. (c) mGPD ASO treatment increased plasma lactate concentrations significantly, but cGPD ASO knockdown had no effect on plasma lactate concentrations. (d) mGPD ASO knockdown increased the liver [GSSG]:[GSH] ratio, (e) had no effect on the liver [ATP]:[ADP], (f) [ATP]:[AMP], (g) [NADH]:[NAD+] or (h) [NADPH]:[NADP+] ratios, (i) though liver [cAMP] levels were slightly decreased. (j) ASO-mediated knockdown of mGPD did not affect expression of gluconeogenic enzymes, (k) PEPCK-C and (l) PC protein levels remaining unchanged in the liver. (m) Activated CREB as determined by the phosphorylated CREB was decreased, (n) and mGPD ASO knockdown led to activation of liver AMPK as indicated by increased phosphorylated AMPK and (o) increased ACC phosphorylation. Data are mean ± SEM, (n=6 biological replicates). * P<0.05, **P<0.01, ***P<0.001 by unpaired t-test.
To further investigate whether mGPD is metformin’s primary target, we examined if mGPD ASO treatment would abrogate metformin’s inhibitory effects on EGP. mGPD ASO treatment lowered plasma glucose concentrations and inhibited EGP. Moreover, mGPD ASO treatment abrogated metformin’s ability to decrease plasma glucose concentrations and inhibit EGP (Fig. 4d,e). mGPD ASO treated animals also had increased plasma [lactate]:[pyruvate] and decreased plasma [β-hydroxybutyrate]:[acetoacetate] ratios, whereas metformin had no additional effect on these parameters (Fig. 4f,g). As seen with metformin treatment, mGPD ASO increased the liver [GSH]:[GSSG] ratio, reflecting an increase in the cytosolic redox state (Extended Data Fig. 7d). In contrast the energy charge in the liver was unaltered by mGPD knockdown (Extended Data Fig. 7e–h), though a slight decrease in liver [cAMP] was observed (Extended Data Fig. 7i). There was no appreciable effect of mGPD knockdown on hepatic PEPCK-C and PC expression, though AMPK activation, increased ACC phosphorylation and suppression of CREB activation were observed (Extended Data Fig. 7j–o). Chronic metformin treatment of mGPD ASO knockdown rats also had no added effect on plasma glucose concentrations or EGP (Fig. 4h–i). We next examined whether metformin’s effects would be abrogated in a whole-body mGPD knockout mouse and found that these mice, similar to the mGPD ASO treated rats, had decreased fasting plasma glucose concentrations and decreased rates of EGP compared to wild type littermates, and that the effects of acute metformin treatment on plasma glucose concentrations and EGP were also abrogated in mGPD knockout mice (Fig. 4j,k).
Figure 4.
Effects of mGPD and cGPD ASO treatment in Sprague-Dawley rats on metformin action. (a) Knockdown of hepatic mGPD, but not cGPD, by two ASOs reduced fasting plasma glucose. (b) mGPD ASO treatment increased liver [lactate]:[pyruvate], and (c) decreased liver [β-hydroxybutyrate]:[acetoacetate]. cGPD ASO treatment had a less marked effect on both liver redox ratios. (d) mGPD knockdown decreased EGP and abrogated metformin’s effect on EGP. (e) Knockdown of hepatic mGPD decreased plasma glucose (f) increased plasma [lactate]:[pyruvate], (g) decreased plasma [β-hydroxybutyrate]:[acetoacetate] and abrogated metformin’s effect on these parameters. (h) In mGPD ASO treated rats, chronic metformin treatment had no effect on plasma glucose, (i) or EGP. mGPD knockout mice had (j) decreased plasma glucose, (k) reduced EGP, and did not respond to acute metformin treatment. Data are mean ± SEM, ((a) n=6; (b) Control n=6, mGPD n=5, cGPD n=5; (c) Control n=6, mGPD n=5, cGPD n=6; (d) n=5; (e) Control n=4, mGPD n=6; (f,g) Control n=4, mGPD n=5; (h,i) n=7; (j) WT n=13, KO n=4; (k) WT pre-metformin n=9, WT metformin n=13, KO n=4; biological replicates). * P<0.05, **P<0.01, ***P<0.001 by ANOVA; # P<0.05, ##P<0.01, ###P<0.001 by ANOVA.
We further characterized the nature of metformin’s effect on mGPD kinetics, and found that metformin inhibited isolated rat mGPD activity non-competitively with a Ki of ~38 μM (Extended Data Fig. 5c). Metformin also inhibited purified recombinant human mGPD activity, exhibiting non-competitive kinetics with a Ki of ~55 μM (Fig. 3c, Extended Data Fig. 5d), and non-competitively inhibited activity of pure, Pediococcus α-glycerophosphate oxidase, a bacterial isoform of mammalian mGPD (Extended Data Fig. 5e).
The glycerophosphate shuttle has an important role in the regulation of hepatic gluconeogenesis26,27, mGPD’s role as a regulator of EGP being strongly supported by the finding that mGPD knockout mice have lowered plasma glucose concentrations28 and are protected from diet-induced hyperglycemia29. We found that metformin inhibits mGPD activity in vitro with an approximate Ki value close to the observed range of plasma metformin levels (10–40 μM) in patients treated with a normally prescribed dose of one gram of metformin twice a day11. Our measurements of metformin concentrations in the plasma and liver of rats treated acutely with 50 mg/kg metformin gave us a peak average value of 74 μM and 100 μM, respectively, 30 minutes post-administration (Extended Data Fig. 9). These pharmacokinetic data are consistent with the acute metformin-mediated inhibition of hepatic gluconeogenesis within a similar time frame and are consistent with the need to provide twice a day dosing of metformin to patients with T2D for optimal plasma glucose lowering. Previous studies assessing metformin action in vivo have typically used metformin doses ranging from 250 mg/kg to 500 mg/kg metformin, which are supra-pharmacological and result in plasma metformin concentrations >1 mM (Extended Data Fig. 9). In this regard, while metformin inhibited mitochondrial respiration from G-3-P at micromolar concentrations, complex I respiration was affected only at metformin concentrations greater than 1 mM, which are not clinically relevant (Extended Data Fig. 2h).
Extended Data Figure 9.
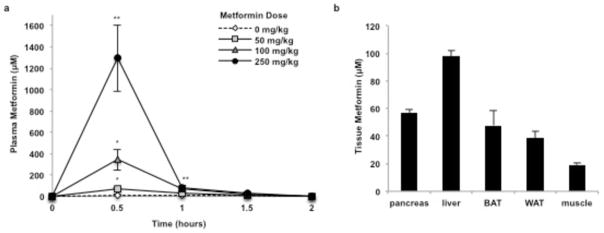
Plasma and tissue metformin concentrations in rats treated with metformin. (a) Acute metformin (50 mg/kg, IV) administration led to peak plasma metformin concentrations of approximately 74 μM; 100 mg/kg and 250 mg/kg doses increased plasma metformin concentration to 345 μM and 1300 μM, respectively. (b) Acute metformin (50 mg/kg, IV) led to liver metformin concentrations of approximately 100 μM, and metformin levels in other tissues were comparatively low. Data shown is representative of 2 experiments. Data are mean ± SEM, (n=3 biological replicates for plasma concentrations, n=5 biological replicates for tissue levels). * P<0.05, **P<0.01, ***P<0.001 by ANOVA.
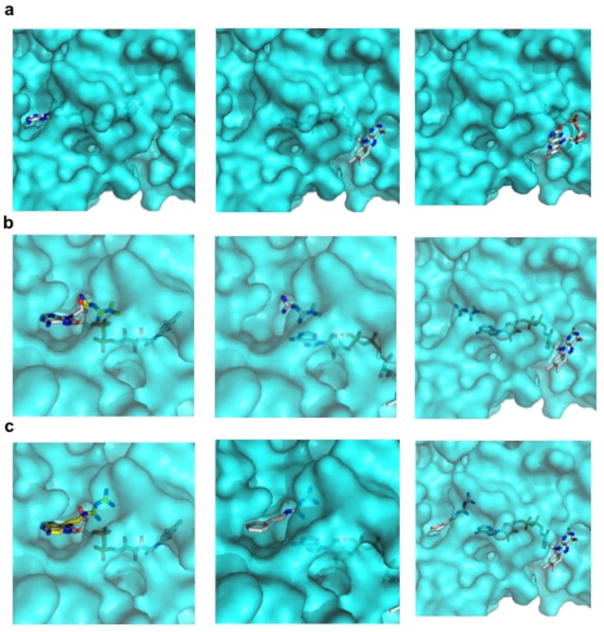
The kinetics of metformin inhibition of mGPD was found to be non-competitive, which raises the question of how this might be achieved. Computational analyses of the structure of the mGPD isoform, Streptococcus sp. α-glycerophosphate oxidase30, mutated in the FAD binding pocket to the sequence of the human mGPD, found that metformin shows favorable binding to the FAD+-containing pocket (Extended Data Fig. 8a–c). Based on these predictions, FAD+, which is non-covalently associated to the enzyme, may dynamically slide in and out of the wider entrance of the tunnel-shaped pocket, and metformin may enter from the smaller end, preventing complete re-entry of FAD+ and inhibiting electron transfer. Although speculative, this model could explain how metformin could displace the flavin ring and inhibit enzymatic activity without necessarily invoking FAD turnover.
Extended Data Figure 8.
Computational binding model of guanides/biguanides to mGPD from Streptococcus sp. Modeling of guanides/bigaunides binding to mGPD after modification of key residues to fit the human sequence, show (a) FAD+ binding and predicted movement in the pocket, (b) metformin binding, and (c) phenformin binding to the FAD+-containing pocket.
In summary, we have shown that metformin treatment of rats at doses that achieve comparable plasma metformin concentrations observed in metformin-treated T2D patients inhibits mGPD non-competitively and modulates cytosolic and mitochondrial redox state, inducing an effective reduction in EGP. These results identify mGPD as one of the primary molecular targets by which guanides/biguanides inhibit hepatic gluconeogenesis, and provide a novel therapeutic target for T2D.
Methods Summary
Hepatocyte Studies
Primary hepatocytes were isolated from 24-hour fasted Sprague-Dawley rats and treated with or without 100 μM metformin in DMEM supplemented with 10 mM substrate (glycerol at 100 μM). Glucose was measured using Genzyme Glucose-SL reagent.
Animal Studies
Studies were performed in 24-hour fasted, awake, unrestrained male Sprague-Dawley rats. Acute metformin was administered intravenously (IV) and chronic metformin was administered intraperitoneally (IP) at 50 mg/kg daily over 30 days. Continuous 1 mg/(kg-min) arterial infusion of [6,6-2H2]-glucose tracer was administered to measure EGP. Plasma glucose was measured on the YSI 2700 Biochemistry Analyzer. All other metabolites were measured using enzymatic methods. Whole-body mGPD knockout mouse embryos were a kind gift from Michael J. MacDonald, University of Wisconsin School of Medicine and Public Health. Overnight fasted mice were infused with [3-3H]glucose at 0.05 μCi/min for 120 minutes to measure basal glucose turnover. Mice were restrained during the studies, and given acute metformin (50 mg/kg, IV) or saline. All animal studies were conducted with prior approval from Yale University Institutional Animal Care and Use Committee (IACUC).
ASO Treatment Studies
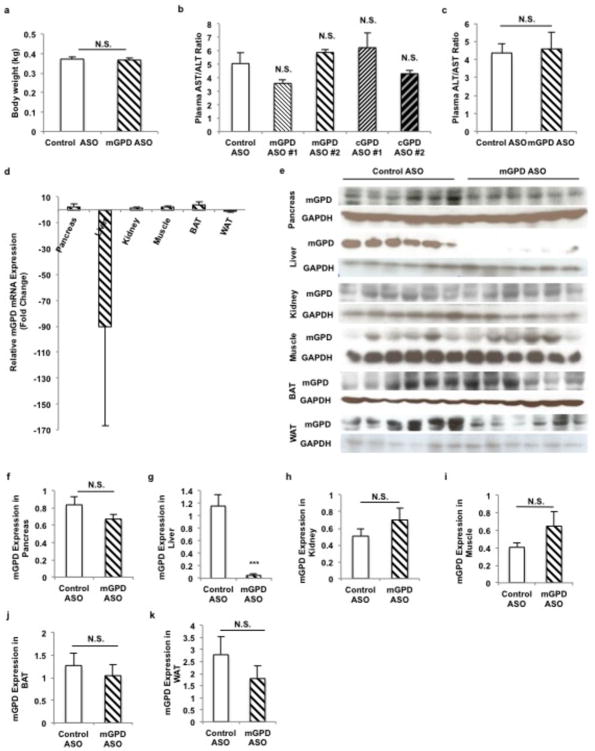
ASO treatment was administered at 37.5 mg/kg twice weekly for 4 weeks by IP injection. ASO treatment knocked down mGPD mRNA and protein only in the liver (Extended Data Fig. 10).
Extended Data Figure 10.
Effect of mGPD and cGPD antisense oligonucleotide (ASO) treatment on liver toxicity and tissue-specific knockdown of mGPD expression by mGPD ASO. (a) mGPD ASO treatment had no effect on body weight after treatment at 37.5 mg/kg ASO twice a week for 4 weeks. (b) All ASOs screened in this study, mGPD ASO #1, mGPD ASO #2, cGPD ASO #1 and cGPD ASO #2 elicited no significant liver toxicity as determined by plasma AST/ALT levels after 4 weeks. (c) Treatment with mGPD ASO #2 for 4 weeks during the mGPD ASO with acute metformin study also had no effect on plasma AST/ALT. (d) mGPD ASO treatment led to cleavage of mGPD mRNA transcript exclusively in the liver, only slightly decreasing transcript levels in white adipose tissue and having no effect on mGPD mRNA in other tissues. (e–k) mGPD ASO treatment specifically reduced protein expression of mGPD in the liver, with no significant effect on mGPD protein levels in the pancreas, kidney, muscle, white adipose or brown adipose. Data are mean ± SEM, (n=6 biological replicates). * P<0.05, **P<0.01, ***P<0.001 by unpaired t-test.
Enzyme Assays
mGPD activity in rat liver mitochondrial lysate was measured using cytochrome c as the electron acceptor and measuring gain of absorbance at 550 nm. Activities of rat mGPD isolated from rat mitochondrial lysate using anti-GPD2 antibody K-14, and human mGPD overexpressed in HEK 293 cells from an Origene vector were measured using 2,6-dichloroindophenol (DCIP) and measuring loss of absorbance at 600 nm. Kinetic measurements were made using the Flexstation 3 Benchtop Multi-Mode Microplate Reader (Molecular Devices).
Oxygen Consumption
Studies were performed on the Seahourse Bioscience XF24 Analyzer.
Full methods and any associated references are available in the online version of the paper.
Methods
Hepatocyte Studies
Primary hepatocytes were freshly isolated by collagenase digestion of livers from hepatic glycogen-deplete, 24-hour fasted Sprague-Dawley rats, and plated on collagen-coated 6-well plates. Cells were cultured overnight in recovery media (DMEM supplemented with 4.5 g/mL glucose, 1 nM dexamethasone, insulin, 10% FBS, 1% penicillin-streptomycin, 10 mM HEPES and 3.7 mg/mL sodium bicarbonate). Cells were then pre-incubated for 2 hours in no-glucose DMEM supplemented with 10 mM HEPES and 3.7 mg/mL sodium bicarbonate with or without 100 μM metformin, followed by a 2-hour incubation in no-glucose DMEM supplemented with 10 mM substrate (except glycerol, which was added at 100 μM). Cells were treated with 20 nM siRNA in recovery media overnight: siRNA transfection was performed using RNAiFect Transfection reagent (Qiagen, Cat. No. 301605). siRNA sequences used were control (Sigma Aldrich Mission siRNA Universal Negative Control, Cat. No. SIC001) and mGPD (Sigma Aldrich, ID: SASI_Rn02_00260086, Sequence Start: 1395, NCBI Gene ID: NM_012736). siRNA did not induce cytotoxicity, as determined by trypan blue exclusion, CyQuant Assay (Life Technologies, Cat. No. C35011) and cytochrome c release into the cytosolic fraction (Extended Data Fig. 6f–h). Glucose in the media was measured using Genzyme Glucose-SL reagent, and glucose production was normalized to total protein levels as measured by Bradford assay.
Animal Studies
Male Sprague-Dawley rats were acquired from Charles River, and were administered regular chow and water ad libitum. Rats were housed individually on a 12:12-hour light/dark cycle. Arterial lines were surgically implanted into the carotid artery and venous lines into the jugular vein of rats for the studies. All animal studies included 6–10 rats per group, aged 9–12 weeks and weighed 300–450 g at the time of study. Animals were randomly allocated to treatment groups prior to collection of any data (e.g. weight) or surgical procedures and the studies were performed unblinded. Sample sizes were selected to detect moderate to large (>20%) differences. All studies were performed in awake, unrestrained animals. Acute metformin was administered intravenously (IV) in 0.9% saline at 20 mg/kg, 50 mg/kg, 100 mg/kg and 250 mg/kg and chronic metformin was administered intraperitoneally (IP) at 50 mg/kg daily over 30 days. Galegine solutions were prepared in normal saline and infused IV at 25 mg/(kg-hr) following a 5 minute 250 mg/(kg-hr) prime. Rats were fasted for 24 hours before studies were conducted. Rats were anesthetized by IV pentobarbital. A continuous arterial infusion of [6,6-2H2]-glucose tracer at a rate of 1 mg/(kg-min) was administered throughout the study (following a 5 min, 3 mg/(kg-min) prime) in order to measure EGP. Plasma glucose enrichment was measured by derivatizing deproteinized plasma samples with acetic anhydride and pyridine, and 2H enrichment was measured via GC/MS as previously described1. Plasma glucose was measured on the YSI 2700 Biochemistry Analyzer from sampled venous blood. All other plasma metabolites were measured from sampled venous blood using enzymatic methods and monitoring changes in NADH absorbance at 340 nm. Liver metabolites were measured from PCA-extracted samples immediately after collection. High-energy intermediates were measured from liver tissue extracted in a methanol, ammonium acetate based buffer by LC/MS/MS, and values were normalized to an added internal standard, D4-taurine. Tissues were rapidly acquired and freeze-clamped in situ within 10 seconds of euthanizing the animals -- delays in tissue processing contribute extensive errors to [ATP]:[ADP] and [ATP]:[AMP] ratios which should be approximately 2:1 and 10:1, respectively, in normal tissues31.
Whole-body mGPD knockout mouse embryos were a kind gift from Michael J. MacDonald, University of Wisconsin School of Medicine and Public Health. Mice were bred and genotyped following standard protocols. Catheters were surgically implanted into the jugular vein of mice 5–7 days prior to performing glucose infusion studies for as previously described.32 Mice were fasted overnight prior to the studies, and infused with [3-3H]glucose at a rate of 0.05 μCi/min for 120 minutes to measure basal glucose turnover. Mice were restrained during the studies, and given at acute dose of metformin (50 mg/kg, IV) or saline control.
All studies involving animals were conducted with prior approval from Yale University Institutional Animal Care and Use Committee (IACUC) in compliance with the ethical standards outlined by the IACUC.
ASO Treatment Studies
ASO treatment was administered at a dosing schedule of 37.5 mg/kg twice weekly for 4 weeks by IP injection, and for 6 weeks at the same dose for the chronic metformin with mGPD ASO treatment study. ASOs used in vivo were selected from a pool of approximately 80 ASOs that were pre-screened in vitro for target efficacy. The most active compounds were further screened in vivo to select the compounds used in this study. The ASO identification numbers and sequences are as follows: control ASO used in all studies: 5′-CCTTCCCTGAAGGTTCCTCC-3′ (ID: ISIS 141923), cGPD ASO #1: 5′-GTCCACCTCTTGTACCACGG-3′ (ID: ISIS 594525), cGPD ASO #2: 5′-GTGGTGTCACACGCTTCTGC-3′ (ID: 594536), mGPD ASO #1: 5′-GGCAGCTACAATGGCCACTA-3′ (ID: 594990), mGPD ASO #2: 5′-AGCAAGGATTTTTCTGGCAA-3′ (ID: 594995). mGPD ASO #2 and cGPD ASO #1 were used for all studies post-screening. ASOs were re-suspended and delivered in 0.9% saline. ASO treatment did not induce liver toxicity, as measured by plasma AST/ALT for the mGPD vs cGPD ASO study and the mGPD with acute metformin study, and mGPD ASO treatment did not alter body weight (Extended Data Fig. 10a–c). ASO treatment caused robust, targeted knockdown of mGPD mRNA and protein in only the liver, with only a slight decrease in mRNA in the white adipose tissue (WAT; Extended Data Fig. 10d), and a minimal yet insignificant decrease in mGPD protein levels in the WAT and the pancreas. There was no effect on either mRNA transcript or protein levels in the muscle, brown adipose or kidney (Extended Data Fig. 10e–k).
Galegine Synthesis
Galegine was prepared according to the procedure reported by Carmignani et al.33
AMPK Activity Assay
Freeze-clamped livers were ground and lysed in lysis buffer (50 mM Tris-HCl pH 7.5, 50 mM NaF, 5 mM NaPPi, 1 mM EDTA, 1 mM EGTA, 1 mM dithiothrietol, 1 mM benzamidine, 1 mM phenylmethanesulfonyl fluoride, 10% v/v glycerol, 1% v/v Triton X-100). Liver homogenates were centrifuged at 20, 800 × g for 15 min at 4°C and protein concentration was measured by Bradford assay. AMPKα2 was immunoprecipitated overnight from cell lysates containing 1 mg protein using 10 μl AMPKα2 antibody (Santa Cruz Biotechnology, Cat. No.: sc-19131). Liver AMPKα2 activity was determined by the incorporation of [32P]ATP into a synthetic peptide containing the AMARA sequence.
Real Time Quantative RT-PCR Analysis
RNA was isolated using the Qiagen RNAeasy kit (Qiagen). mRNA was reverse transcribed to cDNA using MuLV reverse transcriptase (New England Bio Labs). The abundance of transcripts was assessed by real-time PCR on a 7500 Fast Real-Time PCR System (Applied Biosystems). Each run was evaluated in duplicate for both the gene of interest and actin as a control. The expression data for the gene of interest and actin were normalized for the efficiency of amplification determined by the standard curve included for each data acquisition. Primer sequences used were as follows: mGPD forward 5′-AGGAGGCAAAGATTGGAGCC-3′, mGPD reverse 5′-TCTGACACAAGACGCACTCC-3′, cGPD forward 5′-AAGACATCGGGGGCAGAAAG-3′, cGPD reverse 5′-GGCCCTCGTCTATCCCCTTA-3′, actin forward 5′-CCAGATCATGTTTGAGACCTTC-3′, actin reverse 5′-CATGAGGTAGTCTGTCAGGTCC-3′.
Enzyme Assays
Enzyme assays measuring mGPD activity using rat liver mitochondrial lysate preparation were performed using cytochrome c as the electron acceptor and measuring gain of absorbance at 550 nm (reaction buffer consisted of 10 mM Tris-HCl, 50μM cytochrome c, 25 μM sodium azide, 1 mM EDTA, 50 mM KCl; buffers were bubbled with N2 gas prior to assay; lysates were pre-incubated in buffer with or without treatment for 10 min; reaction conducted at 38°C). Mitochondria were isolated less than 3 hours prior to conducting activity assays from fresh rat livers. Briefly, rat liver was homogenized using a glass dounce homogenizer in ice-cold isolation buffer (210 mM sucrose, 660 mM mannitol, 30 mM KH2PO4, 15 mM MgCl2-6H2O, 3 mM EGTA and 75 mM MOPS). Mitochondria were separated from total homogenate by differential centrifugation. Rat mGPD was isolated from rat mitochondrial lysate by immunoprecipitation by anti-GPD2 antibody K-14 (Santa Cruz Biotechnology, Cat. No.: sc-161680) at a ratio of 1 mg lysate protein per 10 μl antibody, overnight, at 4°C. Activity was measured using 2,6-dichloroindophenol (DCIP) as the electron acceptor and measuring loss of absorbance at 600 nm (reaction buffer consisted of 50 mM KH2PO4, 95 μM DCIP; reaction conducted at 38°C; mitochondrial lysate pre-incubated in buffer with or without metformin for 10 min). Human mGPD tagged with Myc-DDK was overexpressed in HEK 293 cells (ATCC® CRL-1573™) from a pre-designed vector available from Origene. Recombinant human mGPD was isolated by immunoprecipitation from the cell lysates using an anti-DDK antibody (Origene) at 10 μl antibody per 1 mg lysate protein, and activity was measured using DCIP as the electron acceptor. Recombinant, purified Pediococcus sp. α-glycerophosphate oxidase was obtained from Sigma and activity was determined by indirectly detecting peroxide production via oxidation of o-phenylenediamine in the presence of phenol and measuring increase in absorbance at 450 nm. Michaelis-Menten, Eadie-Hofstee and Lineweaver-Burk plots were used to determine the kinetics of inhibition. Kinetic measurements were made using the Flexstation 3 Benchtop Multi-Mode Microplate Reader (Molecular Devices).
Western Blotting
Liver lysates were made by homogenizing pulverized, freeze-clamped liver tissue in lysis buffer (50 mM Tris-HCl pH 7.4, 1 mM EGTA, 150 mM NaCl, 5 mM MgCl2, 1% NP-40) with added cOmplete protease inhibitor tablet (Roche) per 50 mL buffer. SDS samples were prepared by adding 2x SDS sample buffer (20% glycerol, 120 mM Tris-HCl pH 6.8, 4% SDS, 0.02% bromophenol blue, 4% β-mercaptoethanol) to one volume of lysate and boiling at 95°C for 5 min. Samples were run on Novex 4–12% Tris-Glycine gels (Invitrogen) and gels were transferred to PVDF membranes by semi-dry transfer. Antibodies used to determine protein expression were: PEPCK-C H-300 (Santa Cruz Biotechnology, Cat. No.: sc-32879), PCB H-2 (Santa Cruz Biotechnology, Cat. No.: sc-271493), Phospho-CREB Ser133 87G3 (Cell Signaling, Cat. No.: 9198), CREB 48H2 (Cell Signaling, Cat. No.: 9197), Phospho-AMPKα Thr172 40H9 (Cell Signaling, Cat. No.: 2535), AMPKα (Cell Signaling, Cat. No.: 2532), GAPDH D16H11 XP® (Cell Signaling, Cat. No.: 5174) and anti-GPD2 K-14 (Santa Cruz Biotechnology, Cat. No.: sc-161680).
Molecular Docking & Binding Simulation
Molecular docking simulations were performed using the program Glide (Schrodinger), with a modified version of the crystal structure of alpha-glycerophosphate oxidase from Streptococcus sp. (PDB ID# 2RGH) as the target enzyme. Sequence alignments with human mitochondrial glycerol-3-phosphate dehydrogenase (hG3PD, NCBI Reference Sequence: NM_000408.4) were used to mutate the FAD binding site coordinates of 2RGH to the corresponding hG3PD sequence. As a positive control, a docking simulation of FAD to this target protein yielded a result essentially identical to the actual FAD position observed in the 2RGH structure. Subsequent docking simulations were conducted using metformin, buformin, phenformin and galegine.
Oxygen Consumption Studies
Mitochondria were prepared immediately prior to each study on the Seahourse Bioscience XF24 Analyzer. Liver was rapidly excised from an overnight fasted rat anesthetized under isoflurane. Liver was then homogenized in mitochondrial assay solution (MAS: 70 mM sucrose, 220 mM mannitol, 5 mM KH2PO4, 5 mM MgCl2, 2 mM HEPES, 1 mM EGTA, 0.2% BSA). Mitochondria were purified by differential centrifugation and the mitochondrial pellet was used for respiration studies in MAS without BSA. All reagents were diluted in MAS w/o BSA and loaded into the ports of the flux plate (port A: 10 mM pyruvate, 2.5 mM glutamate, 2,5 mM malate; port B: 2 μM rotenone; port C: 5 mM succinate or 10 mM G-3-P; port D: 1 μg/ml oligomycin).
Statistical analysis
All data are expressed as mean ± SEM. P values less than 0.05 were considered statistically significant differences as determined by unpaired two-tailed Student’s t test or ANOVA. Data shown are representative of repeated experiments performed as indicated; where not indicated, a single experiment was performed. All replicates are biological replicates unless otherwise indicated.
Figure 1.
Effects of acute metformin (50 mg/kg, IV) treatment in Sprague-Dawley rats on plasma glucose, EGP and hepatic redox state. (a) Metformin acutely reduced fasting plasma glucose and (b) EGP. These changes were associated with (c) increased plasma [lactate]:[pyruvate] and (d) decreased plasma [β-hydroxybutyrate]:[acetoacetate]. (e) Increased hepatic cytosolic redox state, (f) decreased liver mitochondrial redox state and (g) a tendency to increased plasma glycerol were observed. Data set shown is representative of 3 experiments. Data are mean ± SEM, ((a) saline n=3, metformin n=4; (b–d, g) n=4; (e,f) n=6; biological replicates). * P<0.05, **P<0.01, ***P<0.001 by unpaired t-test.
Acknowledgments
The authors would like to thank Jianying Dong, Mario Kahn, Yanna Kosover and Jennifer J. Hsiao for their technical support and Suresh Singh and Dick Gregg for helpful discussions. This publication was supported by grants from the National Institutes of Health: R24 DK-085638, R01 DK-40936, P30 DK-45735, P30 DK-034989 and the Novo Nordisk Foundation Center for Basic Metabolic Research. Its contents are solely the responsibility of the authors and do not necessarily represent the official view of NCRR or NIH.
Footnotes
Reprints and permissions information is available at www.nature.com/reprints.
The authors declare no competing financial interests.
Author Contributions
A.K.M., D.M.E., V.T.S., R.G.K., J.-P.C., M.J.J., H.-Y.L., G.I.S. designed the experimental protocols. A.K.M., D.M.E., Y.R., J.H., X-M. Z., G.W.C., R.G.K., J.-P.C., M.J.J., H.-Y.L. performed the studies, A.K.M., D.M.E., X-M. Z., D.B., R.A.A., G.W.C., J.-P.C., M.J.J., H.-Y.L. analyzed the data, B.J.P., J.L.W., S.B., M.J.M supplied reagents, A.K.M., D.M.E., Y.R., G.W.C., V.T.S., R.G.K., R.A.A., M.J.M, G.I.S. contributed to the writing of the manuscript.
References
- 1.Hundal RS, et al. Mechanism by which metformin reduces glucose production in type 2 diabetes. Diabetes. 2000;49:2063–2069. doi: 10.2337/diabetes.49.12.2063. [DOI] [PMC free article] [PubMed] [Google Scholar]
- 2.Inzucchi S, MD, Spollett GR, Page SL, Rife FS, Walton V, Shulman GI. Efficacy and metabolic effects of metformin and troglitazone in type II diabetes mellitus. N Eng J Med. 1998;338:867–872. doi: 10.1056/NEJM199803263381303. [DOI] [PubMed] [Google Scholar]
- 3.El-Mir M-Y, NV, Fontaine E, Averet N, Rigoulet M, Leverve X. Dimethylbiguanide Inhibits Cell Respiration via an Indirect Effect Targeted on the Respiratory Chain Complex I. J Biol Chem. 2000;275:223–228. doi: 10.1074/jbc.275.1.223. [DOI] [PubMed] [Google Scholar]
- 4.Owen MR, DE, Halestrap AP. Evidence that metformin exerts its anti-diabetic effects through inhibition of complex 1 of the mitochondrial respiratory chain. Biochem J. 2000;348(Pt 3):607–614. [PMC free article] [PubMed] [Google Scholar]
- 5.Zhou G, MR, Li Y, Chen Y, Shen X, Fenyk-Melody J, Wu M, Ventre J, Doebber T, Fujii N, Musi N, Hirshman MF, Goodyear LJ, Moller DE. Role of AMP-activated protein kinase in mechanism of metformin action. J Clin Invest. 2001;108:1167–1174. doi: 10.1172/JCI13505. [DOI] [PMC free article] [PubMed] [Google Scholar]
- 6.Shaw RJ, LK, Vasquez D, Koo SH, Bardeesy N, Depinho RA, Montminy M, Cantley LC. The kinase LKB1 mediates glucose homeostasis in liver and therapeutic effects of metformin. Science. 2005;310:1642–1646. doi: 10.1126/science.1120781. [DOI] [PMC free article] [PubMed] [Google Scholar]
- 7.He L, SA, Djedjos S, Miller R, Sun X, Hussain MA, Radovick S, Wondisford FE. Metformin and insulin suppress hepatic gluconeogenesis through phosphorylation of CREB binding protein. Cell. 2009;137:635–646. doi: 10.1016/j.cell.2009.03.016. [DOI] [PMC free article] [PubMed] [Google Scholar]
- 8.Cool B, et al. Identification and characterization of a small molecule AMPK activator that treats key components of type 2 diabetes and the metabolic syndrome. Cell Metab. 2006;3:403–416. doi: 10.1016/j.cmet.2006.05.005. [DOI] [PubMed] [Google Scholar]
- 9.Savage DB, CC, Samuel VT, Liu ZX, Zhang D, Wang A, Zhang XM, Cline GW, Yu XX, Geisler JG, Bhanot S, Monia BP, Shulman GI. Reversal of diet-induced hepatic steatosis and hepatic insulin resistance by antisense oligonucleotide inhibitors of acetyl-CoA carboxylases 1 and 2. J Clin Invest. 2006;116:817–812. doi: 10.1172/JCI27300. [DOI] [PMC free article] [PubMed] [Google Scholar]
- 10.Fullerton MD, GS, Marcinko K, Sikkema S, Pulinilkunnil T, Chen ZP, O’Neill HM, Ford RJ, Palanivel R, O’Brien M, Hardie DG, Macaulay SL, Schertzer JD, Dyck JR, van Denderen BJ, Kemp BE, Steinberg GR. Single phosphorylation sites in Acc1 and Acc2 regulate lipid homeostasis and the insulin-sensitizing effects of metformin. Nat Med. 2013 doi: 10.1038/nm.3372. [DOI] [PMC free article] [PubMed] [Google Scholar]
- 11.Foretz M, HS, Leclerc J, Zarrinpashneh E, Soty M, Mithieux G, Sakamoto K, Andreelli F, Viollet B. Metformin inhibits hepatic gluconeogenesis in mice independently of the LKB1/AMPK pathway via a decrease in hepatic energy state. J Clin Invest. 2010;120:2355–2369. doi: 10.1172/JCI40671. [DOI] [PMC free article] [PubMed] [Google Scholar]
- 12.Miller RA, CQ, Xie J, Foretz M, Viollet B, Birnbaum MJ. Biguanides suppress hepatic glucagon signalling by decreasing production of cyclic AMP. Nature. 2013;494:256–260. doi: 10.1038/nature11808. [DOI] [PMC free article] [PubMed] [Google Scholar]
- 13.Hawley SA, GA, Olsen GS, Hardie DG. The antidiabetic drug metformin activates the AMP-activated protein kinase cascade via an adenine nucleotide-independent mechanism. Diabetes. 2002;51:2420–2425. doi: 10.2337/diabetes.51.8.2420. [DOI] [PubMed] [Google Scholar]
- 14.Yang L, KR, Kasumov T, Zhu SH, Cendrowski AV, David F, Anderson VE, Kelleher JK, Brunengraber H. Metabolomic and mass isotopomer analysis of liver gluconeogenesis and citric acid cycle. I. Interrelation between gluconeogenesis and cataplerosis; formation of methoxamates from aminooxyacetate and ketoacids. J Biol Chem. 2008;283:21978–21987. doi: 10.1074/jbc.M803454200. [DOI] [PMC free article] [PubMed] [Google Scholar]
- 15.Krebs HA, GT The redox state of the nicotinamide-adenine dinucleotides in rat liver homogenates. Biochem J. 1968;108:513–520. doi: 10.1042/bj1080513. [DOI] [PMC free article] [PubMed] [Google Scholar]
- 16.Williamson DH, LP, Krebs HA. The redox state of free nicotinamide-adenine dinucleotide in the cytoplasm and mitochondria of rat liver. Biochem J. 1967;103:514–527. doi: 10.1042/bj1030514. [DOI] [PMC free article] [PubMed] [Google Scholar]
- 17.Bremer J, DE Studies on the active transfer of reducing equivalents into mitochondria via the malate-aspartate shuttle. Biochim Biophys Acta. 1975;376:387–397. doi: 10.1016/0005-2728(75)90161-9. [DOI] [PubMed] [Google Scholar]
- 18.Cederbaum AI, LC, Beattie DS, Rubin E. Characterization of shuttle mechanisms for the transport of reducing equivalents into mitochondria. Arch Biochem Biophys. 1973;158:763–781. doi: 10.1016/0003-9861(73)90571-7. [DOI] [PubMed] [Google Scholar]
- 19.Garrib A, MW Purification and Characterization of Glycerol-3-phosphate Dehydrogenase (Flavin-linked) from Rat Liver Mitochondria. J Biol Chem. 1986;261:8042–8048. [PubMed] [Google Scholar]
- 20.Cole ES, LC, Holohan PD, Fondy TP. Isolation and characterization of flavin-linked glycerol-3-phosphate dehydrogenase from rabbit skeletal muscle mitochondria and comparison with the enzyme from rabbit brain. J Biol Chem. 1978;253:7952–7959. [PubMed] [Google Scholar]
- 21.White HB, 3rd, KN Purification and properties of two types of diphosphopyridine nucleotide-linked glycerol 3-phosphate dehydrogenases from chicken breast muscle and chicken liver. J Biol Chem. 1969;244:6031–6039. [PubMed] [Google Scholar]
- 22.Sistare FD, HR The Interaction between the Cytosolic Pyridine Nucleotide Redox Potential and Gluconeogenesis from Lactate/Pyruvate in Isolated Rat Hepatocytes. J Biol Chem. 1985;260:12748–12753. [PubMed] [Google Scholar]
- 23.Sugano T, SM, Tanaka T, Miyamae Y, Shimada M, Oshino N. Intracellular redox state and stimulation of gluconeogenesis by glucagon and norepinephrine in the perfused rat liver. J Biochem. 1980;87:153–166. doi: 10.1093/oxfordjournals.jbchem.a132721. [DOI] [PubMed] [Google Scholar]
- 24.MacDonald MJ, ML Mouse lacking NAD+-linked glycerol phosphate dehydrogenase has normal pancreatic beta cell function but abnormal metabolite pattern in skeletal muscle. Arch Biochem Biophys. 2000;384:143–153. doi: 10.1006/abbi.2000.2107. [DOI] [PubMed] [Google Scholar]
- 25.Prochazka M, KU, Kozak LP. A glycerol-3-phosphate dehydrogenase null mutant in BALB/cHeA mice. J Biol Chem. 1989;264:4679–4683. [PubMed] [Google Scholar]
- 26.Harding JW, Jr, PE, Copeland ES, White HB., 3rd Role of glycerol 3-phosphate dehydrogenase in glyceride metabolism. Effect of diet on enzyme activities in chicken liver. Biochem J. 1975;146:223–229. doi: 10.1042/bj1460223. [DOI] [PMC free article] [PubMed] [Google Scholar]
- 27.Harding JW, Jr, PE, Morris HP, White HB., 3rd Proportional activities of glycerol kinase and glycerol 3-phosphate dehydrogenase in rat hepatomas. Biochem J. 1975;148:545–550. doi: 10.1042/bj1480545. [DOI] [PMC free article] [PubMed] [Google Scholar]
- 28.Brown LJ, KR, Everett C, Reitman ML, Marshall L, Fahien LA, Kozak LP, MacDonald MJ. Normal thyroid thermogenesis but reduced viability and adiposity in mice lacking the mitochondrial glycerol phosphate dehydrogenase. J Biol Chem. 2002;277:32892–32898. doi: 10.1074/jbc.M202408200. [DOI] [PubMed] [Google Scholar]
- 29.Barberà A, GM, Eto K, Corominola H, Maechler P, Miró O, Cardellach F, Gomis R. A high carbohydrate diet does not induce hyperglycaemia in a mitochondrial glycerol-3-phosphate dehydrogenase-deficient mouse. Diabetologia. 2003;46:1394–1401. doi: 10.1007/s00125-003-1206-5. [DOI] [PubMed] [Google Scholar]
- 30.Colussi T, PD, Boles W, Matsuoka T, Mallett TC, Karplus PA, Claiborne A. Structure of alpha-glycerophosphate oxidase from Streptococcus sp.: a template for the mitochondrial alpha-glycerophosphate dehydrogenase. Biochemistry. 2008;47:965–977. doi: 10.1021/bi701685u. [DOI] [PubMed] [Google Scholar]
- 31.Faupel RP, SH, Tarnowski W, Thiemann V, Weiss C. The problem of tissue sampling from experimental animals with respect to freezing technique, anoxia, stress and narcosis. A new method for sampling rat liver tissue and the physiological values of glycolytic intermediates and related compounds. Arch Biochem Biophys. 1972;148:509–522. doi: 10.1016/0003-9861(72)90170-1. [DOI] [PubMed] [Google Scholar]
- 32.Ayala JE, Samuel VT, Morton GJ, Obici S, Croniger CM, Shulman GIW, DH, McGuinness OP NIH Mouse Metabolic & Consortium PC . Standard operating procedures for describing and performing metabolic tests of glucose homeostasis in mice. Dis Model Mech. 2010;3:525–534. doi: 10.1242/dmm.006239. [DOI] [PMC free article] [PubMed] [Google Scholar]
- 33.Carmignani M, VA, Botta B, Espinal R, De Bonnevaux SC, De Luca C, Botta M, Corelli F, Tafi A, Sacco R, Delle Monache G. Novel hypotensive agents from Verbesina caracasana. 8. Synthesis and pharmacology of (3,4-dimethoxycinnamoyl)-N(1)-agmatine and synthetic analogues. J Med Chem. 2001;44:2950–2958. doi: 10.1021/jm001017v. [DOI] [PubMed] [Google Scholar]


