

SUMMARY
During the nest-founding phase of the bumble bee colony cycle, queens undergo striking changes in maternal care behavior. Early in the founding phase, prior to the emergence of workers in the nest, queens are reproductive and also provision and feed their offspring. However, later in the founding phase, queens reduce their feeding of larvae and become specialized on reproduction. This transition is synchronized with the emergence of workers in the colony, who assume the task of feeding their siblings. Using a social manipulation experiment with the bumble bee Bombus terrestris, we tested the hypothesis that workers regulate the transition from feeding brood to specialization on reproduction in nest-founding bumble bee queens. Consistent with this hypothesis, we found that early-stage nest-founding queens with workers prematurely added to their nests reduce their brood-feeding behavior and increase egg laying, and likewise, late-stage nest-founding queens increase their brood-feeding behavior and decrease egg-laying when workers are removed from their nests. Further, brood-feeding and egg-laying behaviors were negatively correlated. We used Agilent microarrays designed from B. terrestris brain expressed sequenced tags (ESTs) to explore a second hypothesis, that workers alter brain gene expression in nest-founding queens. We found evidence that brain gene expression in nest-founding queens is altered by the presence of workers, with the effect being much stronger in late-stage founding queens. This study provides new insights into how the transition from feeding brood to specialization on reproduction in queen bumble bees is regulated during the nest initiation phase of the colony cycle.
KEY WORDS: genomics, microarrays, social evolution, nest initiation
INTRODUCTION
A common feature of animal societies is social regulation, where individuals regulate the behavior and physiology of other group members (Wilson, 2000). Social regulation serves to promote cohesion between society members, for example it organizes reproductive efforts in cichlid fish (White et al., 2002) and meerkats (O'Riain et al., 2000), and reduces conflict (Ratnieks et al., 2006) and coordinates the labor force (Robinson, 1992) in insect societies.
The eusocial bumble bees (genus Bombus, family Apidae) possess an annual colony cycle wherein each spring, queens emerge from overwintering and initiate new nests (Free and Butler, 1959). As the season progresses, workers emerge in the nest and perform work-related tasks, with the queen performing most reproduction. Various forms of social regulation have been demonstrated in bumble bees at different stages in the colony cycle, including the regulation of circadian rhythmicity in queens by the brood early in colony development (Eban-Rothschild et al., 2011) and after worker emergence, the pheromonal regulation of worker foraging activity (Dornhaus et al., 2003) and the inhibition of worker reproduction by both queens (Alaux et al., 2004) and workers (Bloch, 1999).
For bumble bee queens, one of the most dramatic behavioral and physiological changes occurs during the nest founding-phase of the colony cycle. Early in the nest-founding phase, prior to the emergence of workers in the nest, queens are reproductive but also do all work-related tasks in the nest, such as foraging and progressively feeding their larval offspring. Later in the founding phase, following the emergence of workers, queens significantly decrease their brood-feeding activity and become largely specialized on reproduction (Free and Butler, 1959), as workers take over most brood-feeding activity in the colony. Exploring the changes in maternal care that occur over the bumble bee queen life cycle may provide insights into how maternal traits have changed in the social insects over an evolutionary time scale. These extreme changes in bumble bee queens also make them an excellent system for studying the social regulation and plasticity of behavior and physiology in social insects.
We performed a social manipulation experiment to test the hypothesis that there is social (worker) regulation of the transition from mainly brood feeding to specialization on reproduction in nest-founding bumble bee queens. This hypothesis was based on two previous findings in bumble bees: (1) the transition coincides with the emergence of workers in the colony (Free and Butler, 1959); and (2) workers stimulate egg-laying behavior in nest-founding queens (Gretenkord and Drescher, 1997; Gurel and Gosterit, 2008; Kwon et al., 2006). Based on this hypothesis, we predicted that artificial addition and removal of workers from recently founded nests (Fig. 1) would alter both maternal care and reproductive behaviors in nest-founding queens. More specifically, we predicted that (1) addition of workers to young nests in which workers had not yet emerged (‘early-stage’ nests) would cause a decrease in brood-feeding behavior and an increase in egg-laying behavior in queens; and (2) removal of all workers from nests in which workers were beginning to emerge (‘late-stage’ nests) would cause an increase in brood-feeding behavior and a decrease in egg-laying behavior in queens.
Fig. 1.
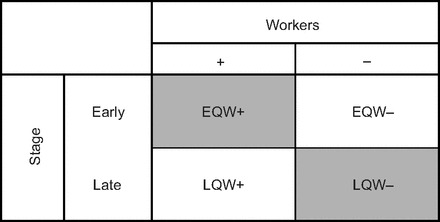
Factorial design of the experiment. For the ‘Workers’ axis, each group of queens either did (+) or did not (−) have workers present in the nest. For the ‘Stage’ axis, each group of queens was either in the earliest stages of the nest-founding period, in which workers had not yet begun to emerge in the nest (‘Early’) or in the later stages of the founding phase, when workers had begun to emerge (‘Late’). EQW+, early-stage queens with workers; EQW−, early-stage queens without workers; LQW−, late-stage queens without workers; LQW+, late-stage queens with workers.
We also explored the hypothesis that changes in brain gene expression are associated with the transition away from brood feeding in nest-founding queens. In many cases of social regulation, social signals, which are initially received and processed by sensory and neural systems, ultimately lead to behavioral changes via changes in brain gene expression (Robinson et al., 2008). To test this hypothesis, we studied patterns of brain gene expression in early- and late-stage founding queens with and without workers (Fig. 1) using an Agilent microarray made specifically for the bumble bee used in this study, Bombus terrestris, which was based on a large-scale brain transcriptomic project (Woodard et al., 2011). Based on previous studies on social regulation in bees (Alaux et al., 2009a; Alaux et al., 2009b; Grozinger et al., 2003), which have shown major effects of the social environment on brain gene expression, we predicted that a large number of genes would be differentially expressed in the brains of founding queens with versus without workers. Such genes may represent components of the transcriptional architecture underlying social regulation of maternal care and reproduction in bumble bee queens. Understanding the ways in which social signals are transduced via transcriptional mechanisms is important because these mechanisms can provide important insights into how sociality evolved at the molecular level (Robinson et al., 2005).
MATERIALS AND METHODS
Bees
Bombus terrestris (Linnaeus 1758) is a well-studied, temperate bumble bee that is commercially managed for pollination services (Velthuis and Van Doorn, 2006). Bees were purchased from Polyam Industries (Kibbutz Yad-Mordechai, Israel) and all experiments were performed in the Bee Research Facility in Givat Ram, the Hebrew University of Jerusalem, Jerusalem, Israel. Forty-seven recently initiated (i.e. eggs present but no larvae) nests were brought into the laboratory and kept under conditions described elsewhere (Geva et al., 2005; Yerushalmi et al., 2006). To synchronize the treatment groups, 22 of the 47 nests were brought to the laboratory and allowed to develop until 2 days after the first workers emerged (~20 days prior to day 1 of the experiment); queens in these nests were ‘late-stage’ founding queens (LQ). Fourteen days later, 25 additional nests were brought into the laboratory and allowed to develop until larvae were present (~5 days prior to day 1 of the experiment) but no workers had yet emerged; queens in these nests were ‘early-stage’ founding queens (EQ).
Social manipulation
For 12 of the 25 EQ nests, callow workers (<24 h old, identified by the lack of yellow pigmentation) were added to simulate the premature emergence of workers (‘EQW+’ group). For the remaining 13 EQ nests, workers were not added and thus these nests were without workers for the duration of the experiment (‘EQW−’ group). For 11 of the 22 LQ nests, any workers that emerged were removed <24 h after their emergence (‘LQW−’ group). For the other 11 LQ nests, any workers that emerged were removed <24 h post-emergence and replaced with callow workers as a sham control (‘LQW+’ group). To maintain the same number of workers in all ‘+W’ nests, the following numbers of workers were added to EQW+ and LQW+ nests on days 1–7: 1, 2, 1, 1, 0, 0, 0; these numbers were based on the average number of workers that emerged in a subset of colonies (data not shown). All callow workers added to nests originated from the same source colonies to control for potential effects of worker genotype.
Observations of maternal care behavior
Forty-two of the 47 nest-founding queens were observed for a single 10 min period on days 3, 5 and 7, for a total of 30 min of observation per nest across the 3 days. The five queens not observed were from the EQW+ (N=2) and EQW− (N=3) groups; these queens were included in the other analyses in this study (colony development and brain gene expression analyses, described below). During each observation period the queens were continuously observed and the occurrence of any brood-feeding event was recorded. Brood feeding is an easily observable, discrete behavioral sequence that lasts ~5–15 s. Larvae are clumped together spatially, and when bees feed the brood, they open and regurgitate food into the larval cells, which can be observed when a bee places her mouthparts into an open cell and her abdomen contracts (Free and Butler, 1959).
Reproductive behavior and colony development
At the end of day 7, all nests were collected and stored at −20°C until nest dissections occurred. The number of eggs in the nest at the end of the experiment was recorded as a proxy for queen reproductive behavior; it is unlikely that any eggs were laid by workers, as the nests were very young and queens are highly effective at policing worker reproduction, even when nests are much older and larger (Free et al., 1969; Duchateau, 1989; Bloch, 1999). The number of larvae and pupae present in the nests at the end of the experiment was also recorded as a measure of colony development.
Statistical analyses of behavior and colony development data
Data on feeding behavior and the number of eggs, larvae and pupae in the nest were analyzed using ANOVA performed in R (R Development Core Team, 2011). Because ANOVA revealed a significant effect of both stage of queen and presence/absence of workers on the number of eggs in the nest, pairwise t-tests (two-tailed) were used to compare the mean number of eggs in nests of the four groups. Additional t-tests (two-tailed) were used to compare the mean number of larvae and pupae in early versus late queen nests, as ANOVA also revealed a significant effect of stage of queen on these stages of brood. To test for an association between maternal care and reproductive behaviors in the queens, pairwise Pearson correlation coefficients were calculated between the total number of feeding events performed across the 3 days of observation and the number of eggs and larvae in the nest, using data from the 42 observed queens.
RNA preparation
At the end of day 7, all queens were collected within 1 h to control for circadian effects on gene expression. The queens were collected directly onto dry ice and their heads were immediately removed, placed in liquid nitrogen, and stored at −80°C to ensure RNA preservation. For brain dissections, whole queen heads were partially lyophilized and dissections were performed over dry ice (Schulz and Robinson, 1999). RNA was isolated from dissected brains using an RNeasy Mini Kit (Qiagen, Valencia, CA, USA) following the kit protocol except that the initial homogenization was performed in a 500 μl microfuge tube using 100 μl extraction buffer.
Microarrays
An Agilent 4×44K B. terrestris brain expressed sequence tag (EST)-based microarray was designed using sequence data obtained from 454/Roche pyrosequencing of B. terrestris mRNA derived primarily from brain tissue (90% and 10% abdomen) (Woodard et al., 2011). Total RNA, 250–1000 ng per sample, was reverse transcribed and linear amplified according to the manufacturer's instructions (Agilent Technologies, Santa Clara, CA, USA). Samples (one per array) were hybridized on the microarray slide and washed according to the Agilent protocol. Slides were scanned using an Axon 4000B scanner and images were analyzed with GENEPIX software (Agilent Technologies). Methods are described in greater detail elsewhere (Alaux et al., 2009b; Sen Sarma et al., 2009). The microarray results from this study can be accessed at the ArrayExpress website (http://www.ebi.ac.uk/arrayexpress/).
Microarray data pre-processing and statistical analyses were carried out in R (R Development Core Team, 2011) using the limma package (Smyth, 2005). Median foreground and median background values from the 47 .gpr files were read into R and any spots manually flagged (−100 values) were given a weight of zero. Background values were ignored because the use of these values to adjust for background fluorescence added more noise to the data, and the background was low and even for all arrays. Expression values were normalized with the quantile method (Smyth and Speed, 2003) then log2 transformed. Coefficient of variation (CV) values were calculated across all 47 samples; the distribution of CV values was strongly bimodal, separating at a value of 0.015 (data not shown), suggesting a subset of oligos with little variation overall and hence no useful information; nearly all of the positive and negative control spots had low CV values as well. All control spots and oligos with CV values <0.015 were removed from subsequent analyses, leaving 36,869 spots out of 45,220.
Because the microarray was designed from EST sequence rather than genomic data, stringent annotation criteria based on orthology to the honey bee (Apis mellifera) genome (Honeybee Genome Sequencing Consortium, 2006) were used to minimize the chances of including data from oligos that did not represent true B. terrestris genes in the subsequent statistical analyses. Apis mellifera orthologs were identified using the basic local alignment search tool (BLAST) to the non-redundant nucleotide database in GenBank; annotated oligos had strongly supported (E-value <0.0001) hits to genes in the Official Honey Bee Gene Set Version 2 (Honeybee Genome Sequencing Consortium, 2006). A total of 9924 oligos (putatively representing 4468 unique A. mellifera genes) met the annotation criteria and were included in subsequent analyses. Results are reported at the level of genes.
Statistical analyses of microarray data
ANOVA
To identify genes associated with the presence of workers and with stage of the queen (early versus late), a 2×2 factorial model (R Development Core Team, 2011) fitted in limma (Smyth, 2005) was used to compare expression values across the four groups, taking into account which slide the array was on. Using ANOVA, the main effects of presence of workers and stage of the queen and the interaction term were estimated, as well as mean expression levels for the four groups. Multiple-test adjustment was performed using the false discovery rate (FDR) method (Benjamini and Hochberg, 1995) and probes with FDR P<0.05 were considered significant.
Pairwise tests
Four pairwise tests were performed to identify genes differentially expressed in the following contrasts: (i) EQW+ versus EQW−, (ii) LQW+ versus LQW−, (iii) LQW+ versus EQW+ and (iv) LQW− versus EQW−. Here also, multiple test adjustment was done separately for each contrast using the FDR method (Benjamini and Hochberg, 1995) and probes with FDR P<0.05 were considered significant.
Rank product tests
An additional, non-parametric analysis based on the rank product test was performed using the RankProd package (Breitling et al., 2004; Hong et al., 2006). The rank product test ranks oligos in each replicate according to expression value, with the underlying assumption that oligos that change expression level will change in rank. This additional analysis was used because of the small number of significant oligos in the ANOVA and pairwise tests, and also because within-group variation in expression values was high for many oligos. A rank sum analysis, which compares the sums of the ranks between two groups, was used because it requires greater consistency between replicates; the large numbers of replicates within the four groups (N=11–13) led to spurious results using the more traditional rank product analysis. To correct for the effect of which slide the array was on, all normalized expression values from all treatment groups were batch-corrected using the removeBatchEffect function.
RankProd tests upregulation and downregulation separately and corrects for multiple hypothesis testing using a permutation-based approach (N=100) to calculate the percentage of false-positives (PFP), which is an estimate of the false discovery rate (Hong et al., 2006). Therefore, the four pairwise comparisons between treatment groups yielded eight significant (PFP<0.05) rank product test gene lists: (i) upregulated in EQW+ versus EQW−; (ii) downregulated in EQW+ versus EQW−; (iii) upregulated in LQW+ versus LQW−; (iv) downregulated in LQW+ versus LQW−; (v) upregulated in LQW+ versus EQW+; (vi) downregulated in LQW+ versus EQW+; (vii) upregulated in LQW− versus EQW−; and (viii) downregulated in LQW− versus EQW−.
Technical validation of microarray results
Real-time, quantitative reverse transcription polymerase chain reaction (qRT-PCR) was performed on all samples using an ABI Prism 7900 sequence detector and the SYBR green detection method (Applied Biosystems, Foster City, CA, USA). To validate microarray results, qRT-PCR was performed using primers designed for a subset (N=6) of genes showing differential expression between groups using microarrays (supplementary material Figs S1–S6) and a subset (N=2) of genes that did not show differential expression between groups using microarrays (supplementary material Figs S7, S8). All samples used for microrrays were used for qRT-PCR (N=45). As a loading control, qRT-PCR was also performed using primers for exogenous root cap protein 1 (rcp1), which was added to RNA prior to cDNA synthesis (supplementary material Fig. S9). qRT-PCR was also performed using primers designed for the endogenous housekeeping gene S8, whose expression values did not vary in the microarray experiment; these data were used to normalize qRT-PCR expression data for experimental genes (supplementary material Fig. S10). Overall, the majority of individual gene qRT-PCR results were consistent with microarray results; however, others were not consistent. Additional details are provided in supplementary material Figs S1–S10 and Tables S1 and S2.
Associations between brain gene expression and behavior
Using data from the 42 observed queens, Pearson correlation coefficients were calculated between the normalized expression values for all 9924 annotated oligos on the microarray and the total number of brood-feeding events observed on day 7, as well as between expression values and the number of eggs in the nest. Because no genes were significantly correlated with behavioral data at FDR P<0.05, results reported for this test are significant at an uncorrected P<0.001.
Functional analysis of gene lists
Gene ontology (GO) enrichment analysis was performed on all gene lists of sufficient size (more than five genes) using the GO functional annotation tool (GOFat level) on the database for annotation, visualization and integrated discovery (DAVID) website (Huang et al., 2009). For a more direct comparison to the rank product test gene lists, each of the four pairwise test gene lists was separated into upregulated and downregulated lists for GO enrichment analysis. All gene lists were transformed into lists of Drosophila melanogaster orthologs using a previously published A. mellifera–D. melanogaster ortholog list (Honeybee Genome Sequencing Consortium, 2006). Results reported are ‘biological process’ and ‘molecular function’ terms enriched within the lists of D. melanogaster orthologs at an uncorrected P<0.05, with terms with fewer than five genes excluded. For the background list used for all tests of enrichment, D. melanogaster orthologs (N=3369) were identified for all 9924 annotated probes on the B. terrestris microarray.
RESULTS
Effect of treatment on brood-feeding behavior
Queens with workers in their nests (EQW+, LQW+) fed their brood significantly fewer times than queens without workers (EQW−, LQW−) (Fig. 2A). Differences in brood-feeding behavior between queens of the same stage with versus without workers could not be attributed to differences in the number of larvae in the nests (Fig. 3A). The stage of the queen had no effect on the amount of brood-feeding performed, despite the fact that LQ nests had nearly four times the number of larvae as EQ nests (P<0.001) (Fig. 3A). The number of pupae did not differ between EQW+ and EQW− nests (P=0.7); however, there were more pupae in LQW+ nests relative to LQW− nests (P<0.05) (Fig. 3B), which may reflect an influence of workers on developmental rates of the brood, specifically in the later stages of development.
Fig. 2.
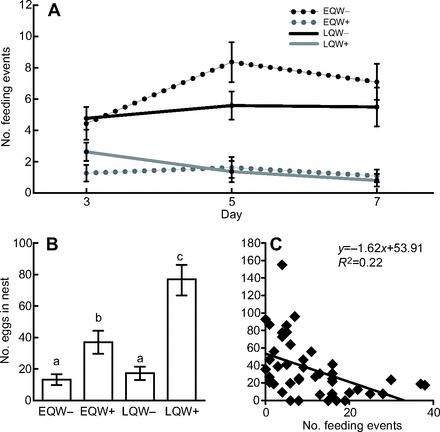
Effect of worker number on queen behavior. (A) Effect of manipulating worker number on brood-feeding behavior; x-axis, day of the experiment; y-axis, total number of brood-feeding events observed per day. Values are group means ± s.e.m.; 3-way ANOVA with stage of queen (early versus late), workers (+/−) and day (3,5,7) as factors: Pworkers(d.f.=1)<0.0001, Pworkers×day(d.f.=1)<0.05, other comparisons N.S. (B) Effect of manipulating worker number on queen egg-laying behavior; x-axis, group; y-axis, number of eggs in nests on day 7. Values shown are group means ± s.e.m.; letters represent results of post hoc pairwise t-tests; 2-way ANOVA with stage of queen and workers as factors: Pstage(d.f.=1)<0.01, Pworkers(d.f.=1)<0.001, Pstage×workers(d.f.=1)<0.01. (C) Association between brood-feeding and reproductive behavior; x-axis, total number of brood-feeding events observed (summed across all days); y-axis, number of eggs in nests on day 7.
Fig. 3.
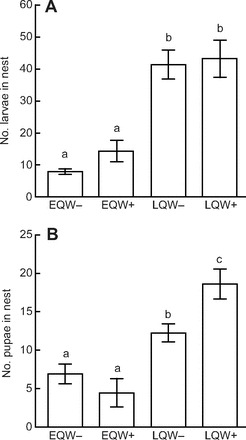
Effect of social manipulation on colony development. (A) Effect of treatment on the number of larvae in nests; x-axis, group; y-axis, number of larvae in nests on day 7; 2-way ANOVA with stage of queen and workers as factors: Pstage(d.f.=1)<0.0001, other comparisons N.S. (B) Effect of treatment on number of pupae in nests; x-axis, group; y-axis, number of pupae in nests on day 7; 2-way ANOVA with stage of queen and workers as factors: Pstage(d.f.=1)<0.0001, Pstage×workers(d.f.=1)<0.01. Values shown in A and B are group means ± s.e.m.; letters represent results of pairwise t-tests.
Effect of workers on queen egg laying
Artificial manipulation of the number of workers also had a strong effect on egg laying in nest-founding queens (Fig. 2B). EQW+ nests had more than three times the number of eggs as EQW− nests (P<0.01). Likewise, LQW+ nests had more than four times the number of eggs as LQW− nests (P<0.001). LQW− and EQW− nests had a similar number of eggs (P=0.3), whereas LQW+ nests had more eggs than EQW+ nests (P<0.05).
Association between feeding and egg laying
Across the 42 observed queens, there was a significant negative correlation (P=0.002; r=−0.47) between the total number of brood-feeding events performed across all 3 days of observations and the number of eggs in the nest (Fig. 2C). The number of eggs in the nest and total amount of brood feeding were not correlated within any of the four groups. There was no significant correlation between the total number of brood-feeding events performed and the number of larvae in the nest (P=0.5), or between the number of larvae and the number of eggs in the nest (P=0.3).
Gene expression: ANOVA, pairwise tests and rank product tests
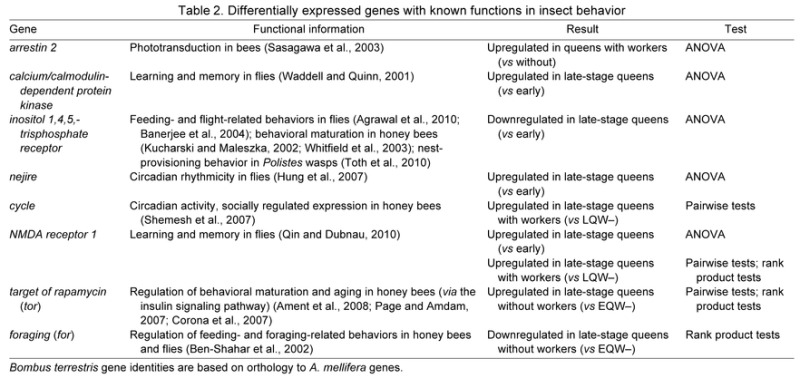
Table 1 shows the numbers of oligos and putative orthologous genes in A. mellifera and D. melanogaster that were significantly differentially expressed between groups using ANOVA, pairwise tests, and rank product tests. A subset of genes differentially expressed between groups that have previously been identified as important in insect behavior are highlighted in Table 2. Across all tests, not all gene list sizes were large enough for GO analysis; for the lists of adequate size, the enrichment results are listed in supplementary material Table S1. A direct comparison of the genes significant for the pairwise and rank product tests, which performed the same group comparisons, is shown in supplementary material Fig. S11.
Table 1.
Comparison of gene list sizes from ANOVA, pairwise tests, and rank product tests of differential brain gene expression
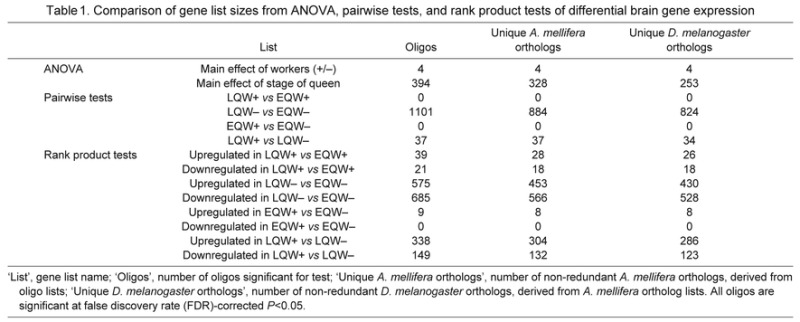
Table 2.
Differentially expressed genes with known functions in insect behavior
Associations between brain gene expression and behavior
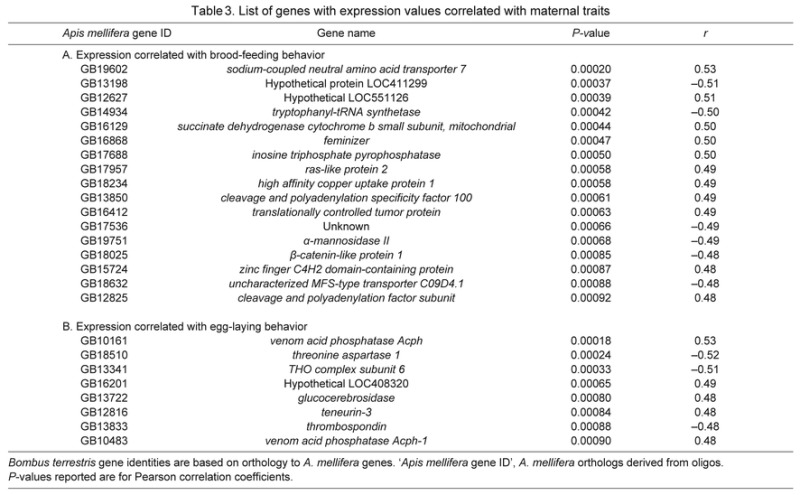
Across the 42 observed queens, 17 genes had expression levels that were significantly correlated with the total number of brood-feeding events performed on day 7 and eight genes had levels of expression significantly correlated with the number of eggs in the nest (Table 3).
Table 3.
List of genes with expression values correlated with maternal traits
DISCUSSION
We used a social manipulation experiment to provide evidence that workers socially regulate queen maternal traits during the nest initiation phase of the bumble bee B. terrestris. The transition from feeding their brood to specialization on reproduction with little brood feeding in nest-founding queens appears to be highly plastic in both directions. Depending on social conditions, queens can increase brood feeding and decrease egg laying beyond the point when workers emerge in the nest and, likewise, queens can decrease brood feeding and increase egg laying prior to the natural emergence of workers in the nest. Two other major transitions in the bumble bee queen life cycle also appear to be socially regulated by workers: the ‘switch point’, where queens switch from laying diploid (i.e. female-destined) to haploid (i.e. male-destined) eggs, and later on the ‘competition point’, which is typically followed by a dramatic increase in queen–worker conflict in the nest (Alaux et al., 2005; Bloch, 1999).
Despite exhibiting considerable behavioral plasticity, there appear to be limits to the amount of brood feeding and reproduction that queens can perform. Although the nests of late-stage founding queens without workers had far more larvae than nests of early-stage queens without workers, queens in these nests performed similar amounts of brood feeding, suggesting that a maximum rate of brood feeding may have been reached. Additionally, the negative association between brood feeding and reproduction across queens in all four groups suggests that a trade-off may exist, perhaps due to constraints stemming from physiological, pleiotropic or other connections between the two behaviors.
Surprisingly, despite the strong effect of treatment on behavior, the number of genes associated with the presence of workers was relatively small compared with the findings of other studies on the social regulation of gene expression, many of which used similar methods to measure expression (Alaux et al., 2009a; Alaux et al., 2009b; Grozinger et al., 2003; Cummings et al., 2008; Replogle et al., 2008). In addition, the effect of workers on queen brain gene expression was highly dependent on the stage of the queen. Far more genes were differentially expressed between late-stage queens that varied in worker number relative to the early-stage queens. Given that worker loss occurs in the wild and is likely detrimental for nests, perhaps bumble bee queens have evolved the ability to respond to worker loss in a way that involves changes in gene expression. Another possibility is that quantitative changes in behavior involve changes in gene expression to a lesser extent than do changes in behavioral state (e.g. the nurse to forager transition in honey bees), which involves a more complete change in behavioral repertoire. Alternatively, the unnatural, premature addition of workers to early-stage nests may have precipitated a more ‘opportunistic’ response by queens in these nests. An opportunistic response may not have required changes in brain gene expression, or may have involved expression changes that were not detectable at the time point that we sampled (Robinson et al., 2008). In cichlid fish, dramatic behavioral changes that occur in response to changes in social environment precede detectable changes in gene expression (Burmeister et al., 2005), suggesting that gene expression changes are not necessary to initiate behavioral responses in this system.
The gene cycle is a strong candidate for future studies on the molecular basis of social regulation of queen maternal traits. cycle, which is a molecular component of the circadian clock, was differentially expressed between late-stage queens with versus without workers. This finding suggests that workers may alter queen behavior via changes in circadian gene expression. A previous study on B. terrestris (Eban-Rothschild et al., 2011) found that rhythmicity in nest-founding queens is influenced by social environment, although this study manipulated developing brood in the colony rather than worker number. The influences on circadian rhythm in locomotor activity previously found (Eban Rothschild et al., 2011) and on cycle expression in the current study may be mediated by changes in maternal or reproductive physiology that are associated with oogenesis or brood care.
In contrast to the small number of genes associated with the presence of workers, many genes were associated with stage of the queen. In terms of absolute time, the difference between early- and late-stage founding queens in the experiment was small (on the order of weeks) relative to their lifespan (Free and Butler, 1959). Regardless, queens may undergo important internal developmental changes during this critical period in the life cycle, which occur irrespective of the social environment or their brood-feeding and egg-laying behavior. The finding that genes involved in circadian rhythm, learning and memory, and aging were differentially expressed between early- and late-stage queens is consistent with the idea that intrinsic developmental changes may be occurring in association with gene transcriptional changes during this transitional period in the queen life cycle.
Although we have attributed the differences in queen behavior and gene expression in this experiment to the social effect of workers, social signals originating from the brood may have also influenced these traits, as the number of eggs and pupae differed between nests with and without workers. Previous studies in bumble bees suggest that pupae do influence egg-laying behavior in queens (Gretenkord and Drescher, 1997; Gurel and Gosterit, 2008; Kwon et al., 2006). However, the number of larvae in the nests of queens of the same stage did not differ in our study, suggesting that this factor did not influence differences in behavior or gene expression between queens of the same stage.
A small number of genes had levels of expression that were correlated with brood-feeding or egg-laying behavior across all queens in the experiment. Previous studies in fish (Trainor and Hofmann, 2007; Sanogo et al., 2012) and monkeys (Sabatini et al., 2007) have demonstrated correlations between social behaviors and gene expression in brain tissue. The set of genes with levels of expression correlated with behavior in this experiment includes the gene feminizer, which is involved in sex determination, as well as genes involved in glycolipid metabolism and putative zinc finger proteins. These genes are an excellent set of candidates for future studies on the molecular regulation of maternal and reproductive behaviors in bumble bees.
Understanding the behavioral and molecular bases of the transition from the solitary to eusocial phase has important implications in both evolutionary and conservation contexts. With wild bumble bee populations in decline (Cameron et al., 2011), understanding the transition from brood feeding to specialization on reproduction in nest-founding queens may be important for predicting how bumble bees can respond to environmental changes. This includes understanding how the transition is regulated and the limits of behavioral plasticity in queens of different ages. Although queens in this study responded to changes in social environment, the absence of workers was associated with a significant decline in queen reproductive output, suggesting that maintaining a substantial worker population is important for the viability of young colonies. Additionally, the results of this study suggest that artificially adding workers to young nests may be a valuable strategy for minimizing the loss of colonies reared for pollination, a finding that is consistent with previous studies (Gretenkord and Drescher, 1997; Gurel and Gosterit, 2008; Kwon et al., 2006).
The results of this study may also provide insights into how complex sociality evolved in insects. In bee lineages with a more highly organized division of labor (e.g. stingless bees and honey bees), queens do not undergo a life stage in which they found nests as solitary individuals. However, it is possible, and perhaps likely (Cardinal and Danforth, 2011), that such a life history stage was present at some point in the evolutionary history of these ‘highly’ eusocial lineages. As such, extant primitively eusocial species can serve as models for exploring the evolutionary transition from solitary to eusocial in bees. For example, molecular mechanisms involved in transitioning from the ‘solitary-like’ nest-founding stage to specialization on reproduction in bumble bee queens may also have played a role in the evolutionary transition from a solitary to a eusocial lifestyle in this lineage. The genes identified in this study may be used for direct comparisons between eusocial and non-eusocial insects to explore whether, at the molecular level (Robinson et al., 2005), there were shared routes to eusociality across disparate lineages.
Supplementary Material
ACKNOWLEDGEMENTS
We thank Y. Gruber and M. Tamarkin for assistance with behavioral observations; H. Sphigler for input on experimental design; M. Cohen for technical assistance; and members of the Bloch laboratory for input on experimental design. Thanks to M. Band and J. Drnevich at the Keck Center for Bioinformatics, University of Illinois at Urbana-Champaign; Yad Mordechai for bees; K. Varala, M. E. Hudson and A. Venkat for bioinformatic assistance; and S. A. Cameron, M. E. Hudson and H. M. Robertson for comments on the manuscript.
LIST OF SYMBOLS AND ABBREVIATIONS
- EQW−
early-stage founding queens without workers
- EQW+
early-stage founding queens with workers
- EST
expressed sequence tag
- FDR
false discovery rate
- GO
gene ontology
- LQW−
late-stage founding queens without workers
- LQW+
late-stage founding queens with workers
FOOTNOTES
Supplementary material available online at http://jeb.biologists.org/cgi/content/full/216/18/3474/DC1
COMPETING INTERESTS
No competing interests declared.
FUNDING
This study was supported by 454 Life Sciences (Roche Diagnostics Corporation) via the Roche 1GB contest; the National Science Foundation [grant number DEB07-43154 to G.E.R.]; the National Institutes of Health–University of Illinois Sensory Neuroscience Training Grant [grant number PHS2T32DC006612 to A. Feng]; and the US-Israel Binational Agricultural Research and Development (BARD) fund (IS-4418-11 to G.B., G.E.R. and M.R.B.). Deposited in PMC for release after 12 months.
REFERENCES
- Agrawal N., Venkiteswaran G., Sadaf S., Padmanabhan N., Banerjee S., Hasan G. (2010). Inositol 1,4,5-trisphosphate receptor and dSTIM function in Drosophila insulin-producing neurons regulates systemic intracellular calcium homeostasis and flight. J. Neurosci. 30, 1301-1313 [DOI] [PMC free article] [PubMed] [Google Scholar]
- Alaux C., Jaisson P., Hefetz A. (2004). Queen influence on worker reproduction in bumblebees (Bombus terrestris) colonies. Insectes Soc. 51, 287-293 [Google Scholar]
- Alaux C., Jaisson P., Hefetz A. (2005). Reproductive decision-making in semelparous colonies of the bumblebee Bombus terrestris. Behav. Ecol. Sociobiol. 59, 270-277 [Google Scholar]
- Alaux C., Le Conte Y., Adams H. A., Rodriguez-Zas S. L., Grozinger C. M., Sinha S., Robinson G. E. (2009a). Regulation of brain gene expression in honey bees by brood pheromone. Genes Brain Behav. 8, 309-319 [DOI] [PubMed] [Google Scholar]
- Alaux C., Sinha S., Hasadsri L., Hunt G. J., Guzmán-Novoa E., DeGrandi-Hoffman G., Uribe-Rubio J. L., Southey B. R., Rodriguez-Zas S. L., Robinson G. E. (2009b). Honey bee aggression supports a link between gene regulation and behavioral evolution. Proc. Natl. Acad. Sci. USA 106, 15400-15405 [DOI] [PMC free article] [PubMed] [Google Scholar]
- Ament S. A., Corona M., Pollock H. S., Robinson G. E. (2008). Insulin signaling is involved in the regulation of worker division of labor in honey bee colonies. Proc. Natl. Acad. Sci. USA 105, 4226-4231 [DOI] [PMC free article] [PubMed] [Google Scholar]
- Banerjee S., Lee J., Venkatesh K., Wu C. F., Hasan G. (2004). Loss of flight and associated neuronal rhythmicity in inositol 1,4,5-trisphosphate receptor mutants of Drosophila. J. Neurosci. 24, 7869-7878 [DOI] [PMC free article] [PubMed] [Google Scholar]
- Ben-Shahar Y., Robichon A., Sokolowski M. B., Robinson G. E. (2002). Influence of gene action across different time scales on behavior. Science 296, 741-744 [DOI] [PubMed] [Google Scholar]
- Benjamini Y., Hochberg Y. (1995). Controlling the false discovery rate: a practical and powerful approach to multiple testing. J. R. Stat. Soc. Series B Stat. Methodol. 57, 289-300 [Google Scholar]
- Bloch G. (1999). Regulation of queen-worker conflict in bumble-bee (Bombus terrestris) colonies. Proc. Biol. Sci. 266, 2465-2469 [DOI] [PMC free article] [PubMed] [Google Scholar]
- Breitling R., Armengaud P., Amtmann A., Herzyk P. (2004). Rank products: a simple, yet powerful, new method to detect differentially regulated genes in replicated microarray experiments. FEBS Lett. 573, 83-92 [DOI] [PubMed] [Google Scholar]
- Burmeister S. S., Jarvis E. D., Fernald R. D. (2005). Rapid behavioral and genomic responses to social opportunity. PLoS Biol. 3, e363 [DOI] [PMC free article] [PubMed] [Google Scholar]
- Cameron S. A., Lozier J. D., Strange J. P., Koch J. B., Cordes N., Solter L. F., Griswold T. L. (2011). Patterns of widespread decline in North American bumble bees. Proc. Natl. Acad. Sci. USA 108, 662-667 [DOI] [PMC free article] [PubMed] [Google Scholar]
- Cardinal S., Danforth B. N. (2011). The antiquity and evolutionary history of social behavior in bees. PLoS ONE 6, e21086 [DOI] [PMC free article] [PubMed] [Google Scholar]
- Corona M., Velarde R. A., Remolina S., Moran-Lauter A., Wang Y., Hughes K. A., Robinson G. E. (2007). Vitellogenin, juvenile hormone, insulin signaling, and queen honey bee longevity. Proc. Natl. Acad. Sci. USA 104, 7128-7133 [DOI] [PMC free article] [PubMed] [Google Scholar]
- Cummings M. E., Larkins-Ford J., Reilly C. R. L., Wong R. Y., Ramsey M., Hofmann H. A. (2008). Sexual and social stimuli elicit rapid and contrasting genomic responses. Proc. Biol. Sci. 275, 393-402 [DOI] [PMC free article] [PubMed] [Google Scholar]
- Dornhaus A., Brockmann A., Chittka L. (2003). Bumble bees alert to food with pheromone from tergal gland. J. Comp. Physiol. A 189, 47-51 [DOI] [PubMed] [Google Scholar]
- Duchateau M. J. (1989). Agonistic behaviour in colonies of the bumblebee Bombus terrestris. J. Ethol. 7, 141-151 [Google Scholar]
- Eban-Rothschild A., Belluci S., Bloch G. (2011). Maternity-related plasticity in circadian rhythms of bumble-bee queens. Proc. Biol. Sci. 278, 3510-3516 [DOI] [PMC free article] [PubMed] [Google Scholar]
- Free J. B., Butler C. G. (1959). Bumblebees. London: Collins; [Google Scholar]
- Free J. B., Weinberg I., Whiten A. (1969). The egg-eating behaviour of Bombus lapidarius L. Behaviour 35, 313-317 [Google Scholar]
- Geva S., Hartfelder K., Bloch G. (2005). Reproductive division of labor, dominance, and ecdysteroid levels in hemolymph and ovary of the bumble bee Bombus terrestris. J. Insect Physiol. 51, 811-823 [DOI] [PubMed] [Google Scholar]
- Gretenkord C., Drescher W. (1997). Successful colony foundation and development of experimentally hibernated Bombus terrestris queens depending on different starting methods. Acta Hortic. 437, 271-276 [Google Scholar]
- Grozinger C. M., Sharabash N. M., Whitfield C. W., Robinson G. E. (2003). Pheromone-mediated gene expression in the honey bee brain. Proc. Natl. Acad. Sci. USA 100 Suppl. 2, 14519-14525 [DOI] [PMC free article] [PubMed] [Google Scholar]
- Gurel F., Gosterit A. (2008). Effects of different stimulation methods on colony initiation and development of Bombus terrestris L. (Hymenoptera: Apidae) queens. Appl. Entomol. Zool. (Jpn.) 43, 113-117 [Google Scholar]
- Honeybee Genome Sequencing Consortium (2006). Insights into social insects from the genome of the honeybee Apis mellifera. Nature 443, 931-949 [DOI] [PMC free article] [PubMed] [Google Scholar]
- Hong F., Breitling R., McEntee C. W., Wittner B. S., Nemhauser J. L., Chory J. (2006). RankProd: a bioconductor package for detecting differentially expressed genes in meta-analysis. Bioinformatics 22, 2825-2827 [DOI] [PubMed] [Google Scholar]
- Huang W., Sherman B. T., Lempicki R. A. (2009). Systematic and integrative analysis of large gene lists using DAVID bioinformatics resources. Nat. Protoc. 4, 44-57 [DOI] [PubMed] [Google Scholar]
- Hung H. C., Maurer C., Kay S. A., Weber F. (2007). Circadian transcription depends on limiting amounts of the transcription co-activator nejire/CBP. J. Biol. Chem. 282, 31349-31357 [DOI] [PubMed] [Google Scholar]
- Kucharski R., Maleszka R. (2002). Molecular profiling of behavioural development: differential expression of mRNAs for inositol 1,4,5-trisphosphate 3-kinase isoforms in naive and experienced honeybees (Apis mellifera). Brain Res. Mol. Brain Res. 99, 92-101 [DOI] [PubMed] [Google Scholar]
- Kwon Y. J., Than K. K., Suh S. J. (2006). New method to stimulate the onset of Bombus terrestris (Hymenoptera: Apidae) rearing: using worker helpers in the presence of frozen pupae. Entomol. Res. 36, 202-207 [Google Scholar]
- O'Riain M. J., Bennett N. C., Brotherton P. N. M., McIlrath G., Clutton-Brock T. H. (2000). Reproductive suppression and inbreeding avoidance in wild populations of co operatively breeding meerkats (Suricata suricatta). Behav. Ecol. Sociobiol. 48, 471-477 [Google Scholar]
- Page R. E., Jr, Amdam G. V. (2007). The making of a social insect: developmental architectures of social design. Bioessays 29, 334-343 [DOI] [PMC free article] [PubMed] [Google Scholar]
- Qin H., Dubnau J. (2010). Genetic disruptions of Drosophila Pavlovian learning leave extinction learning intact. Genes Brain Behav. 9, 203-212 [DOI] [PMC free article] [PubMed] [Google Scholar]
- R Development Core Team (2011). R: A language and environment for statistical computing. R Foundation for Statistical Computing, Vienna, Austria: ISBN 3-900051-07-0, URL http://www.R-project.org/ [Google Scholar]
- Ratnieks F. L. W., Foster K. R., Wenseleers T. (2006). Conflict resolution in insect societies. Annu. Rev. Entomol. 51, 581-608 [DOI] [PubMed] [Google Scholar]
- Replogle K., Arnold A. P., Ball G. F., Band M., Bensch S., Brenowitz E. A., Dong S., Drnevich J., Ferris M., George J. M., et al. (2008). The songbird neurogenomics (SoNG) initiative: community-based tools and strategies for study of brain gene function and evolution. BMC Genomics 9, 131 [DOI] [PMC free article] [PubMed] [Google Scholar]
- Robinson G. E. (1992). Regulation of division of labor in insect societies. Annu. Rev. Entomol. 37, 637-665 [DOI] [PubMed] [Google Scholar]
- Robinson G. E., Grozinger C. M., Whitfield C. W. (2005). Sociogenomics: social life in molecular terms. Nat. Rev. Genet. 6, 257-270 [DOI] [PubMed] [Google Scholar]
- Robinson G. E., Fernald R. D., Clayton D. F. (2008). Genes and social behavior. Science 322, 896-900 [DOI] [PMC free article] [PubMed] [Google Scholar]
- Sabatini M. J., Ebert P., Lewis D. A., Levitt P., Cameron J. L., Mirnics K. (2007). Amygdala gene expression correlates of social behavior in monkeys experiencing maternal separation. J. Neurosci. 27, 3295-3304 [DOI] [PMC free article] [PubMed] [Google Scholar]
- Sanogo Y. O., Band M. A., Blatti C., Sinha S., Bell A. M. (2012). Transcriptional regulation of brain gene expression in response to a territorial intrusion. Proc. Biol. Sci. 279, 4929-4938 [DOI] [PMC free article] [PubMed] [Google Scholar]
- Sasagawa H., Narita R., Kitagawa Y., Kadowaki T. (2003). The expression of genes encoding visual components is regulated by a circadian clock, light environment and age in the honeybee (Apis mellifera). Eur. J. Neurosci. 17, 963-970 [DOI] [PubMed] [Google Scholar]
- Schulz D. J., Robinson G. E. (1999). Biogenic amines and division of labor in honey bee colonies: behaviorally related changes in the antennal lobes and age-related changes in the mushroom bodies. J. Comp. Physiol. A 184, 481-488 [DOI] [PubMed] [Google Scholar]
- Sen Sarma M., Rodriguez-Zas S. L., Hong F., Zhong S., Robinson G. E. (2009). Transcriptomic profiling of central nervous system regions in three species of honey bee during dance communication behavior. PLoS ONE 4, e6408 [DOI] [PMC free article] [PubMed] [Google Scholar]
- Shemesh Y., Cohen M., Bloch G. (2007). Natural plasticity in circadian rhythms is mediated by reorganization in the molecular clockwork in honeybees. FASEB J. 21, 2304-2311 [DOI] [PubMed] [Google Scholar]
- Smyth G. K. (2005). Limma: linear models for microarray data. In Bioinformatics and Computational Biology Solutions Using R and Bioconductor (ed. Gentleman R. Carey V. Dudoit S. Irizarry R. Huber W W.), pp. 397-420 New York, NY: Springer; [Google Scholar]
- Smyth G. K., Speed T. P. (2003). Normalization of cDNA microarray data. Methods 31, 265-273 [DOI] [PubMed] [Google Scholar]
- Toth A. L., Varala K., Henshaw M. T., Rodriguez-Zas S. L., Hudson M. E., Robinson G. E. (2010). Brain transcriptomic analysis in paper wasps identifies genes associated with behaviour across social insect lineages. Proc. Biol. Sci. 277, 2139-2148 [DOI] [PMC free article] [PubMed] [Google Scholar]
- Trainor B. C., Hofmann H. A. (2007). Somatostatin and somatostatin receptor gene expression in dominant and subordinate males of an African cichlid fish. Behav. Brain Res. 179, 314-320 [DOI] [PMC free article] [PubMed] [Google Scholar]
- Velthuis H. H. W., Van Doorn A. (2006). A century of advances in bumblebee domestication and the economic and environmental aspects of its commercialization for pollination. Apidologie (Celle) 37, 421-451 [Google Scholar]
- Waddell S., Quinn W. G. (2001). Flies, genes, and learning. Annu. Rev. Neurosci. 24, 1283-1309 [DOI] [PubMed] [Google Scholar]
- White S. A., Nguyen T., Fernald R. D. (2002). Social regulation of gonadotropin-releasing hormone. J. Exp. Biol. 205, 2567-2581 [DOI] [PubMed] [Google Scholar]
- Whitfield C. W., Cziko A. M., Robinson G. E. (2003). Gene expression profiles in the brain predict behavior in individual honey bees. Science 302, 296-299 [DOI] [PubMed] [Google Scholar]
- Wilson E. O. (2000). Sociobiology: The New Synthesis. Harvard, MA: Belknap Press; [Google Scholar]
- Woodard S. H., Fischman B. J., Venkat A., Hudson M. E., Varala K., Cameron S. A., Clark A. G., Robinson G. E. (2011). Genes involved in convergent evolution of eusociality in bees. Proc. Natl. Acad. Sci. USA 108, 7472-7477 [DOI] [PMC free article] [PubMed] [Google Scholar]
- Yerushalmi S., Bodenhaimer S., Bloch G. (2006). Developmentally determined attenuation in circadian rhythms links chronobiology to social organization in bees. J. Exp. Biol. 209, 1044-1051 [DOI] [PubMed] [Google Scholar]
Associated Data
This section collects any data citations, data availability statements, or supplementary materials included in this article.