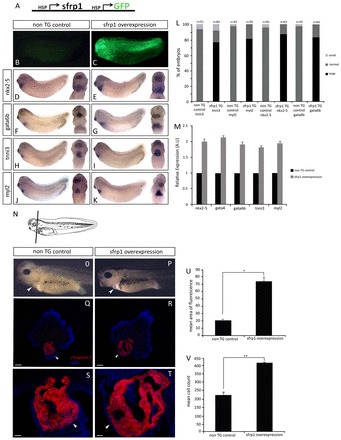
Fig. 4.

Gain-of-function experiments show that sfrp1 promotes myocardium differentiation. (A) Transgene construct containing sfrp1 and GFP under the control of heat shock promoters allowing for stage-specific induction of overexpression. (B,C) Identification of non-transgenic control (B) and GFP-positive transgenic (C) embryos. (D-K) WISH analysis at stage 32 on non-transgenic control and on sfrp1 transgene-expressing embryos (induced to express transgenes at stage 22). Note the increase in gene expression of cardiogenic transcription factors (E,G) and myocardial differentiation markers (I,K) compared with controls (D,F,H,J), indicating an increase in myocardial tissue. (L) Quantification of WISH analysis showing an increase in cardiac gene expression in sfrp1-overexpressing transgenic (TG) embryos compared with non-transgenic controls. (M) qPCR analysis at stage 32 shows an increase in expression of both cardiogenic transcription factor and myocardial differentiation marker genes in sfrp1-overexpressing transgenic embryos relative to their normal expression in non-transgenic controls. (N) Schematic of a stage 41 embryo indicating the orientation of sections in Q-T. (O,P) Phenotype of non-transgenic control embryo (O) and embryo with stage-specific sfrp1 overexpression (P). Note the increase in heart size and loss of pericardial cavity space (arrowheads) in sfrp1 transgenic embryos compared with control. (Q-T) Differentiation of the heart muscle was analysed at stage 41 by cTnT immunofluorescence (red), with DAPI counterstaining (blue). Non-transgenic control embryos show normal cTnT expression confirming normal myocardial development (Q,S). sfrp1-expressing transgenic embryos show increased expression of cTnT indicating more myocardial tissue (R,T). Note loss of the pericardial cavity due to the increase in myocardial tissue in sfrp1 transgenic embryos (arrowheads). (U) Quantification showing the significant increase in the amount of myocardial tissue as represented by cTnT expression in sfrp1 transgenic embryos (n=4, *P<0.05). (V) Mean cell counts showing a significant increase in cell number in embryos overexpressing sfrp1 compared with controls, whereas cell size appeared unaffected (n=3, **P<0.01). Data are mean ± s.e.m. Scale bars: 50 μm in Q,R; 200 μm in S,T.
